

Abstract
The Wnt signaling pathway can be grouped into two classes, the β‐catenin‐dependent and β‐catenin‐independent pathways. Wnt5a signaling through a β‐catenin‐independent pathway promotes microtubule (MT) remodeling during cell‐substrate adhesion, cell migration, and planar cell polarity formation. Although Wnt5a signaling and MT remodeling are known to form an interdependent regulatory loop, the underlying mechanism remains unknown. Here we show that in HeLa cells, the paralogous MT‐associated proteins Map7 and Map7D1 (Map7/7D1) form an interdependent regulatory loop with Disheveled, the critical signal transducer in Wnt signaling. Map7/7D1 bind to Disheveled, direct its cortical localization, and facilitate the cortical targeting of MT plus‐ends in response to Wnt5a signaling. Wnt5a signaling also promotes Map7/7D1 movement toward MT plus‐ends, and depletion of the Kinesin‐1 member Kif5b abolishes the Map7/7D1 dynamics and Disheveled localization. Furthermore, Disheveled stabilizes Map7/7D1. Intriguingly, Map7/7D1 and its Drosophila ortholog, Ensconsin show planar‐polarized distribution in both mouse and fly epithelia, and Ensconsin influences proper localization of Drosophila Disheveled in pupal wing cells. These results suggest that the role of Map7/7D1/Ensconsin in Disheveled localization is evolutionarily conserved.
Keywords: Disheveled, Kinesin‐1, microtubule remodeling, microtubule‐associated proteins, β‐catenin‐independent Wnt5a signaling
Subject Categories: Cell Adhesion, Polarity & Cytoskeleton; Development & Differentiation; Signal Transduction
Introduction
Wnt signaling participates in various cellular functions 1. The Wnt signaling pathway can be divided into two groups, the β‐catenin‐dependent and β‐catenin‐independent pathways. β‐catenin‐independent Wnt signaling plays important roles in cell‐substrate adhesion, cell migration, and planar cell polarity (PCP) formation, all of which are essential features of tissue morphogenesis 2, 3. β‐catenin‐independent Wnt signaling is transduced to its effectors through Disheveled (Dvl), whose intracellular localization is important for actin remodeling 4. A formin family actin nucleator, Daam1, is an effector of this process. Microtubule (MT) remodeling is also promoted by β‐catenin‐independent Wnt signaling 5, 6, 7, 8. However, the mechanism by which β‐catenin‐independent Wnt signaling regulates MT remodeling remains elusive. Notably, MT remodeling and β‐catenin‐independent Wnt signaling appear to be regulated interdependently. For example, during front‐rear polarity formation in migrating cells, MTs are polarized by elongating toward the leading edge. This MT attachment to the leading edge depends on β‐catenin‐independent Wnt signaling 6, 7. Conversely, treating cells with nocodazole, which induces MT depolymerization, disturbs the proper localization of Dvl and adenomatous polyposis coli (APC), both of which are critical component of β‐catenin‐independent Wnt signaling 6, suggesting that the β‐catenin‐independent Wnt signal transduction requires proper MT alignment. Similarly, during PCP formation in the multiciliated cells of the mouse airway, β‐catenin‐independent Wnt signaling promotes apical MT arrays to be organized in a planar‐polarized manner along the lung‐oral axis, and this MT organization is required for the proper localization of several proteins involved in PCP formation 8. These observations indicate that the interdependent regulation of MT remodeling and β‐catenin‐independent Wnt signaling establishes robust cell polarity. However, the factor that mutually connects them is completely unknown.
Microtubule remodeling is usually regulated by the coordinated actions of various MT‐binding proteins, such as MT‐associated proteins (MAPs) 9, 10. Thus, we hypothesized that MT‐binding protein(s) may be responsible for the interdependent regulation. Since one of β‐catenin‐independent pathways, the Wnt5a signaling pathway regulates cell‐substrate adhesion and cell migration in HeLa cells 6, 11, 12, as well as PCP formation during mammalian development 13, we used HeLa cells to screen uncharacterized MT‐binding proteins for their involvement in Wnt5a signaling. Here, we report that Map7 and its paralog, Map7D1 (Map7/7D1) participate in a feedback loop between MT remodeling and Wnt5a signaling through a direct interaction with Dvl. We also showed that the Kinesin‐1 member Kif5b, which is known as the binding partner of Map7 14, is required for both Map7/7D1 dynamics and Dvl localization. Furthermore, we found that Map7/7D1 and its Drosophila ortholog, Ensconsin (Ens) show planar‐polarized distribution in epithelial cells of mouse oviducts and fly pupal wings, respectively, and that Ens is required for proper localization of Drosophila Disheveled (Dsh). These results suggest that Map7/7D1 cooperate with Kif5b to coordinate a feedback loop between Dvl dynamics and MT remodeling in the Wnt5a signaling pathway, and that the role of Map7/7D1 family proteins in Dvl/Dsh localization is evolutionarily conserved.
Results
Paralogous MT‐associated proteins Map7 and Map7D1 are required for cell adhesion and migration in HeLa cells
To identify MT‐binding proteins that are potentially involved in the β‐catenin‐independent Wnt5a signaling pathway, we performed a siRNA‐based screen in HeLa cells for previously identified MT co‐sedimented proteins 15 (Fig 1A; Appendix Fig S1; see Materials and Methods for details). In HeLa cells, cell‐substrate adhesion and directional cell migration (hereafter, cell adhesion and migration, respectively) is regulated by endogenously expressing Wnt5a. By observing the effects of their knockdown on cell adhesion and migration, two genes, encoding Map7 and Map7D1, were identified as candidates that regulate cell adhesion and migration in response to endogenous Wnt5a (Fig 1A–C; Appendix Figs S2 and S3). Map7 and Map7D1 are members of the MAP7 family, which also includes Map7D2 and Map7D3 (Appendix Fig S3A). RT–qPCR analysis revealed that MAP7, MAP7D1, and MAP7D3, but not MAP7D2, were detectably expressed in HeLa cells (Appendix Fig S3A). Unlike Map7 and Map7D1, however, Map7D3 depletion neither triggered blebbing nor slowed migration (Fig 1B and C; Appendix Fig S3C). In contrast, depletion of both Map7 and Map7D1 caused much severer defects in cell adhesion and migration than that of each single gene product (Fig 1B and C). Thus, Map7 and Map7D1, but not Map7D3, have overlapping functions in the adhesion and migration of HeLa cells.
Figure 1. Paralogous MT‐associated proteins Map7 and Map7D1 are required for cell‐substrate adhesion and migration in HeLa cells.
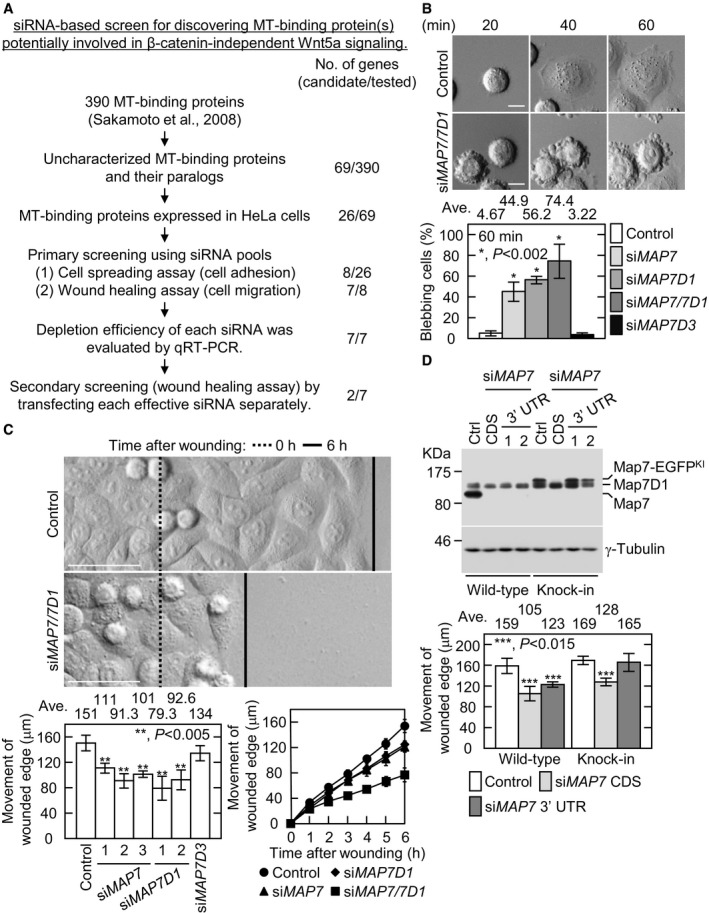
- Experimental flow chart for the siRNA‐based screen in HeLa cells to discover MT‐binding protein(s) potentially involved in β‐catenin‐independent Wnt5a signaling. For details, see Materials and Methods.
- Images of the indicated cells at various times after being replated on a fibronectin‐coated glass‐bottom dish (top). Lamellipodial extension was observed during cell‐substrate adhesion in control cells. Defective cell adhesion caused membrane blebbing instead of lamellipodial extension. Graph shows the percentage of blebbing cells 60 min after replating.
- Images of the indicated cells after inducing cell migration (top). Dotted and solid lines show the wounded edge 0 or 6 h after wounding, respectively. Average distance moved by the wounded edge 6 h after wounding (lower left). HeLa cells were transfected with validated CDS‐targeting siRNAs. Map7D3 was depleted with a mixture of three validated siRNAs (see Appendix Fig S3C). Distance moved by the wounded edge was measured over time after wounding in the indicated cells (lower right). Map7 or Map7D1 was depleted with a mixture of three or two validated siRNAs, respectively. For the double depletion, cells were treated with combined siRNAs against Map7 and Map7D1.
- Depletion efficiency of Map7 in wild‐type or Map7‐EGFPKI cells transfected with the indicated siRNAs (top). At 72 h post‐transfection, the protein level of Map7 was analyzed with an anti‐Map7 antibody. Graph shows the average distance moved by the wounded edge 6 h after wounding. siMAP7 CDS, Map7 was depleted with a mixture of three validated siRNAs targeting the CDS. siMAP7 3′ UTR, Map7 was depleted with a mixture of two validated siRNAs targeting the 3′ UTR.
The ectopic expression of Map7 or Map7D1 induced aberrant MT bundling 16 and therefore did not rescue the defects of Map7‐ or Map7D1‐depleted cells, respectively. To confirm the specificity of the siRNAs for depleting Map7 or Map7D1, by applying CRISPR‐Cas9 technique 17, 18, we generated Map7‐EGFP knocked‐in (Map7‐EGFPKI) HeLa cell lines, in which the endogenous 3′ untranslated region (UTR) was replaced by the SV40 polyadenylation signal (Fig 1D, top panel; Appendix Fig S4; Movie EV1). The siRNAs targeting the 3′ UTR or the coding sequence (CDS) of MAP7 caused slower migration in unmodified HeLa cells (Fig 1D, bottom). In contrast, siRNAs targeting the CDS but not the 3′ UTR decreased the migration rate of Map7‐EGFPKI cells (Fig 1D, bottom). These results indicate that the siRNAs used in our assay specifically deplete the target genes as designed, and that Map7 and Map7D1 play overlapping functions in cell adhesion and migration. Because of their functional overlap (Fig 1B and C), Map7 and Map7D1 (Map7/7D1) were simultaneously depleted in the following experiments.
Map7/7D1 are critical for the cortical targeting of MT plus‐ends
As Map7/7D1 depletion caused slower cell migration, it may affect MT stability. To test this possibility, we measured the levels of acetylated and detyrosinated tubulins, which are enriched in stable MTs. Map7/7D1 depletion did not affect the bulk levels of these modified tubulins (Fig 2A). We also evaluated the stability of MTs in migrating cells. Since MT turnover is fast at the leading edge during cell migration, the signal for acetylated tubulin was obvious only in the inner region, and not at the cell periphery, in control cells. These staining patterns were unaffected by Map7/7D1 depletion (Appendix Fig S5A). Thus, it is unlikely that Map7/7D1 regulate MT stability.
Figure 2. Map7/7D1 are critical for the cortical targeting of MT plus‐ends.
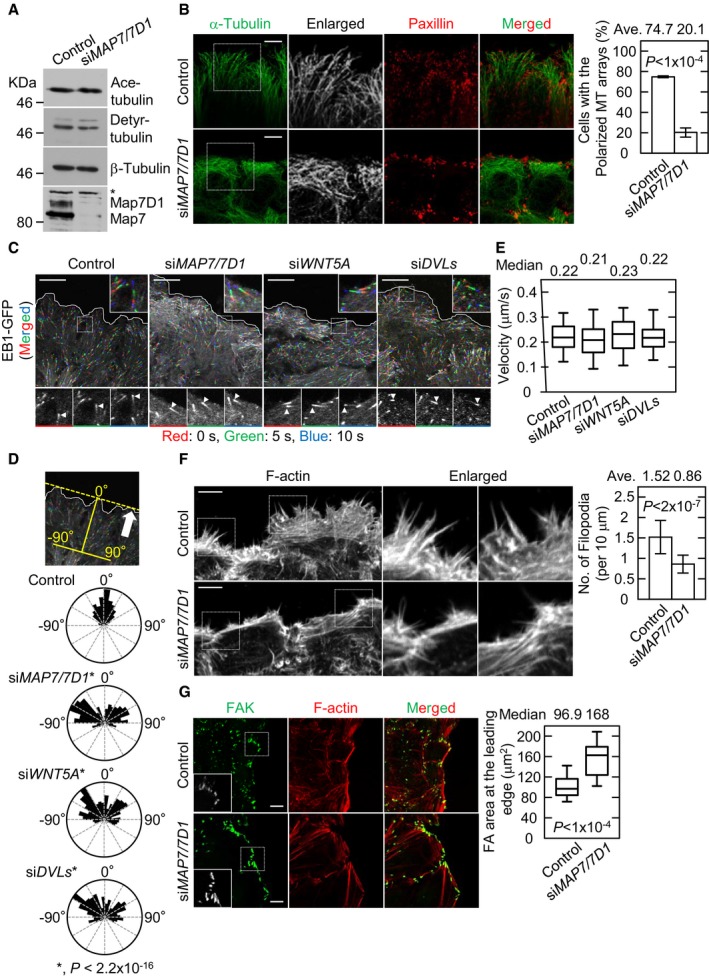
- Immunoblot analysis for detyrosinated (Detyr‐) and acetylated (Ace‐) tubulins in the indicated cells. β‐Tubulin (loading control) and Map7/7D1 were also analyzed. Asterisk shows unspecific band.
- Images of peripheral MT arrays at the leading edge in the indicated cells 1 h after wounding (left). Images were focused on the Paxillin signal, a marker of focal adhesions (FAs), because the polarized MT arrays were observed close to the adherent side of the cells. Graph shows the percentage of cells with polarized MT arrays (from three independent experiments).
- Dynamics of EB1‐GFP comets observed by live‐cell imaging 1 h after wounding (left). Time‐lapse images were taken at 5‐s intervals for 2 min (see Movies EV2, EV3, EV11 and EV12). Comet trails were measured at three time points (red: 0 s, green: 5 s, blue: 10 s) in the indicated cells (arrowheads).
- The measurement of the vector angle of EB1‐GFP comets with respect to the leading edge (top). The vector angle of 0° indicates direction toward the leading edge. Arrow indicates the direction of migrating cells. Rose diagram shows the vector angle of EB1‐GFP comets in the indicated cells (control, n = 328 comets; siMAP7/7D1, n = 277 comets; siWNT5A, n = 318 comets; siDVLs, n = 320 comets from three independent experiments).
- Graph shows the velocity of EB1‐GFP comets in the indicated cells (control, n = 270 comets; siMAP7/7D1, n = 270 comets; siWNT5A, n = 450 comets; siDVLs, n = 300 comets from three independent experiments).
- Images of filopodia at the leading edge in the indicated cells 1 h after wounding (left). Graph shows the number of filopodia at the leading edge of the front cells divided by the length of the leading edge. Twenty images (1,024 × 1,024 pixels, one image included about 4–5 front cells) from four independent experiments were analyzed for each cell type.
- FAs at the leading edge in the indicated cells 1 h after wounding (left). FAs were visualized by staining for focal adhesion kinase (FAK). Graph shows the FA area at the leading edge of the front cells measured 1 h after wounding (control, n = 114 cells; siMAP7/7D1, n = 81 cells from four independent experiments).
We next examined the proportion of polarized MTs elongating toward the leading edge (hereafter, the polarized MT arrays) by antibody staining for MTs and found that Map7D/7D1 depletion caused a decrease in the polarized MT arrays at the leading edge (Fig 2B). Since the polarized MT arrays are established by the cortical targeting of MT plus‐ends 9, we examined the dynamics of the MT plus‐ends by live imaging using the MT plus‐end marker, EB1‐GFP 19. In control cells, EB1‐GFP comets moved toward the leading edge during cell migration (Fig 2C and D; Movie EV2). However, the proportion of EB1‐GFP comets moving toward the leading edge was severely decreased in Map7/7D1‐depleted cells (Fig 2C and D; Movie EV3). Notably, the gross velocity of EB1‐GFP movement was unaffected by Map7/7D1 depletion (Fig 2E). These results suggest that Map7/7D1 are required for the cortical targeting of MT plus‐ends without affecting the growth of EB1‐decorated MTs.
Map7/7D1 coordinate MT and actin dynamics
The cortical targeting of MT plus‐ends regulates the actin dynamics, which plays essential roles in cell adhesion and migration 20, 21. Since Map7/7D1 depletion compromised the cortical targeting of MT plus‐ends, we wondered if it would also affect the filopodia organization. In control migrating cells, extended filopodia with thick F‐actin bundles were observed at the leading edge (Fig 2F). Map7/7D1 depletion caused significant decreases in the number of filopodia and thickness of F‐actin bundles (Fig 2F). Filopodia formation is required for the proper assembly and disassembly of focal adhesions (FAs), which is called FA turnover 22. In control migrating cells, small FAs, visualized by staining for focal adhesion kinase (FAK), formed at the leading edge, due to the increased turnover of FA 23 (Fig 2G). In contrast, larger FAs were observed at the leading edge in Map7/7D1‐depleted cells (Fig 2G), suggesting that the FA turnover rate was reduced. Similar phenotypes were observed during cell adhesion (Appendix Fig S5B and C). These results indicate that Map7/7D1 depletion causes a failure in the cortical targeting of MT plus‐ends, which in turn leads to reduced actin and FA dynamics, and consequently to cell migration and adhesion defects.
Map7/7D1 bind to the key mediator of Wnt5a signaling, Dvl
Map7/7D1 depletion shows similar phenotypes as when Wnt5a signaling is disrupted, including multinucleated cells 5, 6 (Appendix Fig S5D). To further examine whether Map7/7D1 are involved in the β‐catenin‐dependent pathway, we analyzed the effects of Map7/7D1 depletion on the β‐catenin‐dependent induction of AXIN2 expression by RT–qPCR 24. By the Wnt3a administration, AXIN2 mRNA was increased in both control and Map7/7D1‐depleted cells (Appendix Fig S5E), suggesting that Map7/7D1 are dispensable for the β‐catenin‐dependent pathway in response to Wnt3a. Because the key mediator in Wnt5a signaling, Dvl is known to participate in the cortical targeting of MT plus‐ends 6, we examined whether Map7/7D1 form a complex with Dvl. Endogenous Dvl2 was co‐precipitated with hMap7‐V5His6 (Fig 3A). Furthermore, an anti‐Dvl2 antibody co‐precipitated endogenous Map7 and Map7D1 (Fig 3B). In contrast, a trace amount of overexpressed Map7D2 was co‐immunoprecipitated with Dvl2 (Appendix Fig S6A and B). These results indicate that Map7 and Map7D1 form a complex with Dvl2 under physiological conditions.
Figure 3. Map7/7D1 bind to Dvl, a key mediator of Wnt5a signaling.
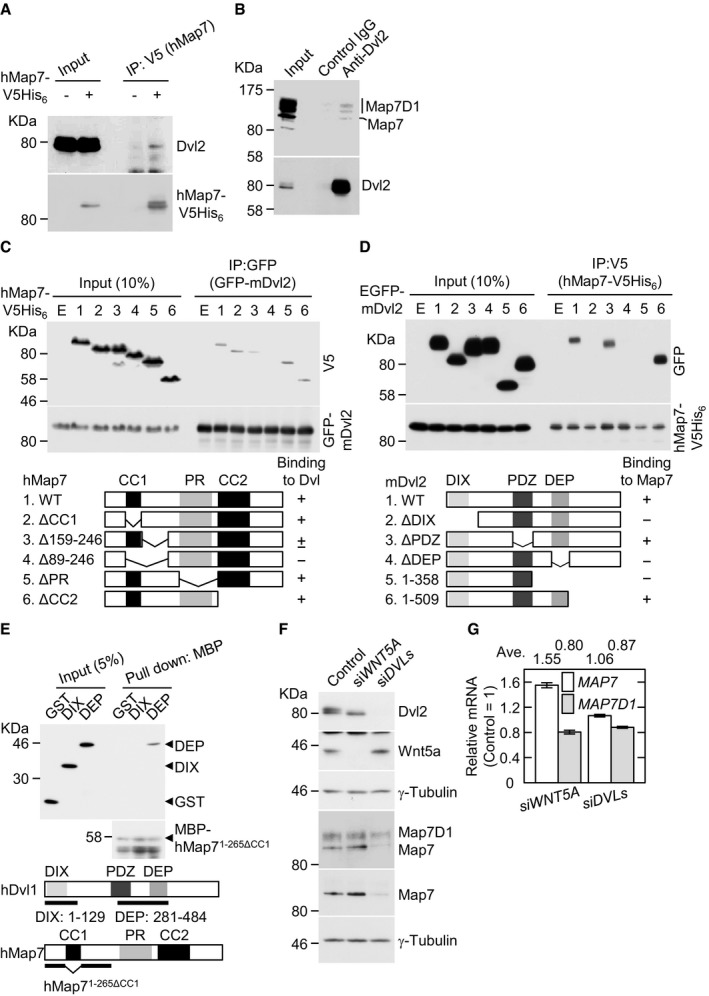
- Lysates from HeLa cells transfected with control vector or pcDNA3.1‐hMAP7‐V5His6 were immunoprecipitated with an anti‐V5 antibody, and the immunoprecipitates were probed with anti‐Dvl2 and anti‐V5 antibodies.
- Lysates from HeLa cells were subjected to immunoprecipitation with control IgG or an anti‐Dvl2 antibody and analyzed by immunoblotting with an anti‐Map7/7D1 or anti‐Dvl2 antibody.
- Lysates from HeLa cells co‐expressing various deletion derivatives of hMap7‐V5His6 with EGFP‐mDvl2 were immunoprecipitated with an anti‐GFP antibody, and the immunoprecipitates were probed with anti‐V5 and anti‐GFP antibodies.
- Lysates from HeLa cells co‐expressing various derivatives of EGFP‐mDvl2 with hMap7‐V5His6 were immunoprecipitated with an anti‐V5 antibody, and the immunoprecipitates were probed with anti‐GFP and anti‐V5 antibodies.
- MBP‐hMap71‐265ΔCC1 (30 pmol) conjugated to amylose resin was incubated with purified GST, GST‐hDvl1DIX, or GST‐hDvl1DEP (30 pmol of each), and the bound proteins were analyzed by immunoblotting with anti‐GST and anti‐MBP antibodies. The positions of GST, GST‐hDvl1DIX, and GST‐hDvl1DEP were revealed by loading 1.5 pmol (5%) of each purified protein.
- Depletion efficiency of siWNT5A or siDVLs. Lysates derived from the indicated cells were probed with anti‐Dvl2 and anti‐Wnt5a antibodies. The blot was reprobed for γ‐tubulin as a loading control (left). Effects of siWNT5A or siDVLs on the protein levels of Map7 and Map7D1 were also analyzed (right). The blot was reprobed for γ‐tubulin as a loading control.
- Graph shows the relative mRNA levels of MAP7 and MAP7D1 in the indicated cells 72 h after siRNA transfection. Expression levels of MAP7 and MAP7D1 transcripts were quantified by normalization to the GAPDH expression. Data are from three independent experiments and represent average ± SD.
Source data are available online for this figure.
To determine which domains of Map7 interact with Dvl2, we expressed various deletion derivatives of Map7 together with Dvl2 in HeLa cells. Map7 lacking amino acids (aa) 159–246 interacted poorly with Dvl2. Further deletion (aa 89–246), which includes the coiled‐coil domain 1 (CC1), abolished the Map7–Dvl2 interaction, whereas deletion of the CC1 domain alone (aa 89–152) did not affect the interaction (Fig 3C). We next examined which region of Dvl2 is required for the association with Map7, and found that Dvl2 lacking the DIX or DEP domain failed to associate with Map7 (Fig 3D). Although it is well known that overexpressed Dvl2 is highly phosphorylated in HeLa cells, this phosphorylation was abolished in the truncated Dvl2 that lacked the DIX domain. In contrast, another truncated Dvl2 with the DEP deletion remained phosphorylated (Appendix Fig S6C), suggesting that the conformational change of Dvl2 arising from DIX deletion may affect the Map7–Dvl2 interaction. We further performed in vitro biding assay using purified GST‐hDvl1DIX and GST‐hDvl1DEP. Purified GST‐hDvl1DEP, but not GST‐hDvl1DIX, was pulled down with MBP‐hMap71‐265ΔCC1 in vitro (Fig 3E; Appendix Fig S6D). Taken together, these results indicate that the DEP domain of Dvl is sufficient for, and the aa 159–246 region of Map7 is required for their interaction. The DEP domain in Dvls is critical for both β‐catenin‐dependent and β‐catenin‐independent Wnt signaling 25, 26, 27, 28. Because Map7/7D1 are not involved in β‐catenin‐dependent Wnt3a signaling (Appendix Fig S5E), these results further support the idea that Map7/7D1 play a role in the Wnt5a signaling pathway through interaction with Dvl.
We also noticed that depleting all three human Dvl proteins (Dvls) reduced the steady state of Map7/7D1 protein levels without affecting the MAP7/7D1 mRNA levels (Fig 3F and G). In contrast, Wnt5a depletion did not affect the Map7/7D1 levels. These results indicate that Dvl is required for Map7/7D1's stability, and that this regulation is independent of Wnt5a signaling.
Map7/7D1 direct the Dvl localization to the cell cortex
We next examined whether Map7/7D1 regulate Dvl's localization in the Wnt5a signaling pathway. Dvl can bind to actin 29 and is preferentially accumulated at lamellipodia of the cell periphery in response to Wnt5a 6, 30. To observe Dvl's localization to the cell periphery in living cells, we generated Dvl2‐EGFP knock‐in (Dvl2‐EGFPKI) HeLa cell lines (Appendix Fig S7). Consistent with previous immunostaining results 6, 30, Dvl2‐EGFPKI accumulated at the cell cortex during cell migration in control cells (Fig 4A; Movie EV4). In contrast, this Dvl2‐EGFPKI accumulation was compromised in Map7/7D1‐depleted cells (Fig 4A; Movie EV5). Importantly, Map7/7D1 depletion did not affect the expression or secretion of Wnt5a, which provides the autocrine signal that is essential for the cortical accumulation of Dvl in HeLa cells (Fig 4B). The expression and localization of adenomatous polyposis coli (APC), which binds to Dvl and maintains the polarized MT arrays 6, were also unaffected by Map7/7D1 depletion (Fig 4C and D). Furthermore, upon Wnt5a administration into the medium, a robust cortical accumulation of Dvl2‐EGFPKI was induced in the control cells, but not in Map7/7D1‐depleted cells (Fig 4E). In contrast, the Wnt5a‐induced Dvl2 phosphorylation was intact in Map7/7D1‐depleted cells (Fig 4C). Thus, Map7/7D1 depletion disrupted the cortical accumulation of Dvl2, even though the Wnt5a signaling‐mediated Dvl phosphorylation was intact.
Figure 4. Map7/7D1 direct Dvl localization to the cell cortex.
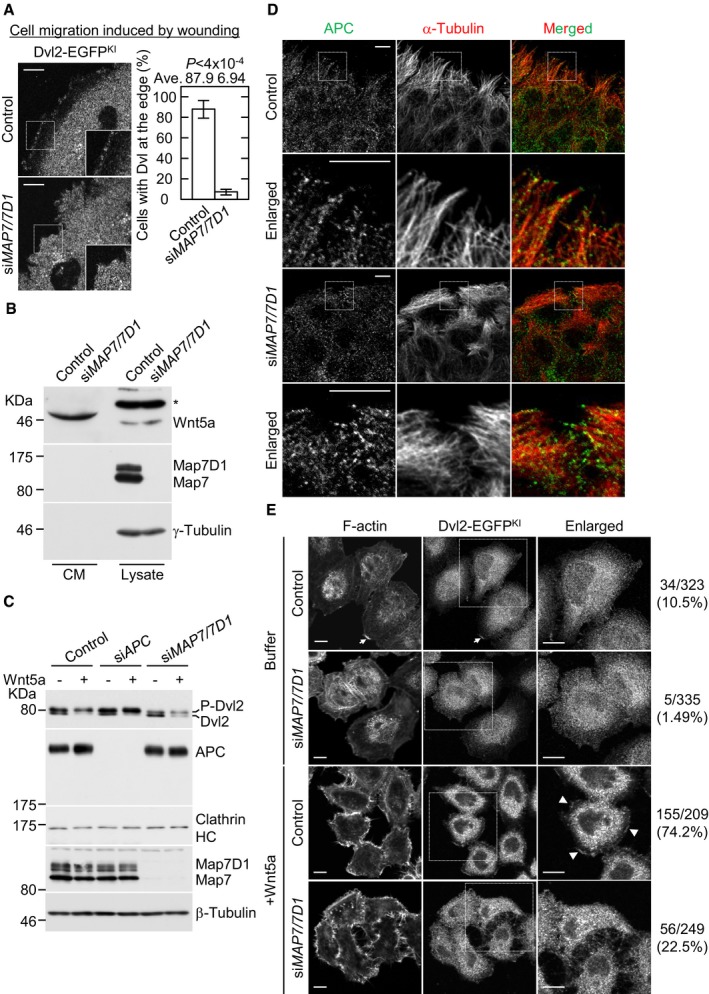
- Live‐cell imaging of Dvl2‐EGFPKI cells 1 h after wounding. Movies were taken at 10‐s intervals for 3 min (see Movies EV4 and EV5). Graph shows the percentage of cells with accumulated Dvl2‐EGFPKI at the cell periphery. Data are from four independent experiments and represent average ± SD. Statistical significance was tested with the Student's t‐test.
- Effects of Map7/7D1 depletion on the secretion and expression levels of Wnt5a. Conditioned medium and lysates derived from the indicated cells were separated on SDS–PAGE and were immunoblotted with an anti‐Wnt5a antibody. To assess the levels of Map7/7D1 depletion and loading control, the blot was reprobed for Map7/7D1 and γ‐tubulin, respectively. Asterisk shows unspecific band.
- Effects of Map7/7D1 depletion on the expression levels of Dvl and APC. Lysates derived from the indicated cells were separated by SDS–PAGE and were immunoblotted with anti‐Dvl2 and APC antibodies. The blots were reprobed for Clathrin heavy chain (HC) or γ‐tubulin as a loading control. The phosphorylation state of Dvl2 was confirmed by its mobility shift. P‐Dvl2 represents phosphorylated Dvl2.
- Localization of APC at the leading edge in the indicated cells. Cells were fixed 1 h after wounding, and stained for α‐tubulin and APC.
- A strong cortical accumulation of Dvl2‐EGFPKI was induced by purified Wnt5a (100 ng/ml). Cells were fixed 1 h after treatment with buffer or Wnt5a. The percentage of cells in which Dvl2‐EGFPKI was accumulated at the cell periphery was calculated (control with buffer, n = 323; siMAP7/7D1 with buffer, n = 335 cells; control with Wnt5a, n = 209 cells; siMAP7/7D1 with Wnt5a, n = 249 cells). Arrows indicate cortical Dvl2‐EGFPKI at the corresponding lamellipodia in buffer‐treated control cells. Arrow heads indicate cortical Dvl2‐EGFPKI at the lamellipodia in Wnt5a‐treated control cells.
The cortical accumulation of Dvl requires lamellipodia 6, 30. As the lamellipodia formation depends on Map7/7D1 (Fig 2F; Appendix Fig S5B), the lack of cortical Dvl accumulation might have been an indirect consequence of Map7/7D1 depletion. To exclude this possibility, we tested the effects of ectopically formed lamellipodia on the cortical accumulation of Dvl in Map7/7D1‐depleted cells. The expression of a constitutively active form of Rac1 (Rac1CA) induces lamellipodia formation and targeting of MTs to the lamellipodia 31 (Figs 5A and EV1A). In both control and Map7/7D1‐depleted cells, FLAG‐Rac1CA expression promoted lamellipodia formation and the targeting of MTs (Fig 5C and D). However, in the Map7D/7D1‐depleted cells, Dvl2‐EGFPKI failed to accumulate to the lamellipodia (Figs 5A and B, and EV1B). Virtually identical results were observed when Wnt5a was depleted (Fig 5A–D). Another Map7 paralog, Map7D3 was dispensable for the Dvl accumulation (Fig 5A–D). These results suggest that lamellipodia formation and the targeting of MTs are insufficient for the cortical accumulation of Dvl, and Map7/7D1 direct Dvl's localization to the cell cortex in response to Wnt5a.
Figure 5. Map7/7D1 and APC act at different points in Wnt5a signaling.
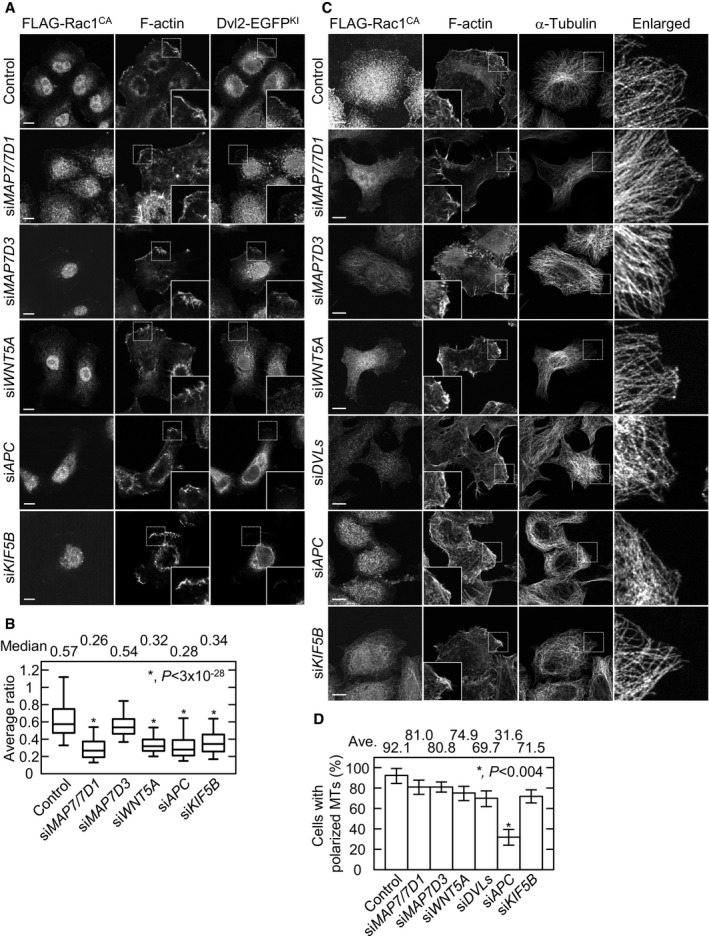
- Effects of Rac1CA on Dvl localization. Dvl2‐EGFPKI cells were first transfected with siRNA, and 2 days later with Flag‐Rac1CA. Twenty‐four hours after the plasmid transfection, the cells were fixed and stained with anti‐Flag and anti‐GFP antibodies, and Phalloidin. By confocal z‐sectioning (0.2‐μm intervals), lamellipodia/ruffling structures were carefully distinguished from other peripheral actin structures such as stress fibers and blebbing membrane.
- The strongest intensity for Dvl2‐EGFPKI and F‐actin at the three different lamellipodia in each cell type was averaged, and the ratio of the Dvl2‐EGFPKI/F‐actin intensity was plotted (control, n = 181 cells; siMAP7/7D1, n = 146 cells; siMAP7D3, n = 159 cells; siWNT5A, n = 137 cells; siAPC, n = 194 cells; siKIF5B, n = 195 cells from three independent experiments). The bars of box‐and‐whisker plots show the 5 and 95 percentiles, and the box limits are the 1st and 3rd quartile.
- Images of peripheral MTs at the lamellipodium in the indicated cells. Cells were first transfected with siRNA and 2 days later with the Flag‐Rac1CA expression plasmid. Twenty‐four hours after the plasmid transfection, the cells were fixed, and stained with anti‐Flag and anti‐α‐tubulin antibodies, and Phalloidin. By confocal z‐sectioning (0.2‐μm intervals), the lamellipodium/ruffling structures were carefully distinguished from other peripheral actin structures, such as stress fibers and blebbing membrane.
- Graph shows the percentage of cells with polarized MT arrays. Data are from three independent experiments and represent the average ± SD.
Figure EV1. The experimental representation of cortical accumulation of Dvl2‐EGFPKI induced by ectopic expression of Rac1CA .
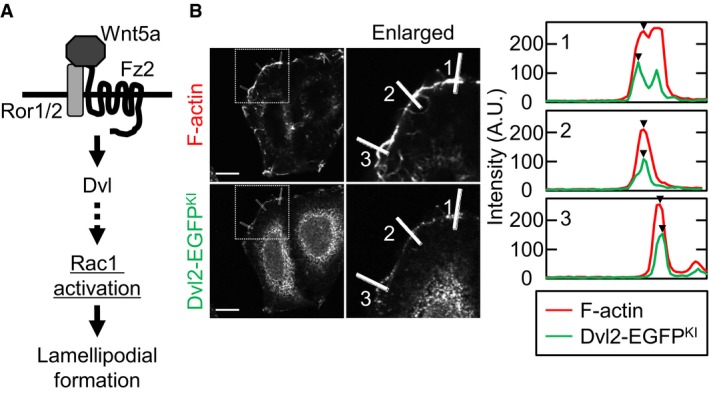
- Scheme of the Wnt5a signaling pathway.
- Intensities of the F‐actin and Dvl2‐EGFPKI signals were measured at three different points in the lamellipodia, and representative results are shown at right. Arrow heads indicate the measurement point of each intensity. Scale bar, 10 μm.
Map7/7D1 and APC act at different points in Wnt5a signaling
Adenomatous polyposis coli is another MT‐binding protein that binds to Dvl during Wnt5a signaling 6. To dissect the functional differences between Map7/7D1 and APC, we examined the effects of Rac1CA expression in APC‐depleted cells. Although the Rac1CA‐induced MT targeting was intact when Wnt5a, Dvls, or Map7/7D1 were depleted, it was compromised in APC‐depleted cells (Fig 5C and D). In contrast, the lamellipodia formation appeared to be normal even in APC‐depleted cells (Fig 5C and D). APC acts downstream of Rac1 to couple the MT and actin networks 32, whereas Wnt5a and Dvl act upstream of Rac1 24 (Fig EV1A). Since the Map7/7D1‐depleted cells responded to Rac1CA in a similar fashion as Wnt5a‐ or Dvls‐depleted cells (Fig 5A–D), Map7/7D1 are likely to act upstream of Rac1 in the Wnt5a signaling pathway to regulate lamellipodia formation and the targeting of MTs.
Map7 moves toward the MT plus‐end in response to Wnt5a
Because Map7/7D1 bind to Dvl and promote its accumulation at Wnt5a‐induced lamellipodia, the Map7/7D1 dynamics might also be modulated by Wnt5a signaling. We therefore examined the Map7/7D1 localization in migrating HeLa cells, in which Wnt5a signaling is activated. Whereas Map7/7D1 were located along MTs in non‐migrating cells (Appendix Fig S3D), Map7/7D1 formed dots at the cell periphery during migration (Fig 6A). Although these dots did not co‐localize with EB1 (Fig 6B), they moved toward the MT plus‐end (Fig 6C; Movie EV6). Furthermore, fluorescence recovery after photobleaching (FRAP) analysis revealed that the recovery rate of Map7‐EGFPKI fluorescence at the leading edge was higher in migrating cells than in non‐migrating cells (Fig 7A; Appendix Fig S8A; Movies EV7 and EV8). In addition, the Map7‐EGFPKI dots appeared from the minus‐end side after photobleaching (Fig 7A). These results suggest that the Map7/7D1 are loaded onto the MT to form dots and move toward the plus‐end.
Figure 6. Map7 moves toward the MT plus‐end during in migrating cells.
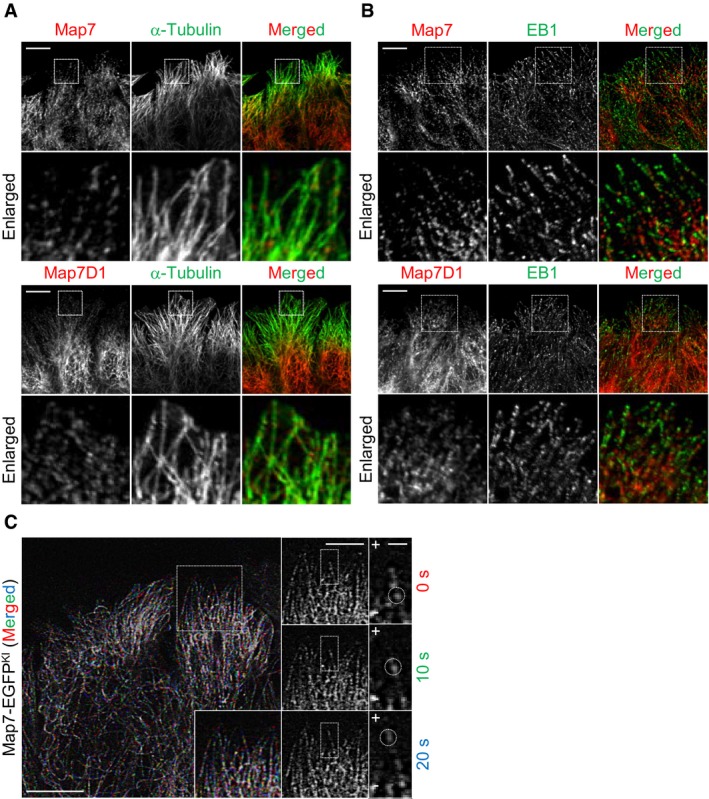
- Subcellular localization of endogenous Map7 or Map7D1 at the leading edge during cell migration. Fixed cells were co‐immunostained for α‐tubulin.
- Subcellular localization of endogenous Map7 or Map7D1 co‐stained for EB1 at the leading edge. Cells were fixed 1 h after wounding and then stained with the indicated antibodies. Enlarged merged images show that Map7/7D1 was not co‐localized with EB1.
- Live imaging of Map7‐EGFPKI cells. Time‐lapse images were taken at 10‐s intervals after wounding. Images at individual time points are shown at right, and the merged image is shown at left. Note that a Map7‐EGFPKI dot moves toward the cell cortex, where MT plus‐ends are enriched (circles).
Figure 7. Wnt5a signaling and the Kinesin‐1 member Kif5b promote directional Map7 movement toward the MT plus‐end.
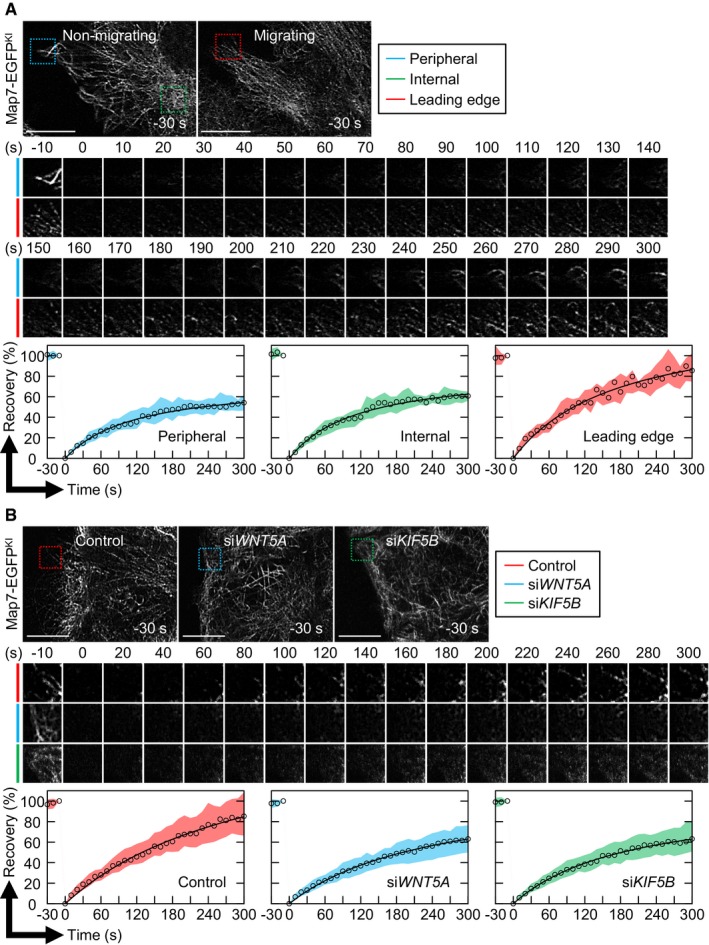
- FRAP analysis of Map7‐EGFPKI at the cell periphery (blue square) or the internal region (green square) of non‐migrating cells or at the leading edge of migrating cells (red square). Recovery of fluorescence was recorded at 10‐s intervals for 5 min. Data represent the median (circles) and the interquartile range (the interval from the 1st quartile to the 3rd quartile). Peripheral, n = 30 ROIs; Internal, n = 22 ROIs; Leading edge, n = 21 ROIs from three independent experiments.
- FRAP analysis of Map7‐EGFPKI at the leading edge of the indicated cells after wounding. Recovery of fluorescence was recorded at 10‐s intervals for 5 min. Cropped images of all time points are shown in Appendix Fig S8B. Data represent the median (circles) and the interquartile range (the interval from the 1st quartile to the 3rd quartile). Control, n = 121 ROIs; siWNT5A, n = 112 ROIs; siKIF5B, n = 106 ROIs from four independent experiments.
We next examined whether Wnt5a signaling affected these Map7 dynamics. Compared with control cells, the recovery rate of Map7‐EGFPKI fluorescence after photobleaching was significantly reduced at the leading edge in Wnt5a‐depleted cells (Fig 7B; Appendix Fig S8; Movies EV9 and EV10). Since Wnt5a signaling regulates the cortical MT dynamics to establish polarized MT arrays 7, 12, Wnt5a depletion might slow the MT dynamics, resulting in a reduced recovery rate of Map7‐EGFPKI fluorescence. Although depletion of Wnt5a or Dvls affected the vector angle of EB1‐GFP comets toward the cell cortex, the growth rate of EB1‐GFP‐decorated MTs at the leading edge was intact (Fig 2C–E). These results suggest that the reduced Map7‐EGFPKI dynamics by Wnt5a depletion is independent of the peripheral MT growth, and that Wnt5a signaling is important for the association/dissociation cycle of Map7/7D1 with MTs and their movement toward the MT plus‐end.
Map7 is reported to act with the Kinesin‐1 member, Kif5b 14. We therefore examined the effects of Kif5b depletion in Map7/7D1 dynamics. FRAP analysis showed that the recovery of Map7‐EGFPKI fluorescence at the leading edge was significantly slowed by Kif5b depletion (Fig 7B; Appendix Fig S8; Movie EV13). Furthermore, the strong Dvl accumulation at the leading edge in Rac1CA‐expressing cells was dramatically decreased when Kif5b was depleted, even though MT targeting to the lamellipodia was rescued (Fig 5). These data suggest that Kif5b promotes the Map7D/7D1 movement toward the MT plus‐end, and that this movement is involved in the regulation of Dvl's localization in Wnt5a signaling.
Polarized distribution of Map7/7D1 and the Drosophila ortholog, Ens in epithelial tissues
β‐catenin‐independent Wnt signaling including Wnt5a signaling is required for PCP formation in various types of tissues during mammalian development 2, 3, 13. In planar‐polarized cells, components involved in β‐catenin‐independent Wnt signaling often show polarized distribution along the proximal–distal axis 33. Since Map7/7D1 mediate Wnt5a signaling during cell adhesion and migration in HeLa cells, we investigated the subcellular localizations of Map7/7D1 in the mouse oviduct epithelium, in which multiciliated cells have PCP in response to β‐catenin‐independent Wnt signaling 34, 35. Intriguingly, immunofluorescence analysis revealed that Map7/7D1 localized to the ovary (proximal) side along the planar axis of multiciliated cells in the mouse oviduct (Fig 8A). This polarized localization was more striking when hMap7‐EGFP or mMap7‐EGFP was transiently expressed (Fig 8B). We further examined the distribution of the Drosophila Map7/7D1 ortholog in pupal wing epithelium. D. melanogaster has a single MAP7/7D1 ortholog gene, ensconsin (ens). We generated a homozygous viable and fertile Ens::EGFP knock‐in (Ens::EGFPKI) fly strain by CRISPR‐Cas9‐mediated genome editing, in which the EGFP CDS was fused to the C‐terminal end of the ens CDS (Appendix Fig S9A). Endogenous Ens accumulates in the region where MT minus‐ends are known to enrich, such as the anterior side of oocytes and the apical side of epithelial follicle cells 36. The localization of Ens::EGFPKI was indistinguishable from that of endogenous Ens (Appendix Fig S9B), indicating that the added EGFP moiety did not affect Ens's localization and functions. Similar to the Map7/7D1 localization in multiciliated cells of the mouse oviduct epithelium, Ens::EGFPKI enriched to the proximal side of pupal wing cells (Fig 8C; Appendix Fig 9C), where the MT minus‐ends are known to be accumulated 37, 38. These data indicate that the localization pattern of Map7/7D1/Ens is evolutionarily conserved in planar‐polarized cells of epithelial tissues.
Figure 8. Polarized distribution of Map7/7D1 and the Drosophila ortholog, Ens in epithelial tissues.
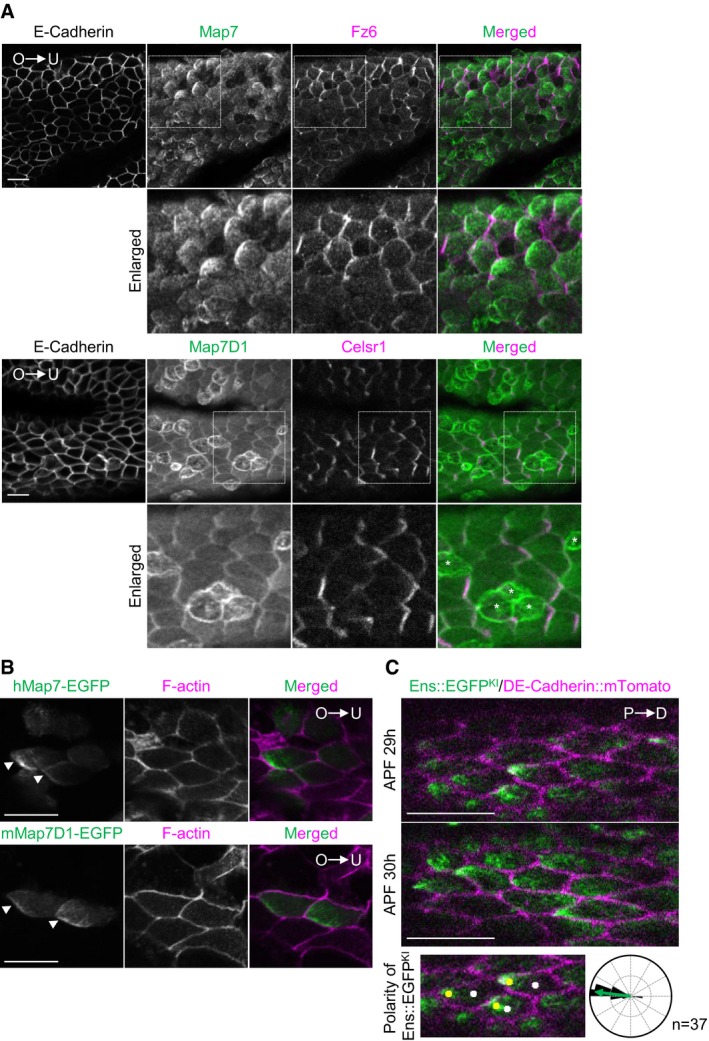
- Immunofluorescence images of Map7 (top) or Map7D1 (bottom) in the ciliated epithelium of the mouse oviduct. Fz6 and Celsr1 were used as markers for PCP orientation, and E‐Cadherin for cell boundaries. O, ovary side; U, uterus side. Asterisks show the secretory cells.
- Subcellular localization of hMap7‐EGFP or mMap7‐EGFP in multiciliated cells of the mouse oviduct. A hMap7‐EGFP or mMap7‐EGFP expression construct was transfected into the oviduct by electroporation. The oviduct was fixed with paraformaldehyde, and stained with Phalloidin to visualize cell boundaries. Arrow heads indicate the polarized localization of hMap7‐EGFP or mMap7D1‐EGFP at the ovary side of multiciliated cells.
- Live‐cell imaging of the pupal wing in an Ens::EGFPKI fly expressing DE‐Cadherin::mTomato at 29 and 30 h APF. P, proximal side; D, distal side. The subcellular distribution of Ens::EGFPKI was evaluated as follows: The cell boundary of individual cells was first outlined manually, and the point of the center of each cell was calculated (white dots). Next, after binarizing images of Ens::EGFPKI, the mass of Ens::EGFPKI was outlined, and the point of the center of its mass was calculated (yellow dots). Then, angles of vector between two points were calculated and were plotted on rose diagrams (n = 37 cells). The median angle is represented by green arrow.
Ens is involved in proper Dsh localization in epithelial cells
The conserved localization pattern of Map7/7D1/Ens led us to examine whether Ens contributes to PCP in epithelial tissues of Drosophila, though some modules in Drosophila PCP signaling cascade are different from those in β‐catenin‐independent Wnt signaling in vertebrates. During wing formation, core PCP proteins, including Disheveled (Dsh), show polarized distribution along the proximal–distal axis in each wing epithelial cell and promote the formation of a wing hair along the proximal–distal axis. Genetic data indicate that the remaining N‐terminal portion encoded by the ens ∆C allele retains ens functions 39 (Appendix Fig S10A). Therefore, to examine the effects of the loss of ens on PCP formation and Dsh's localization, we generated frame‐shift mutants for ens, ens KO36, and ens KO39 (Appendix Fig S10B). Both alleles showed severe homozygous lethality prior to or immediately after eclosion (Appendix Fig S10A). We therefore analyzed wing hair orientation in ens KO36 /Df(3L)BSC735 pupae, which were identified by the loss of GFP fluorescence from the balancer chromosome. We found that the loss of ens caused wing hair misorientation (Fig 9A). These data indicate that Ens is involved, directly or indirectly, in PCP formation.
Figure 9. Ens is involved in proper Dsh localization in epithelial cells.
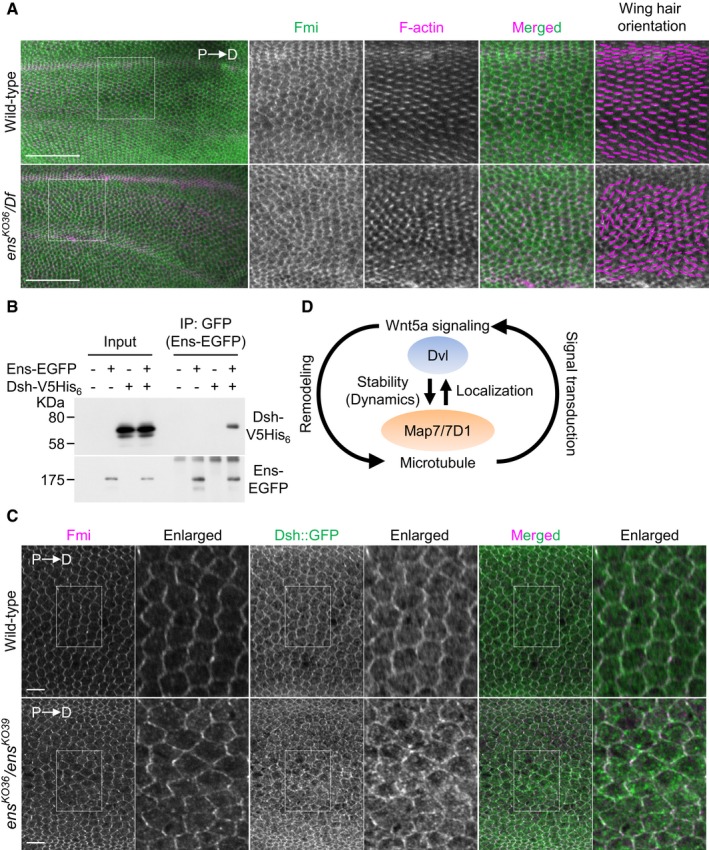
- Pupal wings of wild‐type or ens KO36 /Df(3L)BSC735 (ens KO36 /Df) mutants at 32–34 h APF (after puparium formation) were stained with an anti‐Fmi antibody and Phalloidin. P, proximal side; D, distal side. High magnification views of boxed area (intervein region between L3 and L4 veins) are shown at right. Magenta lines in right side panels indicate wing hair orientation. Because ens KO36 /Df mutants died before eclosion, we obtained their pupae by selecting third instar larvae, which were identified by the loss of GFP fluorescence from the balancer chromosome. Oregon‐R was used as wild type.
- Lysates from HeLa cells expressing Ens‐EGFP and Dsh‐V5His6 were immunoprecipitated with an anti‐V5 antibody, and the immunoprecipitates were probed with anti‐V5 and anti‐GFP antibodies.
- Localization of Dsh::GFP in 30 h APF pupal wing stained for Fmi, and GFP and F‐actin (shown in Fig EV2). The Dsh::GFP localization was analyzed in intervein region between L3 and L4 veins. We obtained ens KO36 /ens KO39 pupae by selecting third instar larvae, which were identified by the loss of mCherry fluorescence from the balancer chromosome. w; dsh::EGFP was used as wild type.
- Proposed model for a feedback loop between MT remodeling and Wnt5a signaling mediated by the Map7/7D1‐Dvl axis. See Discussion for details.
During PCP formation, Dsh becomes asymmetrically localized by the polarized transport of Dsh‐containing vesicles to the distal cortex 40, 41, 42. This polarized transport is known to require MTs 41, though the underlying mechanisms are not defined. We found that, similar to HeLa cells, Ens can form a complex with Dsh (Fig 9B). We also investigated the effect of the loss of ens on the Dsh localization in pupal wing cells. To this end, ens KO36 /ens KO39 pupae expressing Dsh::GFP was used, because defects in wing hair orientation in ens KO36 /ens KO39 pupae were virtually identical to those in wing hair orientation in ens KO36 /Df(3L)BSC735 pupae (Appendix Fig S10C). In the wild‐type pupal wing cells, Dsh::GFP exhibited a planar‐polarized localization at the cell cortex (Figs 9C and EV2). In contrast, the planar‐polarized localization of Dsh::GFP was compromised by the loss of ens (Figs 9C and EV2). These results indicate that Ens is required for proper Dsh localization in epithelial cell.
Figure EV2. Wide‐field view of the Dsh::GFP localization related to Fig 9C.
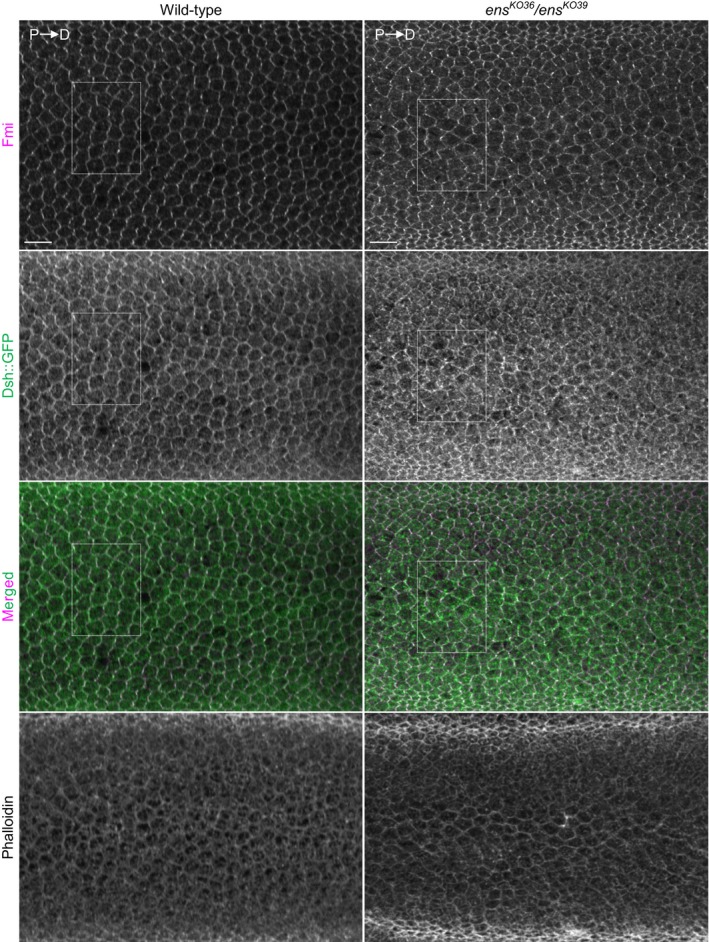
The white dashed box indicates an enlarged region in Fig 9C. Images of Phalloidin staining are shown at the bottom panel. Scale bar, 10 μm.
Discussion
In this study, we showed that Map7/7D1 forms a complex with Dvl to mediate the interplay between β‐catenin‐independent Wnt5a signaling and MT remodeling in HeLa cells (Fig 9D; Appendix Fig S10D). Map7/7D1 are MAPs, many of which contribute to MT stabilization 16, 43, 44, 45. However, Map7/7D1 act differently from other conventional MAPs, in that they do not affect MT stabilization and growth. Rather, they promote the cortical localization of Dvl, thereby polarizing the MT arrays in response to Wnt5a signaling. Intriguingly, the movement of Map7 to the MT plus‐end depends on Wnt5a signaling (Fig 7B) and is likely to be essential for the cortical localization of Dvl; therefore, Map7/7D1 form an interdependent regulatory loop with Dvl. In addition, the stability of Map7/7D1 depends on their interaction with Dvl (Fig 3F and G). Notably, Map7/7D1 depletion did not affect the Wnt5a‐induced Dvl2 phosphorylation (Fig 4C), suggesting that Map7/7D1 is dispensable for transducing the Wnt5a signal to Dvl. Based on these data, we propose that Wnt5a signaling is first transduced to Dvl, which in turn facilitates Map7/7D1 dynamics and promotes the cortical localization of Dvl. Therefore, the Map7/7D1‐Dvl interplay is likely to establish a positive feedback loop between Wnt5a signaling and MT remodeling (Fig 9D; Appendix Fig S10D).
Adenomatous polyposis coli is another MT‐binding protein that also binds to Dvl and organizes the polarized MT arrays in response to Wnt5a 6. However, Map7/7D1 and APC have different roles in the Wnt5a signaling pathway. Our data suggest that Map7/7D1 act upstream of Rac1 (Figs 5A–D and EV1A), whereas APC is known to act downstream of Rac1 32. In addition, Map7/7D1 are involved in the targeting, rather than the attachment, of MTs to the cell cortex, because the ectopic expression of Rac1CA rescued the attachment of MTs in Map7/7D1‐depleted, but not APC‐depleted cells (Fig 5C and D). Although it is clear that Map7 and Map7D1 have overlapping functions in Wnt5a signaling (Fig 1B and C), each may have non‐overlapping functions as well. Intriguingly, we found that endogenous Map7D1, but not Map7, can form a complex with APC, which plays a role in MT attachment to the cell cortex in Wnt5a signaling (Appendix Fig S6E). Thus, Map7D1 may act together with both Map7 and APC to steer the processes between MT targeting and attachment to the cell cortex.
Microtubules are required for the proper localization of Dvl in Wnt5a signaling 5, 6. Map7 and Ens are required for the recruitment of a motor protein, Kinesin‐1 to MTs, thereby promoting several MT‐dependent processes, such as cytoplasmic flow, myonuclear positioning, and cargo transport 14, 36, 39. We showed that Map7‐EGFPKI moves toward the MT plus‐end during cell migration, and that this movement, along with the cortical localization of Dvl, is compromised by Kif5b depletion. Thus, we propose that Map7/7D1 also promote the loading of Kinesin‐1 family protein onto MTs for the Dvl localization (Appendix Fig S10D).
In pupal wing cells, Ens localizes to the MT minus‐end enriched proximal side (Fig 8C; Appendix Fig 9C), whereas Dsh enriches in the distal cortex where the MT plus‐ends are known to accumulate (Fig 9C) 37, 38, 41. Despite their non‐overlapping distributions, we showed that, similarly to HeLa cells, Ens is required for Dsh localization to the distal cortex. Intriguingly, Dsh distributes to the entire cell cortex before the onset of PCP formation and becomes redistributed asymmetrically at the distal cortex during PCP formation 40, 41, 42, the process in which Ens is involved. Therefore, Ens in the proximal side may promote the MT loading of Kinesin‐1, which carries Dsh‐containing cargo to the distal cortex.
Ensconsin is required for proper wing hair orientation, likely through regulating the Dsh localization (Figs 9A–C and EV2). Components involved in PCP formation are well conserved between Drosophila and vertebrates, though mechanistic features in Drosophila PCP signaling are different in some parts from those in β‐catenin‐independent Wnt signaling 46. We propose that the role of Map7/7D1/Ens in the localization of Dvl/Dsh in polarized cells is evolutionarily conserved between vertebrate and invertebrate. Map7/7D1/Ens also show planar‐polarized distribution in both mouse and fly epithelia (Fig 8), and we provide evidence that Ens might contribute to PCP formation in Drosophila. Therefore, whether Map7/7D1 are involved in mammalian PCP formation would be an important future issue.
Materials and Methods
Reagents and antibodies
HeLa cells stably expressing EB1‐GFP were provided by Y. Mimori‐Kiyosue 19. Wnt5a used in Fig 4C and E was purified from the conditioned medium of L cells stably expressing Wnt5a, as described previously 47. Fibronectin was purchased from Sigma‐Aldrich. All of the primary antibodies used are listed in Appendix Table S1. Rabbit polyclonal antibodies against Map7D1 were raised using recombinant GST fused with a region of Map7D1 (aa 529–803) as an antigen. Secondary antibodies coupled to horseradish peroxidase (HRP) were purchased from Sigma‐Aldrich. Alexa Fluor‐conjugated secondary antibodies used for immunofluorescence experiments were purchased from Thermo Fisher Scientific. Sequences of the siRNAs used in this study, except for those used for the siRNA‐based screen, are listed in Appendix Table S2. The short‐guide RNA (sgRNA) sequences used in this study are listed in Appendix Table S3. To generate EGFP‐ or V5‐tagged proteins, the CDS was cloned into pEGFP‐N3 (Clontech) or pcDNA3.1‐V5His6 (Thermo Fisher Scientific), respectively. The cDNA encoding hMAP7 was provided by the RIKEN BRC through the National Bio‐Resource Project of the MEXT, Japan 48, 49, 50, 51.
Cell culture and transfection
HeLa cells were maintained in DMEM (Wako) supplemented with 10% FBS and penicillin‐streptomycin. For cell staining and imaging, cells were seeded on fibronectin‐coated coverslips or glass‐bottom dishes. Cell transfection with plasmids and siRNAs was described previously 52. Transfectants with plasmid or siRNA were analyzed 24 h or 72 h post‐transfection, respectively. In Figs 4E and 5A, the cells were first transfected with siRNA and 2 days later with Flag‐Rac1CA. The cells were analyzed 24 h after the plasmid transfection.
Generation of Map7‐EGFP or Dvl2‐EGFP knock‐in HeLa cell lines by CRISPR‐Cas9
Two sgRNA sequences for each gene (Appendix Table S3) were designed using Jack Lin's CRISPR/Cas9 gRNA finder tool (http://spot.colorado.edu/~slin/cas9.html). The short double‐stranded DNA for each sgRNA was inserted into the BbsI site of pX330 17. To construct the Map7‐EGFP or Dvl2‐EGFP knock‐in vector, the 5′ and 3′ arms of each gene were amplified by PCR using HeLa genomic DNA and cloned into the pCR4 Blunt‐TOPO vector (Thermo Fisher Scientific). The 5′ arm of each gene was inserted in‐frame using multiple cloning sites, and the 3′ arm of each gene was blunted and then inserted into the blunted AflII site of pEGFP‐N3 in which the CMV promoter region had been deleted. HeLa cells were transfected with 1 μg of each of the two pX330‐sgRNA plasmids and the knock‐in vector using Lipofectamine 2000 (Thermo Fisher Scientific). Knock‐in clones were selected by adding G418 at 24 h post‐transfection. Successful targeting of EGFP into each gene was confirmed by immunoblotting using antibodies against GFP and each endogenous protein, genomic PCR, and the intracellular localization of GFP fluorescence.
Quantitative real‐time PCR analysis
The primer sequences for RT–qPCR are shown in Appendix Table S4. Total RNA was isolated using the RNeasy mini kit (Qiagen) and reverse‐transcribed to cDNA with MuLV reverse transcriptase (Thermo Fisher Scientific) and random hexamers (TaKaRa). RT–qPCR was carried out using SYBR green (Kapa Biosystems) on a ViiA 7 Real‐Time PCR system (Thermo Fisher Scientific), according to the manufacturer's instructions.
siRNA‐based screen
The experimental flow chart of the siRNA‐based screen is shown in Fig 1A. For 69 uncharacterized MT co‐sedimented proteins and their paralogs identified from rat brain extracts by mass spectrometry 15, we examined the expression level of each gene in HeLa cells. Twenty‐six of the 69 genes were expressed at detectable levels in HeLa cells (Appendix Fig S1). Because wound healing assays require a larger number of siRNA‐transfected cells, compared with cell spreading assays, we first conducted cell spreading assays, in which cell adhesion is evaluated by seeding cells onto a fibronectin‐coated glass‐bottom dish, and then counting the cells exhibiting lamellipodial extension 1 h later. The individual depletion of eight genes using pooled siRNAs was found to trigger blebbing and reduce the lamellipodial extension (Fig 1A and B; Appendix Fig S2A). These eight genes were then further analyzed by wound healing assays to measure the rate of cell migration. Of the eight genes, the individual depletion of 7 using pooled siRNAs caused slower migration, compared with control cells (Appendix Fig S2B). We also measured the depletion efficiency of three independent siRNAs against each of these seven genes by RT–qPCR (Appendix Fig S2C) and measured the migration rate of cells transfected separately with each effective siRNA (Fig 1A and C; Appendix Fig S2D). The siRNA sequences for the siRNA‐based screen are shown in Appendix Table S5.
Immunoblotting and immunoprecipitation
Immunoblotting and immunoprecipitation were performed as described 6, 52. Briefly, for immunoprecipitations between endogenous proteins, HeLa cells were washed once with PBS and lysed with lysis buffer [20 mM Tris–HCl (pH 7.5), 150 mM NaCl, 2 mM EGTA, 0.5% NP‐40] supplemented with protease inhibitors (1 mM phenylmethylsulfonylfluoride, 1 μg/ml leupeptin, and 1 μg/ml aprotinin) and phosphatase inhibitors (5 mM sodium fluoride, 1 mM sodium orthovanadate, and 10 mM β‐glycerophosphate) for 30 min on ice. The supernatant was collected after centrifugation and incubated with the appropriate antibody. After incubation, 15 μl of protein A or G Sepharose beads was added, and the mixtures were rotated for 1 h at 4°C. The beads were washed five times with lysis buffer and resuspended in Laemmli's sample buffer. For immunoprecipitations between exogenous proteins, at 24 h post‐transfection, the HeLa cells were washed once with PBS and lysed with 1× NP‐40 buffer [20 mM Tris–HCl (pH 8.0), 10% glycerol, 137 mM NaCl, 1% NP‐40] supplemented with protease inhibitors and phosphatase inhibitors for 20 min on ice. The supernatant was collected after centrifugation and incubated with the appropriate antibody. After incubation, 15 μl of protein A or G Sepharose beads was added, and the mixtures were rotated for 1 h at 4°C. The beads were washed once with 1× NP‐40 buffer, twice with LiCl buffer [0.1 M Tris–HCl (pH 7.5), 0.5 M LiCl], and once with 10 mM Tris–HCl (pH 7.5), and finally resuspended in Laemmli's sample buffer.
In vitro binding assay
In vitro binding assays were performed as described 53. pGEX‐2T/hDvl1DIX and pGEX‐2T/hDvl1DEP were generated by PCR‐mediated site‐directed mutagenesis using pGEX‐2T/hDvl11–282 and pGEX‐2T/hDvl1281–670 as a template, respectively. A cDNA fragment for hMap71–265ΔCC1 was cloned into pMAL‐C2X (New England Biolabs).
Immunofluorescence and imaging analyses
Immunofluorescence analyses in HeLa cells, Drosophila pupal wings, or mouse oviducts were performed as described 5, 6, 34, 37, 54. Confocal images were obtained and processed using FV1000, FV1200 (Olympus, Japan), or A1Rsi (Nikon, Japan). In Fig 5A and C, lamellipodial formation induced by the ectopic expression of Rac1CA was confirmed by z‐sectioning. Confocal time‐lapse imaging and FRAP analysis in HeLa cells were performed with an FV1200 equipped with GaAsP detectors and an incubator. For the time‐lapse imaging of cell spreading and wound healing assays, we used an inverted microscope system equipped with an incubator (LCV110; Olympus). For Fig 8C, confocal time‐lapse imaging was performed with FV3000 (Olympus, Japan). The planar polarization of Ens::EGFPKI was quantified with the method previously described 55. For Fig 9C, since the polarization of Dsh localization is most prominently observed at 30 h after pupal formation (APF), just before the onset of wing hair outgrowth 40, 42, we examined the localization of Dsh::GFP 40 in pupal wings at that time point. Images were processed and analyzed using Fiji software (National Institutes of Health).
Animals
Female mice (Slc:ICR; Japan SLC, Japan) were used in this study. Animal care and experiments were conducted in accordance with the Guidelines of Animal Experiment of the National Institutes of Natural Sciences. The experiments employed in this study were approved by the Institutional Animal Care and Use Committee of National Institutes of Natural Sciences. The animals were kept in a light and temperature controlled room with a 12‐h light/dark cycle at 22 ± 1°C.
Transient expression of hMap7‐EGFP or mMap7‐EGFP in multiciliated cells of the mouse oviduct epithelium by electroporation
Plasmids were introduced into mouse oviduct cells by electroporation as described 35 with several modifications. DNA solutions (1 μg/μl in TE buffer) were colored with Fast Green at a final concentration of 0.0025% and injected into the end of the oviduct at the ovarian side by blowing through a glass pipette. The oviduct was sandwiched between tweezer‐type electrodes (Nepagene), and five repeated square‐wave pulses (50 ms on, 50 ms off) at 20 V were applied by an electroporator (Nepagene). After changing the position of the electrode, the electric pulses were applied again. DNA was then injected again, and the set of electronic pulses was again applied twice. The skin was closed by wound clips (BD Biosciences). Four days later, oviduct samples were collected and opened longitudinally to analyze the fluorescent signal. After fixation with 4% paraformaldehyde in PBS, the samples were treated with 0.1% Triton X‐100 in PBS and stained by Texas Red‐X phalloidin (Thermo Fisher Scientific).
Fly strains
The fly strains used in this study are listed in Appendix Table S6. Fly stocks were maintained on standard food at 25°C.
Generation of ens null mutants or Ens::EGFP knock‐in fly strains by the CRISPR‐Cas9 gene‐editing technique
Two sgRNA sequences of ens were designed using the CRISPR Optimal Target Finder 56 (Appendix Table S3). The short double‐stranded DNA for each sgRNA was inserted into the BbsI site of pDCC6 57. To generate ens null mutants, the pDCC6‐based plasmids (150 ng/μl in distilled water) were microinjected into embryos derived from y w females crossed with w; P{neoFRT}80B males. To screen for knocked‐out lines, four F0 males or females were grouped, crossed with w; TM3 Ser Sb/TM6B Tb, and cultured in the presence of G418. About 10 F1 progeny from each vial were used to prepare genomic DNA. The 559‐bp genomic region containing sgRNA target sites was PCR amplified using primers 5′‐AGAGCACACCACTATACAACAGTACGGTCG‐3′ and 5′‐GAAGCGAGAGAGACAGTGAGAAGTACGAGA‐3′. The T7 endonuclease I (T7EI) assay was performed as described 58. Males from positive vials were individually crossed with w; TM3 Ser Sb/TM6B Tb females for a few days, and then, T7EI assays were performed for the genomic DNA from each male. Whether the identified indels caused a frame‐shift mutation was confirmed by subjecting PCR fragments of the target region to DNA sequencing.
To construct the Ens::EGFP knock‐in vector, the 5′ and 3′ arms of ens were amplified by PCR using genomic DNA from the y w strain and directly cloned into the pCR4 Blunt‐TOPO vector (Thermo Fisher Scientific). The 5′ arm of ens was inserted in‐frame at the EcoRV and SalI sites, and the 3′ arm of ens was inserted at the NotI and AflII sites of a modified pEGFP‐N3, from which both the CMV promoter region and the SV40 polyadenylation signal had been removed. The pDCC6‐based plasmids and knock‐in vector constructs were mixed (150 ng/μl each) and microinjected into y w embryos. To isolate knocked‐in fly lines, individual F1 progeny were crossed with w; TM3 Ser Sb/TM6B Tb for a few days, and then, their genomic DNAs were PCR amplified using two sets of primers 5′‐GATGAGGGCAATGAGAAGGAGGTTCCTAAG‐3′ and 5′‐ACAGCTCCTCGCCCTTGCTCAC‐3′ (EGFP 25‐4), and 5′‐CCTTATCGAGAGGTTCTTGCAGCAGCATTC‐3′ and 5′‐TCGGCATGGACGAGCTGTACAAG‐3′ (EGFP 695‐717). Flies that were positive for both primer sets were established as homozygous stocks, and examined for the expression patterns of GFP fluorescence.
Statistics
The experiments were performed at least three times (biological replication), and the results were expressed as the average ± SD or the median ± SD, except for Fig 7. In Fig 7, the results were expressed as the median (circles) and the interquartile range (the interval from the 1st quartile to the 3rd quartile). Differences between data values were tested for statistical significance using the Student's t‐test, except for the analysis of the vector angle of the EB1‐GFP comets, in which P‐values were calculated using the Mardia‐Watson‐Wheeler test 34. P‐values < 0.05 were considered statistically significant.
Author contributions
KK designed the research and carried out most of the experiments, except for Fig 8B and Appendix Fig S9B. AN carried out the plasmid injection into Drosophila embryos. MA provided technical assistance for the immunofluorescence analysis using Drosophila pupal wings. DS provided technical assistance for the immunofluorescence analysis using the mouse oviduct epithelium. MN carried out the electroporation experiments in Fig 8B. TT provided technical assistance for maintaining the fly stocks and generating fly strains by mating, and carried out the immunofluorescence analysis in Appendix Fig S9B. AU and HN raised the rabbit polyclonal anti‐Map7D1 antibodies. MA, DS, AN, TU, TF, AK, YS, and HN provided reagents, materials, and analysis tools. KK and AN wrote the paper, and MA, TU, TF, AK, and HN edited the paper. All of the authors discussed the results and commented on the manuscript.
Conflict of interest
The authors declare that they have no conflict of interest.
Supporting information
Appendix
Expanded View Figures PDF
Movie EV1
Movie EV2
Movie EV3
Movie EV4
Movie EV5
Movie EV6
Movie EV7
Movie EV8
Movie EV9
Movie EV10
Movie EV11
Movie EV12
Movie EV13
Review Process FIle
Source Data for Figure 1
Source Data for Figure 2
Source Data for Figure 3
Source Data for Figure 4
Source Data for Figure 5
Source Data for Figure 7
Source Data for Figure 8
Source Data for Figure 9
Acknowledgements
We thank Drs. Y. Mimori‐Kiyosue, T. Otani, S. Ohsawa, J.D. Axelrod, and Y. Minami for donating HeLa cells stably expressing EB1‐GFP, the Ubx‐Flp fly strain, the Ubi‐mRFP fly strain, the fly strain stably expressing Dsh::GFP, and plasmids, and our laboratory members for helpful discussions. This work was partly carried out at the Institute of Molecular Embryology and Genetics, the Gene Technology Centre, and Research Facilities of the School of Medicine, Kumamoto University. This work was supported by JSPS KAKENHI Grant Numbers 22700881, 24700980, 15K07054, and JP16H06280, grants from the Mochida Memorial Foundation, the Takeda Science Foundation, the Uehara Memorial Foundation, and the program of the Joint Usage/Research Centre for Developmental Medicine, Institute of Molecular Embryology and Genetics, Kumamoto University (to K.K.), and JSPS KAKENHI 25650088, 15K14530, and 17H03686 (to A.N.).
EMBO Reports (2018) 19: e45471
Contributor Information
Koji Kikuchi, Email: kojik@kumamoto-u.ac.jp.
Hiroyuki Nakanishi, Email: hnakanis@gpo.kumamoto-u.ac.jp.
References
- 1. Loh KM, van Amerongen R, Nusse R (2016) Generating cellular diversity and spatial form: wnt signaling and the evolution of multicellular animals. Dev Cell 38: 643–655 [DOI] [PubMed] [Google Scholar]
- 2. Kikuchi A, Yamamoto H, Sato A, Matsumoto S (2012) Wnt5a: its signalling, functions and implication in diseases. Acta Physiol 204: 17–33 [DOI] [PubMed] [Google Scholar]
- 3. Angers S, Moon RT (2009) Proximal events in Wnt signal transduction. Nat Rev Mol Cell Biol 10: 468–477 [DOI] [PubMed] [Google Scholar]
- 4. Gray RS, Roszko I, Solnica‐Krezel L (2011) Planar cell polarity: coordinating morphogenetic cell behaviors with embryonic polarity. Dev Cell 21: 120 [DOI] [PMC free article] [PubMed] [Google Scholar]
- 5. Fumoto K, Kikuchi K, Gon H, Kikuchi A (2012) Wnt5a signaling controls cytokinesis by correctly positioning ESCRT‐III at the midbody. J Cell Sci 125: 4822–4832 [DOI] [PubMed] [Google Scholar]
- 6. Matsumoto S, Fumoto K, Okamoto T, Kaibuchi K, Kikuchi A (2010) Binding of APC and dishevelled mediates Wnt5a‐regulated focal adhesion dynamics in migrating cells. EMBO J 29: 1192–1204 [DOI] [PMC free article] [PubMed] [Google Scholar]
- 7. Schlessinger K, McManus EJ, Hall A (2007) Cdc42 and noncanonical Wnt signal transduction pathways cooperate to promote cell polarity. J Cell Biol 178: 355–361 [DOI] [PMC free article] [PubMed] [Google Scholar]
- 8. Vladar EK, Bayly RD, Sangoram AM, Scott MP, Axelrod JD (2012) Microtubules enable the planar cell polarity of airway cilia. Curr Biol 22: 2203–2212 [DOI] [PMC free article] [PubMed] [Google Scholar]
- 9. Akhmanova A, Steinmetz MO (2008) Tracking the ends: a dynamic protein network controls the fate of microtubule tips. Nat Rev Mol Cell Biol 9: 309–322 [DOI] [PubMed] [Google Scholar]
- 10. Alfaro‐Aco R, Petry S (2015) Building the microtubule cytoskeleton piece by piece. J Biol Chem 290: 17154–17162 [DOI] [PMC free article] [PubMed] [Google Scholar]
- 11. Nishita M, Yoo SK, Nomachi A, Kani S, Sougawa N, Ohta Y, Takada S, Kikuchi A, Minami Y (2006) Filopodia formation mediated by receptor tyrosine kinase Ror2 is required for Wnt5a‐induced cell migration. J Cell Biol 175: 555–562 [DOI] [PMC free article] [PubMed] [Google Scholar]
- 12. Nomachi A, Nishita M, Inaba D, Enomoto M, Hamasaki M, Minami Y (2008) Receptor tyrosine kinase Ror2 mediates Wnt5a‐induced polarized cell migration by activating c‐Jun N‐terminal kinase via actin‐binding protein filamin A. J Biol Chem 283: 27973–27981 [DOI] [PubMed] [Google Scholar]
- 13. Qian D, Jones C, Rzadzinska A, Mark S, Zhang X, Steel KP, Dai X, Chen P (2007) Wnt5a functions in planar cell polarity regulation in mice. Dev Biol 306: 121–133 [DOI] [PMC free article] [PubMed] [Google Scholar]
- 14. Metzger T, Gache V, Xu M, Cadot B, Folker ES, Richardson BE, Gomes ER, Baylies MK (2012) MAP and kinesin‐dependent nuclear positioning is required for skeletal muscle function. Nature 484: 120–124 [DOI] [PMC free article] [PubMed] [Google Scholar]
- 15. Sakamoto T, Uezu A, Kawauchi S, Kuramoto T, Makino K, Umeda K, Araki N, Baba H, Nakanishi H (2008) Mass spectrometric analysis of microtubule co‐sedimented proteins from rat brain. Genes Cells 13: 295–312 [DOI] [PubMed] [Google Scholar]
- 16. Masson D, Kreis TE (1993) Identification and molecular characterization of E‐MAP‐115, a novel microtubule‐associated protein predominantly expressed in epithelial cells. J Cell Biol 123: 357–371 [DOI] [PMC free article] [PubMed] [Google Scholar]
- 17. Cong L, Ran FA, Cox D, Lin S, Barretto R, Habib N, Hsu PD, Wu X, Jiang W, Marraffini LA et al (2013) Multiplex genome engineering using CRISPR/Cas systems. Science 339: 819–823 [DOI] [PMC free article] [PubMed] [Google Scholar]
- 18. Mali P, Yang L, Esvelt KM, Aach J, Guell M, DiCarlo JE, Norville JE, Church GM (2013) RNA‐guided human genome engineering via Cas9. Science 339: 823–826 [DOI] [PMC free article] [PubMed] [Google Scholar]
- 19. Mimori‐Kiyosue Y, Shiina N, Tsukita S (2000) The dynamic behavior of the APC‐binding protein EB1 on the distal ends of microtubules. Curr Biol 10: 865–868 [DOI] [PubMed] [Google Scholar]
- 20. Bisi S, Disanza A, Malinverno C, Frittoli E, Palamidessi A, Scita G (2013) Membrane and actin dynamics interplay at lamellipodia leading edge. Curr Opin Cell Biol 25: 565–573 [DOI] [PubMed] [Google Scholar]
- 21. Schober JM, Komarova YA, Chaga OY, Akhmanova A, Borisy GG (2007) Microtubule‐targeting‐dependent reorganization of filopodia. J Cell Sci 120: 1235–1244 [DOI] [PubMed] [Google Scholar]
- 22. Mattila PK, Lappalainen P (2008) Filopodia: molecular architecture and cellular functions. Nat Rev Mol Cell Biol 9: 446–454 [DOI] [PubMed] [Google Scholar]
- 23. Ezratty EJ, Partridge MA, Gundersen GG (2005) Microtubule‐induced focal adhesion disassembly is mediated by dynamin and focal adhesion kinase. Nat Cell Biol 7: 581–590 [DOI] [PubMed] [Google Scholar]
- 24. Sato A, Yamamoto H, Sakane H, Koyama H, Kikuchi A (2010) Wnt5a regulates distinct signalling pathways by binding to Frizzled2. EMBO J 29: 41–54 [DOI] [PMC free article] [PubMed] [Google Scholar]
- 25. Gammons MV, Rutherford TJ, Steinhart Z, Angers S, Bienz M (2016) Essential role of the Dishevelled DEP domain in a Wnt‐dependent human‐cell‐based complementation assay. J Cell Sci 129: 3892–3902 [DOI] [PMC free article] [PubMed] [Google Scholar]
- 26. Nishita M, Itsukushima S, Nomachi A, Endo M, Wang Z, Inaba D, Qiao S, Takada S, Kikuchi A, Minami Y (2010) Ror2/Frizzled complex mediates Wnt5a‐induced AP‐1 activation by regulating Dishevelled polymerization. Mol Cell Biol 30: 3610–3619 [DOI] [PMC free article] [PubMed] [Google Scholar]
- 27. Paclikova P, Bernatik O, Radaszkiewicz TW, Bryja V (2017) N‐terminal part of Dishevelled DEP domain is required for Wnt/beta‐catenin signaling in mammalian cells. Mol Cell Biol 37: e00145–17 [DOI] [PMC free article] [PubMed] [Google Scholar]
- 28. Yu A, Rual JF, Tamai K, Harada Y, Vidal M, He X, Kirchhausen T (2007) Association of Dishevelled with the clathrin AP‐2 adaptor is required for Frizzled endocytosis and planar cell polarity signaling. Dev Cell 12: 129–141 [DOI] [PMC free article] [PubMed] [Google Scholar]
- 29. Capelluto DG, Kutateladze TG, Habas R, Finkielstein CV, He X, Overduin M (2002) The DIX domain targets dishevelled to actin stress fibres and vesicular membranes. Nature 419: 726–729 [DOI] [PubMed] [Google Scholar]
- 30. Ishida‐Takagishi M, Enomoto A, Asai N, Ushida K, Watanabe T, Hashimoto T, Kato T, Weng L, Matsumoto S, Asai M et al (2012) The Dishevelled‐associating protein Daple controls the non‐canonical Wnt/Rac pathway and cell motility. Nat Commun 3: 859 [DOI] [PubMed] [Google Scholar]
- 31. Small JV, Kaverina I (2003) Microtubules meet substrate adhesions to arrange cell polarity. Curr Opin Cell Biol 15: 40–47 [DOI] [PubMed] [Google Scholar]
- 32. Watanabe T, Wang S, Noritake J, Sato K, Fukata M, Takefuji M, Nakagawa M, Izumi N, Akiyama T, Kaibuchi K (2004) Interaction with IQGAP1 links APC to Rac1, Cdc42, and actin filaments during cell polarization and migration. Dev Cell 7: 871–883 [DOI] [PubMed] [Google Scholar]
- 33. Butler MT, Wallingford JB (2017) Planar cell polarity in development and disease. Nat Rev Mol Cell Biol 18: 375–388 [DOI] [PMC free article] [PubMed] [Google Scholar]
- 34. Shi D, Komatsu K, Hirao M, Toyooka Y, Koyama H, Tissir F, Goffinet AM, Uemura T, Fujimori T (2014) Celsr1 is required for the generation of polarity at multiple levels of the mouse oviduct. Development 141: 4558–4568 [DOI] [PubMed] [Google Scholar]
- 35. Shi D, Usami F, Komatsu K, Oka S, Abe T, Uemura T, Fujimori T (2016) Dynamics of planar cell polarity protein Vangl2 in the mouse oviduct epithelium. Mech Dev 141: 78–89 [DOI] [PubMed] [Google Scholar]
- 36. Sung HH, Telley IA, Papadaki P, Ephrussi A, Surrey T, Rørth P (2008) Drosophila ensconsin promotes productive recruitment of Kinesin‐1 to microtubules. Dev Cell 15: 866–876 [DOI] [PubMed] [Google Scholar]
- 37. Shimada Y, Yonemura S, Ohkura H, Strutt D, Uemura T (2006) Polarized transport of Frizzled along the planar microtubule arrays in Drosophila wing epithelium. Dev Cell 10: 209–222 [DOI] [PubMed] [Google Scholar]
- 38. Clark IE, Jan LY, Jan YN (1997) Reciprocal localization of Nod and kinesin fusion proteins indicates microtubule polarity in the Drosophila oocyte, epithelium, neuron and muscle. Development 124: 461–470 [DOI] [PubMed] [Google Scholar]
- 39. Barlan K, Lu W, Gelfand VI (2013) The microtubule‐binding protein ensconsin is an essential cofactor of kinesin‐1. Curr Biol 23: 317–322 [DOI] [PMC free article] [PubMed] [Google Scholar]
- 40. Axelrod JD (2001) Unipolar membrane association of Dishevelled mediates Frizzled planar cell polarity signaling. Genes Dev 15: 1182–1187 [DOI] [PMC free article] [PubMed] [Google Scholar]
- 41. Matis M, Russler‐Germain DA, Hu Q, Tomlin CJ, Axelrod JD (2014) Microtubules provide directional information for core PCP function. Elife 3: e02893 [DOI] [PMC free article] [PubMed] [Google Scholar]
- 42. Shimada Y, Usui T, Yanagawa S, Takeichi M, Uemura T (2001) Asymmetric colocalization of Flamingo, a seven‐pass transmembrane cadherin, and Dishevelled in planar cell polarization. Curr Biol 11: 859–863 [DOI] [PubMed] [Google Scholar]
- 43. Hirokawa N (1994) Microtubule organization and dynamics dependent on microtubule‐associated proteins. Curr Opin Cell Biol 6: 74–81 [DOI] [PubMed] [Google Scholar]
- 44. Dehmelt L, Halpain S (2005) The MAP2/Tau family of microtubule‐associated proteins. Genome Biol 6: 204 [DOI] [PMC free article] [PubMed] [Google Scholar]
- 45. Tala, Sun X, Chen J, Zhang L, Liu N, Zhou J, Li D, Liu M (2014) Microtubule stabilization by Mdp3 is partially attributed to its modulation of HDAC6 in addition to its association with tubulin and microtubules. PLoS One 9: e90932 [DOI] [PMC free article] [PubMed] [Google Scholar]
- 46. Yang Y, Mlodzik M (2015) Wnt‐Frizzled/planar cell polarity signaling: cellular orientation by facing the wind (Wnt). Annu Rev Cell Dev Biol 31: 623–646 [DOI] [PMC free article] [PubMed] [Google Scholar]
- 47. Kurayoshi M, Yamamoto H, Izumi S, Kikuchi A (2007) Post‐translational palmitoylation and glycosylation of Wnt‐5a are necessary for its signalling. Biochem J 402: 515–523 [DOI] [PMC free article] [PubMed] [Google Scholar]
- 48. Ota T, Suzuki Y, Nishikawa T, Otsuki T, Sugiyama T, Irie R, Wakamatsu A, Hayashi K, Sato H, Nagai K et al (2004) Complete sequencing and characterization of 21,243 full‐length human cDNAs. Nat Genet 36: 40–45 [DOI] [PubMed] [Google Scholar]
- 49. Otsuki T, Ota T, Nishikawa T, Hayashi K, Suzuki Y, Yamamoto J, Wakamatsu A, Kimura K, Sakamoto K, Hatano N et al (2005) Signal sequence and keyword trap in silico for selection of full‐length human cDNAs encoding secretion or membrane proteins from oligo‐capped cDNA libraries. DNA Res 12: 117–126 [DOI] [PubMed] [Google Scholar]
- 50. Kimura K, Wakamatsu A, Suzuki Y, Ota T, Nishikawa T, Yamashita R, Yamamoto J, Sekine M, Tsuritani K, Wakaguri H et al (2006) Diversification of transcriptional modulation: large‐scale identification and characterization of putative alternative promoters of human genes. Genome Res 16: 55–65 [DOI] [PMC free article] [PubMed] [Google Scholar]
- 51. Itoh M, Yasunishi A, Imamura K, Kanamori‐Katayama M, Suzuki H, Suzuki M, Carninci P, Kawai J, Hayashizaki Y (2006) Constructing ORFeome resources with removable termination codons. Biotechniques 41: 44–48 [DOI] [PubMed] [Google Scholar]
- 52. Kikuchi K, Niikura Y, Kitagawa K, Kikuchi A (2010) Dishevelled, a Wnt signalling component, is involved in mitotic progression in cooperation with Plk1. EMBO J 29: 3470–3483 [DOI] [PMC free article] [PubMed] [Google Scholar]
- 53. Kishida S, Yamamoto H, Hino S, Ikeda S, Kishida M, Kikuchi A (1999) DIX domains of Dvl and axin are necessary for protein interactions and their ability to regulate beta‐catenin stability. Mol Cell Biol 19: 4414–4422 [DOI] [PMC free article] [PubMed] [Google Scholar]
- 54. Harumoto T, Ito M, Shimada Y, Kobayashi TJ, Ueda HR, Lu B, Uemura T (2010) Atypical cadherins Dachsous and Fat control dynamics of noncentrosomal microtubules in planar cell polarity. Dev Cell 19: 389–401 [DOI] [PMC free article] [PubMed] [Google Scholar]
- 55. Arata M, Sugimura K, Uemura T (2017) Difference in dachsous levels between migrating cells coordinates the direction of collective cell migration. Dev Cell 42: 479–497.e410 [DOI] [PubMed] [Google Scholar]
- 56. Gratz SJ, Ukken FP, Rubinstein CD, Thiede G, Donohue LK, Cummings AM, O'Connor‐Giles KM (2014) Highly specific and efficient CRISPR/Cas9‐catalyzed homology‐directed repair in Drosophila . Genetics 196: 961–971 [DOI] [PMC free article] [PubMed] [Google Scholar]
- 57. Gokcezade J, Sienski G, Duchek P (2014) Efficient CRISPR/Cas9 plasmids for rapid and versatile genome editing in Drosophila . G3 (Bethesda) 4: 2279–2282 [DOI] [PMC free article] [PubMed] [Google Scholar]
- 58. Reyon D, Tsai SQ, Khayter C, Foden JA, Sander JD, Joung JK (2012) FLASH assembly of TALENs for high‐throughput genome editing. Nat Biotechnol 30: 460–465 [DOI] [PMC free article] [PubMed] [Google Scholar]
Associated Data
This section collects any data citations, data availability statements, or supplementary materials included in this article.
Supplementary Materials
Appendix
Expanded View Figures PDF
Movie EV1
Movie EV2
Movie EV3
Movie EV4
Movie EV5
Movie EV6
Movie EV7
Movie EV8
Movie EV9
Movie EV10
Movie EV11
Movie EV12
Movie EV13
Review Process FIle
Source Data for Figure 1
Source Data for Figure 2
Source Data for Figure 3
Source Data for Figure 4
Source Data for Figure 5
Source Data for Figure 7
Source Data for Figure 8
Source Data for Figure 9