

Abstract
Variable antigens are large proteins located on the outer membrane of parasitic but also of free-living protists. Multigene families encoding surface antigens demonstrate an exclusive expression of proteins. The resulting presence of just one protein species on the cell surface is required for surface antigen function; therefore, the molecular mechanism of exclusive expression is of main interest. Regulation of gene expression and mechanisms establishing switching of antigens are hardly understood in any organism. Here we report on the reaction of Paramecium to the artificial knock down of surface antigen 51A expression by bacteria-mediated RNAi. This technique involves the feeding of dsRNA-producing bacteria. We analyzed different fragments of the target gene for dsRNA template regarding their specific knock down efficiency and found great differences. Treatment of Paramecia with RNAi against the 51A antigen demonstrated that although a massive amount of mRNA was present, the protein was not detected on the cell surface. Moreover, a minor abundance of 51D transcripts resulted in an exclusive presence of 51D proteins on the cell surface. This posttranscriptional regulation was confirmed by the transcript ratio (51A/51D) determined by real-time (RT) PCR of single cells. Because we were able to document unexclusive transcription also in wild-type cells our results indicate that this posttranscriptional regulation is a main factor of enabling exclusive gene expression. The comparison of serotype shifts, caused by efficient and inefficient knock down, indicates an involvement of full-length transcripts in regulation of gene expression. Thus, our study gives new insights into the mechanism of exclusive expression on the molecular level: (i) exclusive transcription does not occur, (ii) posttranscriptional regulation is a powerful factor enabling exclusive antigen expression, and (iii) surface antigen mRNA is shown to be involved in this mechanism in a regulating way.
Key words: Variable antigens, Exclusive expression, Posttranscriptional regulation, Silencing efficiency
INTRODUCTION
The free-living ciliate Paramecium undergoes antigenic variation and many investigations have focused on “surface antigens” since their discovery by Rössle in 1905. Eleven different antigens are known to be expressed in P. tetraurelia stock 51 (named by letter in addition to the stock: e.g., 51A, 51B, 51C, 51D) but sequencing of the Paramecium’s macronuclear genome suggested that the multigene family contains several more members than expected (29). According to the definition of antigenic variation surface antigens are expressed in a mutually exclusive way: only one antigen is present on the cell surface at a time, which defines the so-called serotype. Cells are able to shift from one serotype to another in response to environmental changes and a coexistence of the “new” and “old” antigen was demonstrated only for a short period during a temperature-induced shift (2). All sequenced members of the gene family share specific features, especially the large size, which ranges from 6.7 to 8.5 kb and the genes are not linked to each other [reviewed in (7)].
In spite of the long time antigens have been studied in Paramecium, their function in this free-living ciliate is unknown. For parasitic protozoa, like Plasmodium or Trypanosoma, variable surface antigens were described to be essential because antigenic change enables evasion from the host’s immune system (3,8). Even though Paramecium’s live strategy is not parasitic, parallels of the serotype systems were shown: common features are GPI anchors and high quantity of internal repeats of the proteins. These repeats were demonstrated to play a special role in serotype function in Paramecium as they contain the immunologically effective epitopes (6,19,28). Common protein structures in Trypanosoma and Paramecium (4) and the identification of a unique epitope in antigens of Paramecium and merozoite surface proteins of Plasmodium (26) highlight the relationship between antigens of protists. Most relevant for research is the phenomenon of mutual exclusive expression: shown for (i) var genes of Plasmodium, (ii) VSGs of Trypanosoma, (iii) VSPs in Giardia, and (iv) for the multigene family in Paramecium.
Recent knowledge of surface antigens lacks detailed information about the expression mechanism. Since their discovery, serotypes have been reported to stabilize their own expression by an unknown mechanism [reviewed in (17)]. By injection of chimerical gene constructs the 5′ coding regions were demonstrated to be at least one element in mutually exclusive expression as constructs with identical 5′ regions were coexpressed (18). Gilley et al. (13) demonstrated transcriptional regulation for the surface antigens 51A and 51H but in the same study they described posttranscriptional regulation of surface antigen 51C, because the 51C gene was reported to produce full-length mRNA that was not translated in 51H cultures.
This shows that only parts of the puzzle explaining mutually exclusive expression and self-stabilization are known until now. In this study, we used RNAi to analyze regulating levels of a serotype shift. Bacteria-mediated RNAi means transformation of plasmids into an E. coli strain allowing dsRNA production and enrichment. This method was successfully adapted for Paramecium (11) and recently the knock down of surface antigens in Paramecium and Trypanosoma was reported to lead to serotype switching (1,12). Appliance of RNAi to surface antigens needs consideration about the similarities between the genes. Open reading frames show great homologies, especially in their 5′ and 3′ coding regions but the central parts differ more. A comparison of the surface antigens 51A and 51B showed identities of 88% in the 3′ region but only of 59% in the central part (25). Not all of the genes have such high similarities; 51B and 51C, for example, show 62% identity maximum, so it has to be considered which genes may be “cosilenced” in an experiment.
Knocking down serotype 51A of P. tetraurelia, phenotypic changes in antigen expression were analyzed for temporal progression, localization of antigens, and mRNA abundances. This first molecular study of a serotype shift yields general information about the molecular base of exclusive expression and reveals parallels in the regulation of exclusive expression to parasites.
MATERIALS AND METHODS
Target Sequences, Plasmid Construction, and Characteristics
RNAi experiments were performed with three different clones of feeding bacteria. For construction of feeding vectors, PCR products of target sequences of genes 51A and 156G were produced, subcloned into the double T7-Vector LITMUS 38i (NEB, Beverly, MA) and transformed into the RNAseIII-deficient E. coli strain HT115DE3 with an IPTG-inducible T7 polymerase. The fragment locations within the genes were chosen as follows: 156G-340: 22–339; 51A-647: 2362–3008, and 51A-700: 7458–8154. They are indicated in the following by 340, 647, and 700 due to their size in nucleotides. Plasmid 647 contained a fragment of the central region of the A gene, and plasmid 700 a fragment of the 3′ region, based on sequence analysis we used to compare sequences by the calculation of complementary siRNAs. Plasmid 340 included a fragment of the 156G serotype gene, whose sequence is extremely similar to the 51A gene in the 5′ region, sharing 16 possible siRNAs (23mers) with the A gene (Table 1). Due to their size, fragments 647 and 700 were able to produce many more possible homologous siRNAs.
TABLE 1.
NUMBER OF POSSIBLE siRNAs OF THE THREE SILENCING FRAGMENTS
| 51A | 51B | 51C | 51D | 51G | |
|---|---|---|---|---|---|
| 340 | 16 | 21 | 0 | 0 | 30 |
| 647 | 625 | 0 | 0 | 0 | 0 |
| 700 | 675 | 0 | 0 | 0 | 11 |
The number of possible siRNAs [23mers, according to Garnier et al. (12)] of the three used silencing fragments (340, 647, and 700) for different members of the surface antigen multigene family of P. tetraurelia stock 51 is demonstrated. The sequence analysis included the multicloning site of the double-T7 vector, which is also transcribed. Fragment 340 is the only one able to produce homologous siRNAs to 51B; surface antigen 51G should also be affected by fragments 340 and 700; serotype C and D cannot be affected in expression by any fragment.
Bacteria-Mediated RNAi
Twenty-five milliliters of LB-Medium (+100 μg/ml ampicillin) were inoculated with 250 μl preculture of feeding clones and were incubated shaking at 37°C. To induce dsRNA production 0.5 mM IPTG wae added when the culture reached OD595 0.4 and 3 h later bacteria were separated from the medium by centrifugation for 15 min at 3000 × g. They were then transferred into 250 ml of WGP medium (wheat grass powder) complemented with 100 μg/ml ampicillin, 0.5 mM IPTG, and 0.8 mg/L β-sitosterol. Paramecia were washed twice in Volvic™ and set into this medium, which was renewed daily over 5 days. As a negative control (i) HT115DE3 bacteria transformed with the empty LITMUS 38i vector and (ii) E. coli SURE® (Stratagene, La Jolla, CA) containing the plasmids with surface antigen sequences were fed to Paramecia the same way, never resulting in any phenotype.
Total RNA Extraction, RT and Quantitative PCR From Cell Cultures
RNA was extracted from 25 ml cell culture containing about 4,000 cells/ml using the Nucleo Spin RNA II Kit (Machery-Nagel, Dueren, Germany). RNA purity was verified by OD260/OD280 > 1.95. Reverse transcription of 500 ng total RNA was carried out with 100 U M-MuLV H- reverse transcriptase (Finnzymes, Espoo, Finnland), 1 U RNAse inhibitor (Roche, Mannheim, Germany), 0.25 μl oligo-dT-primer (0.25 μg), 0.5 μl dNTP-Mix (10 mM each), 1 μl RT reaction buffer (500 mM Tris-HCl, pH 8.3, 30 mM MgCl2, 750 mM KCl, 100 mM DTT), in a total reaction volume of 10 μl. Enzymes were added to the mixture after denaturation at 70°C (5 min) and transferred to ice. After primer annealing at 37°C (5 min), cDNA synthesis was performed at 42°C for 1 h. Then 0.45 ng of the produced cDNA was added for template in real-time PCR using a Light Cycler™ 3 (Roche, Mannheim, Germany) with 0.5 μl specific primers (25 mM) in a 20-μl reaction volume using the QuantiTect™ SYBR® Green Kit (Qiagen, Hilden, Germany). Primer sequences were chosen from the central region of genes, showing the lowest degree of similarity: 51A: 5′-TGGTTCCGATTGCGTACGTTT-3′, 5′-GCAGTGCCAGCAGCATTAACA-3′; 51D-α: 5′-TGAAAATATTCCAAGCCCAACCA-3′,5′-TGTTGCAGCAGCAAGAGCAG-3′; GAPDH: 5′-GAGAGCCGGAAGAGCTGCTA-3′, 5′-TGGTTGGAACTCTGAAGGCCATA-3′. The following amplification program was repeated 60 times: 95°C for 15 s, 62°C for 10 s, 72°C for 10 s, and for each RNA sample control PCRs were carried out from reactions lacking RT enzyme to rule out DNA contaminations. Fluorescence data analysis was done with the Light Cycler™ Software using the Second Derivate Maximum Method. Furthermore, melting curves for each PCR product were performed, resulting in constant values: 79.54 ± 0.06°C (51A); 77.32 ± 0.11°C (51D); 81.82 ± 0.08°C (GAPDH). Additionally, specificity of PCR products was determined on a Bioanalyzer 2100 using a DNA 1000 Lab Chip® (both Agilent, Palo Alto, CA) and by sequencing. For the calculation of real-time data a modified method according to Pfaffl (22) was necessary. Amplification efficiencies, determined by a dilution series of cDNA, resulted in the following values, calculated according to E = 10[1–slope]: E A = 1.97, E D = 1.83, and E GAPDH = 1.91. GAPDH was found to be constantly expressed by comparable CP values in all samples. Quantitative data from serotype genes were set in relation to GAPDH by (E A/D)ΔCP(A/D−GAPDH). Quantitative analysis of transcripts was carried out three times per feeding fragment.
Poly (A+) RNA Preparation, RT and Real-Time PCR From Single Cells
For isolation of messenger RNA from single cells 0.2 μl oligo-dT-probe (Roche, Mannheim, Germany), 1 U RNAse inhibitor from human placenta (Roche, Mannheim, Germany) and 5 mM DTT were set into a 1.5-ml RNAse-free tube (Eppendorf, Hamburg, Germany). A single cell was washed three times in sterile filtered Volvic™ using chloroform-washed depression slides. This cell was also transferred in a volume of 1 μl to the 1.5-ml tube, avoiding a mixture of reagents. Lysis was initiated by adding 18.5 μl lysis buffer (Roche, Mannheim, Germany) The mixture was transferred to a streptavidin-coated reaction tube (Roche) and incubated at 37°C for 10 min to establish binding of the probe and the attachment of biotin/streptavidin. The tube was rinsed three times with washing buffer and dried tubes were stored at −20°C. RT-reaction buffer (2.1 μl) (500 mM Tris-HCl, pH 8.3, 30 mM MgCl2, 750 mM KCl, 100 mM DTT), 1 μl dNTP mix (10 mM each), 1 μl oligo-dT-primer (0.5 μg), and 14 μl RNAse-free water were added to the dried streptavidin-coated tube and captured RNA was denaturized by heating to 70°C for 5 min and immediate transfer into ice-cold water. After complementing the mixture to 21 μl with 1 U RNAse inhibitor (Roche, Mannheim, Germany) and 180 U M-MuLV H- reverse transcriptase (Finnzymes, Espoo, Finnland), primer annealing was induced at 37°C (5 min) and cDNA synthesis was performed at 42°C for 1 h. We used 7 μl cDNA as template in standard real-time PCR. Specific primers (0.5 μl) for target genes (51A, 51D-α, GAPDH) (25 pM), 2 μl water, and 10 μl 2× QuantiTect™ SYBR® Green MasterMix (Qiagen, Hilden, Germany) were added. CP values of serotype genes were set in relation to GAPDH using the same mathematical relation as described above.
Isolation of dsRNA From Synchronous Bacteria Cultures
LB-medium (15 ml) (+100 μg/ml ampicillin) inoculated with 150 μl preculture was incubated shaking at 37°C. IPTG (0.5 mM) was added at OD595 0.4 and incubation was continued. To isolate dsRNA from equivalent amounts, bacteria were harvested at OD595 1.1 and put on ice to avoid further growth and dsRNA production. They were centrifuged at 0°C for 15 min at 3000 × g and resuspended in 750 μl TE buffer (10 mM Tris, 1 mM EDTA, pH 7.5). Hot phenol/chloroform (750 μl) (Roth, Karlsruhe, Germany) (80°C) was added, the sample was mixed carefully, and temperature was maintained for 10 min. After centrifugation (3000 × g, 1 min) the aqueous phase was transferred and nucleic acids were precipitated with 1 vol isopropanol (0.8 M LiCl) and resuspended in 100 μl 25 mM Tris, 50 mM NaCl, 5 mM MgCl2, 0.5 mM DTT. Equal volumes (18 μl) were digested with DNAse I (0.16 μg) and RNAse A (0.55 μg) and dsRNA was identified by insensitivity to DNAse I and insensitivity to RNAse A under those low salt conditions. Each sample (10 μl) was loaded on a 1.8% agarose gel.
Indirect Immunofluorescence Staining of Surface Proteins
Paramecia culture (50 ml) was centrifuged at 3000 × g (1 min) and after washing twice in Volvic™ cells were fixed in paraformaldehyde [4% in phosphate-buffered saline (PBS): 0.137 M NaCl, 2.68 mM KCl, 10 mM Na2HPO4, 1.76 mM KH2PO4, pH 7.4] for 1 h at 4°C. The following methodology was performed in 1.5-ml reaction tubes (Eppendorf, Hamburg, Germany). After washing in PBS and additionally in 50 mM glycine-PBS, blocking was carried out for 45 min in 3% BSA. Incubation with primary antibodies for 30 min (1:700 in PBS) was followed by washing with PBS (30 min) and additional 30-min incubation with secondary antibodies (1:100 in PBS). Final washing was carried out twice in PBS. Stained cells were set into Vectashield® (Vector, Burlingame, CA) to image them by microscopy. The antibodies used were mouse-Y4-monoclonal antibody kindly provided by Y. Capdeville, which was originally produced against the P. primaurelia G antigens (5), but showing specificity for 51A reasonably by the similarities of the proteins (27); rabbit-anti-51D polyclonal serum (self-made), FITC anti-mouse IgG, and TexasRed® (TR)-anti-rabbit IgG (both from Sigma, Deisenhofen, Germany). To determine the composition of the silenced cultures 150–200 cells per sample were analyzed and counted in this manner.
RESULTS
Amount of dsRNA in E. coli
To check dsRNA production in E. coli we isolated total nucleic acids from so-called “synchronous cultures.” Figure 1 demonstrates that the 340 plasmid was transcribed at a higher level compared to the two other fragments, resulting in a much higher amount of dsRNA. Fragments 647 and 700 showed nearly identical transcription rates. These results were found to be highly reproducible. All fragments showed a nearly identical GC content of about 18–19% and the sequences did not contain exceptional base compositions, so the reason for the differing transcriptional levels remained unknown as also the promotors of the feeding vectors were found to be intact.
Figure 1.
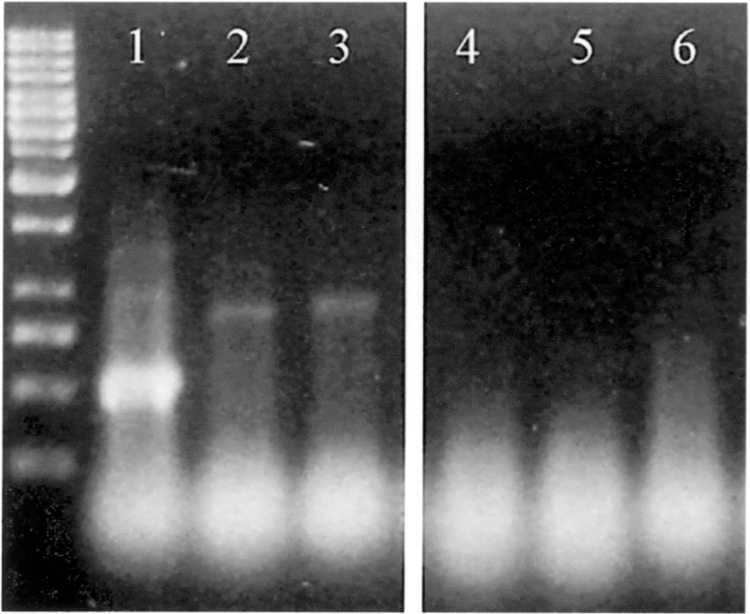
Total nucleic acids were isolated from synchronous bacteria, meaning simultaneous induction with IPTG and lysis (see Materials and Methods). DNAse digested samples were loaded on a 1.8% agarose gel: 1 kb ladder; lane 1, HT115DE3 bacteria containing the 340 plasmid; lane 2, bacteria containing the 647 plasmid; lane 3, bacteria containing the 700 plasmid. The size of lanes is according to the distance between T7 promotors of each plasmid. The higher abundance of the 340 dsRNA compared to other samples is obvious. Lanes 4–6 demonstrate the negative control using the same plasmids (lane 4, 340; lane 5, 647; lane 6, 700) in the E. coli SURE® strain showing no dsRNA enrichment.
Knock Down of Surface Antigens Leads to the Expression of an Alternative Antigen
Silencing of the 51A surface antigen did not lead to antigen-free cells. The artificial interruption of surface antigen expression resulted in the expression of surface antigen 51D for each analyzed fragment. Even though each fragment demonstrated a different knock down efficiency on protein and mRNA level, the serotype always switched to 51D. Serotypes 51B and 51C were not detected. Figure 2 demonstrates that we found three classes of cells in cultures under RNAi treatment: (i) cells expressing pure 51D, (ii) cells showing a coexistence of remaining 51A protein and upcoming 51D protein, and (iii) cells that were still showing pure serotype 51A on the surface. The high fission rate during the RNAi-induced shift led to an increasing amount of neo-formed cilia, which carried only new D antigens, too. We were able to follow this phenomenon as cells showed increasing amounts of red-stained cilia. According to this, during the feeding procedure, cilia harboring remaining A antigens were obviously “diluted” responsible to cell divisions (data not shown). The fragment-specific duration of the induced serotype shift was therefore characterized by staining of daily samples of the silencing cultures. Every cell showing signals of the A-specific antibody was therefore noted for coexistence.
Figure 2.
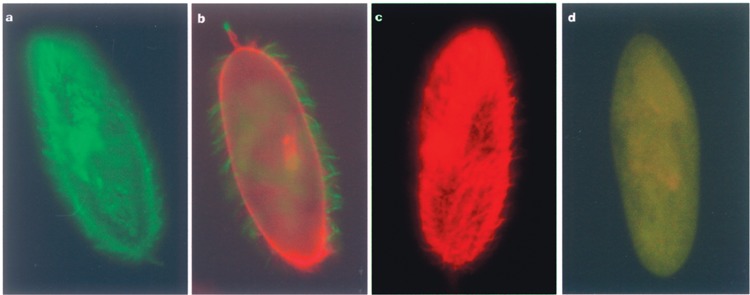
Parallel indirect immunofluorescence staining of surface antigens using antibodies against the 51A and 51D serotype to detect the silencing phenotype. Cultures under RNAi treatment were tested for the presence of antigens on the surface and showed three different types of antigen expression: pure A-expressing cells (a), cells showing a shifting state where remaining A protein (indirectly labeled with FITC, green), and upcoming D protein (indirectly labeled with TexasRed) coexist on the surface (b), and cells that have already completely shifted to serotype D (c). Specificity of the staining is demonstrated in (d) showing a serotype B-expressing cell treated in the same manner. There were 150–200 cells analyzed per sample to represent the culture composition as demonstrated in Figure 3.
Clone-Specific Duration of the RNAi-Induced Serotype Shift
We observed strong differences in the ability of the three different silencing fragments to reduce surface antigen A on the cell surface. In Figure 3 the duration of the fragment-specific serotype shift is demonstrated on protein level. Most cells showed a coexistence of remaining A protein and upcoming D protein 24 h after first feeding. In progression of the experiment only the 340 fragment induced complete reduction of A protein and subsequently a pure expression of serotype 51D, whereas a majority of the 647 and 700 cultures where not able to express the 51D antigen purely. Such a long time of coexistence of surface antigens has not been reported previously for any serotype shift and displays an unusual phenomenon. The regulatory background of this obvious exception of mutual exclusion was therefore analyzed concerning transcript abundances.
Figure 3.
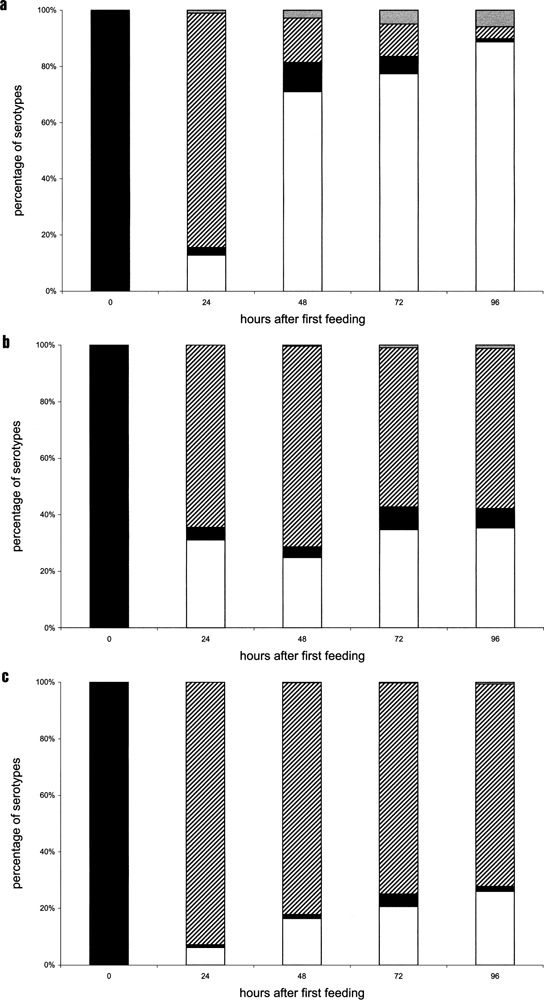
Expressed surface antigen in silenced cultures determined by the indirect immunofluorescence staining: (a) 340 plasmid, (b) 647 plasmid, (c) 700 plasmid. Serotype A is indicated as black, serotype D is indicated as white. Coexpressive cells showing serotype A and D on the cell surface are indicated by black and white stripes and unknown serotypes by gray. The comparison demonstrates that only plasmid 340 is able to induce a nearly complete serotype shift from A to D. On the first day after feeding the phenotypes of every plasmid showed a high percentage of coexpressive cells; a small percentage kept expressing serotype A. Cells showed 3.45 ± 0.3 divisions per day and all performed controls did not shift to another serotype but continued expressing serotype A.
Transcriptional Level of Surface Antigens
Wild-type A-expressing cells revealed a high transcriptional level concerning the A gene, more than 200% than the reference gene GAPDH. Interestingly, D transcripts were also detectable in very small amounts (Fig. 4). With regards to the amount of D transcripts and their processivity, Figures 3a and 4a show that quite a small amount of mRNA (0.19%) was sufficient to satisfy the surface with antigens. However, progress of this shift indicated further enforcement of D transcription when the culture already shifted to this serotype. Hence, it becomes clear that enforced transcription and therefore mRNA accumulation should not be a necessary event for protein synthesis, but seems to be a prime candidate to establish serotype stability. Also the high transcriptional level of serotype A, which was reported to be the most stable serotype in P. tetraurelia, fits into this conclusion. Comparing these three characteristic serotype shifts it becomes clear that transcriptional control is not enough. For example, fragment 647 revealed higher amounts of D transcripts, but did not induce pure serotype D and so posttranscriptional regulation was necessarily involved. The data of the three feeding experiments suggest a transcriptional threshold, where the serotype completely shifts from one to another.
Figure 4.
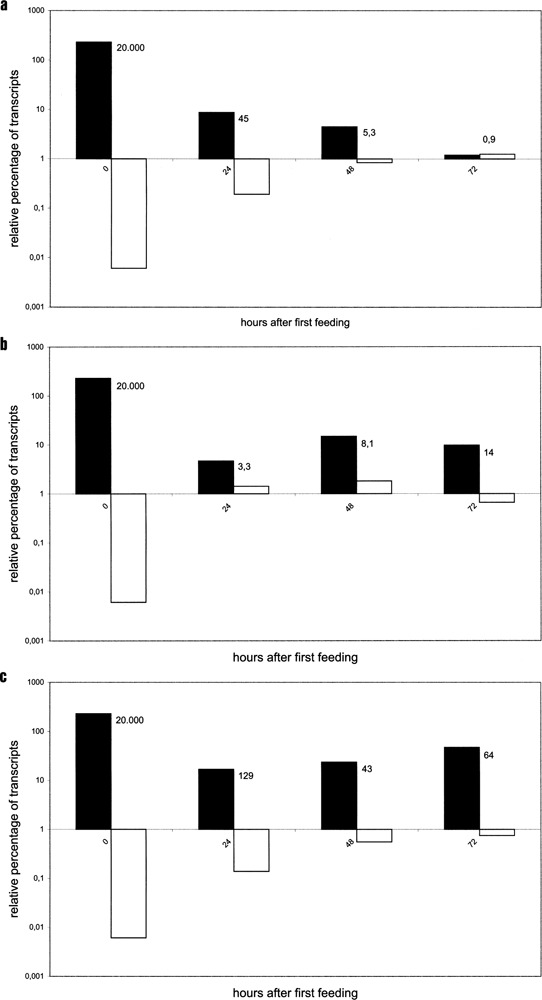
Quantitative analysis of surface antigen transcript level by real-time PCR. For each fragment [(a) 340, (b) 647, (c) 700] total RNA was isolated every 24 h (x-axis) during the feeding procedure, reverse transcribed, and cDNA was quantified from serotype genes A and D but also from GAPDH, which was demonstrated to be expressed at a constant level. The demonstrated data display mRNA abundances of surface antigens A (black) and D (white) as percentage of the expression level of GAPDH (y-axis). Multiple amounts of A relative to D transcripts are indicated in the diagram. Fragment 340 shows an efficient downregulation of A transcripts; both other fragments only show a slight reduction followed by re-increase. D transcripts accumulated in all cultures but only fragment 340 showed an efficient A downregulation and an efficient D upregulation.
To confirm this conclusion we analyzed single cells for their transcriptional level, as cultures were demonstrated to react not synchronously to triggering feeding bacteria. Cells derived from a feeding procedure with fragment 700 were chosen because it produced the highest percentage of cells exhibiting both antigens on the surface within 24 h (see Fig. 3c). We found two groups of ratios (Fig. 5): one with fewer D transcripts, likely presenting coexpressive cells; in most cases this was correlated with higher abundance of A transcripts. The second group contained few cells characterized by an already downregulated A transcription and by upregulated D expression. Therefore, the transcriptional thresholds responsible for serotype switching can be stated more precisely than by culture analysis. Whereas the number of analyzed cells does not allow a statistical analysis, the amount of those cells correlated with the percentage of pure D expressing cells (compare to Fig. 3c). The analysis of single cell RNA isolations and the comparison to respective samples from whole cultures demonstrate the significance of this method. RNA isolations of cultures represented average data and therefore it cannot be evaluated why one cell changes of protein expression.
Figure 5.
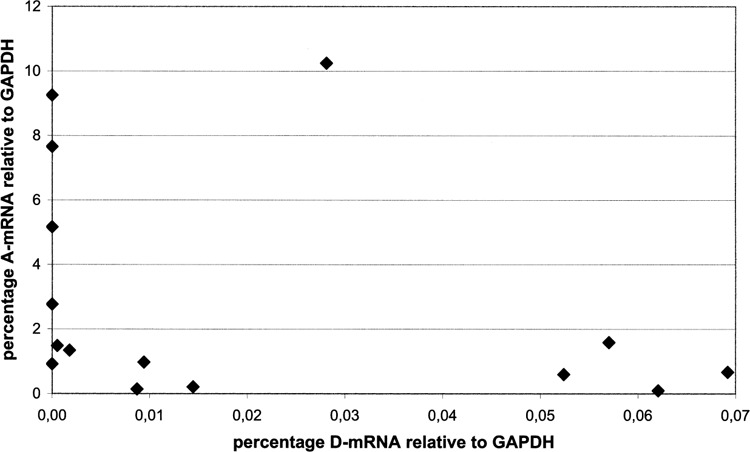
Cells silenced with fragment 700 were isolated 24 h after first feeding and transcript levels of A, D, and GAPDH were determined from single cells by real-time PCR. Abundance of serotype mRNA is plotted against GAPDH, each dot indicating a single cell (y-axis: A mRNA; x-axis: D mRNA). The distribution shows that in one group increased D abundance correlated with decreased A abundance, assuming that these cells will completely shift to pure serotype D. Another group of cells showed fewer D transcripts; hence, higher levels of A transcription seem to inhibit D transcription and vice versa. Please note that dots plotted directly on the y-axis, indicating the lack of D transcripts, do not necessarily imply the absence of transcripts. Abundances may have been below the detection limit because RNA was isolated from one single cell.
Knock down of surface antigens by RNAi requires high silencing efficiency as the wild-type transcriptional level was not only in this study reported to be extremely high. Different efficiencies reported in this study therefore have to be related to the amount of introduced dsRNA. Our RNAi experiments also targeted surface antigen 51H and as this serotype is expressed at low temperatures (14°C) and shows a significant lower transcriptional level, we found it much easier to induce complete knock down (data not shown). As fragment 340 was shown to produce most dsRNA correlated with the highest silencing efficiency, the RNAi-induced knock down seems to be predominantly a dose-dependent effect regarding dsRNA but also mRNA. The fact that the 340 fragment shares only 16 siRNAs to the target mRNA, not resulting in reduced efficiency compared with other fragments (Table 1), seems to support the involvement of an RNA-dependent RNA polymerase (RdRP).
Posttranscriptional Control Is a Strong Factor of Antigen Expression
In spite of still abundant A transcripts in any state of the experiments, the immunofluorescence stainings demonstrated that exclusively D proteins were delivered to the cell surface. This was indicated by the heterogenic distribution of surface antigens (see Fig. 2, middle panel). That “old” surface antigens remain on the cilia was described previously (2,27), so the cells in our experiments indicated for coexistence of antigens expressed just the D protein. At this time the A transcripts did not lead to an expression of surface antigen A in spite of being highly abundant in a quantity of a 45-fold amount compared to D transcripts. This quantitative comparison of both transcript species shows definitely that posttranscriptional control occurs in exclusive expression of antigens. Furthermore, the high quantity of A transcripts that did not lead to surface antigens shows that this regulation level is a very powerful mechanism enabling exclusive expression.
RNA Involved in Exclusive Expression Mechanism?
Why did cells remain in the so-called shifting state, showing the stable coexistence of antigens? We were able to show that temporal duration of the serotype shift did not depend on the D transcript level: the (inefficient) fragment 647 (Fig. 4b) showed much higher amounts of D mRNA (up to 1.4%) compared to fragment 340 (only up to 0.19%) and in spite of higher amounts of D transcripts culture, 647 never produced a complete serotype shift. Interestingly, differences became obvious in the amount of A transcripts as the 340 fragment shows (i) a most efficient reduction of A mRNA and (ii) a most efficient serotype shift to D. When the serotype shifted from A to D, fragment 340 showed loss of A mRNA from 45-fold to 5.3-fold but compared to this the 647 fragment revealed enrichment of both transcript species from 3.3-fold to 8.1-fold. Therefore, A transcripts seemed to influence expression of serotype D. Supporting the thesis and worthy to compare also are values of fragment 340 and 700 at 1 day after the first feeding: when the D mRNA amount was in the same range, fragment 700 showed a 129-fold amount of A transcripts compared to only 45-fold in the 340 culture, which was shifting the next day. From that, potential functions for serotype transcripts regarding the regulation of mutual exclusion expression can be concluded.
DISCUSSION
Posttranscriptional Regulation Enables Exclusive Expression
One characteristic feature of serotypes in any protist, also in Paramecium, is the mutually exclusive expression of proteins (23). Only a few studies have examined how this is realized on the molecular level: posttranscriptional control has been observed only for particular serotypes when transcripts were detected that did not correspond to the actual expressed serotype. This was reported for serotype 51H showing untranslated 51C transcripts (13) and also for cultures expressing serotype 51D while exhibiting full-length 51A transcripts (16). These examples were believed to be exceptions from the otherwise described exclusive transcription but up to now a general mechanism could not been presented.
In our experiments we were able to detect D transcripts in pure A-expressing wild-type cultures. Because real-time PCR is very sensitive we demonstrated a D transcriptional level more than 20,000-fold lower than the expressed A level. Earlier reported coexpression of serotype mRNAs was discovered at higher transcriptional levels. For example, the 51C mRNA was found to be synthesized 1.2-fold higher than translated 51H transcripts (13), so we have to consider whether more sensitive methods may be able to detect more examples for coexisting transcripts. We demonstrated that surface antigen A mRNA was definitely present but not processed into antigens; at the same time the less abundant D mRNA was translated as evidenced by the presence of the protein on the surface. Considering whether this phenomenon displays an RNAi- or a serotype-regulating effect we have to include aspects of siRNA function: cleavage of transcripts does not have to be involved in gene silencing as recent studies of the RISC complex in flies demonstrated that single siRNAs do not necessarily lead to mRNA cleavage. Due to mismatches in the center region of the siRNA, reduced translation occurs that also may result in a silencing phenotype (15). Because we used long dsRNA in our experiments it has to be processed to full homologous siRNAs and such a behavior of siRNAs cannot contribute to our results. So we conclude that the observed posttranscriptional phenomenon is not due to an RNAi effect.
The comparison of protein and mRNA levels during the three displayed serotype shifts proves posttranscriptional control enabling exclusive expression. As we documented very high levels of unprocessed mRNA (versus minor amounts of translated mRNA), this posttranscriptional level of regulation has to be a powerful step of regulation. Whether it is realized just by inhibition of translation or by other steps of protein processing cannot be answered by this study. Regulation could also occur in the specific addition of GPI anchors as Trypanosomes and Paramecia with defects in GPI synthesis were shown to lack antigenic variation (20,33). As a consequence, proteins without anchors would not be transported to the plasma membrane but because little is known about GPI targeting further investigations should determine how posttranscriptional control is realized.
Transcriptional Level, mRNA Abundance, and Self-Stabilization
The described upregulation of transcription displays a phenomenon apart from the posttranscriptional regulation. Total RNA extract analysis did not reflect real ratios of transcriptional levels of different genes because it only represents a mixture of thousands of cells, meaning a global average. To study ratios of “old” and “new” transcripts in a regulatory unit the mRNAs of single cells were quantified, revealing that upregulation of one mRNA species required downregulation of the other one. This leads to the assumption that transcription at high level represses transcription of unexpressed surface antigens. Moreover, the interesting phenomenon that the abundance of D transcripts still increased when this serotype was already present on the cell surface fits into this discussion because a positive feedback mechanism seems to occur. Our data reflect that the actually expressed serotype has a positive influence on its own transcription, confirming the results of Thai and Forney (31), who came to this conclusion by measuring transcription of injected gene constructs. Enforced D transcription and therefore mRNA abundance likely contributes to serotype stability as shown for A-expressing wild-type cells, too. Early investigations demonstrated constant mRNA levels of surface antigens by ethidium bromide stains of mRNA for each serotype, respectively on an agarose gel (10), and because RNA was isolated from special induced and cultured serotypes it shows that any serotype can reach the extremely high level of its corresponding mRNA. Additionally, the var gene family in Plasmodium was demonstrated to be not exclusively transcribed because several full length transcripts were demonstrated at trophozoite stages and only one abundant mRNA was expressed (9,21), which is a striking parallel to our results. Regarding the close relationship of Plasmodium and Paramecium, exclusive multigene expression seems to share some basic regulation mechanisms that are therefore important to analyze in detail.
Regulatory Function of RNA?
Duration of serotype shift was shown not to be directly related to the amount of “new” transcripts, as results demonstrate that the D transcriptional level does not necessarily have an influence on the stable coexistence of antigens. Moreover, our data correlate this unusual finding with the amount of A transcripts. The main driving force initiating the serotype shift was the enforced transcription and synthesis of surface antigen D. With regards to our data, this cannot explain the differences in progress of serotype shifting and therefore stabilization of coexistence. In discussing a potential regulatory role of the A transcripts, thought should be given to both domains: synthesis of new antigen but also release of old antigen. Potential functions of RNA would then affect persistence of corresponding antigens and/or in repressing synthesis of the other antigens. The first item seems interesting as well as difficult to analyze: because the antigen coat of Paramecium was shown to be periodically stripped of and released into the medium (32) we obviously interfered into this turnover. Further considerations become difficult because knowledge about components involved in antigen release in Paramecium lacks detailed information. Proposed involvement of an endogenous GPI-specific phospholipase C (GPI-PLC) (2) speaks of enzymatic catalyzed release and concerns again the above-mentioned involvement of GPI anchors as they are potential cleavage sites. Whether such mechanisms were affected in our experiments seems speculative.
Worth discussing because of more background knowledge is the second item, RNA-mediated repression of antigen synthesis. Because literature described a “cytoplasmic component” affecting serotype regulation and mutual exclusive expression (17,23), RNA is the prime candidate to transmit information through the cytoplasm and our study speaks for an involvement of mRNA in the cytoplasmic regulation factor. Expertise in parasites contributes well to this discussion: several antigen genes in Giardia lamblia were demonstrated for simultaneous transcription but with one exception all mRNAs were silenced by an RNAi mechanism (H.D. Lujan, personal communication). Our results regarding unexclusive transcription and influence of RNA to posttranscriptional silencing effect speak for a related mechanism in Paramecium. As well as homology and dose dependency are characteristics of RNA-based regulation systems, the model of Thai and Forney (31), which proposed relevance of a repressor/activator ratio for expression of specific antigens, is not inconsistent with a silencing mechanism. Several more arguments support (m)RNA transmitted regulation: (i) the coding region was described to be involved in regulation of exclusive expression (31), (ii) in other organisms mismatch paired siRNAs have been shown to repress translation (15,30), and (iii) all serotype genes share homologies that would allow mismatch pairing of short RNA molecules. Internal homologies of the gene family and global transcription indeed support this assumption. Because we are just beginning to understand RNA-mediated regulating systems concerning expression of multigene families, future studies have to analyze occurrence and source of serotype-specific small RNAs in wild-type Paramecia.
ACKNOWLEDGMENTS
The authors would like to thank Eckhard Thines and the Department of Biotechnology, University of Kaiserslautern, for supply of real-time PCR equipment and advice. Further thanks go to James Forney for critically discussing the work, Gretel Simon and Britta Hartard for correcting the manuscript, and to Christine Klöppel for isolation of dsRNA.
REFERENCES
- 1. Aitcheson N.; Talbot S.; Shapiro J.; Hughes K.; Adkin C.; Butt T.; Sheader K.; Rudenko G. VSG switching in Trypanosoma brucei: Antigenic variation analysed using RNAi in the absence of immune selection. Mol. Micobiol. 57:1608–1622; 2005. [DOI] [PMC free article] [PubMed] [Google Scholar]
- 2. Antony C.; Capdeville Y. Uneven distribution of surface antigens during antigenic variation in Paramecium primaurelia . J. Cell Sci. 92:205–215; 1989. [Google Scholar]
- 3. Beeson J. G.; Brown G. V. Pathogenesis of Plasmodium falciparum malaria: The roles of parasite adhesion and antigenic variation. Cell. Mol. Life Sci. 59:258–271; 2002. [DOI] [PMC free article] [PubMed] [Google Scholar]
- 4. Capdeville Y.; Baltz T.; Deregnaucourt C.; Keller A. M. Immunological evidence of a common structure between Paramecium surface antigens and Trypanosoma variant surface glycoproteins. Exp. Cell Res. 167:75–86; 1986. [DOI] [PubMed] [Google Scholar]
- 5. Capdeville Y.; Caron F.; Antony C.; Deregnaucourt C.; Keller A. M. Allelic antigen and merbrane anchor-epitopes of Paramecium primaurelia surface antigens. J. Cell Sci. 88:553–562; 1987. [Google Scholar]
- 6. Capdeville Y.; Deregnaucourt C.; Keller A. M. Surface antigens of Paramecium primaurelia . Exp. Cell Res. 161:495–508; 1985. [DOI] [PubMed] [Google Scholar]
- 7. Caron F.; Meyer E. Molecular basis of surface antigen variation in Paramecia. Annu. Rev. Microbiol. 43:23–42; 1989. [DOI] [PubMed] [Google Scholar]
- 8. Cross G. A. M. Cellular and genetic aspects of antigenic variation in trypanosomes. Annu. Rev. Immunol. 8:83–110; 1990. [DOI] [PubMed] [Google Scholar]
- 9. Duffy M. F.; Brown G. V.; Basuki W.; Krejany E. O.; Noviyanti R.; Cowman A. F.; Reeder J. C. Transcription of multiple var genes by individual, trophozoite-stage Plasmodium falciparum cells expressing a chondroitin sulphate A binding phenotype. Mol. Microbiol. 43:1285–1293; 2002. [DOI] [PubMed] [Google Scholar]
- 10. Forney J. D.; Epstein L. M.; Preer L. B.; Rudman B. M.; Widmayer D. J.; Klein W. H.; Preer J. R. Structure and expression of genes for surface proteins in Paramecium . Mol. Cell. Biol. 3:466–474; 1983. [DOI] [PMC free article] [PubMed] [Google Scholar]
- 11. Galvani A.; Sperling L. RNA interference by feeding in Paramecium . Trends Genet. 18:11–12; 2001. [DOI] [PubMed] [Google Scholar]
- 12. Garnier O.; Serrano V.; Duharcourt S.; Meyer E. RNA-mediated programming of developmental genome rearrangements in Paramecium tetraurelia . Mol. Cell. Biol. 24:7370–7379; 2004. [DOI] [PMC free article] [PubMed] [Google Scholar]
- 13. Gilley D.; Rudman B. M.; Preer J. R.; Polisky B. Multilevel regulation of surface antigen gene expression in Paramecium tetraurelia . Mol. Cell. Biol. 10:1538–1544; 1990. [DOI] [PMC free article] [PubMed] [Google Scholar]
- 14. Godiska R. Structure and sequence of the H surface protein gene of Paramecium and comparison with related genes. Mol. Gen. Genet. 208:529–536; 1987. [DOI] [PubMed] [Google Scholar]
- 15. Haley B.; Zamore P. D. Kinetic analysis of the RNAi enzyme complex. Nat. Struct. Mol. Biol. 11:599–606; 2004. [DOI] [PubMed] [Google Scholar]
- 16. Jessop-Murray H.; Martin L. D.; Gilley D.; Preer J. R.; Polisky B. Permanent rescue of a non-mendelian mutation of Paramecium by microinjection of specific DNA sequences. Genetics 129:727–734; 1991. [DOI] [PMC free article] [PubMed] [Google Scholar]
- 17. Kusch J.; Schmidt H. J. Genetically controlled expression of surface variant antigens in free-living protozoa. J. Membr. Biol. 180:191–199; 2001. [DOI] [PubMed] [Google Scholar]
- 18. Leek C. L.; Forney J. D. The 5′ coding region of Paramecium surface antigen genes controls mutually exclusive transcription. Proc. Natl. Acad. Sci. USA 93:2838–2843; 1996. [DOI] [PMC free article] [PubMed] [Google Scholar]
- 19. Meyer E.; Caron F.; Baroin A. Macronuclear structure of the G surface antigen gene of Paramecium primaurelia and direct expression of its repeated epitopes in Escherichia coli . Mol. Cell. Biol. 5:2414–2422; 1985. [DOI] [PMC free article] [PubMed] [Google Scholar]
- 20. Nagamune K.; Nozaki T.; Maeda Y.; Ohishi K.; Fukuma T.; Hara T.; Schwarz R. T.; Sutterlin C.; Brun R.; Riezman H.; Kinoshita T. Critical roles of glycosylphosphatidylinositol for Trypanosoma brucei . Proc. Natl. Acad. Sci. USA 97:10336–10341; 2000. [DOI] [PMC free article] [PubMed] [Google Scholar]
- 21. Noviyanti R.; Brown G. V.; Wickham M. E.; Duffy M. F.; Cowman A. F.; Reeder J. C. Multiple var gene transcripts are expressed in Plasmodium falciparum infected erythrocytes selected for adhesion. Mol. Biochem. Parasitol. 114:227–237; 2001. [DOI] [PubMed] [Google Scholar]
- 22. Pfaffl M. W. A new mathematical model for relative quantification in real-time RT-PCR. Nucleic Acids Res. 29:2002–2007; 2001. [DOI] [PMC free article] [PubMed] [Google Scholar]
- 23. Preer J. R. Surface antigen expression in Paramecium . In: Gall J. G., ed. Molecular biology of the ciliated protozoa. New York: Academic Press; 1986:301–339. [Google Scholar]
- 24. Rössle R. Spezifische Sera gegen Infusorien. Arch. Hyg. Bakteriol. 54:1–31; 1905. [Google Scholar]
- 25. Scott J.; Leeck C.; Forney J. D. Molecular and genetic analysis of the B type surface protein gene from Paramecium tetraurelia . Genetics 133:189–198; 1993. [DOI] [PMC free article] [PubMed] [Google Scholar]
- 26. Sehgal A.; Singh N. J.; Chakraborty T.; Sharma S. A protective merozoite protein of Plasmodium falciparum shares an epitope with surface antigens of Paramecium . Parasite Immunol. 26:219–227; 2004. [DOI] [PubMed] [Google Scholar]
- 27. Simon M. C.; Marker S.; Schmidt H. J. Inefficient serotype knock down leads to stable coexistence of surface antigens on the outer membrane of Paramecium tetraurelia . Eur. J. Protistol. 42:49–53; 2006. [DOI] [PubMed] [Google Scholar]
- 28. Simon M. C.; Schmidt H. J. Variety of serotypes of Paramecium primaurelia: Single epitopes are responsible for immunological differentiation. J. Eukaryot. Microbiol. 52:319–327; 2005. [DOI] [PubMed] [Google Scholar]
- 29. Sperling L.; Dessen P.; Zagulski M.; Pearlman R. E.; Migdalski A.; Gromadka R.; Froissard M.; Keller A. M.; Cohen J. Random sequencing of Paramecium somatic DNA. Eukaryot. Cell 1:341–352; 2002. [DOI] [PMC free article] [PubMed] [Google Scholar]
- 30. Tamori Y.; Zamore P. D. Perspective: Machines for RNAi. Genes Dev. 19:517–529; 2005. [DOI] [PubMed] [Google Scholar]
- 31. Thai K. Y.; Forney J. D. Evidence for transcriptional self-regulation of variable surface antigens in Paramecium tetraurelia . Gene Expr. 8:263–272; 1999. [PubMed] [Google Scholar]
- 32. Wyroba E. Release of Paramecium immobilization antigen to the non-nutrient medium. Cell. Biol. Int. Biol. 4:1–10; 1980. [DOI] [PubMed] [Google Scholar]
- 33. Yano J.; Rachochy V.; van Houten J. L. Glycosyl phosphatidylinositol-anchored proteins in chemosensory signalling: Antisense manipulation of Paramecium tetraurelia PIG-A gene expression. Eukaryot. Cell 2:1211–1219; 2003. [DOI] [PMC free article] [PubMed] [Google Scholar]