

Abstract
An RNA gain-of-function of expanded transcripts is the most accredited molecular mechanism for myotonic dystrophy type 1 (DM1) and 2 (DM2). To disclose molecular parallels and divergences in pathogenesis of both disorders, we compared the expression profile of muscle biopsies from DM1 and DM2 patients to controls. DM muscle tissues showed a reduction in the major skeletal muscle chloride channel (CLCNl) and transcription factor Sp1 transcript levels and an abnormal processing of the CLCN1 and insulin receptor (IR) pre-mRNAs. No essential differences were observed in the muscle blind-like gene (MBNL1) and CUG binding protein 1 (CUGBP1) transcript levels as well as in the splicing pattern of the myotubularin-related 1 (MTMR1) gene. Macroarray analysis of 96 neuroscience-related genes revealed a considerable similar expression profile between the DM samples, reflective of a common muscle pathology origin. Using a twofold threshold, we found six misregulated genes important in calcium and potassium metabolism and in mitochondrial functions. Our results indicate that the DM1 and DM2 overlapping clinical phenotypes may derive from a common trans acting mechanism that traps and influences shared genes and proteins.
Key words: Myotonic dystrophy, Pathogenesis, Expression analysis, Splicing, Ion channels
INTRODUCTION
Myotonic dystrophy (DM) is caused by two different mutations: a CTG expansion in the 3′ UTR region of the myotonic dystrophy protein kinase (DMPK) gene (DM1; MIM#160900) and a CCTG expansion in intron 1 of the zinc finger protein 9 (ZNF9) gene (DM2; MIM#602668), respectively, on chromosome 19q13 and 3q21 (6,20,34,37,49). DM is an autosomal dominant disease that affects, besides muscles, many other tissues including eyes, heart, gall bladder, the endocrine system, and the central nervous system (24,42). However, DM1 and DM2 phenotypes, although strikingly similar, are not identical. For instance, DM2 does not show a congenital form or the severe involvement of the central nervous system seen in DM1. The degree of muscle weakness and wasting, as well as the spectrum and the severity of extramuscular manifestations, may be variable to suggest the existence of a multisystemic myotonic syndrome with a common genetic background (50,55).
The common clinical characteristics are probably not correlated with the alteration of DMPK and ZNF9 gene expression, which do not present any evident functional relationships (14,51). Moreover, the CCTG-containing RNA was found retained in distinct foci within nuclei of DM2 cells analogously to what was demonstrated in DM1 cells (39). Therefore, these observations are consistent with an RNA gain-of-function hypothesis proposing that mutant DM transcripts alter the function and localization of the alternative splicing regulators CUGBP1, ETR-3-like, and MBLN proteins, which are fundamental for physiological mRNA processing (17,32,43).
In agreement with this hypothesis, misregulated alternative splicing in DM1 has been demonstrated for several mRNAs. These include insulin receptor (IR), cardiac troponin T (cTNT), muscle chloride channel (CLCN1), fast skeletal troponin t (TNNT3), myotubularin-related protein 1 (MTMR1) (7,9,28,39,48,53,54) in skeletal muscle, and microtubule-associated tau, NMDA receptor 1, and amyloid precursor protein in the brain (27,56,60). CUG-containing RNA expansions may also have deleterious effects through a transcriptional mechanism by direct binding of basic transcription factors (TFs), which leads to the disruption of gene expression (15). Thus, mutant DM transcripts could alter developmental regulation of both splicing and transcription processes. Among the symptoms of DM, myotonia and insulin resistance are correlated with the disruption of the ClC-1 and IR alternative splicing, respectively (9,40,53,54). However, the cause of the progressive muscle wasting and the question of why the clinical myotonia is more pronounced in DM1 compared to DM2 have yet to be completely explained. Additional ion channels may have important roles considering that the proportion of different currents represent the key issue for myotonia.
In this article, we extensively studied the in trans effects of the CTG/CCTG repeat expansions on a set of genes selected for their putative involvement in the DM pathogenesis and/or their physiological function. As a first step, we compared in DM1 and DM2 muscle biopsies, the expression levels of a set of genes whose encoded proteins are misregulated in DM tissues (MBNL1, CUGBP1, Sp1, CLCN1). We then analyzed the splicing pattern of the IR, MTMR1, and CLCN1 genes in both diseases, to disclose downstream effects of the CTG/CCTG expansions on the RNA maturation process. The last part of our work consisted in a macroarray analysis to profile the expression of 96 genes encoding ion channels and transporters participating in the conduction of electric stimuli. Results were further corroborated by QRT-PCR experiments and revealed a similar expression profile of DM1 and DM2 tissues, which reflects a common muscle pathology background between the two forms of DM.
MATERIALS AND METHODS
Muscle Biopsies
Needle muscle biopsies, taken from vastus lateralis, were obtained from patients of Caucasian origin heterozygous for the DM1 (n = 4) and DM2 (n = 4) mutation as well as from control individuals (n = 4). All subjects gave written informed consent for this study. Muscle specimens were flash frozen in liquid nitrogen and stored at −80°C until analysis. Histological analysis of biopsies from affected individuals showed the typical pathology of DM, including atrophic fibers with increased fiber size variation, pyknotic nuclear clamps, and marked proliferation of centrally located nuclei.
Genotyping at DM1 and DM2 Loci
Molecular characterization at DM1 and DM2 loci was obtained with a long PCR based method as previously described (4,22). The length of CTG/CCTG repeats in DM1 and DM2 patients were found to be: DM1-1 4.5 kb (male, 39 years), DM1-2 3.2 kb (male 35 years), DM1-3 5.7 kb (female , 31 years), DM1-4 2.9 kb (female 35 years), DM2-1 1.2 kb (female 35 years), DM2-2 2.3 kb (female 37 years), DM2-3 4.9 kb (male 41 years), DM2-4 5.5 kb (male 31 years).
RT-PCR and QRT-PCR Experiments
Total RNA was extracted from muscle samples using the RNeasy mini kit (Qiagen Co., Valencia, CA). Total RNA (3 μg) was reverse transcribed according to the cDNA protocol of the High Capacity cDNA Archive kit (Applied Biosystems, Foster City, CA). The following Assay-on-demand™ gene expression products, labeled with FAM, were used for expression analysis: CUGBP1, Hs00198069_m1; MBNL1, Hs00253287_m1; CLCN1, Hs00163961_m1; Sp1, Hs00412720_m1; mitochondrial carrier, adenine nucleotide translocator, member 4 (SLC25A4), Hs00154037_m1; voltage-dependent calcium channel beta-1 subunit (CACNB1), Hs00609501_m1; sodium channel beta-1 subunit (SCN1B), Hs00168897_m1; potassium voltage-gated channel, delayed-rectifier, subfamily S, member 2 (KCNS2), Hs 00412720_m1; potassium intermediate/small conductance calcium-activated channel, subfamily N, member 3 (SK3), Hs00158463_m1; mitochondrial carrier, adenine nucleotide translocator, member 5 (SLC25A5), Hs00854499_g1; ATPase, Na+/K+ transporting, beta-1 polypeptide (ATP1B1), Hs00982319_g1. The P2-microglobulin gene (B2M: GenBank accession # NM_004048), labeled with VIC dye, has been chosen as housekeeping, internal control gene. The expression level of the above-mentioned genes and of the internal reference was measured by multiplex PCR using Assay-on-demand gene expression products labeled with FAM dye or VIC dye for B2M, the control gene (Applied Biosystems). The simultaneous measurement of genes-FAM/B2M-VIC expression made it possible to normalize the amount of cDNA added per sample. We performed each PCR reaction in triplicate using the Taqman Universal PCR Master Mix and the ABI PRISM 7000 Sequence Detection System. A comparative threshold cycle (Ct) was used to determine gene expression compared to a calibrator (median value of control subjects). Hence, steady-state mRNA levels were expressed a n-fold difference relative to the calibrator. For each sample, genes’ Ct value was normalized using the formula ΔCt = Ctgenes_CtB2M. To determine relative expression levels, was used the following formula: ΔΔCt = ΔCt sample - ACt calibrator. The value adopted to plot relative gene expression was calculated using the expression 2−ΔΔCt.
RT-PCR splicing assays for the IR, CLCN1, and MTMR1 genes were performed according to reported protocols (7,9,53). Total PCR products, obtained within the linear range of amplification, were electrophoresed on 3% agarose (IR gene) or 6% acrylamide gel for separation (CLCN1 and MTMR1 genes). Quantitative analysis of the amplified products was performed by fluorimager 595 (Amersham Biosciences, Buckinghamshire, UK). To generate CLCN-1 clones, fragments of cDNAs spanning CLCN1 exons 4-8 were amplified, gel purified, and cloned in the pCR2.1 vector (Invitrogen Corporation, Carlsbad, CA) for dideoxy sequencing. Syber Gold-stained (Molecular Probes, Eugene, OR) acrylamide gels were scanned on a fluorimager and the fraction of NS isoform/AS isoforms was quantified by densitometry. The measurement of the total amount of the CLCN1 mRNas was quantified in the same gel using the glu-cose-6 phosphate isomerase (GPI) as housekeeping control gene. One-way ANOVA, with correction for multiple comparisons, has been utilized as statistical test to analyze the difference in the identified splice variants among the DM1, DM2, and controls groups.
RNA Purification and Labeling
For RNA extraction and labeling, total RNA was isolated by the TRIZOL standard protocol (Invitrogen Corporation). A small aliquot of RNA was then used for quantification and quality control using a spectro-photometer (Nanodrop) and an agarose gel electro-phoresis. Equal amounts (1.5 μg) of each DM1, DM2, and control sample were pooled to give three separate RNA pools. Each DM1, DM2, and control pool was then requantified, retrotranscribed, and labeled with 32-dCTP (NEN) using a GEArray™ Probe Synthesis Kit (SuperArray Bioscience Corporation, USA). Labeled cDNAs were then hybridized on GEArray Q Series Human Neuroscience-1 Ion Channel & Transporter Gene Array (HS-013 SuperArray Bioscience Corporation).
SuperArray Filter
The GEArray Q Series Human Neuroscience-1 Ion Channel & Transporter Gene Array was developed to profile expression of a panel of 96 genes encoding neuroscience-related ion channels and transporters. The genes represented on the array are grouped into six categories according to their functional and structural features including calcium channels, potassium channels, sodium channels, chloride channels, and transporters. The Array moreover contains a system of controls, such as negative controls (pUC18 DNA and blanks) and putative housekeeping genes (β-actin, GAPDH), chosen among those genes that showed little expression pattern difference among different tissues. Two replicates of each experiment were done using different GEArray filter derived from the same lot number.
Macroarray Hybridization and Data Analysis
Each hybridization experiment was carried out in roller bottles using a rotary hybridization oven (Thermo Hybrid, USA) with 1 ml of a hybridization solution (GEAhyb Hybridization Solution, SuperArray Bioscience Corporation). Labeled cDNAs were denatured at 95°C for 5 min and applied directly to the hybridization solution. Microarray hybridization was performed at 60°C overnight. Posthybridization washings were made according to GEArray instructions.
For statistical analysis of expression data, the acquisition of filter images was carried out by using a STORM apparatus (Amersham Biosciences, Buckinghamshire, UK) after an exposition of 3 h. Filter images were saved as a TIFF file. The ScanAlyze software (SuperArray) converts the image of spots (TIFF file) into numerical data and saves these as a tabular file recognizable by Microsoft Excel. Filter images were then analyzed with GEArray Analyzer software (www.superarray.com). The software matches the raw data in the table with the gene list for the particular GEArray and also provides a list of background subtraction and data normalization options. Our statistical analysis was performed with local background correction and median normalization. Local background subtraction means that the expression value of each individual spot is calculated by subtraction of the intensity of the area outside the grid capture. Median normalization factor uses the median value of all spots. After data analysis, we considered only those genes whose threshold level was ±2.
RESULTS
DM1-DM2 Comparative Expression Analysis of Genes Involved the DM Pathogenesis
To define molecular parallels and divergences in the pathogenic mechanisms leading to DM1 and DM2 muscle pathology, we analyzed the expression profile and the splicing pattern of a set of genes involved in the DM1 phenotypic outcome (CLCN1, Sp1, CUGBP1, MBNL1) in our muscle samples. Gene expression experiments were performed by QRT-PCR with the TaqMan technology using the commercial gene expression assays listed in Materials and Methods on cDNA from muscle biopsies of DM1 (n = 4), DM2 (n = 4), and control individuals (n = 4). The β2-microglobulin (B2M) housekeeping gene was used as an internal control for normalization and each experiment was conducted in triplicate. This control gene was chosen because its expression level was found to be unaltered in DM tissues compared to controls, contrary to what has been reported for the glyceraldehyde-3-phosphate dehydrogenase (GAPDH) gene (data not shown) (15). The average result of the normal controls was given a value of 1. Overall, no essential differences were observed in the MBNL1 and CUGBP1 levels between DM1 and DM2 patients and controls, even if the expression of these genes was extremely variable in each subject analyzed (Table 1). However, a considerable misregulation was observed in the CLCN1 and Sp1 expression levels in DM versus control group. Levels of the CLCN1 mRNA were reduced to 59–67% of controls in DM1 samples and to 41–60% of controls in DM2 samples (Table 1). The reduction in the Sp1 gene levels was of minor entity and more homogeneous. Values ranging between 60% and 83% of controls were found in all the DM patients analyzed (Table 1).
TABLE 1.
EXPRESSION ANALYSIS OF DM CANDIDATE GENES IN DM1 AND DM2 MUSCLE TISSUES
| CUGBP1 | MBNL1 | Sp1 | CLCN1 | |||||||||
|---|---|---|---|---|---|---|---|---|---|---|---|---|
| 2−ΔΔCt | − | + | 2−ΔΔCt | − | + | 2−ΔΔCt | − | + | 2−ΔΔCt | − | + | |
| DM1-1 | 1.11 | 0.11 | 0.11 | 1.36 | 0.11 | 0.12 | 0.80 | 0.03 | 0.04 | 0.62 | 0.008 | 0.008 |
| DM1-2 | 0.72 | 0.03 | 0.03 | 0.74 | 0.02 | 0.01 | 0.66 | 0.03 | 0.03 | 0.59 | 0.07 | 0.08 |
| DM1-3 | 1.13 | 0.03 | 0.03 | 0.83 | 0.00 | 0.00 | 0.60 | 0.09 | 0.09 | 0.60 | 0.03 | 0.03 |
| DM1-4 | 0.85 | 0.01 | 0.02 | 0.73 | 0.10 | 0.11 | 0.77 | 0.02 | 0.01 | 0.67 | 0.10 | 0.09 |
| DM2-1 | 1.23 | 0.04 | 0.04 | 1.05 | 0.04 | 0.03 | 0.83 | 0.01 | 0.02 | 0.48 | 0.10 | 0.12 |
| DM2-2 | 0.55 | 0.05 | 0.05 | 0.44 | 0.01 | 0.01 | 0.69 | 0.04 | 0.04 | 0.41 | 0.03 | 0.01 |
| DM2-3 | 0.66 | 0.01 | 0.00 | 1.01 | 0.02 | 0.02 | 0.63 | 0.03 | 0.03 | 0.45 | 0.03 | 0.04 |
| DM2-4 | 0.93 | 0.02 | 0.02 | 1.37 | 0.12 | 0.06 | 0.69 | 0.10 | 0.13 | 0.60 | 0.04 | 0.03 |
QRT-PCR expression analysis of CUGBP1, MBNL1, Sp1, and CLCN1 genes in DM1, DM2, and control muscle biopsies. Steady-state mRNA levels were expressed as n-fold difference compared to the calibrator (average value of the controls was given a value of 1). For each sample, the Ct value was normalized with the B2M housekeeping gene using the formula ΔCt = CtgeneCtB2M. The relative expression levels were calculated with the ΔΔCt = ΔCt sample − ACt calibrator formula and the value used to plot relative gene expression was calculated using the expression 2−ΔΔCt. The CLCN1 and Sp1 genes are deregulated in the DM versus control group (values in bold).
Splicing Patterns of the IR-A/B, CLCN1, and MTMR1 Genes
To investigate a possible common mechanism of aberrant splicing in DM, we compared the expression level of the IR, CLCN1, and MTMR1 isoforms between DM1 and DM2 samples compared to controls. RT-PCR analysis of spliced transcripts was performed with primers generating fragments of different lengths, according to the inclusion/exclusion of spliced exons.
IR Gene
The α-subunit of the IR has two spliced isoforms with different insulin sensitivity, IR-B and IR-A, which is usually expressed in immature myo-tubes and other low insulin sensitivity tissue (Fig. 1A). We found that the insulin receptor pre-mRNA undergoes an anomalous splicing in the DM1 and DM2 skeletal muscle with a predominant expression of the lower, lacking exon 11, isoform IR-A (Fig. 1B). The degree of IR splicing change in DM1 and DM2 (mean percentage of IR-B isoform = 35%) was significantly different from what was observed in the control samples (mean percentage of IR-B isoform = 73%) (p = 0.017) (Fig. 1B). This could explain the insulin resistance in both forms of the disorders.
Figure 1.
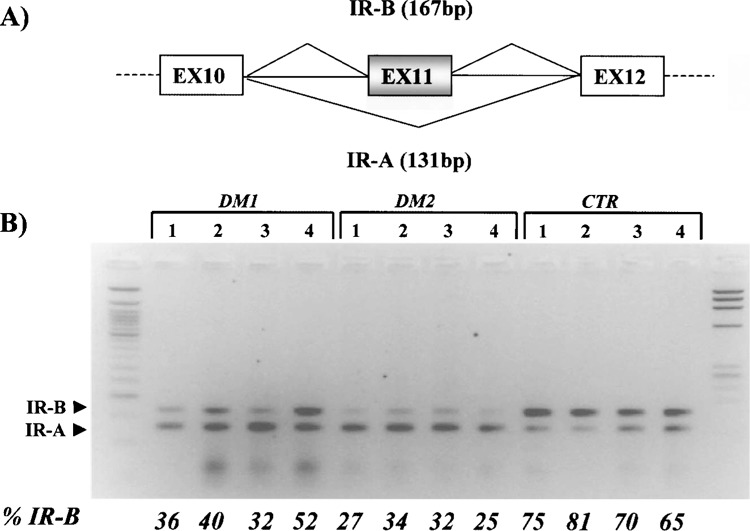
(A) Schematic of the IR exon 11 region, which undergoes alternative splicing. (B) RT-PCR of IR gene isoforms in DM1, DM2, and control muscle biopsies. The upper band corresponds to the exon 11-containing IR-B isoform, and the lower band represents the fetal IR-A isoform lacking exon 11. The adult, IR-B isoform, predominates in the DM group, as demonstrated by the percentage of the IR-B isoform, obtained by densitometric analysis.
CLCN1 Gene
A classic feature of both DM1 and DM2 is myotonia, in which voluntary muscle contraction is followed by involuntary firing of action potentials that delay the patient’s ability to relax muscle (24). CLCN1 is a very good candidate to cause myotonia because the majority of its mRNA in DM1 and DM2 skeletal muscle contains premature termination codons due to retention of intron 2 or inclusion of two novel exons between exon 6 and 7 normally excised (9,40). To study the splicing pattern of the CLCN1 gene in our DM sample, we chose an RT-PCR approach with primers between exons 4 and 8 of the gene pre-mRNA, abnormally spliced in DM1 patients. This analysis identified, in all the samples analyzed, two major bands of 435 and 278 bp representing the normally spliced CLCN1 mRNA (CLCN1-5,67) and an isoform lacking exons 6 and 7 (CLCN1-5-8), respectively (GenBank accession # NM_000083 and # AY103156, respectively) (Fig. 2). In all the DM samples, we detected three additional PCR products (568, 513, and 490 bp) that were not present in any of the control individuals. The 568-bp product derives from an isoform with a 134 nt insertion before exon 7, containing exon 6b and 7a (CLC-N16b7a, GenBank accession # AY103154) while the 490-bp band corresponds to a CLCN1 mRNA with the 134 nt insertion, lacking exon 6 (CLCN16Δ6b7a, GenBank accession # AY103155) (Fig. 2). These isoforms have been described elsewhere (9,40) and are the most frequent abnormality observed in patients with DM, as well as in the mouse model for the disease (HSA LR mice) (40). However, with our experiments, we were also able to detect a 513-bp PCR product representing an isoform with a 79 nt insertion between exon 6 and 7, which contains exon 7a (CLCN17a, GeneBank accession # AY046404) (Fig. 2). The inclusion of this 79 nt exon resulted in frame-shift and premature termination at codon 289, and causes a severe form of recessive myotonia in humans (45). This aberrant mRNA has never been observed before in DM patients by RT-PCR experiments, even if it is expressed and developmentally regulated in the HSA LR mice models (40). The fraction of aberrant spliced CLCN1 isoforms (exon 6b–7a inclusion and exon 6–7 exclusion) ranged from 0.47 to 0.70 (median value 0.58) in DM1 patients, from 0.61 to 0.79 (median value 0.67) in DM2 samples, and from 0.10 to 0.15 (median value 0.12) in the controls. Statistical analysis demonstrated that this difference is highly significant (p = 0.001) (Fig. 2B).
Figure 2.
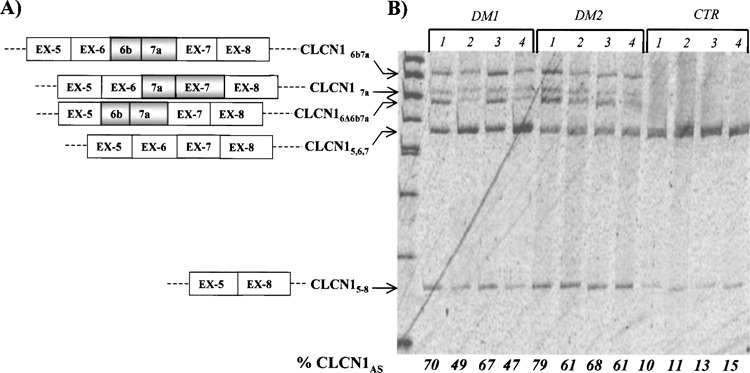
(A) Splicing diagram of the CLCN1 isoforms across exons 4–8 detected in this study. CLCN15,6,7 represents the normally spliced CLCN1 product; CLCN15-8 lacks exons 6 and 7; CLCN16Δ6b7a derives from an isoform with a 134 nt insertion before exon 7 containing exon 6; CLCN16b7a has a 134 nt insertion before exon 7 containing exon 6b and 7; CLCN17a possesses a 79 nt insertion between exon 6 and 7 that contains exon 7a. (B) RT-PCR analysis of the CLCN1 splicing across the exon 4–8 region in DM1, , and control muscle biopsies. This analysis identified, in all samples analyzed, two major bands of 278 and 435 corresponding to the CLCN15-8 and CLCN15,6,7 isoforms. In all DM patients we were able to detect three additional PCR products of 490, 519, and 568 bp, not present in any of the control individuals, corresponding to isoforms CLCN16Δ6b7a, CLCN17a, and CLCN16b7a, respectively. The experiments were repeated three times and similar results were obtained.
MTMR1 Gene
The myotubularin-related 1 gene (MTMR1) belongs to a family of phosphatase genes involved in the myoblast differentiation. The MTMR1 pre-mRNA gene undergoes alternative splicing in muscle tissues, producing four isoforms (A, B, C, D) across the exons 2–3 gene region. Myoblasts contains mainly isoforms A (346 bp) and B (370 bp), while isoform C (397 bp) is predominant in myotubes together with low amount of isoform D (448 bp) (Fig. 3A). In human muscle, there is an almost complete switch from isoform A to isoform C. This splicing process is variously altered in congenital DM1 muscle cells and in skeletal samples from patients with congenital onset DM1, with increased levels of the fetal isoform compared to the adult ones (7). RT-PCR analysis of the MTMR1 mRNA in our DM1 and DM2 samples showed high levels of the C isoform, which was always predominant in both DM and the controls (Fig. 3B), and a lower expression of the A + B isoforms. As shown, the percentage of the adult, C + D, isoforms (C + D/A + B + C + D ratio) do not differ significantly in the DM1, DM2, and in normal groups (Fig. 3B). Considered together, these findings indicate that the MTMR1 splicing is not impaired in DM1 and DM2 adult muscles, differently from what has already been observed in the congenital form of the disease (7).
Figure 3.
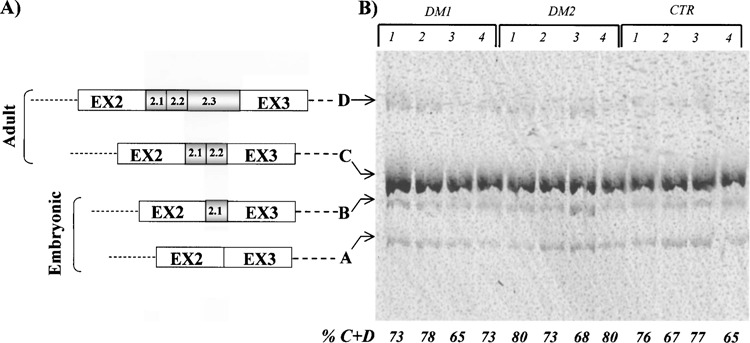
(A) The MTMR1 gene and its splicing isoforms. The black boxes represent exons and the black line corresponds to the intronic region. The MTMR1 pre-mRNA gene undergoes alternative splicing in muscle tissues, producing four isoforms (A, B, C, D) across the exons 2-3 gene region. Myoblasts contain mainly isoform A (346 bp) and B (370 bp), while isoform C (397bp) is predominant in myotubes together with a low amount of isoform D (448 bp). In human muscle there is an almost complete switch from isoform A to isoform C. (B) RT-PCR products with primers across exons 2-3 region loaded in 6% polyacrylamide gel. All MTMR1 isoforms are visible in each sample analyzed, with a predominant expression of the adult C isoform and lower levels of the A + B fetal isoforms. As evidenced by densitometric analysis, the mean values for adult, C + D, isoforms do not differ significantly in the DM1 and DM2 versus control group.
Macroarray Analysis of Ion Channels and Neuroscience-Related Genes
To profile the expression pattern of muscle tissues from DM1 and DM2 patients, we hybridized a filter array containing a panel of 96 genes encoding neuro-science-related proteins. Calcium channels, potassium channels, sodium channels, chloride channels, and transporters were included. The expression data correspond to the mean value of the two different experiments performed on three RNA pools obtained by mixing the same quantity of total RNA from DM1 (n = 4, pool #1), DM2 (n = 4, pool #2), and control samples (n = 4, pool #3). Interestingly, DM1 and DM2 have a similar expression profile, which reflects a common muscle pathological background. According to a threshold >+2.0 in both patient and control groups (see Materials and Methods) we found, in addition to the CLCN1, six differentially expressed transcripts (Table 2). All these genes were found to be underexpressed in DM1 and DM2 muscles (7% of the genes represented in the SuperArray filter) (Table 2, Fig. 4). Considering only the DM1 and DM2 groups, we were not able to find genes that were differentially expressed in the DM2 compared to DM1 samples.
TABLE 2.
GENES DIFFERENTIALLY EXPRESSED IN DM VERSUS CONTROL GROUPS
| Gene | GeneBank Accession No. | Description | DM1/Control Fold Change | DM2/Control Fold Change | Qualitative QRT-PCR |
|---|---|---|---|---|---|
| ATP1B1 | X03747 | mRNA for Na/K-ATPase beta subunit | −4.40 | −5.08 | ↓ |
| CACNB1 | M92302 | Plasma membrane Ca2+ pumping ATPase | −3.67 | −4.71 | ↓ |
| SLC25A4 | J02966 | Mithocondrial carrier; adenine nucleotide translocator, member 4 | −2.89 | −8.50 | ↓ |
| SCN1B | L10338 | Sodium channel beta-1 subunit | −2.14 | −4.09 | ↓ |
| SLC25A5 | J02683 | Mithocondrial carrier; adenine nucleotide translocator, member 5 | −3.32 | −3.55 | ↓ |
| KCNS2 | AB032970 | Potassium voltage-gated channel, delayed rectifier, subfamily S, member 2 | −3.20 | −3.86 | nd |
| SK3 | NM_002249 | Potassium intermediate/small conductance calcium-activated channel, subfamily N | 2.30 | 2.32 | ↑ |
List of genes with the most significant changes in expression between DM1, DM2, and control muscle samples. Genes are ranked by fold change. ↑: upregulation to control; ↓: downregulation to control.
Figure 4.
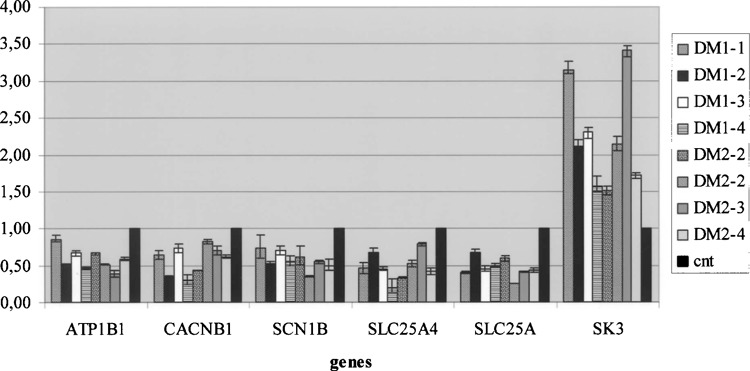
QRT-PCR results for genes found differentially expressed between the DM group and the controls. TaqMan assays were conducted in triplicate for each sample and a mean value was used for the calculation of expression levels. Steady-state mRNA levels of target gene samples were expressed relative to the median value of the control subjects set as 1 (black columns). The B2M gene mRNA was used to standardize the quantification of each sample.
In general, misregulated genes include those encoding for proteins involved in calcium metabolism (CACN1B), mitochondrial function (SLC25A4, SLC25A5), sodium and potassium channels (SCN1B, SK3, KCNS2), and sodium-potassium ATPase (Na/ K-ATPase) pumps (ATP1B1). To confirm the Super Array results, all of these genes were studied for differential expression by real-time quantitative PCR (QRT-PCR). In this experiment each DM1, DM2, and control sample was analyzed in a separate reaction. The housekeeping p2-microglobulin (B2M) gene was used as an internal control for the normalization of samples. Pearson correlation analysis demonstrated a statistically significant positive correlation between the expression values obtained with the QRT-PCR and cDNA SuperArray assays for the DM1 (R 2 = 0.70) and DM2 (R 2 = 0.62) samples. The only exception was the KSCN2 transcripts, not detected by QRT-PCR in any of the samples examined. These results agree with literature data reporting that the KCNS2 gene is a brain-specific expressed gene. The detection of the KCNS2 expression by macro-array analysis can be nonspecific and due to a cross-hybridization with a different, high homologous gene. The mRNA expression values (2−ΔΔCt) obtained by QRT-PCR of the genes (ATP1B1, CACNB1, SLC25A4, SCN1B, SLC25A5, KCNN3) differentially expressed in the DM1/DM2 patient group referred to the median values of controls, which was given a value of 1, are shown in Figure 4.
DISCUSSION
Expression Analysis of CUGBP1, MBNL1, Sp1, IR, CLCN1, and MTMR1 Genes in DM1/DM2 Muscle Tissues
DM is a multisystemic disorder that involves, besides muscle apparatus, the eye, cardiovascular apparatus, endocrine apparatus, gall bladder, and testicular system (24). DM1 and DM2 patients share numerous clinical symptoms. However, the DM2 clinical phenotype is generally milder than DM1. In fact, it does not show a congenital form, the involvement of the central nervous system is milder and, overall, the prognosis is more benign (11,42). The mechanism at the basis of the DM1/DM2 molecular pathology has been the subject of extensive analysis because expansions in the two pathologies are transcribed in mRNA but their effects on DMPK and ZNF9 genes expression are different (5,8,21,41). The most accredited pathogenic hypothesis is, therefore, a gain-of-function of the expanded RNA that is trapped in the nucleus and misregulates RNA binding protein regulators of the splicing process.
It has been demonstrated that CUG- and CCUG-containing transcripts accumulate in ribonuclear foci both in DM1 and DM2 cells and alter the regulation and localization of CUG binding protein, including CUG-BP and three different isoforms of the MBNL proteins (18,43,51). Both proteins have antagonistic effects in their splicing activities; while CUG-BP promotes the inclusion of exons normally expressed during fetal development, MBNL1 favors the adult splicing isoform (11,25). Moreover, the overexpression of the CUGBP1 gene and the disruption of the Mbnl1 knock-out in transgenic mouse models both recapitulate the splicing abnormalities observed in DM1 patients (28,59). Our findings showing that the steady-state levels of CUGBP1 and MBNL1 mRNAs are not significantly altered in DM1 and DM2 muscles indicate that their misregulation is a consequence of posttranscriptional events acting on their stability and/or cellular localization. The enhancement in CUGBP activity observed in DM1 patients could depend on the phosphorylation status and intracellular distribution of the protein, rather than on the overexpression of the gene transcript. On the other hand, the CTG/CCTG repetitive elements sequester and inhibit the physiological function of the MBNL1 protein with no compensatory events at the transcriptional level.
Another important issue is represented by a global reduction of transcription occurring in DM1 tissues, mediated by the transcription factors (TFs) leaching from chromatin by mutant RNA (15). Sp1 is one of the TFs to be most affected by expanded RNA binding, and soon after the induction of DM1 mutation its mRNA is suppressed by about 50% (15). We, therefore, checked if the CCTG expansion could mediate a similar effect in DM2 muscles. Both DM1 and DM2 samples showed an average of 30% in the reduction of the Sp1 mRNA levels. This could be one of the possible causes of the CLCN1 transcription depression, because the CLCN1 promoter contains multiple Sp1 consensus sites, but additional functional studies are needed in order to address this question. The impact of DM1 mutation on CLCN1 mRNA levels in humans has been extensively investigated (9,30). In the muscle of long repeat (CTG)250 transgenic mice, reduction to 30–40% of normals was observed (40), while in DM1 patients an almost complete loss of the correctly spliced CLCN1 mRNA and protein was reported by RT-PCR experiments (9).
A recent paper by Lueck et al. (35) reported that two different transgenic DM mice models exhibit a reduction in both the number of functional sarcolemmal ClC-1 and maximal channel open probability, as well as an acceleration in the kinetics of channel deactivation. Our own test of CLCN1 mRNA in DM1/ DM2 patients showed a 70–75% suppression in transcription levels of controls in DM1 samples and a 50–60% reduction of controls in DM2 samples, thus supporting a common phenomenon in human and mouse models. There is no doubt that the expression of RNA transcripts containing pathogenic repeats length can produce defects in alternative splicing of multiple mRNAs, providing a basis for the multisystemic features of DM1 and DM2. Therefore, we thoroughly investigated the splicing pattern of three genes of definite involvement in the DM clinical phenotype (CLCN1, IR, and MTMR1). The IR gene splicing pattern resulted unbalanced in both DM1 and DM2 samples. An aberrant splicing pattern was also found for the CLCN1 gene in all DM tissues analyzed. Interestingly, we were able to detect three major aberrant splicing isoforms (CLCN16b7a, CLCN16Δ6b7a, and CLCN17a), indicating a defect in the CLCN1 splicing similar in both DM1 and DM2. All these isoforms contain exon 7a and encode for a truncated form of the ClC-1 protein, which could be either nonfunctional or have a dominant-negative effect.
However, no abnormalities were found in the splicing pattern of the MTMR1 gene. Analysis of the MTMR1 pre-mRNA in cultured muscle cells and in skeletal muscle of patients with congenital myotonic dystrophy showed a reduction of the adult isoform C and the appearance of an abnormal isoform G, which is not evident in controls. Our data indicate that a misregulation of MTMR1 pre-mRNA splicing does not occur in muscle tissues from DM1 and DM2 adult patients: low levels of fetal isoforms A and B are found in both DM and the control group, but the levels of mature C isoform is always predominant and is not reduced in muscle biopsies from patients. Moreover, we did not detect the aberrant G isoform in any of the samples analyzed. These findings could contribute to elucidate the role of MTMR1 in the pathogenesis of myopathy in adult DM. Increased amounts of MTMR1 fetal isoforms seem to be a peculiarity of congenital DM1 because muscle tissues from either adult DM1 and DM2 patients (never showing the congenital form of the disease) express high levels of the MTMR1 adult C isoform. These observations further support a role for MTMR1 in muscle formation and maturation.
Profiling of DM1/DM2 Muscle Biopsies With Ion Channel and Transporter Genes Macroarray
Although the initial pattern of muscle weakness is noticeably different between DM1 and DM2 (distal vs. proximal, respectively), the muscle biopsies show overall a similar histology of central nuclei and increased fiber sizes. Chloride conductance via ClC-1 is primarily responsible for maintaining the negative resting membrane potential of skeletal muscle (36). However, the onset and distribution of myotonia are clearly different compared to recessive generalized myotonia caused by inactivating mutations in CLCN1. Thus, the possibility that the dysfunction of other channels may contribute to membrane hyperexcitability in DM1 cannot be ruled out.
The last part of our work focused on the expression analysis of neuroscience-related genes participating in the conduction of electric stimuli along the plasma membrane. For macroarray experiments, we decided to use pooled samples from DM1, DM2, and control subjects, thus minimizing the differences due to subject-to-subject variation. This choice was made in an effort to identify the substantial expression features between DM1, DM2, and control groups, despite the effect of biological variation. Interestingly, DM1 and DM2 have a considerable similar expression profile, which reflects a common muscle pathology background. A set of six genes were misregulated in DM1/DM2 biopsies versus controls, and they were all confirmed by QRT-PCR experiments using single, not pooled, samples with a Pearson coefficient of 0.7. These results indicate that pooling of samples can be a reliable choice for very small designs, as published elsewhere (29,47). The misregulated genes encode for pumps or channels essential in ionic transport (ATP1B1, CACNB1, SCN1B, KCNN3) and for membrane regulators of the mitochondrial functions (SLC25A4, SLC25A5). The ATP1B1 protein belongs to a family of ubiquitously expressed Na,K-ATPase, which establishes and maintains an electrochemical gradient across the plasma membrane in virtually all mammalian cells (33).
Homogenates of skeletal muscle and muscle cells from patients with myotonic DM showed a downregulation in Na,K-ATPase activity (3,12), which is possibly due to the reduction in the ATP1B1 mRNA levels observed in this study. A reduced Na+–K+ pump content may contribute to the abnormally high exercise-induced hyperkalemia observed in patients with DM and may explain the increased [Na+]i and depolarization observed in DM muscle (16,23). The consequences of ATP1B1 repression could act in combination with the misregulation of the SCN1B and SK3 gene found in both DM1 and DM2 samples. The SCN1B protein is a voltage-sensitive membrane sodium channel required for normal inactivation kinetics of the Na+ channel. The beta-1 subunit is crucial in the assembly, expression, and functional modulation of the alpha subunit isoforms in brain, skeletal muscle, and heart, all of which are the tissues mainly affected in DM patients (38). Functional expression of the SCN1B mutations revealed defects in fast channel inactivation, similar to what has been observed for mutations in the sodium channel, voltage-gated, type IV, alpha subunit (SCN4A) gene, all causing an impaired fast inactivation (1).
In this work we found no alteration in the level of SCN4A gene mRNA between DM and controls, in accordance with previous findings that SCN4A protein levels are not affected in DM1 patients (9). Nevertheless, the sodium current alterations detected in DM1 could be caused by a modulatory effect of the SCN1B protein on the gating mode changes of the alpha subunit itself. We also found that the level of SK3 channel mRNA is increased in muscle from DM1 and DM2 patients. One possible consequence is the accumulation of K+ in T-tubules by SK3 channels and the local depolarization of the cell membrane, which subsequently contributes to the hyper-excitability of muscle fibers.
In addition to the impairment in the Na/K intracellular equilibrium, an increase in resting Ca2+ concentration has also been reported in cultured DM myotubes (26). Alteration in the skeletal muscle ryanodine receptor 1 (Ryr1) and sarcoplasmic/endoplasmic reticulum Ca2+-ATPase (SERCA) transcripts have been recently described in DM1 muscle (30), where they might contribute to the membrane hyperexcitability and Ca2+ homeostasis impairment of DM muscle cells. Moreover, the generation of mouse mutants deficient in dmpk have revealed altered Na+ ion channel activity and Ca2+ and Na+ ion homeostasis in muscle, similar to what has been found in DM1 patients (3,4,19).
Our finding of a reduction in the CACNB1 mRNA levels in tissues from DM1 and DM2 patients can enrich this scenario because CACNB1 is an L-type voltage-dependent calcium channel playing an essential role in skeletal muscle contraction (61). Alteration in genes involved in ion transport and metabolism were not the only finding of this study. We also observed a strong reduction of genes that are important for the cellular metabolism and energetic in DM1/DM2 tissues. SLC25A4 (ANT1) and SLC25A5 (ANT2) encode for two different isoforms of the adenine nucleoide translocase (ANT), which catalyzes the exchange of ADP and ATP across the inner mitochondrial membrane (13). This protein is the only mitochondrial translocase for nucleotides and represents the most important link between energy-producing and energy-consuming processes. A reduction of the SLC25A4 and SLC25A5 mRNAs may, therefore, indicate an alteration in the mitochondrial function, which explains the rapid depletion of energy stores in exercising DM muscle and the significant elevations in the concentration ratios of Pi/ATP, phosphomonoesters/ATP, and phosphodiesters/ATP observed in resting DM1 muscle (57). When we compared the expression profile of DM1 versus DM2 muscle using a twofold threshold for dysregulation, we were not able to find differentially regulated genes.
In conclusion, our study shows strong molecular parallels between DM1 and DM2 that may generate an unitary biochemical mechanism underlying the wide range of disease manifestations common to both disorders. The clinical and molecular analogies of DM1 and DM2 demonstrate the multisystemic effects of CUG and CCUG expansions. Downstream differences in the spatiotemporal expression of the CUG-versus CCUG-containing transcripts or epigenetic modification at DM1 and DM2 loci could, on the other hand, be responsible for the clinical distinctions between the two diseases. The alteration of the IR and CLCN1 pre-mRNA processing straightens the hypothesis of a spliceopathy, which leads to an expression of isoforms inadequate for a particular tissue or developmental stage (46). Although the specific implications for pathogenesis are uncertain, it seems likely that effects of DM will extend beyond spliceopathy to include a more general disturbance of transcriptional control leading to the misregulation of genes important for the conduction of electrical stimuli. A key question at present is to understand how these genes act in combination with the ClC-1 gene depletion observed in DM muscle. Further expression and functional investigations are needed to elucidate the pathogenesis of muscle weakness and wasting in DM.
ACKNOWLEDGMENTS
We would like to thank Dr. Paola Borgiani for helping in the statistical analysis. This work is supported by the Italian Ministry of Education, University and Research (PRIN grant # 2005064759) and Telethon Bank NGTB06001.
REFERENCES
- 1. Alekov A.; Rahman M. M.; Mitrovic N.; Lehmann-Horn F.; Lerche H. A sodium channel mutation causing epilepsy in man exhibits subtle defects in fast inactivation and activation in vitro. J. Physiol. 529:533–539; 2000. [DOI] [PMC free article] [PubMed] [Google Scholar]
- 2. Benders A. A. G. M.; Wevers R. A.; Veerkamp J. H. Ion transport in human skeletal muscle cells: Disturbances in myotonic dystrophy and Brody’s disease. Acta Physiol. Scand. 156:355–367; 1996. [DOI] [PubMed] [Google Scholar]
- 3. Benders A. A. G. M.; Groenen P. J. T. A.; Oerlemans F. T. J. J.; Veerkamp J. H.; Wieringa B. Myotonic dystrophy protein kinase is involved in the modulation of Ca2+ homeostasis in skeletal muscle cells. J. Clin. Invest. 100:1440–1447; 1997. [DOI] [PMC free article] [PubMed] [Google Scholar]
- 4. Bonifazi E.; Vallo L.; Giardina E.; Botta A.; Novelli G. A long PCR-based molecular protocol for detecting normal and expanded ZNF9 alleles in myotonic dystrophy type 2. Diagn. Mol. Pathol. 13:164–166; 2004. [PubMed] [Google Scholar]
- 5. Botta A.; Caldarola S.; Vallo L.; Bonifazi E.; Fruci D.; Gullotta F.; Massa R.; Novelli G.; Loreni F. Effect of the [CCTG]n repeat expansion on ZNF9 expression in myotonic dystrophy type II (DM2). Biochim. Biophys. Acta 1762:329–334; 2006. [DOI] [PubMed] [Google Scholar]
- 6. Brook J. D.; McCurrach M. E.; Harley H. G.; Buckler A. J.; Church D.; Aburatani H.; Hunter K.; Stanton V. P.; Thirion J. P.; Hudson T.; et al. Molecular basis of myotonic dystrophy: expansion of a trinucleotide (CTG) repeat at the 3′ end of a transcript encoding a protein kinase family member. Cell 68:799–808; 1992. [DOI] [PubMed] [Google Scholar]
- 7. Buj-Bello A.; Furling D.; Tronchere H.; La Porte J.; Lerouge T.; Butler-Browne G. S.; Mandle J. L. Muscle-specific alternative splicing of myotubularin-related 1 gene is impaired in DM1 muscle cells. Hum. Mol. Genet. 11:2297–2307; 2002. [DOI] [PubMed] [Google Scholar]
- 8. Carango P.; Noble J. E.; Marks H. G.; Funanage V. L. Absence of myotonic dystrophy protein kinase (DMPK) mRNA as a result of a triplet repeat expansion in myotonic dystrophy. Genomics 18:340–348; 1993. [DOI] [PubMed] [Google Scholar]
- 9. Charlet B. N.; Savkur R. S.; Singh G.; Philips A. V.; Grice E. A.; Cooper T. A. Loss of the muscle-specific chloride channel in type1 myotonic dystrophy due to misregulated alternative splicing. Mol. Cell 10:45–53; 2002. [DOI] [PubMed] [Google Scholar]
- 10. Day J. W.; Roelefs R.; Leroy B.; Pech I.; Benzow K.; Ranum L. P. Clinical and genetic characteristics of a five-generation family with a novel form of myotonic dystrophy (DM2). Neuromuscul. Disord. 9:19–27; 1999. [DOI] [PubMed] [Google Scholar]
- 11. Day J. W.; Ranum L. P. RNA pathogenesis of the myotonic dystrophies. Neuromuscul. Disord. 15:5–16; 2005. [DOI] [PubMed] [Google Scholar]
- 12. Desnuelle C.; Lombet A.; Serratrice G.; Lazdunski M. Sodium channel and sodium pump in normal and pathological muscles from patients with myotonic muscular dystrophy and lower motor neuron impairment. J. Clin. Invest. 69:358–367; 1982. [DOI] [PMC free article] [PubMed] [Google Scholar]
- 13. Doerner A.; Pauschinger M.; Badorff A.; Noutsias M.; Giessen S.; Schulze K.; Bilger J.; Rauch U.; Schultheiss H. P. Tissue-specific transcription pattern of the adenine nucleotide translocase isoforms in humans. FEBS Lett. 414:258–262; 1997. [DOI] [PubMed] [Google Scholar]
- 14. Dunne P. W.; Walch E. T.; Epstein H. F. Phosphorylation reactions of recombinant human myotonic dystrophy protein kinase and their inhibition. Biochemistry 33:10809–10814; 1994. [DOI] [PubMed] [Google Scholar]
- 15. Ebralidze A.; Wang Y.; Petkova V.; Ebralidse R.; Junhans R. P. RNA leaching of transcription factors disrupts transcription in myotonic dystrophy. Science 303:383–387; 2004. [DOI] [PubMed] [Google Scholar]
- 16. Edstrom L.; Wroblewski R. Intracellular elemental composition of single muscle fibres in muscular dystrophy and dystrophia myotonica. Acta Neurol. Scand. 80:419–424; 1989. [DOI] [PubMed] [Google Scholar]
- 17. Fardaei M.; Larkin K.; Brook J. D.; Hamshere M. G. In vivo colocalisation of MBNL protein with DMPK expanded-repeat transcripts. Nucleic Acids Res. 29:2766–2771; 2001. [DOI] [PMC free article] [PubMed] [Google Scholar]
- 18. Fardaei M.; Rogers M. T.; Thorpe H. M.; Larkin K.; Hamshere M. G.; Harper P. S.; Brook J. D. Three proteins, MBNL, MBLL and MBXL, co-localize in vivo with nuclear foci of expanded-repeat transcripts in DM1and DM2 cells. Hum. Mol. Genet. 11:805–814; 2002. [DOI] [PubMed] [Google Scholar]
- 19. Franke C.; Hatt H.; Iaizzo P. A.; Lehmann-Horn F. Characteristics of Na+ channels and Cl- conductance in resealed muscle fibre segments from patients with myotonic dystrophy. J. Physiol. 425:391–405; 1990. [DOI] [PMC free article] [PubMed] [Google Scholar]
- 20. Fu Y. H.; Pizzuti A.; Fenwick R. G. Jr.; King J.; Rajnarayan S.; Dunne P. W.; Dubel J.; Nasser G. A.; Ashizawa T.; De Jong P.; et al. An unstable triplet repeat in a gene related to myotonic muscular dystrophy. Science 255:1256–1258; 1992. [DOI] [PubMed] [Google Scholar]
- 21. Fu Y. H.; Friedman D. L.; Richards S.; Pearlman J. A.; Gibbs R. A.; Pizzuti A.; Ashizawa T.; Perryman M. B.; Scarlato G.; Fenwick R. G. Jr.; et al. Decreased expression of myotonin-protein kinase messenger RNA and protein in adult form of myotonic dystrophy. Science 260:235–238; 1993. [DOI] [PubMed] [Google Scholar]
- 22. Gennarelli M.; Pavoni M.; Amicucci P.; Novelli G.; Dallapiccola B. A single polymerase chain reaction protocol for detecting normal and expanded alleles in myotonic dystrophy. Diagn. Mol. Pathol. 7:135–137; 1998. [DOI] [PubMed] [Google Scholar]
- 23. Gruener R.; Stern L. Z.; Markovitz D.; Gerdes C. Electrophysiologic properties of intercostal muscle fibers in human neuromuscular diseases. Muscle Nerve 2:165–172; 1979. [DOI] [PubMed] [Google Scholar]
- 24. Harper P. S. Myotonic dystrophy, 3rd ed. London: Saunders; 2001. [Google Scholar]
- 25. Ho T. H.; Bundman D.; Armstrong D. L.; Cooper T. A. Transgenic mice expressing CUG-BP1 reproduce splicing mis-regulation observed in myotonic dystrophy. Hum. Mol. Genet. 14:1539–1547; 2005. [DOI] [PubMed] [Google Scholar]
- 26. Jacobs A. E.; Benders A. A.; Oosterhof A.; Veerkamp J. H.; van Mier P.; Wevers R. A.; Joosten E. M. The calcium homeostasis and the membrane potential of cultured muscle cells from patients with myotonic dystrophy. Biochim Biophys Acta 1096:14–19; 1990. [DOI] [PubMed] [Google Scholar]
- 27. Jiang H.; Mankodi A.; Swanson M. S.; Moxley R. T.; Thornton C. A. Myotonic dystrophy type 1 is associated with nuclear foci of mutant RNA, sequestration of muscleblind proteins and deregulated alternative splicing in neurons. Hum. Mol. Genet. 13:3079–3088; 2004. [DOI] [PubMed] [Google Scholar]
- 28. Kanadia R. N.; Johnstone K. A.; Mankodi A.; Lungu C.; Thorthon C. A.; Esson D.; Timmers A. M.; Hauswirth W. W.; Swanson M. S. A muscleblind knockout model for myotonic dystrophy. Science 302:1978–1980; 2003. [DOI] [PubMed] [Google Scholar]
- 29. Kendziorski C.; Irizarry R. A.; Chen K. S.; Haag J. D.; Gould M. N. On the utility of pooling biological samples in microarray experiments. Proc. Natl. Acad. Sci. USA 102:4252–4257; 2005. [DOI] [PMC free article] [PubMed] [Google Scholar]
- 30. Kimura T.; Takahashi M. P.; Okuda Y.; Kaido M.; Fujimura H.; Yanagihara T.; Sakoda S. The expression of ion channel mRNAs in skeletal muscles from patients with myotonic muscular dystrophy. Neurosci. Lett. 295:93–96; 2000. [DOI] [PubMed] [Google Scholar]
- 31. Kimura T.; Nakamori M.; Lueck J. D.; Pouliquin P.; Aoike F.; Fujimura H.; Dirksen R. T.; Takahashi M. P.; Dulhunty A. F.; Sakoda S. Altered mRNA splicing of the skeletal muscle ryanodine receptor and sarcoplasmic/endoplasmic reticulum Ca2+-ATPase in myotonic dystrophy type 1. Hum. Mol. Genet. 14:2189–2200; 2005. [DOI] [PubMed] [Google Scholar]
- 32. Ladd A. N.; Charlet N.; Cooper T. A. The CELF family of RNA binding proteins is implicated in cell-specific and developmentally regulated alternative splicing. Mol. Cell. Biol. 21:1285–1296; 2001. [DOI] [PMC free article] [PubMed] [Google Scholar]
- 33. Lingrel J. B.; Orlowski J.; Shull M. M.; Price E. M. Molecular genetics of Na,K-ATPase. Prog. Nucleic Acid Res. Mol. Biol. 38:37–89; 1990. [DOI] [PubMed] [Google Scholar]
- 34. Liquori C. L.; Ricker K.; Moseley M. L.; Jacobsen J. F.; Kress W.; Naylor S. L.; Day J. W.; Ranum L. P. Myotonic dystrophy type 2 caused by a CCTG expansion in intron 1 of ZNF9. Science 293:864–867; 2001. [DOI] [PubMed] [Google Scholar]
- 35. Lueck J. D.; Mankodi A.; Swanson M. S.; Thornton C. A.; Dirksen R. T. Muscle chloride channel dysfunction in two mouse models of myotonic dystrophy. J. Gen. Physiol. 129:79–94; 2007. [DOI] [PMC free article] [PubMed] [Google Scholar]
- 36. Maduke M.; Miller C.; Mindell J. A. A decade of CLC chloride channels: structure, mechanism, and many unsettled questions. Annu. Rev. Biophys. Biomol. Struct. 29:411–438; 2000. [DOI] [PubMed] [Google Scholar]
- 37. Mahadevan M.; Tsilfidis C.; Sabourin L.; Shutler G.; Amemiya C.; Jansen G.; Neville C.; Narang M.; Barcelo J.; O’Hoy K.; et al. Myotonic dystrophy mutation: An unstable CTG repeat in the 3′ untranslated region of the gene. Science 255:1253–1255; 1992. [DOI] [PubMed] [Google Scholar]
- 38. Makita N.; Sloan-Brown K.; Weghuis D. O.; Ropers H. H.; George A. L. Jr. Genomic organization and chromosomal assignment of the human voltage-gated Na+ channel beta 1 subunit gene (SCN1B). Genomics 23:628–634; 1994. [DOI] [PubMed] [Google Scholar]
- 39. Mankodi A.; Urbinati C. R.; Yuan Q. P.; Moxley R. T.; Sansone V.; Krym M.; Henderson D.; Schalling M.; Swanson M. S.; Thornton C. A. Muscleblind localizes to nuclear foci of aberrant RNA in myotonic dystrophy types 1 and 2. Hum. Mol. Genet. 10:2165–2170; 2001. [DOI] [PubMed] [Google Scholar]
- 40. Mankodi A.; Takahashi M. P.; Jiang H.; Beck C. L.; Bowers W. J.; Moxley R. T.; Cannon S. C.; Thornton C. A. Expanded CUG repeats trigger aberrant splicing of ClC-1 chloride channel pre-mRNA and hyperexcitability of skeletal muscle in myotonic dystrophy. Mol. Cell 10:35–44; 2002. [DOI] [PubMed] [Google Scholar]
- 41. Margolis J. M.; Schoser B. G.; Moseley M. L.; Day J. W.; Ranum L. P. DM2 intronic expansions: evidence for CCUG accumulation without flanking sequence or effects on ZNF9 mRNA processing or protein expression. Hum. Mol. Genet. 15:1808–1815; 2006. [DOI] [PubMed] [Google Scholar]
- 42. Meola G.; Moxley R. T. III Myotonic dystrophy type 2 and related myotonic disorders. J. Neurol. 251:1173–1182; 2004. [DOI] [PubMed] [Google Scholar]
- 43. Miller J. W.; Urbinati C. R.; Teng-Umnuay P.; Stenberg M. G.; Byrne B. J.; Thornton C. A.; Swanson M. S. Recruitment of human muscleblind proteins to (CUG)(n) expansions associated with myotonic dystrophy. EMBO J. 19:4439–4448; 2000. [DOI] [PMC free article] [PubMed] [Google Scholar]
- 44. Mussini I.; Donatella B.; Marin O.; Furlan S.; Salvatori S. Myotonic dystrophy protein kinase expressed in rat cardiac muscle is associated with sarcoplasmic reticulum and gap junctions. J. Histochem. Cytochem. 47:383–392; 1999. [DOI] [PubMed] [Google Scholar]
- 45. Nagamitsu S.; Matsuura T.; Khajavi M.; Armstrong R.; Gooch C.; Harati Y.; Ashizawa T. A “dystrophic” variant of autosomal recessive myotonia congenita caused by novel mutations in the CLCN1 gene. Neurology 55:1697–1703; 2000. [DOI] [PubMed] [Google Scholar]
- 46. Osborne R. J.; Thornton C. A. RNA-dominant diseases. Hum. Mol. Genet. 15:R162–R169; 2006. [DOI] [PubMed] [Google Scholar]
- 47. Peng X.; Wood C. L.; Blalock E. M.; Chen K. C.; Landfield P. W.; Stromberg A. J. Statistical implications of pooling RNA samples for microarray experiments. BMC Bioinformatics 24:4–26; 2003. [DOI] [PMC free article] [PubMed] [Google Scholar]
- 48. Philips A. V.; Timchenko L. T.; Cooper T. A. Disruption of splicing regulated by a CUG-binding protein in myotonic dystrophy. Science 280:737–741; 1998. [DOI] [PubMed] [Google Scholar]
- 49. Ranum L. P.; Rasmussen P. F.; Benzow K. A.; Koob M. D.; Day J. W. Genetic mapping of a second myotonic dystrophy locus. Nat. Genet. 19:196–198; 1998. [DOI] [PubMed] [Google Scholar]
- 50. Ranum L. P.; Day J. W. Pathogenic RNA repeats: An expanding role in genetic disease. Trends Genet. 20:506–512; 2004. [DOI] [PubMed] [Google Scholar]
- 51. Rajavashisth T. B.; Taylor A. K.; Andalibi A.; Svenson K. L.; Lusis A. J. Identification of a zinc finger protein that binds to the sterol regulatory element. Science 245:640–643; 1989. [DOI] [PubMed] [Google Scholar]
- 52. Ricker K.; Koch M. C.; Lehmann-Horn F.; Pongratz D.; Otto M.; Heine R.; Moxley R. T. III Proximal myotonic myopathy: A new dominant disorder with myotonia, muscle weakness, and cataracts. Neurology 44:1448–1452; 1994. [DOI] [PubMed] [Google Scholar]
- 53. Savkur R. S.; Philips A. V.; Cooper T. A. Aberrant regulation of insulin receptor alternative splicing is associated with insulin resistance in myotonic dystrophy. Nat. Genet. 29:40–47; 2001. [DOI] [PubMed] [Google Scholar]
- 54. Savkur R. S.; Philips A. V.; Cooper T. A.; Dalton J. C.; Moseley M. L.; Ranum L. P.; Day J. W. Insulin receptor splicing alteration in myotonic dystrophy type 2. Am. J. Hum. Genet. 74:1309–1313; 2004. [DOI] [PMC free article] [PubMed] [Google Scholar]
- 55. Schneider C.; Wessig C.; Muller C. R.; Brechtelsbauer D.; Grimm T. Proximal myotonic myopathy and proximal myotonic dystrophy: Two different entities? The phenotypic variability of proximal myotonic syndromes Neuromuscul. Disord. 11:485–488; 2001. [DOI] [PubMed] [Google Scholar]
- 56. Sergeant N.; Sablonniere B.; Schraen-Maschke S.; Ghestem A.; Maurage C. A.; Wattez A.; Vermersch P.; Delacourte A. Dysregulation of human brain microtubule-associated tau mRNA maturation in myotonic dystrophy type 1. Hum. Mol. Genet. 10:2143–2155; 2001. [DOI] [PubMed] [Google Scholar]
- 57. Taylor D. J.; Kemp G. J.; Woods C. G.; Edwards J. H.; Radda G. K. Skeletal muscle bioenergetics in myotonic dystrophy. J. Neurol. Sci. 116:193–200; 1993. [DOI] [PubMed] [Google Scholar]
- 58. Timchenko L. T.; Miller J. W.; Timchenko N. A.; De Vore D. R.; Datar K. V.; Lin L.; Roberts R.; Caskey C. T.; Swanson M. S. Identification of a (CUG)n triplet repeat RNA-binding protein and its expression in myotonic dystrophy. Nucleic Acids Res. 24:4407–4414; 1996. [DOI] [PMC free article] [PubMed] [Google Scholar]
- 59. Timchenko N. A.; Patel R.; Iakova P.; Cai Z. J.; Quan L.; Timchenko L. T. Overexpression of CUG triplet repeat-binding protein, CUGBP1, in mice inhibits myogenesis. J. Biol. Chem. 279:13129–13139; 2004. [DOI] [PubMed] [Google Scholar]
- 60. Vermersch P.; Sergeant N.; Ruchoux M. M.; Hofmann-Radvanyi H.; Wattez A.; Petit H.; Dwailly P.; Delacourte A. Specific tau variants in the brains of patients with myotonic dystrophy. Neurology 47:711–717; 1996. [DOI] [PubMed] [Google Scholar]
- 61. Wrzosek A. Regulation of Ca2+ release from internal stores in cardiac and skeletal muscles. Acta Biochim. Pol. 47:705–723; 2000. [PubMed] [Google Scholar]