

Abstract
We develop a general method to identify gene networks from pair-wise correlations between genes in a microarray data set and apply it to a public prostate cancer gene expression data from 69 primary prostate tumors. We define the degree of a node as the number of genes significantly associated with the node and identify hub genes as those with the highest degree. The correlation network was pruned using transcription factor binding information in VisANT (http://visant.bu.edu/) as a biological filter. The reliability of hub genes was determined using a strict permutation test. Separate networks for normal prostate samples, and prostate cancer samples from African Americans (AA) and European Americans (EA) were generated and compared. We found that the same hubs control disease progression in AA and EA networks. Combining AA and EA samples, we generated networks for low (<7) and high (≥7) Gleason grade tumors. A comparison of their major hubs with those of the network for normal samples identified two types of changes associated with disease: (i) Some hub genes increased their degree in the tumor network compared to their degree in the normal network, suggesting that these genes are associated with gain of regulatory control in cancer (e.g. possible turning on of oncogenes). (ii) Some hubs reduced their degree in the tumor network compared to their degree in the normal network, suggesting that these genes are associated with loss of regulatory control in cancer (e.g. possible loss of tumor suppressor genes). A striking result was that for both AA and EA tumor samples, STAT5a, CEBPB and EGR1 are major hubs that gain neighbors compared to the normal prostate network. Conversely, HIF-1α is a major hub that loses connections in the prostate cancer network compared to the normal prostate network. We also find that the degree of these hubs changes progressively from normal to low grade to high grade disease, suggesting that these hubs are master regulators of prostate cancer and marks disease progression. STAT5a was identified as a central hub, with ~120 neighbors in the prostate cancer network and only 81 neighbors in the normal prostate network. Of the 120 neighbors of STAT5a, 57 are known cancer related genes, known to be involved in functional pathways associated with tumorigenesis. Our method is general and can easily be extended to identify and study networks associated with any two phenotypes.
Keywords: network analysis, microarray analysis, prostate cancer, STAT5a, cancer progression
1. Introduction
It is estimated that about 1.5 million new cases of cancer will be diagnosed in 2009 in the US alone of which about 766,000 will be in men and about 713,000 in women. 25% of all male cancers will be in the prostate (www.cancer.org). Improved diagnosis methods and effective surgical intervention followed by radiation and/or hormone treatment have reduced mortality to ~20%, however, prostate cancer is still second in cancer-related mortality in men, after lung/bronchial cancers. Prostate-specific antigen (PSA) is one of the few reliable early indicators for prostate cancer and almost half the diagnosed prostate cancers are identified due to biopsy following elevated PSA levels. PSA is also used, with significantly less success, to monitor progression and recurrence.
A significant concern relates to the fact that prostate cancer is often diagnosed on autopsy in young accident victims, suggesting that we might be over diagnosing/treating prostate cancer. This suggests that molecular identification of markers associated with aggressive tumors may suggest which tumors to treat and which to leave alone. Another concern is that once the tumor becomes refractory to hormone treatment, it is very difficult to treat and often becomes metastatic. Hence, a major clinical quandary at diagnosis is which tumors to treat and which to leave alone? In such a complex clinical setting, identifying the key markers which track disease progression becomes an urgent need.
Most clinical assays use single gene markers to track disease stage, grade and progression. Gene expression studies on the other hand, generate long lists of genes significantly associated with disease but have difficulty identifying biological mechanisms or key genes associated with disease progression which might reliably complement PSA and Gleason grade (Gleason grade is a measure used to assess disease progression on the basis of histology). The goal of our paper is to develop a simple approach which uses correlations between genes in expression datasets to identify the network associated with normal prostate and low and high grade disease, and to identify the key nodes associated with progression. To reduce the number of false positive hubs, we apply the transcription factor binding network from VisANT (http://visant.bu.edu) as a filter.
There are two popular approaches to building networks:
knowledge-based networks: These are networks built from mining the literature. Some examples are protein-protein interaction (PPI) networks [21], transcription factor networks [33], pathways databases (KEGG, BIOCARTA, etc.)
high dimensional data-driven networks: these are networks built from molecular or genetic data These methods use correlation [3, 20, 16, 25]. Li and Horvath [17] proposed a robust measure called Topological Overlap measure (TOM) for identifying modules associated with disease in microarray data. Yeung and colleagues [34] built gene networks by reverse engineering methods from microarray data and then used these networks as filters for predicting outcome in prostate cancer.
Knowledge based networks are generally reliable, but they tend not to suggest novel targets or mechanisms because of their bias towards “popular” genes/proteins. Data-driven networks use an unbiased approach but tend to be noisy and generate many false positives. A possible improved approach to network analysis involves combining knowledge-based and data-based networks (see [4], [31] for some examples of this approach). In this paper we propose a novel mixed approach which combines knowledge-based and data-driven networks to find a small number of reliable and biologically relevant markers of progression in high throughput data.
1.1. Methods
1.2. Preprocessing of Microarray data
We used data from previously published molecular profiling of prostate cancer by Ambs et al. [2, 32]. The data consisted of expression levels for 69 prostate cancer samples, 18 adjacent normal samples and 2 pooled normal prostate samples on Affymetrix U133A_2 chips. The 69 prostate cancer samples consisted of 33 African American (AA) and 36 European American (EA) patients. CEL files were downloaded from GEO (GSE6569) and RMA normalized [15]. Probe annotations were updated using the CDF file provided from MBNI version 12, Ensembl gene database [8, 24]. The MBNI algorithm re-annotates the Affymetrix probes to the current build of the human genome and retains only those probes which map to unique regions. Finally FARMS I/NI filtering [26] was performed to remove uninformative and noisy probes.
1.3. Co-regulation of genes
Correlation (co-regulation) between pairs of genes was measured using Spearman Rank Correlation Coefficient. We chose this measure because it is more insensitive to noise in the data than others (e.g. Pearson correlation coefficient). To assess the significance of the correlation, i.e., probability that the correlation is not by chance, we created empirical null distributions by randomly permuting the samples for a given pair of genes. These permutation tests were run 10,000 times for every pair of genes. The correlation between each pair of genes was considered significant if the p-value of finding the same or higher correlation in the empirical null distribution were < 0.1, i.e., for each gene-gene pair, less than 10% of the correlations in randomized permutation tests are larger than the actual correlation. Using such an empirical p-value to assess the significance of the correlation is better than using a threshold on the correlations, because it allows every gene pair to have its own significance level based on the noise inherent to that pair. It is also the preferred way to compare different datasets.
1.4. Network analysis
The correlations are input into a matrix C, called the “connectivity matrix” of size Ng x Ng where Ng = number of genes. The entry Cij was set to 1 if genes i, j interact (using a criterion defined below) and 0 otherwise. In our definition, two genes were connected (and the corresponding entry in C was 1) if they were significantly co-regulated at p-value < 0.1 relative to their data-inferred null distribution. Note that we do not distinguish between positive and negative correlations or between association and actual (direct physical) connections. To distinguish between these, it is necessary to use additional (biological or other) information as a filter. In this paper we used the transcription factor networks [12] as implemented in VisANT (http://visant.bu.edu; [13]) for this purpose. The transcription factor network was overlaid on the co-regulation network obtained from gene expression data, and only the intersection was retained. We identified hubs as genes with degree > 15 in the resulting networks.
1.5. Stability analysis by bootstrapping
Bootstrap analysis was used to quantify the stability of hubs under sample perturbation. The network analysis was repeated 100 times for subsets of 80% of the samples, and the degree and connections of the hubs were determined for each subset. This analysis also provided the mean and 95% confidence interval for the degree of each hub, which provided a measure of significance for changes in the hub degree when comparing between two phenotypes (e.g. normal vs. disease).
2. Results
We downloaded gene-expression data from [2], filtered probes using MBNI probe annotations, normalized the data using RMA, and filtered the informative genes using FARMS I/NI. MBNI retains only those probes which map to a unique region in the human genome. This reduced the reduced the number of probes from ~ 22,000 to 11,000. FARMS I/NI filtering for informative probes further reduced this number to 5,961 probes. Separate networks were built using the genes corresponding to this reduced set of probes for African American prostate cancer (AA) samples, and European American prostate cancer (EA) samples. Independently, networks were also built from normal prostate, low and high Gleason grade tumor datasets. The major hubs in each of these phenotypes were compared to the others to understand their role in disease networks.
3.1 Hubs in AA & EA prostate cancer networks are similar
The detailed networks for African American and European American prostate cancer samples are shown in Supplementary Figure 1. The reliable hubs in the AA & EA networks have similar degrees (Figure 1a) suggesting that at least to the accuracy of this analysis, race does not distinguish disease progression in AA or EA patients. This result was validated by principal component analysis on the combined dataset (Figure 1b). We see that the AA (blue) & EA (green) samples do not form separate clusters when projected onto their first two principle components in Figure 1b. Thus, to the accuracy of this dataset, the network structure and topology for both normal prostate and prostate cancer does not depend on ethnicity. Consequently, in the subsequent analysis, we combine the AA & EA samples within each phenotype when comparing networks associated with progression from normal prostate to low and high grade disease.
Figure 1. The degree of key hubs in African American (AA), European American (EA) and normal prostate networks.

(a) The degree of the hubs for AA (blue) & EA (red) networks are not significantly different. This means that that race is not a confounding issue in tumor progression. (b) PCA plot of AA and EA prostate cancer samples. AA & EA samples cluster together in the projection of their first two PCs.
3.2 Prostate cancer and normal networks show similar genes and structure
The networks for the 18 normal prostate (adjacent tissue) samples, 18 low Gleason grade (<7) samples and 51 high Gleason grade (≥ 7) samples are shown in Supplementary Figures 2a, b and c respectively. Even though these networks were built independently, they show a very similar overall structure in terms of the genes involved in the network and the relative importance of the hubs. This suggests that progression to prostate cancer does not require a complete change in the topology of the normal prostate network. Rather, prostate cancer initiation and progression is measured by which how many genes are co-regulated by the key hubs active in normal prostate tissue.
3.3 STAT5a is the largest hub in prostate cancer networks
The major result of our analysis is the strong identification of STAT5a as the largest hub gene altered in disease and disease progression (Figure 2). STAT5a is a transcription factor on chromosome 17 involved in the JAK/STAT pathway and known to be strongly associated with the initiation and progression of prostate cancer [6, 27, 29]. The degree of STAT5a in the normal, low grade and high grade prostate cancer networks is 81, 116 and 122 respectively. It has by far the highest degree (number of neighbors) compared to all other hubs in the prostate networks. Of the 120 neighbors of STAT5a in prostate cancer networks, 57 are known cancer related genes, involved in known functional pathways associated to tumorigenesis. Interestingly, the levels of STAT5a can distinguish normal samples from low grade tumors (p-value = 0.036) and high grade tumors (p-value = 0.016). However, although its connectivity changes significantly from low to high grade, STAT5a expression is not significantly different between high and low grade tumors. This suggests that the recruitment of additional components to the STAT5a node, once the tumor is established, does not depend on the level of STAT5a; i.e. prostate cancer requires changes in the level of STAT5a to cause the changes in its network which are necessary tumor establishment but loses addiction to STAT5a level after the tumor is established. This may mean that any therapy based on STAT5a antagonists may be most effective mostly in low grade disease.
Figure 2. Hubs associated with initiation and progression of prostate cancer.
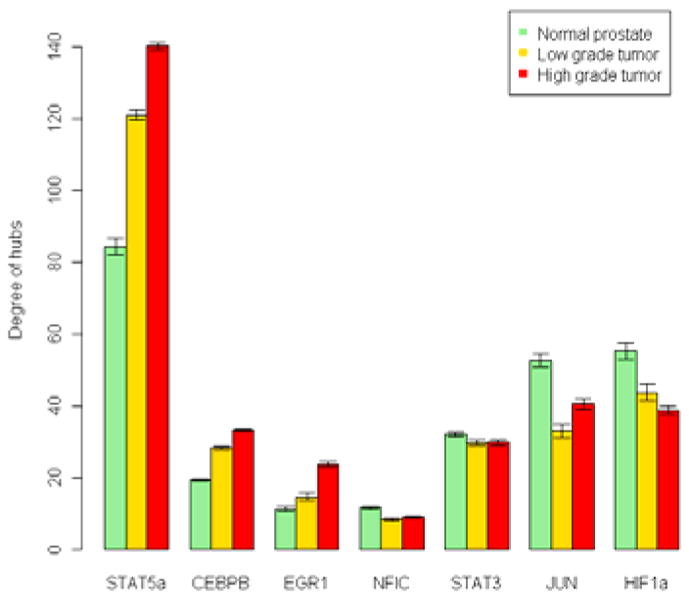
Key gene hubs were identified for normal prostate (green), low (< 7) Gleason grade tumors (orange) and high (> 7) Gleason grade tumors. Hubs define highly co-regulated genes which had more than 15 other genes significantly associated with them determined by a combination of expression and transcription factor data. The plot shows the mean degree (number of co-regulated genes) of highly connected hubs. The error bars are 95% confidence intervals using sample bootstrap experiments. Note that the degree of some of the hubs is monotone with respect to progression of disease, i.e. the degree in low grade tumors is between the degree in high grade tumors and normal prostate. STAT5a, CEBPB, EGR1 are “gain hubs”, where the tumor progressively gains connections compared to normal prostate. HIF-1a is a “loss hub”, where the tumor progressively loses connections compared to the normal prostate.
3.4 Hubs are associated with progression of prostate cancer
Figure 2 compares the degrees for the significant and highly connected hubs (degree > 15) in the normal prostate and low and high Gleason grade tumor networks. The genes at the center of these hubs are STAT5a, CEBPB, EGR1, NFIC, STAT3, JUN and HIF1a. There seem to be two types of disease associated changes in hubs: (i) Some hubs (e.g. STAT5a, CEBPB and EGR1) increase their degree in tumor samples compared to normal samples, suggesting their association with gain of regulatory control in cancer (possible turning on of oncogenes or other tumorigenic processes). (ii) Some other hubs (we identify HIF-1α as one of these) decrease their degree in tumor samples compared to normal samples, suggesting their association with loss of regulatory control in cancer (possible loss of tumor suppressor genes or turning off of tumor suppressive processes). Significantly, the degree of these hubs changes progressively from normal to low grade to high grade disease, suggesting their strong association with disease initiation and progression and identifying them genes as potential targets for therapeutic intervention.
3.5 The STAT5a hub gains neighbors in prostate cancer
The STAT5a hub gained 38 connections from normal to low grade tumors (Table 2a). These include genes known to be involved in many cancer related pathways: MAPK signaling (AKT1, CACNA2D2, FGFR2, DUSP8), ERBB signaling (AKT1, CAMK2B), mTOR signaling (AKT1), Wnt signaling (CAMK2B, FZD10), focal adhesion (AKT1, IGF1R), autophagy (ATG4B), etc. STAT5a gained another 21 connections when transitioning from low grade to high grade tumors (Table 2b), including genes in MAPK signaling (CACNA1H, FGFR3), apoptosis and toll-like receptor signaling (IRAK1), TGFβ signaling (INHBB), etc. Of these neighbors gained AKT1, FGFR2, FGFR3 are known oncogenes, while IGF2 is a known tumor suppressor gene. In Table 2 we also provide the p-value for differential expression pair-wise between normal, low grade and high grade tumors. Note that not all the genes are differentially expressed between normal samples and low grade tumors, suggesting that the complexity of cancer progression is not captured by expression analysis alone.
Table 2. Gene connections gained by STAT5a from (a) normal prostate to low grade tumor and (b) in low grade to high grade progression.
The p-values shown are from using single gene analysis and the Student’s t-test, with significant p-values (< 0.05) marked in red. Note again that single gene analysis is unable to identify all these associations (some of the p-values are not good). However, the co-regulation analysis and transcription factor filter used in our method readily identified all these links. The functional pathways associated with these genes are shown in Supplementary Table 2.
| Table 2a | |||
|---|---|---|---|
| Gene name | Normal vs. low grade tumor | Normal vs. high grade tumor | Low vs. high grade tumor |
| Student’s t-test p-value | |||
| AKT1 v-akt murine thymoma viral oncogene homolog 1 |
0.001 | 0.001 | 0.770 |
| RAP1GAP RAP1 GTPase activating protein |
0.001 | 0.000 | 0.251 |
| APBA2BP N-terminal EF-hand calcium binding protein 3 |
0.001 | 0.001 | 0.626 |
| ARID1A AT rich interactive domain 1A (SWI-like) |
0.001 | 0.001 | 0.047 |
| CACNA2D2 calcium channel, voltage-dependent, alpha 2/delta subunit 2 |
0.002 | 0.022 | 0.143 |
| ATG4B ATG4 autophagy related 4 homolog B (S. cerevisiae) |
0.002 | 0.001 | 0.638 |
| SPINT1 serine peptidase inhibitor, Kunitz type 1 |
0.002 | 0.001 | 0.465 |
| GMPPA GDP-mannose pyrophosphorylase A |
0.003 | 0.009 | 0.169 |
| CAMK2B calcium/calmodulin-dependent protein kinase II beta |
0.003 | 0.000 | 0.999 |
| AMZ2 archaelysin family metallopeptidase 2 |
0.003 | 0.002 | 0.516 |
| TTLL12 tubulin tyrosine ligase-like family, member 12 |
0.004 | 0.000 | 0.195 |
| MSH5 mutS homolog 5 (E. coli) |
0.005 | 0.001 | 0.169 |
| FGFR2 fibroblast growth factor receptor 2 |
0.008 | 0.114 | 0.161 |
| REPIN1 replication initiator 1 |
0.013 | 0.002 | 0.047 |
| LSS lanosterol synthase (2,3-oxidosqualene-lanosterol cyclase) |
0.014 | 0.159 | 0.023 |
| TSPAN4 tetraspanin 4 |
0.016 | 0.038 | 0.266 |
| KLF10 Kruppel-like factor 10 |
0.020 | 0.011 | 0.371 |
| PYCR1 sirtuin (silent mating type information regulation 2 homolog) 7 (S. cerevisiae) |
0.023 | 0.005 | 0.586 |
| CTSH cathepsin H |
0.039 | 0.007 | 0.526 |
| MGLL monoglyceride lipase |
0.050 | 0.208 | 0.112 |
| CENTG2 ArfGAP with GTPase domain, ankyrin repeat and PH domain 1 |
0.051 | 0.007 | 0.175 |
| TEAD3 TEA domain family member 3 |
0.052 | 0.135 | 0.148 |
| IGF1R insulin-like growth factor 1 receptor |
0.053 | 0.050 | 0.823 |
| MYL9 myosin, light chain 9, regulatory |
0.065 | 0.542 | 0.075 |
| GABRE gamma-aminobutyric acid (GABA) A receptor, epsilon |
0.073 | 0.061 | 0.918 |
| SIM2 single-minded homolog 2 (Drosophila) |
0.083 | 0.001 | 0.186 |
| NRP1 neuropilin 1 |
0.096 | 0.189 | 0.656 |
| PAQR4 progestin and adipoQ receptor family member IV |
0.211 | 0.944 | 0.052 |
| PER2 period homolog 2 (Drosophila) |
0.250 | 0.532 | 0.525 |
| ECGF1 sphingosine-1-phosphate receptor 1 |
0.272 | 0.086 | 0.710 |
| FZD10 frizzled homolog 10 (Drosophila) |
0.310 | 0.049 | 0.404 |
| LMNA lamin A/C |
0.406 | 0.085 | 0.427 |
| PAOX polyamine oxidase (exo-N4-amino) |
0.422 | 0.470 | 0.858 |
| RASSF7 Ras association (RalGDS/AF-6) domain family (N-terminal) member 7 |
0.439 | 0.031 | 0.065 |
| SECTM1secreted and transmembrane 1 | 0.513 | 0.030 | 0.068 |
| DUSP8 dual specificity phosphatase 8 |
0.666 | 0.542 | 0.966 |
| FOSL2 FOS-like antigen 2 |
0.776 | 0.809 | 0.605 |
| CRYBA2 crystallin, beta A2 |
0.787 | 0.934 | 0.663 |
| Table 2b | |||
|---|---|---|---|
| Gene name | Normal vs. low grade tumor | Normal vs. high grade tumor | Low vs. high grade tumor |
| Student’s t-test p-value | |||
| EFS embryonal Fyn-associated substrate |
0.009 | 0.147 | 0.000 |
| NBL1 neuroblastoma, suppression of tumorigenicity 1 |
0.026 | 0.179 | 0.000 |
| GPC1 glypican 1 |
0.028 | 0.868 | 0.003 |
| SCRIB scribbled homolog (Drosophila) | 0.035 | 0.007 | 0.005 |
| EML3 echinoderm microtubule associated protein like 3 |
0.001 | 0.000 | 0.025 |
| IRAK1 interleukin-1 receptor-associated kinase 1 |
0.392 | 0.049 | 0.100 |
| SS18L1 synovial sarcoma translocation gene on chromosome 18-like 1 |
0.010 | 0.003 | 0.130 |
| DLK2 delta-like 2 homolog (Drosophila) |
0.840 | 0.179 | 0.171 |
| BCOR BCL6 co-repressor |
0.089 | 0.018 | 0.209 |
| C20orf149 pancreatic progenitor cell differentiation and proliferation factor homolog (zebrafish) |
0.074 | 0.173 | 0.223 |
| IGF2 insulin-like growth factor 2 (somatomedin A); insulin; INS-IGF2 readthrough transcript |
0.076 | 0.317 | 0.247 |
| CACNA1H calcium channel, voltage-dependent, T type, alpha 1H subunit |
0.037 | 0.172 | 0.249 |
| IRX5 iroquois homeobox 5 |
0.076 | 0.220 | 0.300 |
| MDK Mesomelic dysplasia, Kantaputra type |
0.128 | 0.216 | 0.465 |
| SALL1 sal-like 1 (Drosophila) |
0.697 | 0.623 | 0.511 |
| FGFR3 fibroblast growth factor receptor 3 |
0.047 | 0.103 | 0.548 |
| INHBB inhibin, beta B |
0.938 | 0.588 | 0.585 |
| BCL11A B-cell CLL/lymphoma 11A (zinc finger protein) |
0.791 | 0.618 | 0.796 |
| GATA3 GATA binding protein 3 |
0.617 | 0.468 | 0.801 |
| MFAP2 microfibrillar-associated protein 2 |
0.007 | 0.002 | 0.909 |
| SH3BP4 SH3-domain binding protein 4 |
0.167 | 0.165 | 0.989 |
3. Discussion
Cancers are diseases of dysregulated pathways. Disease initiation is triggered by multiple changes in the wiring of the homeostatic network of normal tissue and disease progression caused by further changes which allow the cancer to evade regulatory pathways and drugs, spread outside its tissue of origin and establish in other organs. In spite of this well known model for cancer and the knowledge that genes do not act independently, most laboratory studies as well as studies of high throughput cancer data try to identify individual genes to understand disease initiation, progression and metastasis. In this paper we develop a complementary approach to infer the network of co-regulated genes which is dysregulated when normal tissue transforms to low grade cancer and when the low grade cancer progresses to high grade disease.
By using co-regulation of genes in microarray data to define a preliminary network, reducing the noise using strict statistical tests and retaining only biologically significant hubs using transcription factor information, our method successfully identified robust hubs in the gene networks of normal prostate and low/high grade prostate cancer. We consider our method as complementary and orthogonal to single gene analysis or analysis from pathways identified based on aggregates of single gene based results. The method we propose is general and can be used to analyze in a host of other contexts (such as protein-protein interaction networks, etc). It can also be extended to different data modalities (copy number variation data, single nucleotide polymorphisms, microRNA expression etc.). With additional data and other data modalities it should be able to address more complex biological questions. Changing the measure we use (co-regulation of genes) to identify genes with high centrality measure (genes with highest number of shortest paths going through it) would suggest how the pathway changes might affect tissue function. It is also possible to define measures to identify modules or sub-networks characteristic of disease or progression. Other extensions involve comparing groups of samples to identify similarities and differences. Cell line and animal studies and data are often used to model human tumors. Our method should be useful on such data to quantify the similarities and differences between the phenotypes in these studies to generate hypotheses for further testing.
To assess the significance of co-regulation identified we used the p-value of an empirically derived null distribution instead of using a threshold on the correlation coefficient. The advantages of this are: (a) threshold selection is often arbitrary and is imposed globally for all genes pairs, while in fact each gene should have its own threshold (b) selecting p-value threshold in this way is independent of the sample size (c) comparing p-values across dataset is now meaningful.
Using only data driven networks, we cannot distinguish between correlations which are just associations from those that are likely to be functionally relevant connections. When we used only correlation networks, we identified FGF2 as a major hub (with ~1000 connections). On further analysis we found that the reason for this is probably because FGF2 is upstream of the FGF signaling pathways in prostate cancer, and the correlations that we observe in the data are mainly associations. To distinguish between associations and actual connections we added the transcription factor network as a biological filter. This increased both the robustness of the underlying network and also identified potentially relevant (possibly mechanistic) connections.
Our analysis identified STAT5a as a major hub in the disease initiation and progression network of prostate cancer. Signal transducer and activator of transcription 5a and 5b (STAT5a/b) belong to the seven-member STAT gene family of transcription factors [30, 14]. STAT5a and STAT5b, encoded by two separated genes at chromosome 17q21, are latent cytoplasmic proteins that act as both cytoplasmic signaling proteins and nuclear transcription factors. Activations of STAT5a/b are mediated by phosphorylation of a conserved tyrosine residue (Y694 for STAT5a and Y699 for STAT5b) in the carboxy-terminal domain by a tyrosine kinase typically of the JAK protein family [22, 23]. The phosphorylated STAT5a and STAT5b dimerize, translocate into the nucleus and bind to specific STAT5 response elements of target gene promoters [9].
STAT5 activation is known to be strongly associated with high histological grade of prostate cancer [18, 19], and STAT5 activation in primary prostate cancer predicts development of castration-resistant recurrent prostate cancer [19]. STAT5 critically regulates growth and viability of human prostate cancer cells in culture and prostate cancer xenograft tumor growth in nude mice [1, 5, 7, 10]. Specifically, adenoviral expression of a dominant-negative (DN) mutant of STAT5, antisense oligonucleotide or siRNA inhibition of STAT5 all induce massive and rapid apoptotic death of human prostate cancer cells in culture [1]. In addition, inhibition of STAT5 blocked human prostate cancer xenograft tumor growth (both subcutaneous and orthotopic) in nude mice and down-regulated BclXL and Cyclin-D1 protein levels in prostate cancer cells [7]. Nuclear STAT5a/b is over-expressed in castration-resistant clinical prostate cancers [28, 30], and STAT5a/b transcriptionally synergizes with androgen receptor [28]. Given that STAT5a/b and AR are both anti-apoptotic and growth-promoting transcription factors in prostate cancer cells and expressed at high levels in castration-resistant prostate cancers, induction of AR transcriptional activity by STAT5a/b in the presence of low levels of androgens may contribute to castration-resistant growth of prostate cancer. AR, in turn, by promoting transcriptional activity of STAT5a/b, may critically support viability of prostate cancer cells in growth conditions where prostate cancer cells would normally undergo apoptosis. In summary, there is accumulating evidence supporting a key role for STAT5 in prostate cancer progression.
We also find strong evidence for cross-talk between the STAT5a and STAT3 signaling pathways. It is known that STAT5a is required for the survival of prostate cells, while STAT3 is involved in metastasis [11]. Our data supports this claim – the expression of STAT5a is high in normal adjacent prostate tissue (which can be considered to be premalignant samples). However, once the tumor progresses, STAT3 expression is high (involved in metastasis) showing that STAT5a and STAT3 play key but complementary roles in tumor initiation and progression.
Supplementary Material
Figure 3. STAT5a hub in prostate cancer.

(a) Venn diagram showing the number of genes connected to STAT5A in normal, low grade and high grade tumors and their intersections. (b) Network connections gained by STAT5a in transformation from normal prostate and low or high grade tumors. (c) Network connections gained by STAT5a in progression from low grade to high grade prostate cancer.
Table 1. Differential expression of hubs identified in regulatory networks.
Significance level of hubs associated with low and high grade tumors using single-gene analysis only. Student’s t-test p-values for differentiating pair-wise between normal prostate, low grade tumor and high grade tumor are shown with those significant at p-value <0.05 shown in red (these hubs can be identified by single link analysis using the t-test). However, the rest of the hubs (those with poor p-values) can only be identified by the co-regulation analysis we present here. They are not identifiable using single gene analysis. The functional pathways associated with these genes are presented in Supplementary Table 1.
| Gene Name | Type of hub | Normal vs. Low grade tumors | Normal vs. High grade tumors | Low vs. High grade tumors |
|---|---|---|---|---|
| t-test p-value | ||||
| STAT5a signal transducer and activator of transcription 5A |
Gain | 0.036 | 0.016 | 0.819 |
| CEBPB CCAAT/enhancer binding protein (C/EBP), beta | Gain | 0.570 | 0.041 | 0.237 |
| EGR1 early growth response 1 |
Gain | 0.601 | 0.362 | 0.142 |
| NFIC nuclear factor I/C (CCAAT-binding transcription factor) |
0.897 | 0.820 | 0.776 | |
| STAT3 signal transducer and activator of transcription 3 |
0.001 | 0.005 | 0.002 | |
| JUN jun oncogene |
0.173 | 0.070 | 0.707 | |
| HIF-1a hypoxia inducible factor 1, alpha subunit |
Loss | 0.026 | 0.050 | 0.464 |
References
- 1.Ahonen TJ, Xie J, LeBaron MJ, Zhu J, Nurmi M, Alanen K, Rui H, Nevalainen MT. Inhibition of transcription factor Stat5 induces cell death of human prostate cancer cells. J Biol Chem. 2003;278:27287–92. doi: 10.1074/jbc.M304307200. [DOI] [PubMed] [Google Scholar]
- 2.Ambs S, Prueitt RL, Yi M, Hudson RS, Howe TM, Petrocca F, Wallace TA, Liu CG, Volinia S, Calin GA, Yfantis HG, Stephens RM, Croce CM. Genomic profiling of microRNA and messenger RNA reveals deregulated microRNA expression in prostate cancer. Cancer Res. 2008;68:6162–70. doi: 10.1158/0008-5472.CAN-08-0144. [DOI] [PMC free article] [PubMed] [Google Scholar]
- 3.Butte AJ, Tamayo P, Slonim D, Golub TR, KIS Discovering functional relationships between RNA expression and chemotherapeutic susceptibility using relevance networks. Proc Natl Acad Sci USA. 2000;97:12182–86. doi: 10.1073/pnas.220392197. [DOI] [PMC free article] [PubMed] [Google Scholar]
- 4.Chuang H-Y, Lee E, Liu Y-T, Lee D, Ideker T. Network-based classification of breast cancer metastasis. Molecular Systems Biology. 2007;3 doi: 10.1038/msb4100180. [DOI] [PMC free article] [PubMed] [Google Scholar]
- 5.Dagvadorj A, Collins S, Jomain JB, Abdulghani J, Karras J, Zellweger T, Li H, Nurmi M, Alanen K, Mirtti T, Visakorpi T, Bubendorf L, Goffin V, Nevalainen MT. Autocrine prolactin promotes prostate cancer cell growth via Janus kinase-2-signal transducer and activator of transcription-5a/b signaling pathway. Endocrinology. 2007;148:3089–101. doi: 10.1210/en.2006-1761. [DOI] [PubMed] [Google Scholar]
- 6.Dagvadorj A, Kirken RA, Leiby B, Karras J, Nevalainen MT. Transcription factor signal transducer and activator of transcription 5 promotes growth of human prostate cancer cells in vivo. Clinical Cancer Research. 2008;14:1317–24. doi: 10.1158/1078-0432.CCR-07-2024. [DOI] [PubMed] [Google Scholar]
- 7.Dagvadorj A, Kirken RA, Leiby B, Karras J, Nevalainen MT. Transcription factor signal transducer and activator of transcription 5 promotes growth of human prostate cancer cells in vivo. Clin Cancer Res. 2008;14:1317–24. doi: 10.1158/1078-0432.CCR-07-2024. [DOI] [PubMed] [Google Scholar]
- 8.Dai M, Wang P, Boyd AD, Kostov G, Athey B, Jones EG, Bunney WE, Myers RM, Speed TP, Akil H, Watson SJ, Meng F. Evolving gene/transcript definitions significantly alter the interpretation of GeneChip data. Nucl Acids Res. 2005;33:e175. doi: 10.1093/nar/gni179. [DOI] [PMC free article] [PubMed] [Google Scholar]
- 9.Gouilleux F, Wakao H, Mundt M, Groner B. Prolactin induces phosphorylation of Tyr694 of Stat5 (MGF), a prerequisite for DNA binding and induction of transcription. Embo J. 1994;13:4361–9. doi: 10.1002/j.1460-2075.1994.tb06756.x. [DOI] [PMC free article] [PubMed] [Google Scholar]
- 10.Gu L, Dagvadorj A, Lutz J, Leiby B, Bonuccelli G, Lisanti MP, Addya S, Fortina P, Dasgupta A, Hyslop T, Bubendorf L, Nevalainen MT. Transcription factor Stat3 stimulates metastatic behavior of human prostate cancer cells in vivo, whereas Stat5b has a preferential role in the promotion of prostate cancer cell viability and tumor growth. Am J Pathol. 176:1959–72. doi: 10.2353/ajpath.2010.090653. [DOI] [PMC free article] [PubMed] [Google Scholar]
- 11.Gu L, Dagvadorj A, Lutz J, Leiby B, Bonucelli G, Lisanti MP, Addya S, Fortina P, Dasgupta A, Hyslop T, Rhimm J, Bubendorf L, Nevalainen MT. Transcription factor Stat3 stimulates metastatic behavior of human prostate cancer cells in vivo, while Stat5 has a preferential role in the promotion of prostate cancer cell viability and tumor growth. American Journal of Pathology. 2009;176:1959–72. doi: 10.2353/ajpath.2010.090653. [DOI] [PMC free article] [PubMed] [Google Scholar]
- 12.Holloway DT, Kon M, Delisi C. Machine learning for regulatory analysis and transcription factor target prediction in yeast. Syst Synth Biol. 2007;1:25–46. doi: 10.1007/s11693-006-9003-3. [DOI] [PMC free article] [PubMed] [Google Scholar]
- 13.Hu Z, Hung JH, Wang Y, Chang YC, Huang CL, Huyck M, DeLisi C. VisANT 3.5: multi-scale network visualization, analysis and inference based on the gene ontology. Nucl Acids Res. 2009;37:W115–W121. doi: 10.1093/nar/gkp406. [DOI] [PMC free article] [PubMed] [Google Scholar]
- 14.Ihle JN. The Stat family in cytokine signaling. Curr Opin Cell Biol. 2001;13:211–7. doi: 10.1016/s0955-0674(00)00199-x. [DOI] [PubMed] [Google Scholar]
- 15.Irizarry RA, Hobbs B, Collin F, Beazer-Barclay YD, Antonellis KJ, Scherf U, Speed TP. Exploration, normalization, and summaries of high density oligonucleotide array probe level data. Biostat. 2003;4:249–64. doi: 10.1093/biostatistics/4.2.249. [DOI] [PubMed] [Google Scholar]
- 16.Langfelder P, Horvath S. WGCNA: an R package for weighted correlation network analysis. BMC Bioinformatics. 2008;9 doi: 10.1186/1471-2105-9-559. [DOI] [PMC free article] [PubMed] [Google Scholar]
- 17.Li A, Horvath S. Network Neighborhood Analysis with the multi-node topological overlap measure. Bioinformatics. 2006;2 doi: 10.1093/bioinformatics/btl581. [DOI] [PubMed] [Google Scholar]
- 18.Li H, Ahonen TJ, Alanen K, Xie J, LeBaron MJ, Pretlow TG, Ealley EL, Zhang Y, Nurmi M, Singh B, Martikainen PM, Nevalainen MT. Activation of signal transducer and activator of transcription 5 in human prostate cancer is associated with high histological grade. Cancer Res. 2004;64:4774–82. doi: 10.1158/0008-5472.CAN-03-3499. [DOI] [PubMed] [Google Scholar]
- 19.Li H, Zhang Y, Glass A, Zellweger T, Gehan E, Bubendorf L, Gelmann EP, Nevalainen MT. Activation of signal transducer and activator of transcription-5 in prostate cancer predicts early recurrence. Clin Cancer Res. 2005;11:5863–8. doi: 10.1158/1078-0432.CCR-05-0562. [DOI] [PubMed] [Google Scholar]
- 20.Oldham M, Horvath S, Geschwind D. Conservation and evolution of gene coexpression networks in human and chimpanzee brains. Proc Natl Acad Sci USA. 2006:17973–78. doi: 10.1073/pnas.0605938103. [DOI] [PMC free article] [PubMed] [Google Scholar]
- 21.Pagel P, Kovac S, Oesterheld M, Brauner B, Dunger-Kaltenbach I, Frishman G, Montrone C, Mark P, Stümpflen V, Mewes H, Ruepp A, Frishman D. The MIPS mammalian protein-protein interaction database. Bioinformatics. 2005;21:832–834. doi: 10.1093/bioinformatics/bti115. [DOI] [PubMed] [Google Scholar]
- 22.Rui H, Djeu JY, Evans GA, Kelly PA, Farrar WL. Prolactin receptor triggering. Evidence for rapid tyrosine kinase activation. J Biol Chem. 1992;267:24076–81. [PubMed] [Google Scholar]
- 23.Rui H, Kirken RA, Farrar WL. Activation of receptor-associated tyrosine kinase JAK2 by prolactin. J Biol Chem. 1994;269:5364–8. [PubMed] [Google Scholar]
- 24.Sandberg R, Larsson O. Improved precision and accuracy for microarrays using updated probe set definitions. BMC Bioinformatics. 2007;8 doi: 10.1186/1471-2105-8-48. [DOI] [PMC free article] [PubMed] [Google Scholar]
- 25.Steuer R. On the analysis and interpretation of correlations in metabolomic data. Brief Bioinform. 2006;151:151–158. doi: 10.1093/bib/bbl009. [DOI] [PubMed] [Google Scholar]
- 26.Talloen W, Clevert D-A, Hochreiter S, Amaratunga D, Bijnens L, Kass S, GHWH I/NI-calls for the exclusion of non-informative genes: a highly effective filtering tool for microarray data. Bioinformatics. 2007;23:2897–2902. doi: 10.1093/bioinformatics/btm478. [DOI] [PubMed] [Google Scholar]
- 27.Tan SH, Dagvadorj A, Shen F, Gu L, Liao Z, Abdulghani J, Zhang Y, Gelmann EP, Zellweger T, Culig Z, Visakorpi T, Bubendorf L, Kirken RA, Karras J, NMT Transcription factor Stat5 synergizes with androgen receptor in prostate cancer cells. Cancer Res. 2008;68:236–48. doi: 10.1158/0008-5472.CAN-07-2972. [DOI] [PubMed] [Google Scholar]
- 28.Tan SH, Dagvadorj A, Shen F, Gu L, Liao Z, Abdulghani J, Zhang Y, Gelmann EP, Zellweger T, Culig Z, Visakorpi T, Bubendorf L, Kirken RA, Karras J, Nevalainen MT. Transcription factor Stat5 synergizes with androgen receptor in prostate cancer cells. Cancer Res. 2008;68:236–48. doi: 10.1158/0008-5472.CAN-07-2972. [DOI] [PubMed] [Google Scholar]
- 29.Tan SH, Nevalainen MT. Signal transducer and activator of transcription 5A/B in prostate and breast cancers. Endocrine Related Cancer. 2008;15:367–90. doi: 10.1677/ERC-08-0013. [DOI] [PMC free article] [PubMed] [Google Scholar]
- 30.Tan SH, Nevalainen MT. Signal transducer and activator of transcription 5A/B in prostate and breast cancers. Endocr Relat Cancer. 2008;15:367–90. doi: 10.1677/ERC-08-0013. [DOI] [PMC free article] [PubMed] [Google Scholar]
- 31.Taylor IW, Linding R, Warde-Farley D, Liu Y, Pesquita C, Faria D, Bull S, Pawson T, Morris Q, Wrana JL. Dynamic modularity in protein interaction networks predicts breast cancer outcome. Nat Biotechnol. 2009;27:199–204. doi: 10.1038/nbt.1522. [DOI] [PubMed] [Google Scholar]
- 32.Wallace TA, Prueitt RL, Yi M, Howe TM, Gillespie JW, Yfantis HG, Stephens RM, Caporaso NE, Loffredo CA, Ambs S. Tumor immunobiological differences in prostate cancer between African-American and European-American men. Cancer Res. 2008;68:927–36. doi: 10.1158/0008-5472.CAN-07-2608. [DOI] [PubMed] [Google Scholar]
- 33.Wilson D, Charoensawan V, Kummerfeld S, Teichmann S. DBD--taxonomically broad transcription factor predictions: new content and functionality. Nucl Acids Res. 2008;36:D88–D92. doi: 10.1093/nar/gkm964. [DOI] [PMC free article] [PubMed] [Google Scholar]
- 34.Yeung MK, Tegnér J, Collins JJ. Reverse engineering gene networks using singular value decomposition and robust regression. Proc Natl Acad Sci U S A. 2002;99:6163–8. doi: 10.1073/pnas.092576199. [DOI] [PMC free article] [PubMed] [Google Scholar]
Associated Data
This section collects any data citations, data availability statements, or supplementary materials included in this article.