Summary
Pre‐eclampsia is associated with increased levels of cholesterol and uric acid and an inflamed placenta expressing danger‐sensing pattern recognition receptors (PRRs). Crystalline cholesterol and uric acid activate the PRR Nod‐like receptor protein (NLRP)3 inflammasome to release interleukin (IL)‐1β and result in vigorous inflammation. We aimed to characterize crystal‐induced NLRP3 activation in placental inflammation and examine its role in pre‐eclampsia. We confirmed that serum total cholesterol and uric acid were elevated in pre‐eclamptic compared to healthy pregnancies and correlated positively to high sensitivity C‐reactive protein (hsCRP) and the pre‐eclampsia marker soluble fms‐like tyrosine kinase‐1 (sFlt‐1). The NLRP3 inflammasome pathway components (NLRP3, caspase‐1, IL‐1β) and priming factors [complement component 5a (C5a) and terminal complement complex (TCC)] were co‐expressed by the syncytiotrophoblast layer which covers the placental surface and interacts with maternal blood. The expression of IL‐1β and TCC was increased significantly and C5a‐positive regions in the syncytiotrophoblast layer appeared more frequent in pre‐eclamptic compared to normal pregnancies. In‐vitro activation of placental explants and trophoblasts confirmed NLRP3 inflammasome pathway functionality by complement‐primed crystal‐induced release of IL‐1β. This study confirms crystal‐induced NLRP3 inflammasome activation located at the syncytiotrophoblast layer as a mechanism of placental inflammation and suggests contribution of enhanced NLRP3 activation to the harmful placental inflammation in pre‐eclampsia.
Keywords: cholesterol, inflammation, NLRP3, placenta, pre‐eclampsia
Introduction
Increased inflammation, marked by changes in cytokines and C‐reactive protein (CRP), is part of the physiological adaptation of a normal pregnancy 1, 2. Disturbance of this inflammatory state characterizes the development of pregnancy complications such as pre‐eclampsia and fetal growth restriction (FGR), which are major causes of maternal and fetal morbidity and mortality 2, 3, 4. Pre‐eclampsia affects 2–8% of pregnancies and is associated with 12% of infants with FGR and approximately 20% of preterm deliveries 5. Pre‐eclampsia often starts with local placental dysfunction and develops into a maternal disease identified by maternal hypertension and proteinuria. Insufficient placental development creates a stressed and inflamed organ not able to meet the increasing demands of the growing fetus. The cellular interplay and underlying inflammatory mechanisms in the placenta are only partially understood. The main predictive marker for pre‐eclampsia, soluble fms‐like tyrosine kinase‐1 (sFlt‐1), is derived mainly from placental trophoblasts, and points to a central role for these specialized fetal cells in the pre‐eclampsia pathogenesis 6, 7. This role is particularly important for the cytotrophoblasts, which fuse to form a multi‐nucleated cell layer called the syncytium that covers the fetal structures in the placenta and interacts directly with maternal blood. This is the main maternal–fetal interaction site. Trophoblasts are immune‐competent cells 8 and identification of their inflammatory properties is required to understand the placental inflammation underlying the development of pre‐eclampsia.
An inflammatory response can be initiated when danger signals from pathogens or damaged tissue are recognized by pattern recognition receptors (PRRs), and a cell's potential for inflammatory involvement is defined by its PRR repertoire. Endogenous danger signals initiate and maintain inflammatory responses through activation of PRRs such as nucleotide‐binding domain leucine‐rich repeat containing (NLR) proteins 9. Members of the NLR protein family form intracellular multi‐protein structures called inflammasomes 10, which are involved in inflammatory diseases such as atherosclerosis, gout and diabetes mellitus 11. Activation of the Nod‐like receptor protein (NLRP)3 inflammasome by a wide variety of danger signals, including crystalline forms of cholesterol and uric acid 11, 12, 13, leads to activation of caspase‐1 and cleavage of pro‐interleukin (IL)‐1β to its biologically active form 10. Mature IL‐1β has potent proinflammatory characteristics, and plays an important role in atherosclerosis development through NLRP3 activation 13, 14. Complement factors, cytokines or other danger signals are needed to induce a priming signal to render cells responsive to NLRP3 activation 15. The complement system is involved in the pathology of several inflammatory diseases 16, 17, and activation involves generation of the potent anaphylatoxin complement component 5a (C5a) and the terminal complement complex (TCC). Combined C5a and tumour necrosis factor (TNF)‐α exposure is a known priming signal for cholesterol and uric acid crystal‐induced NLRP3 activation 18, 19.
Detailed characterization of placental expression and activation of PRRs is needed to reveal the underlying mechanisms and cellular contributions to placental inflammation in pre‐eclampsia 20. PRR activation in pre‐eclampsia may be induced by factors derived from maternal serum and/or within the stressed placental tissue. It has been reported that maternal serum levels of cholesterol and uric acid are elevated in pre‐eclampsia and FGR 21, 22, 23, 24, 25, 26, 27, 28, that cholesterol is accumulated in pre‐eclamptic placentas 29 and that uric acid crystals activate the NLRP3 inflammasome in human placentas 30. Trophoblast NLRP3 activation has been assigned a role in pre‐eclampsia development 31, 32, 33, 34. Raised serum and placental levels of IL‐1β and excessive complement activation in women with pre‐eclampsia 3, 28, 31, 35, 36, 37, 38, 39 further indicates a role for placental NLRP3 inflammasome involvement in this disease, but a detailed mechanistic outline with defined cellular involvement is missing. We hypothesize that complement‐primed crystal‐mediated activation of the NLRP3 inflammasome in trophoblasts leads to exaggerated IL‐1β production and contributes to placental inflammation in pre‐eclampsia.
Materials and methods
Study population
This study used placental and maternal serum samples from two collections approved by the Norwegian Regional Committee for Medical and Health Research Ethics; approval number 2012/1040 and 2009/03. All participants signed informed consent.
Third‐trimester placental biopsies from healthy (n = 13) and pre‐eclamptic singleton pregnancies with (n = 12) or without (n = 11) FGR, and maternal serum samples from healthy (n = 43) and pre‐eclamptic (n = 34) pregnancies, were analysed. Serum samples from non‐pregnant women in the follicular phase of the menstrual cycle (n = 28) were also included. Pregnant women were diagnosed with pre‐eclampsia when developing persistent hypertension (blood pressure ≥ 140/90 mmHg) plus proteinuria (≥ 0·3 g/24 h or reproducible ≥ 1+ by dipstick) after 20 weeks of gestation 40. FGR was established by serial ultrasound measurements or diagnosed if neonates had birth weight < 5th percentile, according to Norwegian reference curves 41. Healthy normotensive pregnant women with no previous pre‐eclampsia or FGR were included as controls. Maternal venous blood was collected prior to delivery and placentas obtained directly after delivery by caesarean section without labour. Serum aliquots were stored at −80°C, and placental biopsies were cut tangentially from the central part of the maternal side before fixation in 10% neutral‐buffered formalin and paraffin embedding.
First‐trimester placental tissue was collected from surgical elective abortions at gestational age 7–12 weeks. Placental samples (n = 10) were snap‐frozen and stored at −80°C until fixation and paraffin‐embedding. A group of third‐trimester placentas (n = 10) were collected from healthy women delivering by caesarean section for immediate isolation of chorionic villous explants.
Serum measurements
Total cholesterol and uric acid were measured in maternal serum. Esterified cholesterol was modified enzymatically by cholesterol esterase and cholesterol oxidase. The resulting hydrogen peroxide reacted with 4‐aminoantipyrine and phenol in presence of peroxidase and the coloured product was measured at 505 nm. Uric acid was oxidized by uricase, and the resulting hydrogen peroxide reacted with N‐ethyl‐N‐(2‐hydroxy‐3‐sulphopropyl)‐3‐methylalanine and 4‐aminopyrine in the presence of peroxidase, and the coloured product was measured at 545 nm. High‐sensitivity (hs) CRP was measured by turbidimetric assay and measured at 571 nm. All analyses were performed according to clinically validated standards on a Roche Modular P analytical system at the Department of Clinical Chemistry at St Olav's Hospital, Trondheim, Norway. sFlt‐1 was measured by enzyme‐linked immunosorbent assay (ELISA) (no. DVR100B; R&D Systems, Minneapolis, MA, USA).
Immunohistochemical staining and quantification
Tissue sections (3 μm) were pretreated in PT link (no. PT101; Dako, Glostrup, Denmark) using target retrieval solution (no. K8005 or K8004; Dako) at 97°C for 20 min and peroxidase blocking solution for 5 min (no. K4007; Dako). Slides were incubated overnight at 4°C [IL‐1β (1 : 200, no. NB600–633; Novus Biologicals, Littleton, CO, USA), complement component 5a (C5a) (1 : 10, no. HM2079; Hycult Biotech, Plymouth Meeting, PA, USA) and terminal complement complex (TCC) (1 : 30, no. DIA011‐01‐02; Thermo Fisher, Waltham, MA, USA)]; or for 40 min at room temperature [NLRP3 (1 : 2000, no. 19771‐1‐AP; Proteintech, Chicago, IL, USA), caspase‐1 (1 : 1200, no. Ab108362; Abcam, Cambridge, MA, USA), cytokeratin 7 (CK7) (1 : 800, no. M7018; Dako), CD31 (1 : 50, no. M0823; Dako) or CD45 (1 : 300, no. M0701; Dako)]. All slides were incubated for 30 min with horseradish peroxidase (HRP)‐labelled polymer (no. K4007; Dako). Diaminobenzidine (DAB+) (1 : 50, no. K4007; Dako) was used as chromogen with two 5‐min incubations and slides counterstained with haematoxylin. Rabbit linker (no. K8009; Dako) was used for NLRP3 staining and mouse linker (no. K8021; Dako) for cell markers.
Immunohistochemistry was performed in an Autostainer Plus (no. S3800; Dako). Negative isotype control staining was performed for all antibodies using normal rabbit serum (no. 011‐000‐120; Jackson ImmunoResearch, West Grove, PA, USA), rabbit monoclonal immunoglobulin (Ig)G (no. 3900; Cell Signaling Technology, Danvers, MA, USA), mouse monoclonal IgG1 (no. 349040; BD Biosciences, Franklin Lakes, MA, USA) and mouse monoclonal IgG2a κ (no. 553454; BD Pharmingen) (Supporting information, Fig. S1). Bright‐field images were obtained with an Eclipse E400 microscope and DS‐Fi1 camera (Nikon, Melville, NY, USA) or the EVOS™ FL Auto Imaging System (Invitrogen, Carlsbad, CA, USA), with defined microscope settings. For quantitative image analysis, the staining intensity of the syncytiotrophoblast cytoplasm was assessed automatically using the NIS‐Elements BR 4.0 software (Nikon). The syncytiotrophoblast cytoplasm was delineated in a binary layer by manual adjustment. This binary layer defined the area included in automatic assessment of intensity values (the statistical mean of intensity pixel values). Protein expression was quantified blinded to pregnancy outcomes. IL‐1β and NLRP3 expression was quantified in three images per placenta from 13 healthy and 23 pre‐eclamptic pregnancies, while TCC quantification was performed in two images from four healthy and four pre‐eclamptic placentas.
Placental explants and trophoblasts
A cotyledon was dissected from the central region of fresh third‐trimester placentas, fetal membranes and decidua basalis were removed, and chorionic villous tissue washed in sterile phosphate‐buffered saline (PBS) and cut into pieces (24·0 ± 1·3 mg). Explants were cultured in Ham's F12/Dulbecco's modified Eagle's medium (DMEM) with 10% fetal bovine serum (FBS) and 100 mg/ml penicillin–streptomycin (Sigma‐Aldrich, St Louis, MO, USA) and incubated overnight at 37°C, 8% O2 and 5% CO2 42. The trophoblast cell line SGHPL‐5, generously provided by Professor Whitley (London, UK) 43, was cultured in Ham's F12 medium with 10% FBS, 2 mM L‐glutamine and 100 mg/ml penicillin–streptomycin. SGHPL‐5 cells (passage 19–20) were seeded at 1 × 10⁴ cells/well and incubated overnight at 37°C, 20% O2 and 5% CO2. Culture medium was then replaced by fresh culture medium with or without priming; either 500 pg/ml lipopolysaccharide (LPS) (no. tlrl‐3pelps; InvivoGen, San Diego, CA, USA) or a combination of 1 µg/ml C5a (no. hc2101; Hycult Biotech) and 10 ng/ml tumour necrosis factor (TNF)‐α (no. ct3011; Gibco, Carlsbad, CA, USA) 19. After 2 h, the medium was replaced by fresh culture medium with or without stimuli; 200 or 2000 µg/ml cholesterol crystals (no. C3045; Sigma‐Aldrich), 100 or 200 µg/ml uric acid crystals (no. tlrl‐msu; InvivoGen) or the positive control 3 mM adenosine triphosphate (ATP) (no. A7699; Sigma Aldrich). 100 nM of the NLRP3 inflammasome inhibitor MCC950 (no. PZ0280; Sigma 44) was added 30 min prior to the stimuli. Supernatants were collected after 24 h, centrifuged and stored at −80°C. Viability was assessed by the lactate dehydrogenase cytotoxicity assay (no. 04744926001; Roche, Basel, Switzerland).
IL‐1β levels in supernatant from third‐trimester placental explants and SGHPL‐5 cells were measured undiluted in duplicate using ELISA (no. 557953; BD Biosciences). For explants, six technical replicates for each experimental condition were fused before analysis.
Statistical analyses
Statistical analyses were performed in GraphPad Prism version 6.0 or SPSS version 21, with P < 0.05 considered statistically significant. Protein measurements in serum and supernatant were analysed by Kruskal–Wallis test with Dunn's multiple comparison post‐hoc test, and quantified immunohistochemistry data by one‐way analysis of variance (ANOVA) with Tukey's multiple comparison test or two‐tailed Mann–Whitney U‐test. Correlation between variables was calculated using the Spearman's rank test.
Results
Clinical characteristics of study subjects
The clinical characteristics of the 36 subjects included in protein expression analyses of third‐trimester placentas are shown in Supporting information, Table S1. Among the pre‐eclamptic pregnancies, 52% were additionally complicated by FGR and 70% experienced severe pre‐eclampsia. In line with prior studies on the pre‐eclampsia syndrome, the percentage of primiparae was higher and gestational age at delivery was lower in pre‐eclamptic compared to healthy pregnant women (Supporting information, Table S1).
The clinical characteristics of the 105 subjects included for serum analyses are shown in Supporting information, Table S2. Among the pre‐eclamptic pregnancies, 59% were additionally complicated by FGR and 79% had severe pre‐eclampsia. The percentage of primiparae was higher and gestational age at delivery was lower in pre‐eclamptic compared to healthy pregnant women (Supporting information, Table S2).
The average gestational age of the 10 first‐trimester placentas was 10 (range = 7–12) weeks, and for the 10 healthy third‐trimester placentas included for isolation of explants it was 39 (range = 38–40) weeks.
Maternal serum cholesterol and uric acid
Prior to delivery by caesarean section, maternal serum levels of total cholesterol were increased significantly in pre‐eclamptic [7·1 mM (4·1–12·4), P < 0·001] and healthy pregnancies [6·5 mM (4·8–8·9), P < 0·001] compared to non‐pregnant women [4·7 mM (3·8–7·0)] (Fig. 1a). Although the mean concentration was higher in pre‐eclamptic than healthy pregnancies, the difference was not significant (P = 0·0761) (Fig. 1a).
Figure 1.
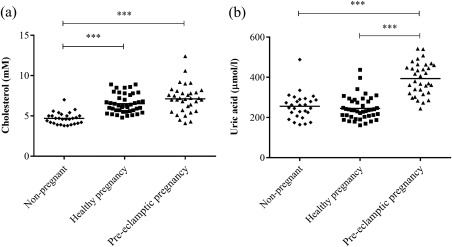
Maternal serum levels of total cholesterol and uric acid. Circulating levels of (a) total cholesterol and (b) uric acid were measured in serum from non‐pregnant (n = 28), healthy (n = 43) and pre‐eclamptic (n = 34) pregnant women. Data were analysed using the Kruskal–Wallis test with Dunn's multiple comparison post‐hoc test. ***P < 0·0001.
Pre‐eclamptic women had significantly higher uric acid levels [393·7 µmol/l (244·0–542·0)] compared to both healthy pregnant [245·2 µmol/l (161·0–437·0), P < 0·001] and non‐pregnant women [255·5 µmol/l (164·0–488·0), P < 0·001] (Fig. 1b).
Both maternal serum levels of total cholesterol and uric acid correlated positively with maternal serum levels of sFlt‐1 (P < 0·0001, Spearman's r = 0·58; P < 0·0001, Spearman's r = 0·59) and hsCRP (P = 0·004, Spearman's r = 0·28; P < 0·0001, Spearman's r = 0·37). For serum concentrations of sFlt‐1 and hsCRP, see Supporting information, Table S2.
Placental expression of inflammasome pathway components and complement factors
Immunohistochemical staining of placental sections with CK7 identified the syncytiotrophoblast layer (the syncytium) and cytotrophoblasts (Fig. 2b). Within the placental villi, endothelial cells (Fig. 2c) and leucocytes (Fig. 2d) were identified.
Figure 2.
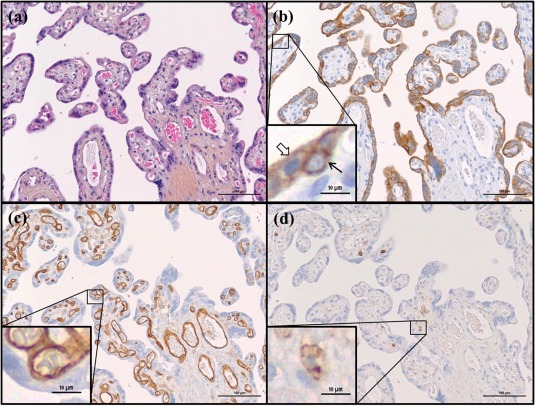
Haematoxylin erythrosine saffron (HES) staining and cell type markers in third trimester placenta. Representative images of healthy placental tissue at gestational age 38 weeks are shown stained by (a) HES and immunohistochemical staining of (b) the trophoblast marker cytokeratin 7 (CK7), (c) the endothelium marker CD31 and (d) the leucocyte marker CD45. Black arrow indicates cytotrophoblast, transparent arrow indicates syncytiotrophoblast.
In third‐trimester placentas NLRP3, caspase‐1 and IL‐1β were expressed in the syncytiotrophoblast layer, cytotrophoblasts, fetal endothelium and stromal leucocytes (Fig. 3), with similar staining patterns in healthy and pre‐eclamptic placentas. A more distinct staining of NLRP3 was observed towards the apical side of the syncytiotrophoblast layer (Fig. 3a,b).
Figure 3.
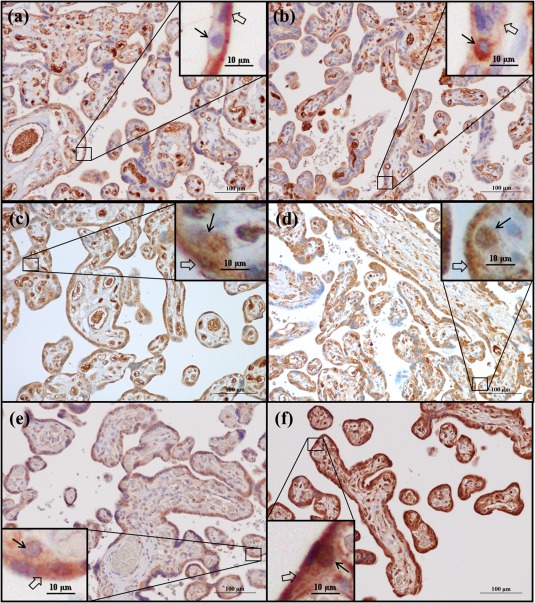
Nod‐like receptor protein 3 (NLRP3), caspase‐1 and interleukin (IL)‐1β protein expression in third‐trimester placenta. Immunohistochemical staining of (a,b) Nod‐like receptor protein 3 (NLRP3), (c,d) caspase‐1 and (e,f) interleukin (IL)‐1β. Representative images of healthy placentas at gestational age (a,c) 40 + 0 and (e) 39 + 0 weeks, and pre‐eclamptic placentas at gestational age (b,d) 33 + 6 and (f) 33 + 5 weeks are shown. Black arrows indicate cytotrophoblasts, transparent arrows indicate syncytiotrophoblast.
Complement factors TCC and C5a were observed in the syncytiotrophoblast layer and leucocytes of both healthy and pre‐eclamptic placentas (Fig. 4). The C5a staining was apparent in distinct syncytium regions and appeared stronger in placentas from pre‐eclamptic pregnancies (Fig. 4c,d).
Figure 4.
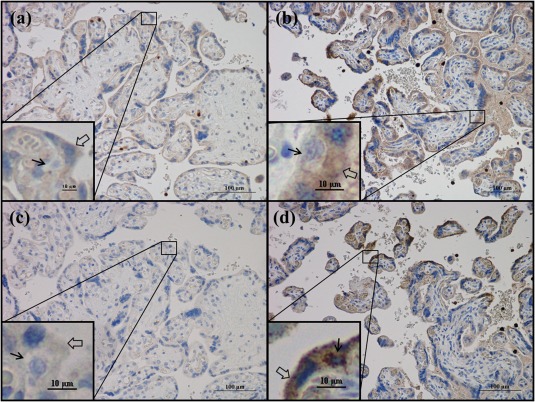
Terminal complement complex (TCC) and complement component 5a (C5a) protein expression in third‐trimester placenta. Immunohistochemical staining of (a,b) TCC and (c,d) C5a. Representative images of (a,c) a healthy placenta at gestational age 40 + 0 and (b,d) a pre‐eclamptic placenta at gestational age 29 + 6 weeks are shown. Black arrows indicate cytotrophoblasts, transparent arrows indicate syncytiotrophoblast.
In first‐trimester placentas, NLRP3 and IL‐1β were expressed predominantly in the syncytiotrophoblast layer and cytotrophoblasts, but also in stromal cells of various sizes (Supporting information, Fig. S2).
Quantified NLRP3, IL‐1β and TCC expression levels in normal and pre‐eclamptic placentas
No differences were detected in NLRP3 expression levels in the syncytiotrophoblast layer (Fig. 5a) or cytotrophoblasts (data not shown) when comparing healthy pregnancies with pregnancies complicated with pre‐eclampsia alone or combined with FGR.
Figure 5.
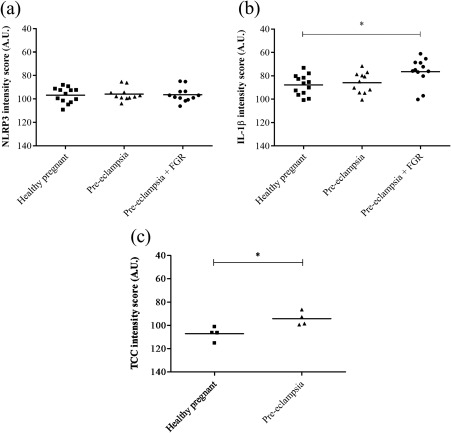
Protein expression levels of Nod‐like receptor protein 3 (NLRP3), interleukin (IL)‐1β and terminal complement complex (TCC) in third‐trimester placenta. (a,b) For NLRP3 and IL‐1β the syncytiotrophoblast cytoplasmic staining was quantified in healthy (n = 13) and pre‐eclamptic placentas without (n = 11) and with (n = 12) fetal growth restriction (FGR), and data were analysed using one‐way analysis of variance (anova) with Tukey's multiple comparison post‐hoc test. (c) TCC expression level was quantified in the syncytiotrophoblast cytoplasm of healthy (n = 4) and pre‐eclamptic placentas (n = 4), and data were analysed using the two‐tailed Mann–Whitney test. *P < 0·05. AU = arbitrary units.
Quantification of IL‐1β staining revealed that the syncytium IL‐1β expression was significantly higher in pregnancies complicated with pre‐eclampsia and FGR compared to healthy pregnancies [76 arbitrary units (AU) ± 3 versus 88 AU ± 2, P = 0·0174] (Fig. 5b). Statistical significance was not reached when comparing pre‐eclamptic pregnancies without FGR to healthy pregnancies (86 AU ± 3 versus 88 AU ± 2, P = 0·52) (Fig. 5b), or when comparing severe to non‐severe pre‐eclamptic pregnancies (not shown).
The scattered C5a expression pattern was not quantified, but the syncytium TCC staining was significantly higher in pre‐eclamptic compared to healthy pregnancies (94 AU ± 3 versus 107 AU ± 3, P = 0.0286) (Fig. 5c).
Cholesterol crystal‐mediated IL‐1β response in placental explants
Incubation with cholesterol crystals (Fig. 6) and uric acid crystals (data not shown) significantly increased the release of IL‐1β from LPS‐primed cultured chorionic villi explants. Inhibition of the NLRP3 inflammasome by MCC950 reduced the cholesterol crystal‐induced IL‐1β response in placental tissue more than twofold, demonstrating NLRP3 inflammasome dependence (Fig. 6).
Figure 6.
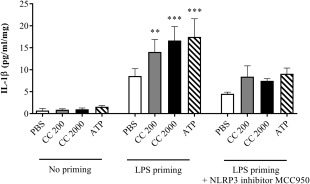
Interleukin (IL)‐1β response following cholesterol crystal stimulation of lipopolysaccharide (LPS)‐primed placental explants, and the effect of Nod‐like receptor protein 3 (NLRP3) inhibition. Third‐trimester chorionic villous explants from six healthy pregnancies were first incubated with or without LPS, before adding cholesterol crystals (CC, 200 or 2000 µg/ml) or adenosine triphosphate (ATP). Three biological replicates were also treated with the NLRP3 inflammasome inhibitor MCC950. Six technical replicates were included for each experimental condition. Release of IL‐1β was measured by enzyme‐linked immunosorbent assay (ELISA), and is presented as mean ± standard error of the mean (s.e.m.) relative to explant weight. Data were analysed using the Kruskal–Wallis test with Dunn's multiple comparison post‐hoc test. *P < 0·05; **P < 0·01; ***P < 0·001. Lactate dehydrogenase viability analysis showed no toxic effect on the placental cells (Supporting information, Fig. S3a). PBS = phosphate‐buffered saline.
C5a and TNF‐α priming of cholesterol crystal‐mediated NLRP3 activation in placental explants and trophoblasts
When priming cultured chorionic villi explants with C5a and TNF‐α, the cells responded to cholesterol crystals and ATP by significantly increased IL‐1β production (Fig. 7).
Figure 7.
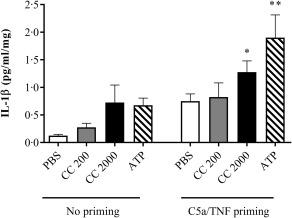
Interleukin (IL)‐1β response following C5a/tumour necrosis factor (TNF)‐α primed cholesterol crystal stimulation of placental explants. Third‐trimester chorionic villous explants from four healthy pregnancies were incubated with or without complement component 5a (C5a) and TNF‐α before stimulation with cholesterol crystals (CC, 200 or 2000 µg/ml) or adenosine triphosphate (ATP). Six technical replicates were included for each experimental condition. The level of IL‐1β was measured in supernatant using enzyme‐linked immunosorbent assay (ELISA) and presented as mean ± standard error of the mean (s.e.m.) relative to explant weight. Data were analysed using the Kruskal–Wallis test with Dunn's multiple comparison post‐hoc test. *P < 0·05; **P < 0·01. Lactate dehydrogenase viability analysis showed no toxic effect on the placental cells (Supporting information, Fig. S3b). PBS = phosphate‐buffered saline.
When priming SGHPL‐5 trophoblasts with C5a and TNF‐α, the cells responded to cholesterol crystals by releasing significantly higher levels of IL‐1β (Fig. 8). The IL‐1β response in trophoblasts was confirmed to be NLRP3‐dependent by a threefold reduction in IL‐1β production when inhibiting NLRP3 activity (Fig. 8).
Figure 8.
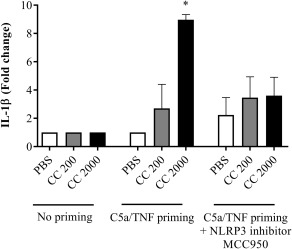
Interleukin (IL)‐1β response following complement component 5a (C5a)/tumour necrosis factor (TNF)‐primed cholesterol crystal stimulation of trophoblasts. The trophoblast cell line SGHPL‐5 was incubated with or without C5a and TNF‐α before stimulation with cholesterol crystals (CC, 200 or 2000 µg/ml). Treatment with the Nod‐like receptor protein 3 (NLRP3) inflammasome inhibitor MCC950 was included. IL‐1β release was measured by enzyme‐linked immunosorbent assay (ELISA) and presented as fold change of triplicates from three independent experiments. Data were analysed using the Kruskal–Wallis test with Dunn's multiple comparison post‐hoc test. *P < 0·05. Lactate dehydrogenase viability analysis showed no toxic effect on the cells (Supporting information, Fig. S4). PBS = phosphate‐buffered saline.
Lactate dehydrogenase viability analyses confirmed that the stimuli had no toxic effect on placental explants or trophoblast cells (Supporting information, Figs S3 and S4).
Discussion
In this study, we have identified that components of the NLRP3 inflammasome and the complement system are co‐localized with IL‐1β in the syncytiotrophoblast layer. We demonstrate elevated syncytium expression of IL‐1β and TCC and raised maternal serum cholesterol and uric acid in pre‐eclampsia. When primed with C5a/TNF‐α or LPS, placental explants and trophoblasts became responsive to cholesterol crystal‐mediated activation of the NLRP3 inflammasome, resulting in release of mature IL‐1β. Together, these data suggest that crystal‐mediated NLRP3 inflammasome activation leads to IL‐1β production in the syncytium and that this potent inflammatory mechanism plays a role in the harmful placental inflammation underlying pre‐eclampsia.
The cell‐specific co‐localization of components essential for NLRP3 activity strongly supports a link between complement priming, NLRP3 inflammasome activation and IL‐1β production in the syncytiotrophoblast. Our findings are sustained in a recent report showing NLRP3, caspase‐1 and IL‐1β protein expression in the syncytiotrophoblast layer 32 and by NLRP3 expression in placental lysates and primary trophoblasts 31, 33, 34, 45, 46. Syncytium IL‐1β production in first‐ and third‐trimester placentas is in accordance with previous findings 47, 48, 49. NLRP3 expression in the syncytiotrophoblast layer in the first trimester of pregnancy has not been described previously, and also suggests a role for the NLRP3 inflammasome in the initial phase of placental development. Studies of the NLRP3 inflammasome pathway in pre‐eclampsia are limited. Recently, Weel et al. 32 showed elevated NLRP3 and caspase‐1 in placental tissue from pre‐eclamptic pregnancies; however, our study is the first to quantify cell‐specific NLRP3 protein expression in the syncytiotrophoblast layer. Our identification of elevated placental IL‐1β expression in pre‐eclampsia is in accordance with previous findings 31, 32, 50. Maternal serum IL‐1β in pre‐eclampsia has been suggested to originate from an inflamed placenta 50, 51, 52, and our findings point to NLRP3 activation at the syncytium as a probable source. To our knowledge, this is an original discovery and suggests a prominent role for inflammation located at the syncytiotrophoblast layer in the pre‐eclampsia pathogenesis.
Our in‐vitro studies in placental explants and trophoblasts confirmed functional activity of the NLRP3 inflammasome pathway. This is the first study demonstrating cholesterol crystal‐mediated NLRP3 activation in trophoblasts, as inflammasome responses have only been shown previously for uric acid, ATP and nigericin in these cells 30, 31, 34, 45, 53. NLRP3 inflammasome activation requires an already exaggerated inflammatory setting, as a priming signal is needed to achieve sufficient intracellular levels of NLRP3 and pro‐IL‐1β 15, 54. The choice of priming signal in the placenta was based on reports of elevated C5a and TNF‐α in pre‐eclampsia 28, 32, 35, 36, 37, 38, 55, 56, 57, and supported by our discovery of C5a and TCC in the syncytium of pre‐eclamptic placentas. The functional response confirms that C5a and TNF‐α may serve as endogenous priming factors potentiating placental NLRP3 inflammasome activation. The low‐grade inflammation in normal pregnancy may be sufficient for priming trophoblasts for NLRP3 activation, leaving pregnancy particularly vulnerable for activation of this potent inflammatory mechanism.
NLRP3 activation in macrophages induces a potent inflammation culminating in cell death by pyroptosis 54. Loss of surface integrity at the syncytium is part of the pathophysiological processes in pre‐eclampsia development, with distorted microvilli and shedding of cell components to the maternal circulation evoking harmful maternal responses 58. NLRP3 inflammasome activation may be responsible for parts of the destructive process observed at the syncytium in pre‐eclampsia. Interestingly, the marked NLRP3 expression on the syncytium surface facing maternal blood may imply a contingent interaction between the inflamed syncytium and maternal blood. This localization of the inflammasome emphasizes that danger signals present in maternal blood, such as cholesterol and uric acid, have a strong likelihood to disrupt the homeostasis at this crucial fetal–maternal interaction site by activating NLRP3. Similar to earlier studies 22, 26, maternal serum levels of total cholesterol and uric acid were shown elevated in pre‐eclamptic women, and correlated with hsCRP and sFlt‐1. Although cholesterol has been shown to accumulate in the placenta and decidua in pre‐eclampsia and trophoblasts are involved in cholesterol uptake 29, 59, crystallization of cholesterol in the placenta has not yet been confirmed, and needs to be investigated further. Taken together, these findings suggest that components at the syncytium surface and in maternal blood directly influence each other and may induce escalated inflammatory responses if disturbed or dysregulated. Consequently, placental dysfunction and maternal response in pre‐eclampsia must be addressed as an interdependent interactive process.
Underlying placental pathology is partly shared in pre‐eclampsia with restricted fetal growth, pre‐eclampsia with normal fetal growth and normotensive FGR 57, 60, 61. The maternal systemic inflammatory state and immune cell activation, however, is known to be more vigorous in isolated pre‐eclampsia compared to normotensive FGR 57, 62, 63. The data presented here suggest that further elucidation of placental NLRP3 activation in subgroups of pre‐eclampsia and FGR will provide valuable knowledge about shared and distinct placental pathophysiological processes in these disorders.
To summarize, syncytial expression of the NLRP3 inflammasome pathway components and the in‐vitro support of pathway functionality shown here strongly support an important role for the NLRP3 inflammasome in placental inflammation and in the pathogenesis of pre‐eclampsia. Initial activation by complement factors is likely to facilitate NLRP3 inflammasome responsiveness to crystalline cholesterol and uric acid and induce IL‐1β processing at the inflamed syncytium in pre‐eclampsia. This suggests a novel inflammatory role for cholesterol at the maternal‐fetal interface.
Author contributions
U. E. D., C. S., L. C. V. T. and L. B. collected the clinical material and information. G. S. S. and A. C. I. conceived and designed the experiments. G. S. S., G. B. S., L. H. T., L. M. G., I. N. and M. H. A. performed the experiments and analysed the data, and along with A. C. I. interpreted the data. G. S. S., G. B. S., L. B. and A. C. I. drafted the paper. All authors critically revised the article and approved the final version.
Disclosure
The authors have no financial or commercial conflicts of interest.
Supporting information
Additional Supporting information may be found in the online version of this article at the publisher's web‐site:
Fig. S1. Isotype controls for immunohistochemical staining protocols. Third‐trimester placentas were stained with isotype controls matching the specific antibodies used for (a) interleukin (IL)‐1β, (b) Nod‐like receptor protein (NLRP)3, (c) caspase‐1, (d) complement component 5a (C5a) and (e) terminal complement complex (TCC).
Fig. S2. Immunohistochemical staining of (a) Nod‐like receptor protein (NLRP)3 and (b) interleukin (IL)‐1β in first‐trimester placental tissue (n = 10).
Fig. S3. Lactate dehydrogenase (LDH) release from placental explants [n = 6 in (a), n = 4 in (b)]. Kruskal–Wallis test with Dunn's multiple comparison post‐hoc test. Mean with standard error of the mean (s.e.m.).
Fig. S4. Lactate dehydrogenase (LDH) release from trophoblast cells (n = 3). Kruskal–Wallis test with Dunn's multiple comparison post‐hoc test. Mean with standard error of the mean (s.e.m.).
Table S1. Clinical characteristics for subjects included in third‐trimester placental analyses (n = 36).
Table S2. Clinical characteristics and markers for subjects included in serum analyses (n = 105).
Acknowledgements
Funding was provided by the Research Council of Norway (grant numbers 205400/V50 and 223255/F50) and the Liaison Committee between the Norwegian University of Science and Technology and the Central Norway Regional Health Authority. Immunohistochemical staining was performed at the Cellular and Molecular Imaging Core Facility (CMIC), NTNU. CMIC is funded by the Faculty of Medicine and Health Science at NTNU and the Central Norway Regional Health Authority. We are grateful to all the women who donated their placenta for research and to Bente Skei at NTNU for her involvement in handling of placental samples. We would like to acknowledge staff and patients at the general practice office Din Doktor and staff and participants at the Clinical Research Facility, St Olav's Hospital.
References
- 1. Watts DH, Krohn MA, Wener MH, Eschenbach DA. C‐reactive protein in normal pregnancy. Obstet Gynecol 1991; 77:176–80. [DOI] [PubMed] [Google Scholar]
- 2. Redman CW, Sargent IL. Preeclampsia and the systemic inflammatory response. Semin Nephrol 2004; 24:565–70. [DOI] [PubMed] [Google Scholar]
- 3. Kalinderis M, Papanikolaou A, Kalinderi K et al Elevated serum levels of interleukin‐6, interleukin‐1beta and human chorionic gonadotropin in pre‐eclampsia. Am J Reprod Immunol 2011; 66:468–75. [DOI] [PubMed] [Google Scholar]
- 4. Ernst GD, de Jonge LL, Hofman A et al C‐reactive protein levels in early pregnancy, fetal growth patterns, and the risk for neonatal complications: the generation R study. Am J Obstet Gynecol 2011; 205:132.e1–12. [DOI] [PubMed] [Google Scholar]
- 5. Duley L. The global impact of pre‐eclampsia and eclampsia. Semin Perinatol 2009; 33:130–7. [DOI] [PubMed] [Google Scholar]
- 6. McGinnis R, Steinthorsdottir V, Williams NO et al Variants in the fetal genome near FLT1 are associated with risk of preeclampsia. Nat Genet 2017; 49:1255–60. [DOI] [PubMed] [Google Scholar]
- 7. Verlohren S, Galindo A, Schlembach D et al An automated method for the determination of the sFlt‐1/PIGF ratio in the assessment of preeclampsia. Am J Obstet Gynecol 2010; 202:161.e1–11. [DOI] [PubMed] [Google Scholar]
- 8. Tangerås LH, Stødle GS, Olsen GD et al Functional Toll‐like receptors in primary first‐trimester trophoblasts. J Reprod Immunol 2014; 106:89–99. [DOI] [PubMed] [Google Scholar]
- 9. Matzinger P. The danger model: a renewed sense of self. Science 2002; 296:301–5. [DOI] [PubMed] [Google Scholar]
- 10. Broz P, Dixit VM. Inflammasomes: mechanism of assembly, regulation and signalling. Nat Rev Immunol 2016; 16:407–20. [DOI] [PubMed] [Google Scholar]
- 11. Schroder K, Tschopp J. The inflammasomes. Cell 2010; 140:821–32. [DOI] [PubMed] [Google Scholar]
- 12. Martinon F, Petrilli V, Mayor A, Tardivel A, Tschopp J. Gout‐associated uric acid crystals activate the NALP3 inflammasome. Nature 2006; 440:237–41. [DOI] [PubMed] [Google Scholar]
- 13. Duewell P, Kono H, Rayner KJ et al NLRP3 inflammasomes are required for atherogenesis and activated by cholesterol crystals. Nature 2010; 464:1357–61. [DOI] [PMC free article] [PubMed] [Google Scholar]
- 14. Galea J, Armstrong J, Gadsdon P, Holden H, Francis SE, Holt CM. Interleukin‐1 beta in coronary arteries of patients with ischemic heart disease. Arterioscler Thromb Vasc Biol 1996; 16:1000–6. [DOI] [PubMed] [Google Scholar]
- 15. Patel MN, Carroll RG, Galvan‐Pena S et al Inflammasome priming in sterile inflammatory disease. Trends Mol Med 2017; 23:165–80. [DOI] [PubMed] [Google Scholar]
- 16. McGeer PL, Lee M, McGeer EG. A review of human diseases caused or exacerbated by aberrant complement activation. Neurobiol Aging 2017; 52:12–22. [DOI] [PubMed] [Google Scholar]
- 17. Regal JF, Gilbert JS, Burwick RM. The complement system and adverse pregnancy outcomes. Mol Immunol 2015; 67:56–70. [DOI] [PMC free article] [PubMed] [Google Scholar]
- 18. An LL, Mehta P, Xu L et al Complement C5a potentiates uric acid crystal‐induced IL‐1beta production. Eur J Immunol 2014; 44:3669–79. [DOI] [PubMed] [Google Scholar]
- 19. Samstad EO, Niyonzima N, Nymo S et al Cholesterol crystals induce complement‐dependent inflammasome activation and cytokine release. J Immunol 2014; 192:2837–45. [DOI] [PMC free article] [PubMed] [Google Scholar]
- 20. Laresgoiti‐Servitje E. A leading role for the immune system in the pathophysiology of preeclampsia. J Leukoc Biol 2013; 94:247–57. [DOI] [PubMed] [Google Scholar]
- 21. El Khouly NI, Sanad ZF, Saleh SA, Shabana AA, Elhalaby AF, Badr EE. Value of first‐trimester serum lipid profile in early prediction of preeclampsia and its severity: a prospective cohort study. Hypertens Pregnancy 2016; 35:73–81. [DOI] [PubMed] [Google Scholar]
- 22. Spracklen CN, Smith CJ, Saftlas AF, Robinson JG, Ryckman KK. Maternal hyperlipidemia and the risk of preeclampsia: a meta‐analysis. Am J Epidemiol 2014; 180:346–58. [DOI] [PMC free article] [PubMed] [Google Scholar]
- 23. Egeland GM, Klungsøyr K, Øyen N, Tell GS, Næss Ø, Skjærven R. Preconception cardiovascular risk factor differences between gestational hypertension and preeclampsia: Cohort Norway Study. Hypertension 2016; 67:1173–80. [DOI] [PMC free article] [PubMed] [Google Scholar]
- 24. Powers RW, Bodnar LM, Ness RB et al Uric acid concentrations in early pregnancy among preeclamptic women with gestational hyperuricemia at delivery. Am J Obstet Gynecol 2006; 194:160.e1. [DOI] [PubMed] [Google Scholar]
- 25. Hawkins TL, Roberts JM, Mangos GJ, Davis GK, Roberts LM, Brown MA. Plasma uric acid remains a marker of poor outcome in hypertensive pregnancy: a retrospective cohort study. Br J Obstet Gynaecol 2012; 119:484–92. [DOI] [PubMed] [Google Scholar]
- 26. Bellomo G. Serum uric acid and pre‐eclampsia: an update. Exp Rev Cardiovasc Ther 2012; 10:701–5. [DOI] [PubMed] [Google Scholar]
- 27. Peracoli MT, Bannwart CF, Cristofalo R et al Increased reactive oxygen species and tumor necrosis factor‐alpha production by monocytes are associated with elevated levels of uric acid in pre‐eclamptic women. Am J Reprod Immunol 2011; 66:460–7. [DOI] [PubMed] [Google Scholar]
- 28. Koçyıgıt Y, Atamer Y, Atamer A, Tuzcu A, Akkus Z. Changes in serum levels of leptin, cytokines and lipoprotein in pre‐eclamptic and normotensive pregnant women. Gynecol Endocrinol 2004; 19:267–73. [DOI] [PubMed] [Google Scholar]
- 29. Baumann M, Korner M, Huang X, Wenger F, Surbek D, Albrecht C. Placental ABCA1 and ABCG1 expression in gestational disease: pre‐eclampsia affects ABCA1 levels in syncytiotrophoblasts. Placenta 2013; 34:1079–86. [DOI] [PubMed] [Google Scholar]
- 30. Brien ME, Duval C, Palacios J et al Uric acid crystals induce placental inflammation and alter trophoblast function via an IL‐1‐dependent pathway: implications for fetal growth restriction. J Immunol 2016;198:443–51. [DOI] [PMC free article] [PubMed] [Google Scholar]
- 31. Kohli S, Ranjan S, Hoffmann J et al Maternal extracellular vesicles and platelets promote preeclampsia via inflammasome activation in trophoblasts. Blood 2016; 128:2153–64. [DOI] [PubMed] [Google Scholar]
- 32. Weel IC, Romao‐Veiga M, Matias ML et al Increased expression of NLRP3 inflammasome in placentas from pregnant women with severe preeclampsia. J Reprod Immunol 2017; 123:40–7. [DOI] [PubMed] [Google Scholar]
- 33. Pontillo A, Girardelli M, Agostinis C, Masat E, Bulla R, Crovella S. Bacterial LPS differently modulates inflammasome gene expression and IL‐1beta secretion in trophoblast cells, decidual stromal cells, and decidual endothelial cells. Reprod Sci 2013; 20:563–6. [DOI] [PubMed] [Google Scholar]
- 34. Mulla MJ, Myrtolli K, Potter J et al Uric acid induces trophoblast IL‐1beta production via the inflammasome: implications for the pathogenesis of preeclampsia. Am J Reprod Immunol 2011; 65:542–8. [DOI] [PMC free article] [PubMed] [Google Scholar]
- 35. Ma Y, Ruan CC, Zhang Y et al OS 23‐02 the role of complement C5a‐mediated placental dysfunction in the onset of preeclampsia. J Hypertens 2016; 34:e241. [Google Scholar]
- 36. Burwick RM, Fichorova RN, Dawood HY, Yamamoto HS, Feinberg BB. Urinary excretion of C5b‐9 in severe preeclampsia: tipping the balance of complement activation in pregnancy. Hypertension 2013; 62:1040–5. [DOI] [PubMed] [Google Scholar]
- 37. He Y, Xu B, Song D, Yu F, Chen Q, Zhao M. Expression of the complement system's activation factors in plasma of patients with early/late‐onset severe pre‐eclampsia. Am J Reprod Immunol 2016; 76:205–11. [DOI] [PubMed] [Google Scholar]
- 38. Dong W, Yin L. Expression of lipoxin A4, TNFalpha and IL‐1beta in maternal peripheral blood, umbilical cord blood and placenta, and their significance in pre‐eclampsia. Hypertens Pregnancy 2014; 33:449–56. [DOI] [PubMed] [Google Scholar]
- 39. Siljee JE, Wortelboer EJ, Koster MP et al Identification of interleukin‐1 beta, but no other inflammatory proteins, as an early onset pre‐eclampsia biomarker in first trimester serum by bead‐based multiplexed immunoassays. Prenat Diagn 2013; 33:1183–8. [DOI] [PubMed] [Google Scholar]
- 40. Staff A, Andersgaard A, Henriksen T et al. Hypertensive svangerskapskomplikasjoner og eklampsi [Hypertensive pregnancy complications and eclampsia] [in Norwegian]. Oslo, Norway: Legeforeningen, 2014.
- 41. Johnsen SL, Rasmussen S, Wilsgaard T, Sollien R, Kiserud T. Longitudinal reference ranges for estimated fetal weight. Acta Obstet Gynecol Scand 2006; 85:286–97. [DOI] [PubMed] [Google Scholar]
- 42. Miller RK, Genbacev O, Turner MA, Aplin JD, Caniggia I, Huppertz B. Human placental explants in culture: approaches and assessments. Placenta 2005; 26:439–48. [DOI] [PubMed] [Google Scholar]
- 43. Choy MY, Manyonda IT. The phagocytic activity of human first trimester extravillous trophoblast. Hum Reprod 1998; 13:2941–9. [DOI] [PubMed] [Google Scholar]
- 44. Coll RC, Robertson AA, Chae JJ et al A small‐molecule inhibitor of the NLRP3 inflammasome for the treatment of inflammatory diseases. Nat Med 2015; 21:248–55. [DOI] [PMC free article] [PubMed] [Google Scholar]
- 45. Tamura K, Ishikawa G, Yoshie M, Ohneda W, Nakai A, Takeshita T, Tachikawa E. Glibenclamide inhibits NLRP3 inflammasome‐mediated IL‐1beta secretion in human trophoblasts. J Pharmacol Sci 2017; 135:89–95. [DOI] [PubMed] [Google Scholar]
- 46. Bryant AH, Bevan RJ, Spencer‐Harty S, Scott LM, Jones RH, Thornton CA. Expression and function of NOD‐like receptors by human term gestation‐associated tissues. Placenta 2017; 58:25–32. [DOI] [PubMed] [Google Scholar]
- 47. Paulesu L, King A, Loke YW, Cintorino M, Bellizzi E, Boraschi D. Immunohistochemical localization of IL‐1 alpha and IL‐1 beta in normal human placenta. Lymphokine Cytokine Res 1991; 10:443–8. [PubMed] [Google Scholar]
- 48. Hu XL, Yang Y, Hunt JS. Differential distribution of interleukin‐1 alpha and interleukin‐1 beta proteins in human placentas. J Reprod Immunol 1992; 22:257–68. [DOI] [PubMed] [Google Scholar]
- 49. Haynes MK, Jackson LG, Tuan RS, Shepley KJ, Smith JB. Cytokine production in first trimester chorionic villi: detection of mRNAs and protein products in situ . Cell Immunol 1993; 151:300–8. [DOI] [PubMed] [Google Scholar]
- 50. Rinehart BK, Terrone DA, Lagoo‐Deenadayalan S et al Expression of the placental cytokines tumor necrosis factor alpha, interleukin 1beta, and interleukin 10 is increased in preeclampsia. Am J Obstet Gynecol 1999; 181:915–20. [DOI] [PubMed] [Google Scholar]
- 51. Munno I, Chiechi LM, Lacedra G et al Spontaneous and induced release of prostaglandins, interleukin (IL)‐1beta, IL‐6, and tumor necrosis factor‐alpha by placental tissue from normal and preeclamptic pregnancies. Am J Reprod Immunol 1999; 42:369–74. [DOI] [PubMed] [Google Scholar]
- 52. Amash A, Holcberg G, Sapir O, Huleihel M. Placental secretion of interleukin‐1 and interleukin‐1 receptor antagonist in preeclampsia: effect of magnesium sulfate. J Interferon Cytokine Res 2012; 32:432–41. [DOI] [PMC free article] [PubMed] [Google Scholar]
- 53. Kavathas PB, Boeras CM, Mulla MJ, Abrahams VM. Nod1, but not the ASC inflammasome, contributes to induction of IL‐1beta secretion in human trophoblasts after sensing of Chlamydia trachomatis. Mucosal Immunol 2013; 6:235–43. [DOI] [PMC free article] [PubMed] [Google Scholar]
- 54. Rathinam VA, Fitzgerald KA. Inflammasome complexes: emerging mechanisms and effector functions. Cell 2016; 165:792–800. [DOI] [PMC free article] [PubMed] [Google Scholar]
- 55. Vince GS, Starkey PM, Austgulen R, Kwiatkowski D, Redman CW. Interleukin‐6, tumour necrosis factor and soluble tumour necrosis factor receptors in women with pre‐eclampsia. Br J Obstet Gynaecol 1995; 102:20–5. [DOI] [PubMed] [Google Scholar]
- 56. Weel IC, Baergen RN, Romao‐Veiga M et al Association between placental lesions, cytokines and angiogenic factors in pregnant women with preeclampsia. PLOS ONE 2016; 11:e0157584. [DOI] [PMC free article] [PubMed] [Google Scholar]
- 57. Xie F, Hu Y, Turvey SE et al Toll‐like receptors 2 and 4 and the cryopyrin inflammasome in normal pregnancy and pre‐eclampsia. Br J Obstet Gynaecol 2010; 117:99–108. [DOI] [PubMed] [Google Scholar]
- 58. Redman CW, Tannetta DS, Dragovic RA et al Review: does size matter? Placental debris and the pathophysiology of pre‐eclampsia. Placenta 2012; 33 Suppl:S48–54. [DOI] [PubMed] [Google Scholar]
- 59. Staff AC, Ranheim T, Khoury J, Henriksen T. Increased contents of phospholipids, cholesterol, and lipid peroxides in decidua basalis in women with preeclampsia. Am J Obstet Gynecol 1999; 180:587–92. [DOI] [PubMed] [Google Scholar]
- 60. Khong TY, Wolf F, Robertson WB, Brosens I. Inadequate maternal vascular response to placentation in pregnancies complicated by pre‐eclampsia and by small‐for‐gestational age infants. Br J Obstet Gynaecol 1986; 93:1049–59. [DOI] [PubMed] [Google Scholar]
- 61. Roberts JM, Escudero C. The placenta in preeclampsia. Pregnancy Hypertens 2012; 2:72–83. [DOI] [PMC free article] [PubMed] [Google Scholar]
- 62. Sabatier F, Bretelle F, d'Ercole C, Boubli L, Sampol J, Dignat‐George F. Neutrophil activation in preeclampsia and isolated intrauterine growth restriction. Am J Obstet Gynecol 2000; 183:1558–63. [DOI] [PubMed] [Google Scholar]
- 63. Ogge G, Romero R, Chaiworapongsa T et al Leukocytes of pregnant women with small‐for‐gestational age neonates have a different phenotypic and metabolic activity from those of women with preeclampsia. J Matern Fetal Neonatal Med 2010; 23:476–87. [DOI] [PMC free article] [PubMed] [Google Scholar]
Associated Data
This section collects any data citations, data availability statements, or supplementary materials included in this article.
Supplementary Materials
Additional Supporting information may be found in the online version of this article at the publisher's web‐site:
Fig. S1. Isotype controls for immunohistochemical staining protocols. Third‐trimester placentas were stained with isotype controls matching the specific antibodies used for (a) interleukin (IL)‐1β, (b) Nod‐like receptor protein (NLRP)3, (c) caspase‐1, (d) complement component 5a (C5a) and (e) terminal complement complex (TCC).
Fig. S2. Immunohistochemical staining of (a) Nod‐like receptor protein (NLRP)3 and (b) interleukin (IL)‐1β in first‐trimester placental tissue (n = 10).
Fig. S3. Lactate dehydrogenase (LDH) release from placental explants [n = 6 in (a), n = 4 in (b)]. Kruskal–Wallis test with Dunn's multiple comparison post‐hoc test. Mean with standard error of the mean (s.e.m.).
Fig. S4. Lactate dehydrogenase (LDH) release from trophoblast cells (n = 3). Kruskal–Wallis test with Dunn's multiple comparison post‐hoc test. Mean with standard error of the mean (s.e.m.).
Table S1. Clinical characteristics for subjects included in third‐trimester placental analyses (n = 36).
Table S2. Clinical characteristics and markers for subjects included in serum analyses (n = 105).


