

Abstract
ATP-binding cassette (ABC) transporters are responsible for the transport of a wide variety of water-soluble molecules and ions into prokaryotic cells. In Gram-negative bacteria, periplasmic-binding proteins deliver ions or molecules such as thiamin to the membrane-bound ABC transporter. The gene for the thiamin-binding protein tbpA has been identified in both Escherichia coli and Salmonella typhimurium. Here we report the crystal structure of TbpA from E. coli with bound thiamin monophosphate. The structure was determined at 2.25 Å resolution using single-wavelength anomalous diffraction experiments, despite the presence of nonmerohedral twinning. The crystal structure shows that TbpA belongs to the group II periplasmic-binding protein family. Equilibrium binding measurements showed similar dissociation constants for thiamin, thiamin monophosphate, and thiamin pyrophosphate. Analysis of the binding site by molecular modeling demonstrated how TbpA binds all three forms of thiamin. A comparison of TbpA and thiaminase-I, a thiamin-degrading enzyme, revealed structural similarity between the two proteins, especially in domain 1, suggesting that the two proteins evolved from a common ancestor.
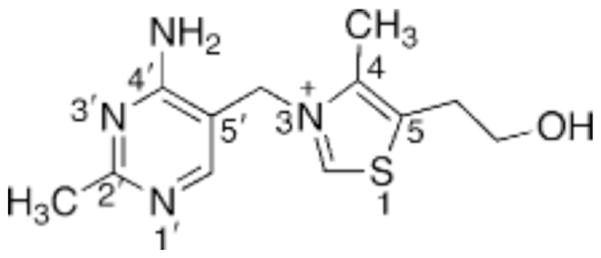
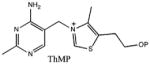
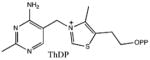
Thiamin (vitamin B1; Scheme 1) is an essential cofactor in all living systems. Thiamin diphosphate (ThDP1)-dependent enzymes play an important role in carbohydrate and branched-chain amino acid metabolism. Most prokaryotes, plants, and fungi can synthesize thiamin, but it is not synthesized in vertebrates. Thiamin deficiency can lead to several disorders including beriberi and Wernicke–Korsakoff syndrome. Wernicke–Korsakoff syndrome can be a fatal neurological disease and is often diagnosed in alcoholics and others who suffer from poor nutrition (as reviewed in ref 1). Thiamin biosynthesis in prokaryotes such as Escherichia coli, Bacillus subtilis, and Salmonella typhimurium has been well characterized (2). In each of these organisms, the pyrimidine and thiazole moieties are formed separately and then joined to form thiamin monophosphate (ThMP). The details of thiamin biosynthesis in eukaryotes are just beginning to emerge. In yeast the pyrimidine and thiazole moieties are also synthesized separately, but the biosynthetic enzymes are unrelated to those in prokaryotes (3–5).
Scheme 1.
In addition to thiamin biosynthesis, most organisms can take up thiamin using specific transporters. In prokaryotes ATP-binding cassette (ABC) transporters are responsible for the transport of a wide variety of ions and small molecules into the cell. ABC transporters consist of a periplasmic-binding protein (PBP), a transmembrane permease, and a cytosolic ATPase. The PBP binds the substrate and delivers it to the permease where the energy for transport is provided by the hydrolysis of two ATP molecules by the cytosolic ATPase (as reviewed in refs 6 and 7). Thiamin-binding protein (TbpA) is the thiamin PBP in E. coli, whereas the transmembrane permease and ATPase are ThiP and ThiQ, respectively (8, 9). E. coli TbpA has been shown to bind thiamin (ThOH), ThMP, and ThDP (8).
Interestingly, the enzyme thiaminase-I also belongs to the PBP superfamily (10). Thiaminase-I is found in Bacillus thiaminolyticus and degrades thiamin to thiazole and pyrimidine moieties using a wide variety of nucleophiles. Consequentially, B. thiaminolyticus is pathogenic to the host organism by depleting its thiamin supply. The structural similarity of thiaminase-I and TbpA and the ability of both proteins to bind thiamin in similar binding sites, which are located in a cleft between the two main structural domains, suggest a common ancestor. The low sequence identity of the two proteins indicates considerable evolutionary divergence.
In this paper we report the crystal structure of TbpA from E. coli in complex with ThMP as determined to 2.25 Å resolution. We also report dissociation constants, determined by equilibrium fluorescence titration, for ThOH, ThMP, and ThDP and present a model to explain the similar values that were observed. Finally, we compare TbpA and thiaminase-I and suggest that these two proteins evolved from a common ancestor.
EXPERIMENTAL PROCEDURES
Construction of the TbpA Overexpression Plasmid
The TbpA gene (minus the N-terminal signal sequence, amino acid residues 1–18) was PCR amplified from E. coli genomic DNA using the following primers: upstream primer 5′-TAG TAG CAT ATG AAA CCC GTT CTG ACT GTT TAT ACC-3′ (inserts an NdeI site at the start codon); downstream primer 5′-TAG TAG CTC GAG TTA ACG GCT GAC GGC GCG TTG CCA TTC GC-3′ (inserts an XhoI site after the end of the tbpA open reading frame). The amplified PCR product was purified (QIAquick DNA extraction kit from Qiagen) and cloned into pSTBlue1 (Novagen). A representative clone was sequenced and named pEcT-BP.ST. A vector encoding an N-terminal 6-histidine-tagged TbpA was generated by digesting pEcTBP.ST with NdeI and XhoI and ligating the purified fragment into similarly digested pET-28a (Novagen), designated pEcTBP.28.
Protein Expression and Purification
The pEcTBP.28 construct was transformed into the methionine-auxotrophic strain of E. coli, B834(DE3) (Novagen). The cells were grown using 1 L of growth medium which contained M9 salts supplemented with 40 μg/mL of all amino acids except L-methionine, which was replaced with L-selenomethionine (SeMet). The medium also contained 0.4% (w/v) glucose, 2 mM MgSO4, 25 μg/mL FeSO4·7H2O, 0.1 mM CaCl2, 40 μg/mL kanamycin, and 1% BME vitamin solution (GibcoBRL). The cells from an initial 5 mL LB starter culture were washed with the above medium and used to start a 50 mL culture. This second culture was grown to an OD600 of ~0.6 at 37 °C and used to inoculate a larger 1 L culture. The 1 L cultures were grown at 37 °C until they reached an OD600 of ~0.6, at which point the cells were induced with 500 μM isopropyl-β-D-thiogalactoside and the temperature was reduced to 25 °C. After 6 h of further growth, the cells were spun down at 6000g for 20 min and stored at −80 °C.
All purification steps were carried out at 4 °C. The cells were resuspended in 20 mL of binding buffer (50 mM Tris, 300 mM NaCl, 1 mM dithiothreitol (DTT), and 10 mM imidazole, pH 8.0) and lysed using a French press. The crude extract was centrifuged at 27 000g for 30 min. The resulting supernatant was mixed for 1 h with 500 μL of Ni–NTA beads (Novagen) equilibrated with the binding buffer. The beads were then added to a polypropylene column and were washed with 200 mL of binding buffer followed by 50 mL of wash buffer (50 mM Tris, 300 mM NaCl, 1 mM DTT, and 30 mM imidazole, pH 8.0). TbpA was eluted from the column using 30 mL of elution buffer (50 mM Tris, 300 mM NaCl, 1 mM DTT, and 250 mM imidazole, pH 8.0). The SeMet TbpA was then buffer exchanged into 20 mM Tris and 1 mM DTT, pH 8.0 with an Econo-Pac 10DG column (BioRad), concentrated to 12.5 mg/mL using a 10 kDa cutoff concentrator (Amicon), and stored at −80 °C. Protein concentration was determined by the Bradford method using bovine serum albumin as the standard (11). The purity of TbpA was determined to be 95–99% by Coomassie-stained SDS–PAGE analysis (data not shown).
Crystallization
SeMet TbpA was crystallized using the hanging drop vapor diffusion method at 22 °C with drops containing 1 μL of protein and 1 μL of well solution. The protein was incubated with 2 mM ThMP for an hour at 25 °C before setting up the crystallization trays. The well solution for optimized conditions contained 1.9–2.0 M (NH4)2SO4, 100 mM sodium citrate, pH 5.0–5.6, and 0.2 M Na/K tartrate. Needle clusters appeared within 1 week and grew to their maximum size in 2 weeks (300 μm × 100 μm × 40 μm). A needle fragment was broken off the cluster and used for data collection. Crystals were transferred into cryoprotectant (2.1 M (NH4)2SO4, 100 mM sodium citrate, pH 5.0–5.6, 0.2 M Na/K tartrate, and 11% glycerol), flash-frozen in liquid nitrogen, and stored for later use.
X-ray Data Collection
Data were collected at the Advanced Photon Source (APS) beamline 24-ID-C using a Quantum 315 detector (Area Detector Systems Corporation) and at the Cornell High Energy Synchrotron Source (CHESS) beamline F2 using a Quantum 210 detector (Area Detector Systems Corporation). A single-wavelength anomalous diffraction (SAD) data set was collected at 0.9792 Å (Se peak) at the APS to a resolution of 2.5 Å. Bijvoet pairs were measured using inverse beam geometry in 20° wedges with an oscillation range of 1.0°. A second data set was collected at CHESS at a wavelength of 0.9795 Å to a resolution of 2.25 Å.
Data Processing and Structure Determination
The data collected at APS were processed using the HKL2000 suite (12). Autoindexing routines initially failed to correctly index the data. Closer inspection of the spot predictions, however, indicated that many predictions had no intensities and many spots were not predicted, observations characteristic of nonmerohedral twinning. On the basis of visual inspection of the observed and predicted diffraction patterns, the real c-axis was determined to be 91.9 Å (Figure 1), approximately one-third the value from the autoindexing procedure. Once the nonmerohedral twinning was taken into account, the two twin domains were indexed independently and all spots could be accounted for (Figure 1, parts C and D), but only one twin was used for integration. An error scale factor of 2 was judged by trial-and-error to provide a compromise between rejecting bad intensities and preserving the anomalous signal. The correct unit cell belongs to space group P21 with unit cell parameters a = 69.3 Å, b = 119.1 Å, c = 91.0 Å, and β = 94.1°. The unit cell contained four TbpA monomers per asymmetric unit, corresponding to a solvent content of 52% and a Matthews number of 2.6 Å3/Da (13). See Table 1 for the final data collection and processing statistics.
Figure 1.
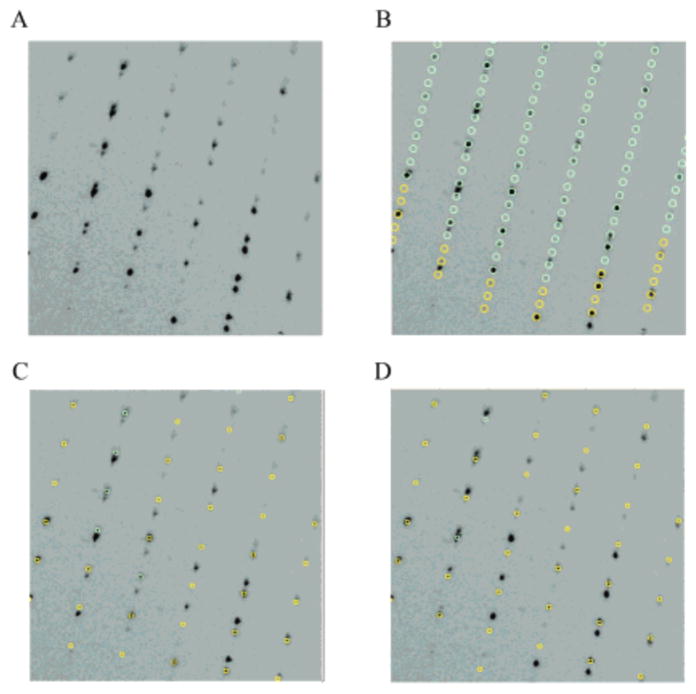
TbpA twinned diffraction pattern. (A) Section of the diffraction pattern showing two lattices. (B) Autoindexing of the diffraction pattern showing a monoclinic cell with unit cell parameters a = 69.4 Å, b = 119.8 Å, c = 274.2 Å, and β = 93.9°. Closer inspection of (A) and (B) reveals that some predictions have no intensities and that some spots are poorly predicted. Once the nonmerohedral twinning is taken into account, the same diffraction pattern is indexed with c = 91.9 Å. (C) Same diffraction pattern indexed with the correct unit cell depicting one twin domain. (D) Diffraction pattern indexed with the second twin domain.
Table 1.
Summary of Data Collection and Processing Statistics
| SeMet 1 (peak) | SeMet 2 | |
|---|---|---|
| beamline | APS 24-ID-C | CHESS F2 |
| wavelength (Å) | 0.9792 | 0.9795 |
| resolution (Å) | 2.50 | 2.25 |
| space group | P21 | P21 |
| unit cell params | ||
| a (Å) | 69.3 | 69.0 |
| b (Å) | 119.1 | 118.1 |
| c (Å) | 91.0 | 90.3 |
| β (deg) | 94.0 | 93.7 |
| no. of reflns | 184 102 | 278 959 |
| no. of unique reflns | 88 923 | 124 110 |
| redundancya | 2.2 (1.6) | 2.3 (2.0) |
| completeness (%) | 90.4 (69.9) | 89.9 (81.1) |
| Rsym (%)b | 12.9 (46.1) | 11.5 (38.6) |
| I/σ | 10.0 (1.1) | 11.8 (2.7) |
| Wilson B factor (Å2) | 51.4 | 23.6 |
Values in parentheses represent statistics for the highest resolution bin.
Rsym = ΣΣi|Ii − 〈I〉|/Σ 〈I〉, where 〈I〉 is the mean intensity of the N reflections with intensity Ii and common indices h, k, l.
The structure of TbpA was determined by the SAD technique employing the anomalous signal from the selenium atoms. Seventeen selenium sites out of a possible 20 were located using the program SHELXD (14) with data up to 4 Å from the major twin lattice. Initial phases were calculated using 17 Se sites with the CCP4 program MLPHARE (15). Fourfold noncrystallographic symmetry (NCS) averaging, density modification, and phase extension gave a final resolution of 2.5 Å using RESOLVE (16). The resulting electron density map was easily interpretable.
Model Building and Refinement
The model-building program Coot (17) was used to manually build one monomer of TbpA with the partial model and the density modified maps from RESOLVE as a starting point. NCS was used to orient the other three monomers in the asymmetric unit, and each monomer was manually rebuilt. Early in the model building it became apparent that a molecule of ThMP was bound to each monomer, and the ligands were included in all subsequent calculations. Refinement using Refmac, with TLS and NCS restraints along with composite omit maps from CNS, was used to improve the model (18, 19). CNS was used for the final model refinement and water picking. The program RAVE was used to average the electron density maps, and NCS restraints were used initially, with main chain restraints set to 300 and side chain residues’ restraints of 250 (20, 21). The NCS restraints were slowly relaxed and eventually removed after several rounds of refinement. The final R factor and Rfree are 19.7% and 24.1%, respectively. Final refinement statistics are shown in Table 2.
Table 2.
Summary of Refinement Statistics for Thiamin-Binding Protein
| resolution (Å) | 50–2.25 |
| total no. of non-hydrogen atoms | 10 285 |
| no. of protein atoms | 9645 |
| no. of ligand atoms | 84 |
| no. of water atoms | 506 |
| no. of reflns in refinement | 58 663 |
| no. of reflns in test set | 3076 |
| R factor (%)a | 19.7 |
| Rfree (%)b | 24.1 |
| av B factors (Å2) | |
| protein main chain | 26.3 |
| protein side chain | 26.1 |
| ligand | 19.4 |
| water | 31.0 |
| rms deviations from ideal geometry | |
| bonds (Å) | 0.006 |
| angles (deg) | 1.27 |
| Ramachandran | |
| most favored regions (%) | 90.6 |
| additional allowed regions (%) | 9.4 |
| disallowed regions (%) | 0.0 |
R factor = Σhkl||Fobs| − k|Fcal|/Σhkl|Fobs|, where Fobs and Fcal are observed and calculated structure factors, respectively.
For Rfree, the sum is extended over a subset of reflections (5%) excluded from all stages of refinement.
Determination of the TbpA–Thiamin Dissociation Constant, Kd
The dissociation constants (Kd) for ThOH, ThMP, ThDP, HMP, and THZ binding to TbpA were measured using a fluorescence titration assay taking advantage of the large intrinsic protein fluorescence change that occurs with binding of the ligand. The titration experiments were performed in the following buffer system: 50 mM Tris–HCl, pH 7.6 at room temperature, 100 mM NaCl, 2 mM TCEP, and 8 mM MgCl2. Titrations were carried out using a KinTek Corporation SF-2004 stopped flow system equipped with an optional titration module. The excitation and emission wavelengths were 298 and 340 nm, respectively. A volume of 10 μL of the ligand solution was titrated continuously over a period of 60 s into 300 μL of the TbpA solution. The final concentrations of ligand and TbpA after the titration was completed were 0.6 and 1.5 μM, respectively.
Nonlinear regression analyses were performed in the program GraFit 5 (Erithacus Software Ltd.) by the least-squares method using the following quadratic equation:
where Fo is the initial fluorescence, ¢ F is the overall change in fluorescence, Po is the ligand binding site concentration, Lo is the ligand concentration, and Kd is the dissociation constant (22).
Modeling of TbpA-Bound ThOH and ThDP
The modeling of ThDP and ThOH into the binding site of TbpA was carried out using the program MacroModel, version 9.1 (23). The base shell of atoms included all residues within 18.0 Å of the ThMP and was used as the starting model for energy minimization. The ligands were built into the binding site, followed by removal of water molecules, and hydrogen atoms were added appropriately. The starting structure was subjected to mixed Monte Carlo MCMM/low mode conformational search steps allowing key residues in the 5 Å shell around the binding site to move (Try27, Asp28, Ser29, Trp34, Asp59, Ser161, Thr162, Trp197, Ser198, Tyr215, Ser218, Trp280, and Met281). All rotatable bonds of the ligand were varied during conformational searching, and three translational and three rotational movements of the ligand were varied up to 1 Å and 180°, respectively. The generated structures were energy minimized to a gradient of 0.05 kJ/mol Å in vacuo using the AMBER* force field (24, 25), an electrostatic potential with a distance-dependent 4r dielectric treatment and a TNCG minimization technique (26). The 30 structures with the lowest energy found during the simulation were visually examined, and the structures having the most sensible interactions with the protein were selected for further analysis.
Figure Preparation
All figures were prepared using Molscript (27, 28), Raster3D (29), and PyMOL (30).
RESULTS
Overall Structure
The structure of TbpA from E. coli was determined to 2.25 Å resolution using SAD phasing methods. The model contains four monomers in the asymmetric unit. Residues 1–18 were deleted in the expression vector and consequently are missing from the model. Chain A contains residues 19–326, and chains B, C, and D contain residues 19–327, with chain C also containing residues from the N-terminal polyhistidine tag. The TbpA structure resembles other PBPs and consists of two domains linked by a flexible hinge region with a binding cleft located between the two domains (Figure 2). Domain 1 is a three-layer αβα sandwich consisting of a five-stranded mixed β-sheet with a β-strand topology of vβ2vβ1vβ3Vβ9vβ4a. The central β-sheet is flanked by five α-helices with two helices above the β-sheet and three below. Domain 2 also consists of a five-stranded mixed β-sheet with a β-strand topology vβ6vβ5vβ7Vβ4bvβ8. The central β-sheet is flanked by six α-helices with three helices above the central β-sheet and three below. Similarity between the two domains has also been observed in other PBPs and is thought to result from gene duplication. There are two crossovers between domains 1 and 2. The first crossover is β4 with the N-terminal portion contributing to domain 1 and the C-terminal portion contributing to domain 2. The second crossover occurs at β9, which is mostly located in domain 1. The two crossovers and the interface between the two domains form the ligand binding site.
Figure 2.

TbpA monomer. (A) Stereoview of the Cα trace with α-helices shown in blue, 310 helices shown in cyan, and β-sheets shown in green. (B) Ribbon diagram of the monomer showing the two domains with ThMP shown in ball-and-stick and colored by atom with gray for carbon, blue for nitrogen, yellow for sulfur, red for oxygen, and magenta for phosphorus. (C) Topology diagram for TbpA with α-helices shown in blue, 310 helices shown in cyan, and β-sheets shown in green.
Dimeric Structure
The four monomers in the asymmetric unit are arranged as a pair of dimers, each with noncrystallographic twofold symmetry. Chains A and B form one dimer, and chains C and D form the second dimer. The dimensions of the dimer are 60 Å × 70 Å × 45 Å. In chain A, helix α4, located in domain 1 of chain A, interacts with α12 in domain 2 of chain B. The dimer interface buries 2250 Å2 of surface area and contains 15 hydrogen bonds but no salt bridges between the two monomers. Dimer formation blocks access to the ligand binding site and the biological relevance of the dimer is unclear. Gel filtration and sedimentation equilibrium centrifugation studies showed that E. coli TbpA is a monomer in solution (8, 31).
Ligand Binding Site
The thiamin-binding site is located in a cleft between domains 1 and 2 with the two crossovers between the domains closing off one side of the cleft. The cleft is approximately 6 Å wide, 17 Å long, and 12 Å deep (Figure 2). Each of the four monomers showed clear density for one ThMP molecule located in the binding site (Figure 3). The pyrimidine ring is in the interior of the protein, and the phosphate group is located closer to the edge of the cleft. The N1′ nitrogen atom of the pyrimidine ring forms a hydrogen bond with the hydroxyl group of Ser 218 (Figure 4). Water molecules form hydrogen bonds with the N3′ nitrogen atom and the amino group on the pyrimidine ring. The amide group of Asn279 forms a water-mediated interaction with the amino group on the pyrimidine ring. The hydroxyl group of Ser29 forms two water-mediated interactions with the amino group of the pyrimidine ring and the phosphate group. These water molecules are observed in all four binding sites.
Figure 3.
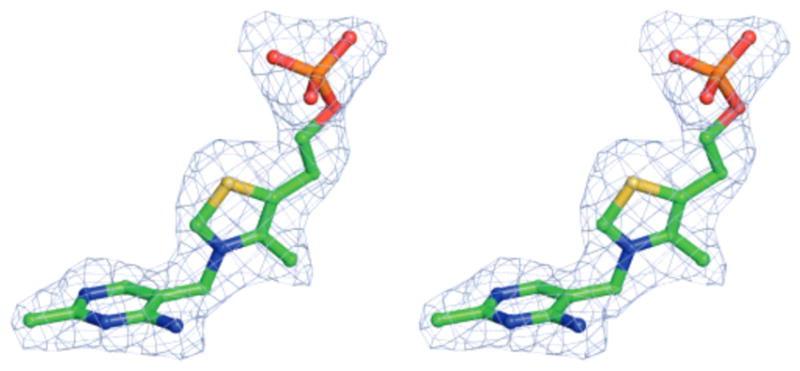
Electron density for the ThMP ligand. The electron density was generated using an OMITMAP and further improved using fourfold NCS averaging. The map is contoured at 3σ.
Figure 4.

TbpA ligand binding site. (A) Stereoview of the binding site with the amino acid side chains and ThMP shown in ball-and-stick. The binding site is colored by atom with green for carbon on the protein and gray for carbon in ThMP, blue for nitrogen, yellow for sulfur, red for oxygen, and magenta for phosphorus. (B) Schematic representation of the binding site showing ThMP key stacking interactions and hydrogen bonding to TbpA.
The thiazole ring is sandwiched between Tyr215 and Tyr27 and is positioned edge-to-face from Trp197 with a distance of 3.4 Å. The pyrimidine ring is positioned 3.5 Å from Trp197 with an angle of about 45°. Tyr221 and Trp280 close off the binding site to complete a mostly hydrophobic pocket. The phosphate group makes extensive hydrogen-bonding contacts that anchor it to the protein. The O1 oxygen atom forms hydrogen bonds with the main chain nitrogen atom of Trp197 and the hydroxyl group of Ser161, which is located in α6. The O2 oxygen atom accepts a hydrogen bond from the Gly60 main chain nitrogen atom. The O3 oxygen atom forms a hydrogen bond to a water molecule and the Asp59 side chain. Either the aspartate side chain or the phosphate is likely protonated to avoid repulsion of the two negatively charged groups. The phosphate binding site is also located near the edge of the cleft, with Asp28 and Asp59 shielding the thiamin-binding site from solvent.
Kd Values for TbpA
The Kd for ThOH, ThMP, and ThDP were determined using titration experiments in which the change in the intrinsic protein fluorescence was monitored as a function of ligand concentration. The data were fit by nonlinear regression using a quadratic equation to define the dissociation constant. All three thiamin species bound with high affinity. The Kd values for ThOH, ThMP, and ThDP are 3.8, 2.3, and 7.4 nM, respectively (Table 3). The fluorescence curve for ThOH is shown in Figure 5. Under our assay conditions, no binding of HMP or THZ could be detected.
Table 3.
Dissociation Constants for Thiamin-Binding Protein
| Substrate | Kd |
|---|---|
|
3.8 ± 0.3 nM |
|
2.3 ± 0.6 nM |
|
7.4 ± 0.7 nM |
|
No binding |
|
No binding |
Figure 5.
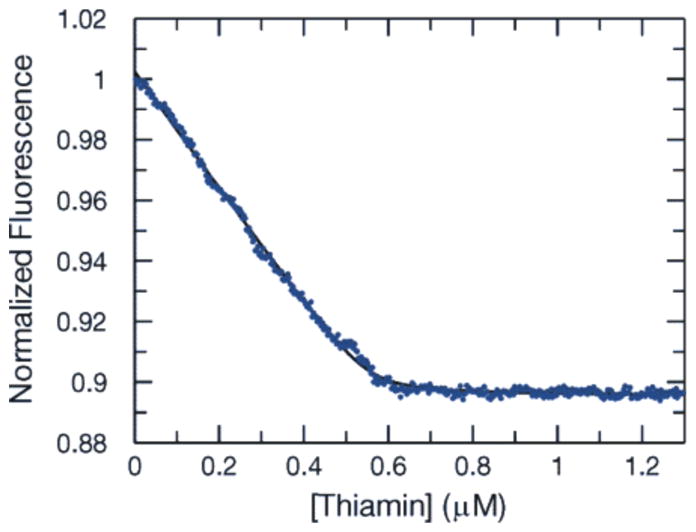
Representative equilibrium fluorescence titration curve for ThOH binding to TbpA used to determine the Kd.
DISCUSSION
Twinning
Fortuitous cell lengths and angles associated with unexpected observations and systematic absences of diffraction spots can be indications of nonmerohedral twinning. In the case of TbpA, a fortuitous cell that satisfies 11.3c(cos β) + a ≈ 0 was identified. This relationship results in overlapping of reflections approximately every sixth layer along a* (the overlap would be perfect if the coefficient for c was 12 instead of 11.3). This relationship results in poorly estimated intensities for the overlapping reflections (approximately one-sixth of the data) but reliable intensities for the remainder of the data set. We did not correct for the close overlaps because different crystal orientations give different degrees of overlap. Instead we adjusted the error scale factor by trial-and-error to reject only the most serious outliers and used data redundancy to average out the systematic errors resulting in partial overlap for some reflections. This process together with fourfold NCS averaging may account for the good quality of the final structure. Hence, once the correct cell was deduced and the error terms used for scaling were adjusted, structure solution and refinement went smoothly without the need for detwinning algorithms.
Comparison to Other Periplasmic-Binding Proteins
In Gram-negative bacteria, the PBPs deliver ions and small molecules to the membrane-bound ABC transporters (32, 33). Despite low sequence homology, there is a high degree of structural homology within the PBP family. The characteristic PBP fold consists of two globular domains connected by a variable linker region (34). The PBPs are classified into three groups based on the number of crossovers between the two domains. Group I PBP contains three interdomain connections, group II has two crossovers, and group III has only one (33, 35, 36). TbpA contains two crossovers and therefore is classified as a group II PBP. The binding cleft for all PBPs is located between domains 1 and 2. Crystal structures of both unbound and bound PBPs show that the proteins exist in an open or closed conformation based on the ligand binding state. Ligand binding causes the two domains to twist and close in what is called the “Venus flytrap” model (33, 37, 38). An eight residue motif has been identified as the hinge region for group I PBPs (39). The structure of maltose-binding protein in an open and closed conformation confirmed that group II PBPs also have a hinge region (40). A hinge region for group III PBPs has been suggested based on molecular dynamics studies (41).
A DALI (42) search of the full length TbpA reveals that the iron-binding protein (FeBP) from Haemophilus influenzae (PDB code 1MRP) (43) was the most similar with a Z score of 26.6. Both proteins are group II PBPs, and a comparison of the topologies of TbpA and FeBP shows only small differences in the fold. FeBP contains six α-helices in domain 1 and five α-helices in domain 2, whereas TbpA contains five α-helices in domain 1 and six α-helices in domain 2. The FeBP structure contains iron(III) and phosphate binding sites. The position of the phosphate group is approximately 4 Å away from the phosphate group in ThMP; however, both phosphates hydrogen bond to residues located in α6. This is consistent with the suggestion that the PBPs evolved from a common ancestor that was an anion-binding protein (35, 43).
The FeBP protein was crystallized in the closed form, and an overlay of the two proteins suggests that TbpA is also in the closed form. FeBP domains 1 and 2 are approximately 8.1 Å apart from Ser35 Cα to Gly140 Cα, but in TbpA they are 4.6 Å apart for the corresponding residues. A structural alignment for the group II PBPs, including TbpA, FeBP, putrescine-binding protein (PotD) (PDB code 1POY) (44), and maltose-binding protein (MBP) (PDB code 3MBP) (36), using the program VAST did not locate any conserved residues for a hinge region (45, 46). A superposition of MBP in the open conformation (PDB code 1JW4) (40) revealed that residues 121–128, 241–245, and 287–292 in TbpA are located in the hinge region.
To determine if the structural similarity search was biased by the conformational state of the hinge region, both domains 1 and 2 of TbpA were submitted separately to DALI. Searching with individual domains revealed that the hypothetical sugar PBP from Pyrococcus horikoshii (PDB code 1R25) had a higher Z score than FeBP for each of the domains, although it had only a 15% sequence identity to both domains 1 and 2 of TbpA. In contrast FeBP has a 27% sequence identity to domain 1 and 15% identity to domain 2. While both proteins are in the closed conformation, the crossover regions and β-strands are longer in the P. horikoshii structure than those in TbpA. The topology of the P. horikoshii protein contains two short α-helical insertions in domain 1. Domain 2 is less similar to TbpA and contains two α-helical insertions and the deletion of β6.
Comparison of the Thiamin-Binding Sites in TbpA and YkoF
The crystal structure of an ABC-like protein (YkoF) with thiamin in the ligand binding site (PDB code 1SBR) was previously reported (47). The structure of YkoF is a homodimer, with each monomer containing a high- and a low-affinity binding site. YkoF is not a member of the PBP superfamily but instead has structural similarity to the ACT/RAM domain family (47). In the high-affinity site, the N1′ of the pyrimidine ring hydrogen bonds to the hydroxyl group of Ser154, whereas the N3′ and the amino group on the pyrimidine ring hydrogen bond to the main chain of Leu121. In the low-affinity site, the N1′ of the pyrimidine ring hydrogen bonds to the hydroxyl group of Thr47, whereas the N3′ and the amino group hydrogen bond to the main chain of Leu17. A water molecule also hydrogen bonds to the amino group of the pyrimidine ring.
In TbpA, the N1′ of ThMP is also hydrogen bonded to the hydroxyl group of a serine residue, as is the case for the YkoF high-affinity site; however, the other interactions to the pyrimidine moiety consist of water-mediated hydrogen bonds. The structure of TbpA also shows several hydrophobic interactions of aromatic side chains with the thiazole ring as well as several hydrogen bonds to the phosphate, whereas the YkoF structure contains no residues to anchor the thiazole portion of thiamin. The absence of protein interactions to the thiazole moiety suggests that YkoF has affinity primarily for the pyrimidine moiety, and this in turn suggests that this protein may be involved in a pyrimidine salvage pathway in vivo. The YkoF Kd values also indicate that thiamin may not be the preferred ligand. The Kd for the high-affinity site is 10 μM; for the low-affinity site, 250 μM. These values are much higher than those for TbpA, which has a Kd of 3.8 nM for thiamin.
The conformation of thiamin defined by the dihedral angles φT (C(5)–C(7)–N(3)–C(2)) and φP (N(3)–C(7)–C(5)–C(4)) (48) is different in YkoF and TbpA. In the YkoF structure, thiamin is bound in a “V”-like conformation (49) with dihedral angles φT = −110°, φP = 75° for the high-affinity site and φT = −98°, φP = 50° for the low-affinity site. In contrast, ThMP is bound to TbpA in the low-energy “F” conformation with dihedral angles of φT = 1°, φP = −82°.
Comparison with Thiamin-Binding Enzymes
Most ThDP-dependent enzymes contain active sites with a hydrophobic environment near the pyrimidine ring resulting in stacking interactions and a “V” conformation for the two heterocyclic moieties of thiamin. The N1′ position is usually hydrogen bonded to a glutamate residue that is involved in the activation of the cofactor. The “V” conformation is also seen for the product ThMP in the crystal structure of ThMP synthase (PDB code 2TPS) (50); however, the C4 amino group and the methyl group on the thiazole ring are in the cis conformation. There are also no interactions with the N1′ of the ThMP.
Thiamin pyrophosphokinase (TPK) (PDB code 1IG3) binds thiamin in the same conformation as observed in TbpA (51). Like TbpA, TPK contains a hydrogen bond between the Ser236 hydroxyl and N1′ of the pyrimidine ring; however, in TbpA several aromatic residues interact with the pyrimidine and thiazole ring, whereas TPK only has a stacking interaction between Trp222 and the pyrimidine ring. Also the phosphate binding site in TPK is solvent exposed, with the ThOH hydroxyl group making no hydrogen bonds.
Most proteins that require ThDP as a cofactor have a GD/EGX26/27N sequence (52, 53). The second Gly residue is usually involved in the binding of the phosphate. The D/E residue and the conserved Asn provide a Mg2+ binding site, which in turn interacts with the diphosphate group of ThDP. A detailed description of these interactions was described by Nikkola et al. for the high-resolution structure of transketolase (54). Although TbpA does not use this binding motif, the phosphate group in ThMP also interacts with Asp59 and Gly60 but without the Mg2+ that is utilized by the ThDP-dependent enzymes.
ThOH and ThDP Binding to TbpA
Virtually all phosphorylated metabolites are taken up by bacteria in the dephosphorylated form. It is therefore quite surprising that the thiamin uptake system transports ThOH, ThMP, and ThDP (8).
TbpA was cocrystallized with 2 mM ThMP, and the structure contained ThMP bound in all four monomers even though the crystals were grown in 2 M (NH4)2SO4, which might compete with it for the TbpA phosphate binding site. The experimentally determined structure shows both hydrophobic interactions and hydrogen-bonding interactions to the pyrimidine and thiazole rings, whereas the phosphate binding site contains several hydrogen bonds to the protein.
Attempts to cocrystallize TbpA with either ThOH or ThDP were unsuccessful. Therefore, the computer program MacroModel (23) was used to model ThOH and ThDP in the binding site. The modeling program was also used to model ThMP as a control, and the modeled structure overlaid very well onto the structure of TbpA. Modeling studies showed that TbpA most likely accommodates the larger ThDP molecule by adopting a different rotamer for Asp59. When ThMP is bound, Asp59 closes off one end of the binding site, but when ThDP is bound, the Asp59 side chain points toward the solvent, providing space for the β-phosphate of ThDP (Figure 6B). The β-phosphate also displaces several water molecules and forms hydrogen bonds to the side chains of Ser29 and Asp28. In both cases the thiazole and pyrimidine rings bind similarly and are surrounded by mostly aromatic residues.
Figure 6.

Comparisons of the ThOH and ThDP models generated by MacroModel to the TbpA structure with ThMP bound. (A) The computer model of ThOH bound to TbpA, superimposed onto the experimentally determined ThMP-bound structure. ThOH is shown as ball-and-stick, and the side chains are shown as sticks colored by atom, with green for carbon, red for oxygen, blue for nitrogen, and yellow for sulfur. (B) The computer model of ThDP bound to TbpA, superimposed onto the experimentally determined ThMP-bound structure. Hydrogen bonds with the β-phosphate are shown. ThDP is shown as ball-and-stick, and the side chains are shown as sticks colored by atom, with green for carbon, red for oxygen, blue for nitrogen, yellow for sulfur, and orange for phosphorus. In both panels, ThMP is shown as ball-and-stick with gray for carbon, red for oxygen, blue for nitrogen, yellow for sulfur, and orange for phosphorus.
In contrast to ThDP, modeling studies showed that ThOH is bound in a different conformation than that of ThMP (Figure 6A). The largest difference occurs in the conformation of the pyrimidine and thiazole rings. In the ThOH computer model, the thiamin is bound in an altered conformation with the dihedral angles of φT = −65°, φP = 150°, whereas in the crystal structure the ThMP dihedral angles are φT = 1°, φP = −82°. Ser218 hydrogen bonds to N1′ in the ThMP crystal structure; however, in the ThOH model, the N1′ position is ~4.6 Å away from the Ser218. In the ThOH model residues Trp197 and Tyr27 provide π-stacking interactions to the pyrimidine and thiazole moieties, respectively. The pyrimidine ring is ~3.3 Å away from Trp197, and the thiazole ring is ~3.6 Å away from Tyr27. The formation of favorable π-stacking interactions with the pyrimidine and thiazole ring and the absence of the phosphate interactions most likely allows ThOH to attain an alternate conformation compared to the ThMP in the crystal structure.
The Kd values for ThOH, ThMP, and ThDP binding to TbpA are 3.8, 2.3, and 7.4 nM, respectively. On the basis of the observed interactions between ThMP and the protein, it is surprising that there is not a larger difference in Kd between ThOH and ThMP. Because the phosphate group of either ThMP or ThDP makes a significant contribution to the binding energy, it is likely that the loss of these interactions for ThOH is partly compensated by the formation of more extensive π-stacking interactions within the binding site.
Comparison to Thiaminase-I
Although most of the top hits in the DALI search were PBPs, the thiamin cleaving enzyme thiaminase-I (PDB code 4THI) (10) appeared with a Z score of 13.7. Submitting the domains separately results in a Z score of 17.2 and an rmsd of 3.9 Å for domain 1 and a Z score of 7.0 and an rmsd of 3.3 Å for domain 2 indicating that the hinge is in a different state and that domain 1 is more similar to TbpA than domain 2. Sequence alignments for TbpA and thiaminase-I showed that the sequence similarity is 17% for domain 1 and 9% for domain 2. Thiaminase-I was crystallized in the presence of the mechanism-based inhibitor 6-chloro-2,5-dimethylpyrimidin-4-amine (Pyd) (10) and appears to be in the closed conformation. The binding of the inhibitor results in a covalent bond between the thiol of Cys113 and the C6′ position of the pyrimidine ring. The thiazole ring is absent in the inhibitor, and the geometry at C6′ of the pyrimidine is trigonal, thus distorting the ligand binding from that expected for the enzyme substrate complex and making it difficult to compare the binding geometry of the two proteins (Figure 7A–C).
Figure 7.

Structural comparisons to thiaminase-I. (A) Stereoview of superposition of TbpA, shown in cyan, to thiaminase-I, shown in pink. (B) Stereoview of TbpA binding site. ThMP is shown as ball-and-stick colored by atom with green for carbon, blue for nitrogen, yellow for sulfur, red for oxygen, and magenta for phosphorus. Binding site side chains are shown in ball-and-stick with cyan for carbon, red for oxygen, and blue for nitrogen. Water molecules are shown as red spheres. (C) Stereoview of the thiaminase-1 binding site. The inhibitor PYD is covalently bound to Cys113 and is shown as ball-and-stick colored by atom with green for carbon, blue for nitrogen, and orange for sulfur. The binding site side chains are shown in ball-and-stick with pink for carbon and red for oxygen.
Therefore, a model of the thiaminase-I/ThOH complex was generated in which the substrate was positioned by super-imposing TbpA onto thiaminase-I. Both the ThMP complex crystal structure and the ThOH model were used to generate thiaminase-I/ThOH models. For the model derived from the TbpA/ThMP complex, the phosphate was removed from the ThMP. After initial positioning of the ThOH molecule, the two thiaminase-I/ThOH models were energy minimized. In the first thiaminase-I/ThOH model, which was based on the ThMP complex, Cys113 is 3.7 Å away from C6′, the site of covalent bond formation in the intermediate. The model also contains stacking interactions to Tyr239 and Tyr10. The second thiaminase-I/ThOH model, based on the TbpA/ThOH complex, also positions Cys113 3.7 Å away from the C6′ position. Hydrogen bonds are observed from the Ser230 hydroxyl group to N1′ on the pyrimidine ring and the thiamin hydroxyl group and Tyr50 hydroxyl group. The thiazole ring is stabilized by stacking interactions to Tyr239 and Tyr16. The energy minimization procedure for the thiaminase-I/ThOH model also resulted in a rotation of the thiamin molecule by about 16° compared to its position in TbpA.
Although TbpA and thiaminase-I have different functions, a tyrosine residue in the binding site is conserved for the two proteins. In TbpA, Tyr27 is involved in hydrophobic interactions with the thiazole ring. The corresponding residue in thiaminase-I is Tyr16 and may be involved in a stacking interaction with the thiazole ring. Although the overall sequence identity is only 15%, the overall folds and locations of the binding clefts are very similar. TbpA and thiaminase-I both have the group II PBP fold. Thiaminase-I catalyzes the cleavage of ThOH, ThMP, and ThDP with similar rates and TbpA binds ThOH, ThMP, and ThDP with roughly the same affinities. The structural similarities between TbpA and thiaminase-I suggest that the two proteins evolved from a common ancestor. The biological function of thiaminase I is unknown and has been a long-standing unsolved problem in thiamin physiology. Our results suggest that the evolution of the thiaminase-I activity might be linked to a salvage pathway that recycles degraded forms of ThOH, ThMP, and ThDP. This is further supported by the clustering of the thiaminase I gene with the HMP kinase gene in Clostridium botulinum and in Burkholderia pseudomallei. An analogous salvage pathway was recently described in which thiaminase-II is used to regenerate HMP from base-degraded thiamin (55).
Acknowledgments
We acknowledge the F2 beamline at the Cornell High Energy Synchrotron Source and thank Leslie Kinsland and Dr. Yang Zhang for their help in preparation of this manuscript. The Cornell University LSCLC Protein Production Facility constructed the clones and provided the stopped flow system used in these experiments.
Footnotes
This work was supported by NIH Grants DK 44083 (T.P.B.) and DK 67081 (S.E.E.). This work is based upon research conducted at the Northeastern Collaborative Access Team beamline 24-ID-C of the Advanced Photon Source, supported by award RR-15301 from the National Center for Research Resources at the National Institute of Health. Use of the Advanced Photon Source is supported by the U.S. Department of Energy, Office of Basic Energy Sciences, under Contract No. DE-AC02-06CH11357.
The coordinates of the thiamin-binding protein have been deposited in the Protein Data Bank under accession number 2QRY.
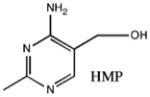
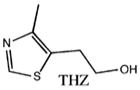
Abbreviations: TbpA, thiamin-binding protein; ABC, ATP-binding cassette; PBP, periplasmic-binding protein; ThOH, thiamin; ThMP, thiamin monophosphate; ThDP, thiamin pyrophosphate; SAD, single-wavelength anomalous diffraction; APS, Advanced Photon Source; CHESS, Cornell High Energy Synchrotron Source; SeMet, selenomethionine; DTT, dithiothreitol; TCEP, tris(2-carboxyethyl)phosphine hydrochloride; Kd, dissociation constant; NCS, noncrystallographic symmetry; FeBP, iron-binding protein; PotD, spermidine/putrescine-binding protein; MBP, maltose-binding protein; TPK, thiamin pyrophosphokinase; HMP, 2-methyl-4-amino-5-hydroxymethylpyrimidine; Pyd, 6-chloro-2,5-dimethylpyrimidin-4-amine; THZ, 4-(β-hydroxyethyl)-5-methylthiazole.
References
- 1.Harper C. Thiamine (vitamin B1) deficiency and associated brain damage is still common throughout the world and prevention is simple and safe! Eur J Neurol. 2006;13:1078–1082. doi: 10.1111/j.1468-1331.2006.01530.x. [DOI] [PubMed] [Google Scholar]
- 2.Begley TP, Downs DM, Ealick SE, McLafferty FW, Van Loon AP, Taylor S, Campobasso N, Chiu HJ, Kinsland C, Reddick JJ, Xi J. Thiamin biosynthesis in prokaryotes. Arch Microbiol. 1999;171:293–300. doi: 10.1007/s002030050713. [DOI] [PubMed] [Google Scholar]
- 3.Godoi PH, Galhardo RS, Luche DD, Van Sluys MA, Menck CF, Oliva G. Structure of the thiazole biosynthetic enzyme THI1 from Arabidopsis thaliana. J Biol Chem. 2006;281:30957–30966. doi: 10.1074/jbc.M604469200. [DOI] [PubMed] [Google Scholar]
- 4.Chatterjee A, Jurgenson CT, Schroeder FC, Ealick SE, Begley TP. Thiamin biosynthesis in eukaryotes: characterization of the enzyme-bound product of thiazole synthase from Saccharomyces cerevisiae and its implications in thiazole biosynthesis. J Am Chem Soc. 2006;128:7158–7159. doi: 10.1021/ja061413o. [DOI] [PMC free article] [PubMed] [Google Scholar]
- 5.Jurgenson CT, Chatterjee A, Begley TP, Ealick SE. Structural insights into the function of the thiamin biosynthetic enzyme Thi4 from Saccharomyces cerevisiae. Biochemistry. 2006;45:11061–11070. doi: 10.1021/bi061025z. [DOI] [PubMed] [Google Scholar]
- 6.Jones PM, George AM. The ABC transporter structure and mechanism: perspectives on recent research. Cell Mol Life Sci. 2004;61:682–699. doi: 10.1007/s00018-003-3336-9. [DOI] [PMC free article] [PubMed] [Google Scholar]
- 7.Davidson AL, Chen J. ATP-binding cassette transporters in bacteria. Annu Rev Biochem. 2004;73:241–268. doi: 10.1146/annurev.biochem.73.011303.073626. [DOI] [PubMed] [Google Scholar]
- 8.Hollenbach AD, Dickson KA, Washabaugh MW. Overexpression, purification, and characterization of the periplasmic space thiamin-binding protein of the thiamin traffic ATPase in Escherichia coli. Protein Expression Purif. 2002;25:508–518. doi: 10.1016/s1046-5928(02)00031-1. [DOI] [PubMed] [Google Scholar]
- 9.Webb E, Claas K, Downs D. thiBPQ encodes an ABC transporter required for transport of thiamine and thiamine pyrophosphate in Salmonella typhimurium. J Biol Chem. 1998;273:8946–8950. doi: 10.1074/jbc.273.15.8946. [DOI] [PubMed] [Google Scholar]
- 10.Campobasso N, Costello CA, Kinsland C, Begley TP, Ealick SE. Crystal structure of thiaminase-I from Bacillus thiaminolyticus at 2.0 Å resolution. Biochemistry. 1998;37:15981–15989. doi: 10.1021/bi981673l. [DOI] [PubMed] [Google Scholar]
- 11.Bradford MM. A rapid and sensitive method for the quantitation of microgram quantities of protein utilizing the principle of protein–dye binding. Anal Biochem. 1976;72:248–254. doi: 10.1006/abio.1976.9999. [DOI] [PubMed] [Google Scholar]
- 12.Otwinowski Z, Minor W. Processing of X-ray diffraction data collected in oscillation mode. Methods Enzymol. 1997;276:307–326. doi: 10.1016/S0076-6879(97)76066-X. [DOI] [PubMed] [Google Scholar]
- 13.Matthews BW. Solvent content of protein crystals. J Mol Biol. 1968;33:491–497. doi: 10.1016/0022-2836(68)90205-2. [DOI] [PubMed] [Google Scholar]
- 14.Schneider TR, Sheldrick GM. Substructure solution with SHELXD. Acta Crystallogr Sect D. 2002;58:1772–1779. doi: 10.1107/s0907444902011678. [DOI] [PubMed] [Google Scholar]
- 15.Collaborative Computational Project-Number 4. The CCP-4 suite: programs for protein crystallography. Acta Crystallogr Sect D. 1994;50:760–763. doi: 10.1107/S0907444994003112. [DOI] [PubMed] [Google Scholar]
- 16.Terwilliger TC, Berendzen J. Automated MAD and MIR structure solution. Acta Crystallogr Sect D. 1999;55:849–861. doi: 10.1107/S0907444999000839. [DOI] [PMC free article] [PubMed] [Google Scholar]
- 17.Emsley P, Cowtan K. Coot: model-building tools for molecular graphics. Acta Crystallogr Sect D. 2004;60:2126–2132. doi: 10.1107/S0907444904019158. [DOI] [PubMed] [Google Scholar]
- 18.Murshudov GN, Vagin AA, Lebedev A, Wilson KS, Dodson EJ. Efficient anisotropic refinement of macro-molecular structures using FFT. Acta Crystallogr Sect D. 1999;55:247–255. doi: 10.1107/S090744499801405X. [DOI] [PubMed] [Google Scholar]
- 19.Brünger AT, Adams PD, Clore GM, DeLano WL, Gros P, Grosse-Kunstleve RW, Jiang JS, Kuszewski J, Nilges M, Pannu NS, Read RJ, Rice LM, Simonson T, Warren GL. Crystallography & NMR system: A new software suite for macromolecular structure determination. Acta Crystallogr Sect D. 1998;54:905–921. doi: 10.1107/s0907444998003254. [DOI] [PubMed] [Google Scholar]
- 20.Kleygert GJ, Jones TA. xdlMAPMAN and xdlDATAMAN-programs for reformatting, analysis, and manipulation of biomacromolecular electron-density maps and reflection datasets. Acta Crystallogr Sect D. 1996;52:826–828. doi: 10.1107/S0907444995014983. [DOI] [PubMed] [Google Scholar]
- 21.Kleywegt GJ, Jones TA. Template convolution to enhance or detect structural features in macromolecular electron-density maps. Acta Crystallogr Sect D. 1997;53:179–185. doi: 10.1107/S0907444996012279. [DOI] [PubMed] [Google Scholar]
- 22.Johnson KA. Introduction to kinetic analysis of enzyme systems. In: Johnson KA, editor. Kinetic Analysis of Macromolecules. Oxford University Press; New York: 2003. pp. 1–17. [Google Scholar]
- 23.Mohamadi F, Richards NGJ, Guida WC, Liskamp R, Lipton M, Caufield C, Chang G, Hendrickson T, Still WC. MacroModels an integrated software system for modeling organic and bioorganic molecules using molecular mechanics. J Comput Chem. 1990;11:460–467. [Google Scholar]
- 24.Weiner SJ, Kollman PA, Case DA, Singh UC, Ghio C, Alagona G, Profeta S, Jr, Weiner P. A new force field for molecular mechanical simulation of nucleic acids and proteins. J Am Chem Soc. 1984;106:765–784. [Google Scholar]
- 25.Weiner SJ, Kollman PA, Nguyen DT, Case DA. An all atom force field for simulations of proteins and nucleic acids. J Comput Chem. 1986;7:230–252. doi: 10.1002/jcc.540070216. [DOI] [PubMed] [Google Scholar]
- 26.Ponder JW, Richards FM. An efficient Newton-like method for molecular mechanics energy minimization of large molecules. J Comput Chem. 1987;8:1016–1024. [Google Scholar]
- 27.Esnouf R. An extensively modified version of Molscript which includes greatly enhanced colouring capabilities. J Mol Graphics. 1997;15:132–134. doi: 10.1016/S1093-3263(97)00021-1. [DOI] [PubMed] [Google Scholar]
- 28.Esnouf RM. Further additions to MolScript version 1.4, including reading and contouring of electron-density maps. Acta Crystallogr Sect D. 1999;55:938–940. doi: 10.1107/s0907444998017363. [DOI] [PubMed] [Google Scholar]
- 29.Merritt EA, Bacon DJ. Raster3D: Photorealistic Molecular Graphics. Methods Enzymol. 1997;277:505–524. doi: 10.1016/s0076-6879(97)77028-9. [DOI] [PubMed] [Google Scholar]
- 30.DeLano WL. The PyMOL Molecular Graphics System. DeLano Scientific; San Carlos, CA: 2002. [Google Scholar]
- 31.Nossal NG, Heppel LA. The release of enzymes by osmotic shock from Escherichia coli in exponential phase. J Biol Chem. 1966;241:3055–3062. [PubMed] [Google Scholar]
- 32.Tam R, Saier MH., Jr Structural, functional, and evolutionary relationships among extracellular solute-binding receptors of bacteria. Microbiol Rev. 1993;57:320–346. doi: 10.1128/mr.57.2.320-346.1993. [DOI] [PMC free article] [PubMed] [Google Scholar]
- 33.Quiocho FA, Ledvina PS. Atomic structure and specificity of bacterial periplasmic receptors for active transport and chemotaxis: variation of common themes. Mol Microbiol. 1996;20:17–25. doi: 10.1111/j.1365-2958.1996.tb02484.x. [DOI] [PubMed] [Google Scholar]
- 34.Felder CB, Graul RC, Lee AY, Merkle HP, Sadee W. The Venus flytrap of periplasmic binding proteins: an ancient protein module present in multiple drug receptors. AAPS PharmSci. 1999;1:E2. doi: 10.1208/ps010202. [DOI] [PMC free article] [PubMed] [Google Scholar]
- 35.Fukami-Kobayashi K, Tateno Y, Nishikawa K. Domain dislocation: a change of core structure in periplasmic binding proteins in their evolutionary history. J Mol Biol. 1999;286:279–290. doi: 10.1006/jmbi.1998.2454. [DOI] [PubMed] [Google Scholar]
- 36.Spurlino JC, Lu GY, Quiocho FA. The 2.3 Å resolution structure of the maltose- or maltodextrin-binding protein, a primary receptor of bacterial active transport and chemotaxis. J Biol Chem. 1991;266:5202–5219. doi: 10.2210/pdb1mbp/pdb. [DOI] [PubMed] [Google Scholar]
- 37.Mao B, Pear MR, McCammon JA, Quiocho FA. Hinge-bending in L-arabinose-binding protein. The “Venus’sflytrap” model. J Biol Chem. 1982;257:1131–1133. [PubMed] [Google Scholar]
- 38.Sack JS, Saper MA, Quiocho FA. Periplasmic binding protein structure and function. Refined X-ray structures of the leucine/isoleucine/valine-binding protein and its complex with leucine. J Mol Biol. 1989;206:171–191. doi: 10.1016/0022-2836(89)90531-7. [DOI] [PubMed] [Google Scholar]
- 39.Acher FC, Bertrand HO. Amino acid recognition by Venus flytrap domains is encoded in an 8-residue motif. Biopolymers. 2005;80:357–366. doi: 10.1002/bip.20229. [DOI] [PubMed] [Google Scholar]
- 40.Duan X, Quiocho FA. Structural evidence for a dominant role of nonpolar interactions in the binding of a transport/chemosensory receptor to its highly polar ligands. Biochemistry. 2002;41:706–712. doi: 10.1021/bi015784n. [DOI] [PubMed] [Google Scholar]
- 41.Kandt C, Xu Z, Tieleman DP. Opening and closing motions in the periplasmic vitamin B12 binding protein BtuF. Biochemistry. 2006;45:13284–13292. doi: 10.1021/bi061280j. [DOI] [PubMed] [Google Scholar]
- 42.Holm L, Sander C. Protein structure comparison by alignment of distance matrices. J Mol Biol. 1993;233:123–138. doi: 10.1006/jmbi.1993.1489. [DOI] [PubMed] [Google Scholar]
- 43.Bruns CM, Nowalk AJ, Arvai AS, McTigue MA, Vaughan KG, Mietzner TA, McRee DE. Structure of Haemophilus influenzae Fe3+-binding protein reveals convergent evolution within a superfamily. Nat Struct Biol. 1997;4:919–924. doi: 10.1038/nsb1197-919. [DOI] [PubMed] [Google Scholar]
- 44.Sugiyama S, Vassylyev DG, Matsushima M, Kashiwagi K, Igarashi K, Morikawa K. Crystal structure of PotD, the primary receptor of the polyamine transport system in Escherichia coli. J Biol Chem. 1996;271:9519–9525. doi: 10.1074/jbc.271.16.9519. [DOI] [PubMed] [Google Scholar]
- 45.Madej T, Gibrat JF, Bryant SH. Threading a database of protein cores. Proteins. 1995;23:356–369. doi: 10.1002/prot.340230309. [DOI] [PubMed] [Google Scholar]
- 46.Gibrat JF, Madej T, Bryant SH. Surprising similarities in structure comparison. Curr Opin Struct Biol. 1996;6:377–385. doi: 10.1016/s0959-440x(96)80058-3. [DOI] [PubMed] [Google Scholar]
- 47.Devedjiev Y, Surendranath Y, Derewenda U, Gabrys A, Cooper DR, Zhang RG, Lezondra L, Joachimiak A, Derewenda ZS. The structure and ligand binding properties of the B. subtilis YkoF gene product, a member of a novel family of thiamin/HMP-binding proteins. J Mol Biol. 2004;343:395–406. doi: 10.1016/j.jmb.2004.08.037. [DOI] [PMC free article] [PubMed] [Google Scholar]
- 48.Pletcher J, Sax M, Blank G, Wood M. Stereochemistry of intermediates in thiamine catalysis. 2 Crystal structure of DL-2-(α-hydroxybenzyl)thiamine chloride hydrochloride trihydrate. J Am Chem Soc. 1977;99:1396–1403. doi: 10.1021/ja00447a019. [DOI] [PubMed] [Google Scholar]
- 49.Blank G, Rodrigues M, Pletcher J, Sax M. A study of the possible associations between cocarboxylase and magnesium ion as seen in the crystal structure of thiamin.Cl.HCl.1/2[Mg-(H2O)6]Cl.2H2O. Acta Crystallogr, Sect. 1976;B32:2970–2975. [Google Scholar]
- 50.Chiu HJ, Reddick JJ, Begley TP, Ealick SE. Crystal structure of thiamin phosphate synthase from Bacillus subtilis at 1.25 Å resolution. Biochemistry. 1999;38:6460–6470. doi: 10.1021/bi982903z. [DOI] [PubMed] [Google Scholar]
- 51.Timm DE, Liu J, Baker LJ, Harris RA. Crystal structure of thiamin pyrophosphokinase. J Mol Biol. 2001;310:195–204. doi: 10.1006/jmbi.2001.4727. [DOI] [PubMed] [Google Scholar]
- 52.Hawkins CF, Borges A, Perham RN. A common structural motif in thiamin pyrophosphate-binding enzymes. FEBS Lett. 1989;255:77–82. doi: 10.1016/0014-5793(89)81064-6. [DOI] [PubMed] [Google Scholar]
- 53.Muller YA, Lindqvist Y, Furey W, Schulz GE, Jordan F, Schneider G. A thiamin diphosphate binding fold revealed by comparison of the crystal structures of transketolase, pyruvate oxidase and pyruvate decarboxylase. Structure. 1993;1:95–103. doi: 10.1016/0969-2126(93)90025-c. [DOI] [PubMed] [Google Scholar]
- 54.Nikkola M, Lindqvist Y, Schneider G. Refined structure of transketolase from Saccharomyces cerevisiae at 2.0 Å resolution. J Mol Biol. 1994;238:387–404. doi: 10.1006/jmbi.1994.1299. [DOI] [PubMed] [Google Scholar]
- 55.Jenkins AH, Schyns G, Potot S, Sun G, Begley TP. A new thiamin salvage pathway. Nat Chem Biol. 2007;3:492–497. doi: 10.1038/nchembio.2007.13. [DOI] [PubMed] [Google Scholar]