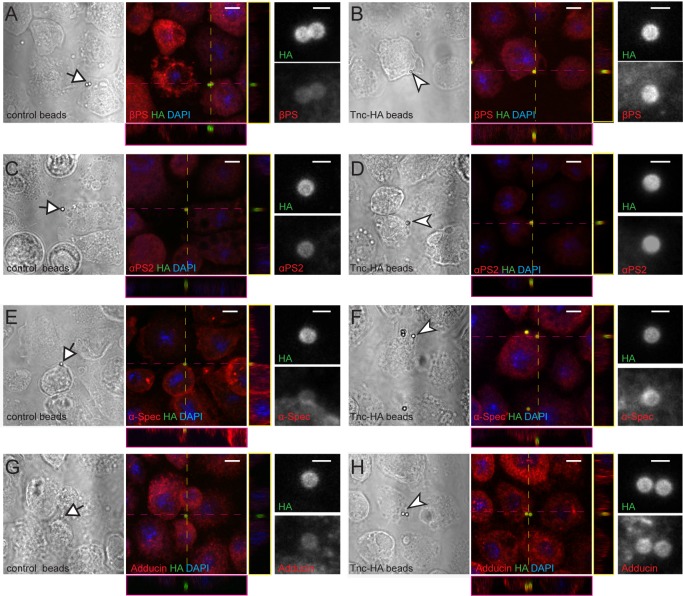
Figure 9. Tnc directs accumulation of integrin and spectrin at the cell membrane.
(A–H) Phase contrast and confocal microscopy images of S2R + cells presented with control (Tld-HA-) and Tnc-HA-coated beads and stained for βPS, αPS2, α-Spectrin or Adducin (in red), HA (green), and DAPI (blue). Arrows indicate control and arrowheads point to Tnc-HA-coated beads, enlarged in details on the right. The Tnc-HA-coupled beads, but not the control, induce strong accumulation of βPS at the bead-cell membrane interfaces, as indicated in the lateral projections, along the dotted lines. The accumulation of αPS2, α-Spectrin or Adducin is also significant in the proximity of Tnc-HA-coupled beads, which appear yellow, in contrast to control beads that remain green. Scale bars: 5 μm, 1 μm in details.
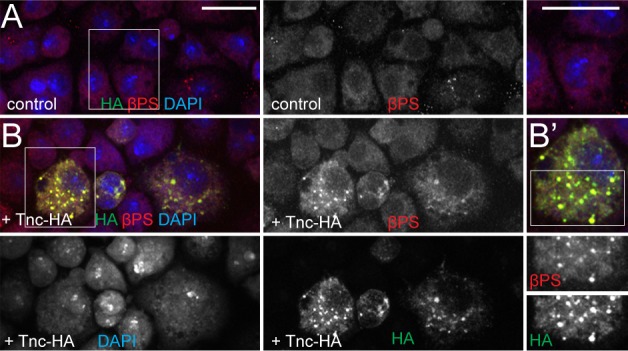
Figure 9—figure supplement 1. Cell expressing Tnc have elevated levels of βPS.


