Abstract
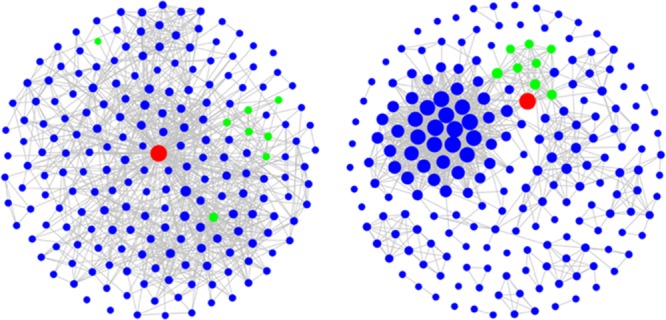
A variety of computational screening methods generate similarity-based compound rankings for hit identification. However, these rankings are difficult to interpret. It is essentially impossible to determine where novel active compounds might be found in database rankings. Thus, compound selection largely depends on intuition and guesswork. Herein, we show that molecular networks can substantially aid in the analysis of similarity-based compound rankings. A series of networks generated for rankings provides visual access to search results and adds chemical neighborhood and context information for reference compounds that are not available in rankings. Network structure is shown to serve as a diagnostic criterion for the likelihood to successfully select active compounds from rankings. In addition, comparison of different networks makes it possible to prioritize alternative similarity measures for search calculations and optimize the enrichment of active compounds in rankings.
1. Introduction
Many computational (virtual) compound screening approaches yield database rankings.1−4 These include most ligand-based screening methods that make use of the concept of molecular similarity.4 Database compounds are then ranked in the order of decreasing similarity to reference compounds used as search templates.3,4 Numerical similarity measures, such as the well-known Tanimoto coefficient (Tc),4,5 a gold standard in the field, are applied to generate such compound rankings. Not all ligand-based methods yield database rankings. Exceptions include pharmacophore approaches6 that detect local similarity between compounds and can be used as screens to search for a pharmacophore match.6 In addition, assessment of substructure-based similarity, i.e., detecting the presence or absence of a given substructure in test compounds, also yields binary (yes/no) similarity decisions.4 Similarity searching using molecular fingerprints (i.e., bit or feature set representations of molecular structure and properties),7 shape queries,8 or sets of numerical descriptors is a primary approach to ligand-based virtual screening that produces database rankings relative to reference compounds.9,10 Although this approach is well established, compound rankings have black box character. Simply put, it is essentially impossible to predict or determine where novel active compounds might occur in rankings. Of course, compounds that are structurally most similar to search templates will be top ranked and if these compounds are close structural analogues, there is a good chance that one or the other might also be active. However, similarity searching always yields a ranking even if only remotely similar database compounds are available. Moreover, one typically does not look for analogues in similarity searching, which are easily identified by a substructure search, but new active compounds exhibiting at least some degree of structural novelty. Importantly, on the basis of similarity-based ranking, selection of such compounds is impossible to rationalize.4 This is the case because activity itself is not used as a parameter in similarity searching (or other standard virtual screening approaches), but indirectly inferred from calculated structural/property similarity,4 following the fundamental similarity property principle (i.e., similar compounds should have similar properties).11 Accordingly, similarity searching relies on the premise that there will be an enrichment of active compounds among high database ranks. However, where such compounds might be found can essentially only be guessed. Therefore, in practical virtual screening applications, a variety of candidate compounds will typically be tested on the basis of a database ranking to identify one or the other new hit.
In light of this situation, any approach that aids in the interpretation of database rankings and compound selection is highly desirable. To these ends, we have, for the first time, attempted to analyze similarity search rankings in molecular network representations. We have reasoned that similarity-based compound networks, in which nodes represent molecules and edges pairwise similarity relationships,12 add chemical neighborhood13 and context information to similarity searching that is not contained in database rankings. If applied in concert with similarity searching, network analysis provides visual access to similarity search results. This makes it possible to analyze chemical neighborhoods of reference compounds and similarity relationships in detail and should help to better understand where active compounds might preferentially be found. In addition, network analysis of compound rankings can be applied to distinguish between alternative similarity measures and best enrich active compounds at higher rank positions. In the following, we present our approach combining similarity searching and network analysis and the results of a proof-of-concept investigation.
2. Materials and Methods
2.1. Similarity Searching
Similarity search calculations were carried out using the extended connectivity fingerprint with bond diameter 4 (ECFP4)14 and the Tanimoto coefficient (Tc).5 For each reference compound, a database ranking was generated and the 500 top-ranked compounds were selected and divided into four overlapping subsets comprising at rank 1–200, 101–300, 201–400, and 301–500, respectively. For each subset, similarity search hits (i.e., correctly detected active compounds) were determined. Similarity search performance was also evaluated using receiver operating characteristic (ROC) curves. Rankings for the top 500 compounds were then recalculated using the Tanimoto coefficient based on the maximum common substructure (TcMCS) similarity measure (described in detail in Section 2.3.1 below).
2.2. Test Compounds
As reference compounds for similarity searching, approved small molecule drugs with activity against single or multiple human targets and a molecular mass of more than 350 and less than 500 Da were selected from DrugBank version 5.15 Drugs were only selected if 30 or more compounds with activity against the same target and high-confidence activity data were available in ChEMBL version 23.16 These bioactive compounds served as hits for target-based similarity searching using individual drugs as reference molecules. On the basis of these criteria, 25 drugs were selected from DrugBank, for which sets of other bioactive compounds were available for each drug target. These 25 drugs were annotated with 44 unique targets, yielding a total of 66 drug-target pairs. For each drug-target pair, a set of similarity search hits was assembled, providing the basis for an individual search trial. In addition to potential hits, background database compounds were selected from ChEMBL, applying the same criteria for high-confidence activity data. Accordingly, compounds with direct interactions (type “D”) with human targets at the highest assay confidence level (confidence score 9) were identified, and only equilibrium constants (Ki values) or IC50 values were considered as potency measurements. Approximate measurements (e.g., “>” or “∼”) were discarded. On the basis of these criteria, a total of 244 625 ChEMBL compounds were selected as a screening database. All compounds were standardized with the aid of the OEChem toolkit.17
2.3. Chemical Space Networks
2.3.1. Network Design and Comparison
In chemical space networks (CSNs),12 originally introduced for charting biologically relevant chemical space,12 nodes represent compounds and edges similarity relationships. Two CSN variants were adopted for our analysis. In the first, similarity relationships were established on the basis of ECFP4 Tc values, representing a “Tc-CSN”.18 In the second, similarity relationships were determined by calculating Tc values based on the maximum common substructure (MCS) of pairs of compounds, yielding TcMCS values and resulting in the “TcMCS-CSN”.19 The TcMCS was calculated as follows:
where Ab and Bb are the number of bonds present in molecules A and B, respectively, and MCS(A, B)b is the number of bonds in the MCS of A and B.17 Using the number of bonds instead of heavy atoms leads to an increase in TcMCS values for MCSs consisting of rings over equally sized MCSs with rings and aliphatic substructures because rings contain more bonds than aliphatic substructures. By design, TcMCS is a hybrid similarity function combining numerical and substructure-based similarity, emphasizing substructure relationships, if present.
Tc-CSNs and TcMCS-CSNs were generated by adjusting the similarity threshold value to yield a constant network edge density of 0.05 (5%), thus enabling direct comparison of these CSN variants.16,17 Edge density provides the fraction of all possible edges that are present in a given network. Nodes were color coded by compound class (i.e., reference drugs, similarity search hit, and database compound with other activity) and scaled in size according to their degree (see below). An exception was made for reference drugs whose nodes were drawn in a constant size to highlight them in CSN representations.
CSNs were generated using in-house Python code and Gephi software.20 The layout of CSNs was calculated using the Fruchterman–Reingold algorithm21 that organizes similar objects in clusters and separates disjoint clusters in a force-directed manner for visualization.
2.3.2. Network Comparison
CSNs were compared using different statistical concepts and properties from network science:22
-
(i)
Node degree is defined as the number of edges connecting it to its neighbors.
-
(ii)
Clustering coefficient of a node is defined as the likelihood that two neighboring nodes are connected to each other. Thus, it is a measure of the degree of local connectivity in a network. The global clustering coefficient of a network is calculated as the mean of the clustering coefficients of all nodes.
-
(iii)
Modularity is a measure of the cluster structure of a network. High modularity is due to the presence of dense connections between nodes within the same cluster and sparse connections between nodes in different modules. Thus, modularity accounts for the cluster structure of a network.
All network properties were calculated using the iGraph R library.23
3. Results and Discussion
3.1. Similarity Searching
Similarity search calculations were conducted using 25 drugs as individual reference compounds. Of course, other bioactive compounds could have also been chosen as search templates. A subset of these drugs was annotated with multiple human targets giving rise to 66 drug-target combinations. For each combination, a compound data set was generated. Hence, a total of 66 similarity search trials were carried out using ECFP4 as a molecular representation. The screening database contained more than 240 000 ChEMBL compounds, originating from medicinal chemistry sources. Compounds with different bioactivities are typically more difficult to distinguish from each other in search calculations than a given activity class from randomly selected organic molecules, which motivated the assembly of our ChEMBL-based screening database. For each search trial, a Tc-based ranking was generated and the top 500 compounds were selected and divided into four overlapping subsets of 200 compounds each. Division into subsets provided a basis for continuous visualization of similarity search results using CSNs, as further discussed below. Figure 1 shows distributions of similarity search hits over different subsets for all 66 search trials. These distributions yielded median values of on average 8.5, 6.5, 5.0, and 5.0 hits in subsets 1–4, respectively. Thus, there was detectable enrichment of hits among the 500 top-ranked database compounds.
Figure 1.
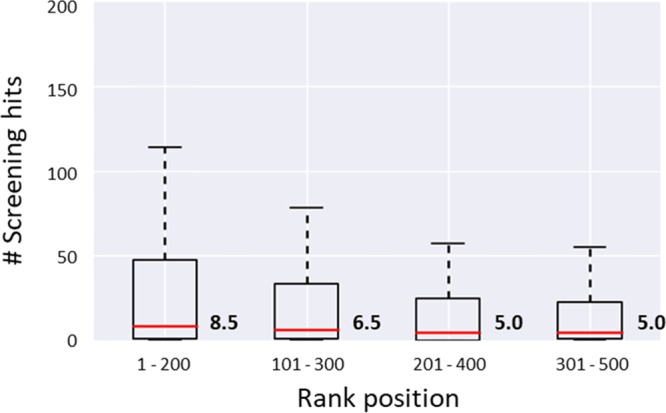
Similarity search hits in subsets of compound rankings. Boxplots show the distribution of hits in overlapping subsets representing the 500 top-ranked compounds across all 66 search trials. Boxplots report the smallest value (bottom), first quartile (lower boundary of the box), median value (thick red line), third quartile (upper boundary), and largest value (top).
3.2. Chemical Space Networks and Statistical Properties
For each subset resulting from a search trial, two CSN variants were constructed; first, a Tc-CSN, in which similarity relationships were accounted for using the same (Tc) similarity metric as in the search calculations; second, a TcMCS-CSN, in which similarity relationships between compounds from each subset were established using an alternative similarity measure. For this purpose, pairwise TcMCS similarity relationships between compounds comprising each subset were recalculated.
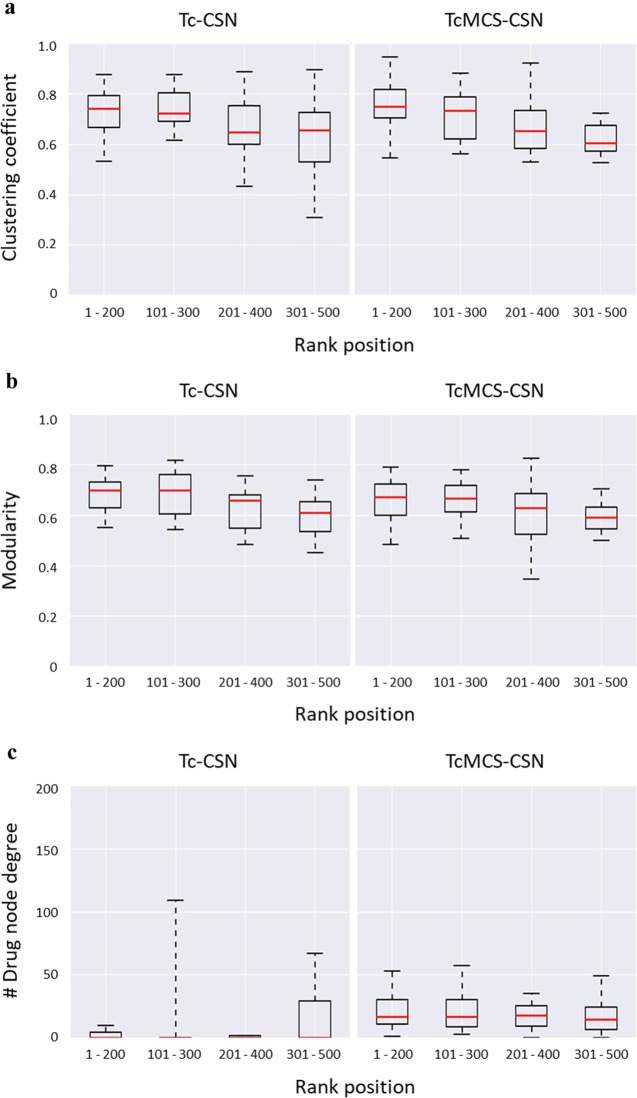
First, statistical properties of corresponding subset CSNs were determined. Figure 2a,b shows the distribution of clustering coefficients and modularity of subset CSNs from all search trials. Both clustering coefficients and modularity decreased for networks containing progressively lower ranked compounds. These findings indicated that database compounds were not only decreasingly similar to the reference drug, as captured by the ranking, but also decreasingly similar to each other. Overall, the distributions were comparable for both Tc-CSNs and TcMCS-CSNs. This was in contrast to distributions of the degrees of drug nodes reported in Figure 2c. In this case, node degrees in subset TcMCS-CSNs were consistently larger than in Tc-CSNs, indicating that application of the TcMCS similarity measure further increased the number of structural neighbors of reference drugs relative to the Tc metric. The latter observations suggested the presence of differences in the distribution of similarity relationships and local network structure, as further discussed in the following.
Figure 2.
Network properties. Boxplots report the distributions of different network properties of Tc-CSNs (left) and TcMCS-CSNs (right) generated for subsets of the 500 top-ranked compounds across all search trials. Network properties include the (a) clustering coefficient, (b) modularity, and (c) degree of drug nodes. The representation of boxplots is according to Figure 1.
3.3. Network Comparison
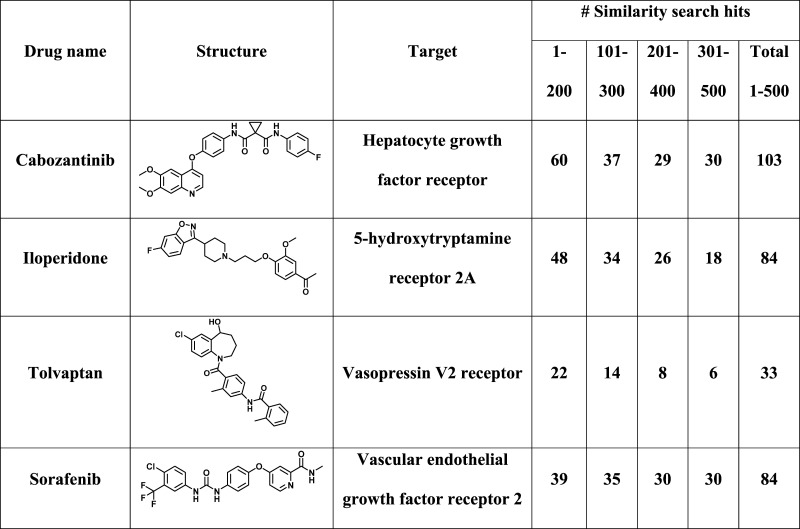
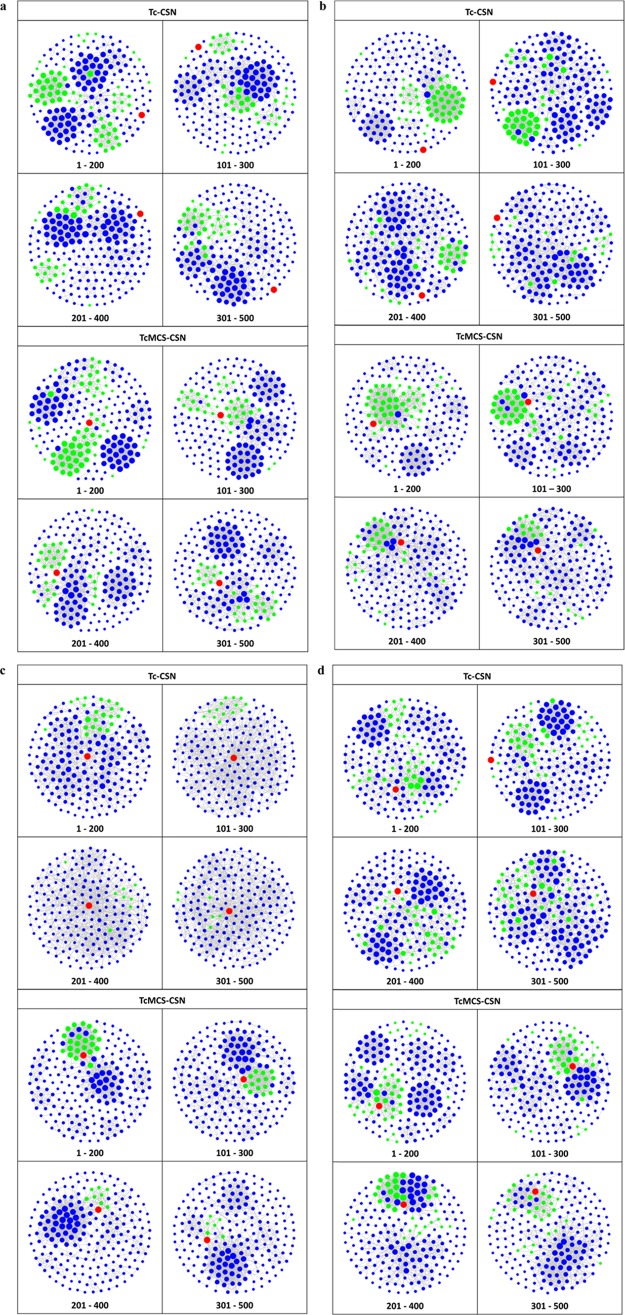
Going beyond statistical evaluation, network analysis of rankings produced with alternative similarity measures made it possible to further analyze neighborhoods of reference drugs and differentiate between these measures. Subset networks were compared graphically for four representative similarity search sets with different reference drugs, as summarized in Table 1. The four drugs were active against different receptors and the top-ranked 500 database compounds contained varying number of hits distributed over the ranking, ranging from 33 to 103. Figure 3a compares subsets Tc-CSNs and TcMCS-CSNs for similarity searching using cabozantinib as a reference drug, which acts on hepatocyte growth factor receptor. In this case, both CSN variants revealed a clear cluster structure. However, cabozantinib was not connected to other database compounds in Tc-CSNs, even in the network of the most similar subset (1–200). Thus, at the given level of network edge density, the reference drug had no structural neighbors in Tc-CSNs. By contrast, at constant edge density, cabozantinib was extensively connected to clusters of hits in TcMCS-CSNs, in particular, in the networks of the first three subsets. Similar observations were made for search calculations using iloperidone as a reference, shown in Figure 3b. In this case, Tc-CSNs had a more extensive cluster structure than TcMCS-CSNs. However, in the latter networks, limited but dense compound clustering was observed and found to mostly involve hits and the reference drug; a favorable scenario for compound selection and hit identification. By contrast, for reference drug tolvaptan in Figure 3c, subset Tc-CSNs displayed essentially no cluster structure but extensive formation of similarity relationships between the drug and compounds having different activities (i.e., false-positives in similarity searching). However, in TcMCS-CSNs, preferential clustering of hits and compounds with other activities was observed and the reference drug was connected to clusters of both hits and false-positives; a more difficult scenario for hit identification. In this case, TcMCS-CSNs of progressively lower ranked subsets clearly displayed decreasing numbers of hits and the networks indicated that hit identification was most likely for the first two subsets comprising 300 database compounds. Furthermore, Figure 3d visualizes search results for sorafenib. In this case, limited clustering was observed for both types of CSNs. However, clustering of hits was much more extensive in TcMCS-CSNs, also involving the reference drug, thus providing an improved basis for hit identification. Taken together, the results in Figure 3 illustrate the utility of network-based analysis and CSN comparisons for the evaluation of compound rankings.
Table 1. Exemplary Similarity Search Setsa.
The table summarizes the composition of four similarity search sets, for which subset CSNs are shown in Figure 3. In each case, the structure of the reference drug is shown, the drug target is given, and the number of similarity search hits (with activity against the drug target) per subset is reported.
Figure 3.
Exemplary CSNs. For four exemplary similarity search sets reported in Table 1, Tc-CSNs (top) and TcMCS-CSNs (bottom) of overlapping subsets representing compound rankings are compared at a constant edge density of 5%. Nodes are color coded as follows: red, reference drug; green, hits with activity against the drug target; blue, database compounds with different activities. Drug nodes have constant size whereas nodes of hits and other database compounds are scaled in size according to their degrees. CSNs are shown for similarity searching using (a) cabozantinib, (b) iloperidone, (c) tolvaptan, and (d) sorafenib as reference drugs.
3.4. Implications for Similarity Searching
Compound rankings do neither provide neighborhood information for reference compounds nor information about similarity relationships between database compounds, both of which are of critical importance for the outcome of similarity search calculations. For example, if similarity relationships are evenly distributed among reference compounds, hits, and false-positives, no preferential enrichment of hits over other database compounds can be expected in rankings. However, such information cannot be extracted from compound rankings. Rather, it is provided by networks revealing neighborhoods of reference compounds and distributions of similarity relationships among hits and other database compounds. These characteristics make CSN analysis and similarity searching complementary approaches. Importantly, CSNs do not need to be constructed for entire compound rankings or very large selection sets when the interpretability of network representations reaches its limits. Instead, CSNs can be generated for compound subsets across rankings to provide a progressive view of similarity relationships and chemical neighborhoods when similarity to reference compounds decreases.
The graphical analysis of CSNs showed that compound clustering involving reference compounds in networks is a necessary but insufficient condition for hit identification. It is not sufficient because clustering might also include false-positives. However, if no clustering is observed, similarity relationships are evenly distributed among hits and false-positives and the likelihood of identifying hits, which are much less frequent than other database compounds, is very low. Hence, in the absence of clustering in subset CSNs, successful hit identification cannot be expected. Thus, subset CSNs can be calculated as a first-path diagnostic to evaluate local clustering in compound rankings when potential hits are unknown.
The comparison of subset CSNs in Figure 3 generated using the related yet distinct Tc and TcMCS similarity metrics revealed that TcMCS calculations often led to more extensive local clustering of hits involving reference compounds. Such insights are not obtained by statistical network analysis but require visual inspection.
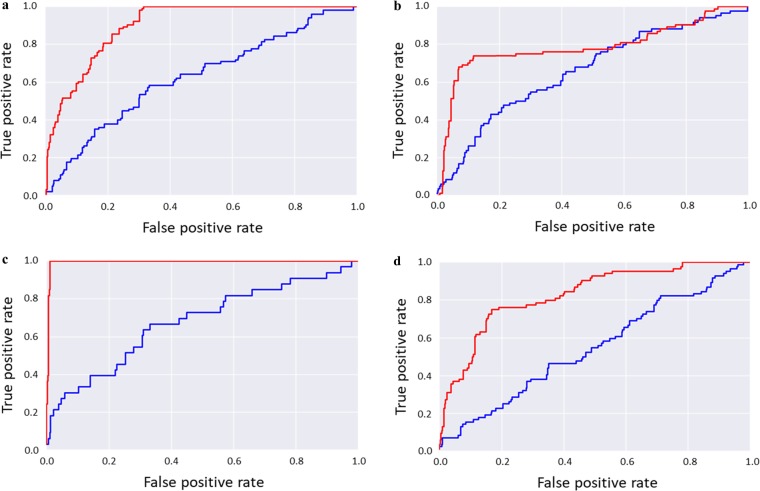
The prevalence of local clustering involving references and hits in TcMCS-CSNs suggested the testable hypothesis that the similarity search calculations reported here should be more successful when applying the TcMCS instead of the Tc metric. Therefore, we regenerated the ranking of the top 500 compounds for each of the Tc-based search calculation for the four drugs in Table 1 by calculating pairwise TcMCS similarity values for reference and database compounds. Figure 4 shows ROC curves comparing the Tc- and TcMCS-based rankings. In each case, the area under the curve was substantially larger for the TcMCS- than the Tc-based ranking. ROC curves for TcMCS-based rankings also revealed a consistent early enrichment of hits at higher rank positions. Taken together, these observations confirmed the hypothesis formulated above.
Figure 4.
Similarity search performance. Shown are receiver operating characteristic (ROC) curves for similarity search calculations using (a) cabozantinib, (b) iloperidone, (c) tolvaptan, and (d) sorafenib as reference drugs. ROC curves compare true-positive and false-positive rates over compound rankings. In each case, the ROC curves were calculated for the 500 top-ranked compounds on the basis of ECFP4 Tc values (database search, blue) and after reranking of the top 500 compounds on the basis of TcMCS calculations (red).
Comparison of subset CSNs might also help to prioritize alternative similarity measures for similarity searching, which has implications for practical applications. For example, considering the similarity functions used here, it would not be practical to screen a large compound database applying the TcMCS similarity measure because MCS calculations are computationally much more expensive than Tc-based fingerprint comparisons. However, in light of subset CSN comparisons, an initial database search using Tc calculations followed by reranking of top N compounds on the basis of TcMCS calculations would be considered a promising search strategy. Thus, it is certainly meaningful to explore alternative similarity measures aided by network analysis to optimize compound rankings.
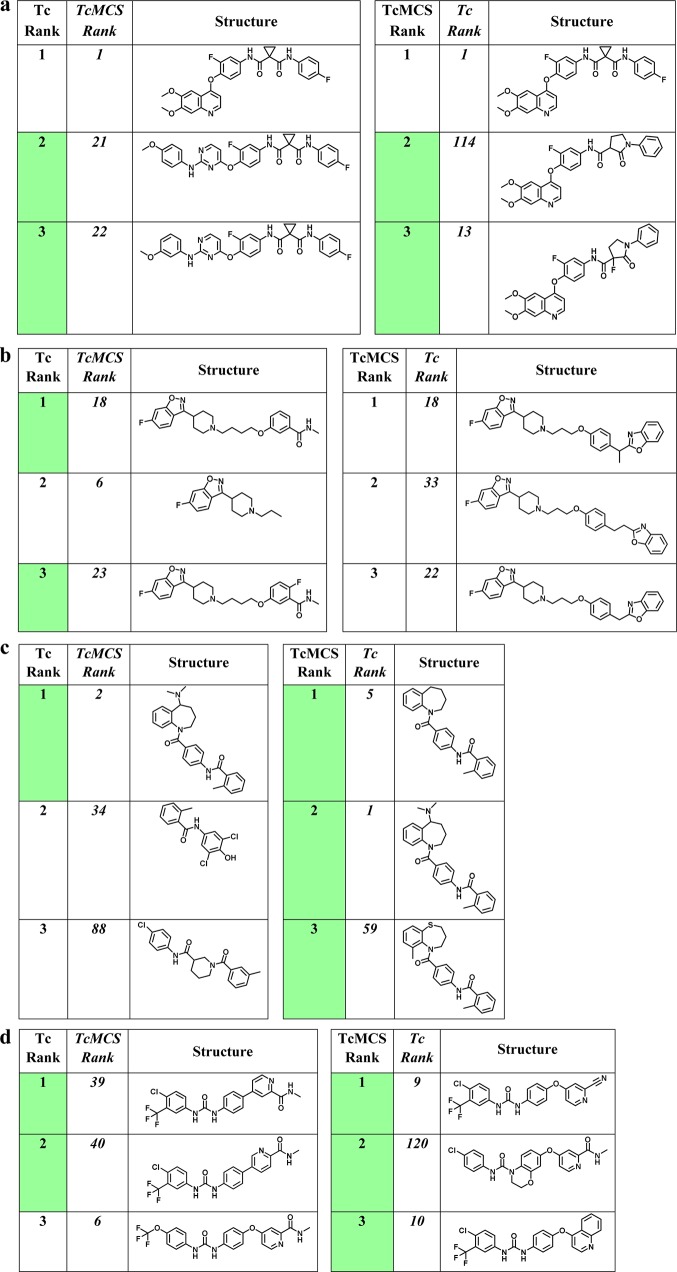
Figure 5 shows the top three compounds from corresponding Tc and TcMCS rankings and illustrates how differently calculated similarity relationships can substantially change relative rank positions of compounds, even for related similarity functions. Such effects contribute to the difficulty in deducing activity information from similarity-based rankings, which can be compensated for by complementary network analysis.
Figure 5.
Top-ranked compounds. Shown are the top three compounds for Tc- (left) and TcMCS-based (right) rankings according to Figure 4 using (a) cabozantinib, (b) iloperidone, (c) tolvaptan, and (d) sorafenib as reference drugs. Compounds whose ranks are highlighted in green are active against the drug target. For each of the top three compounds, the rank using the alternative similarity measure (Tc, right; TcMCS, left) is also reported (in italics).
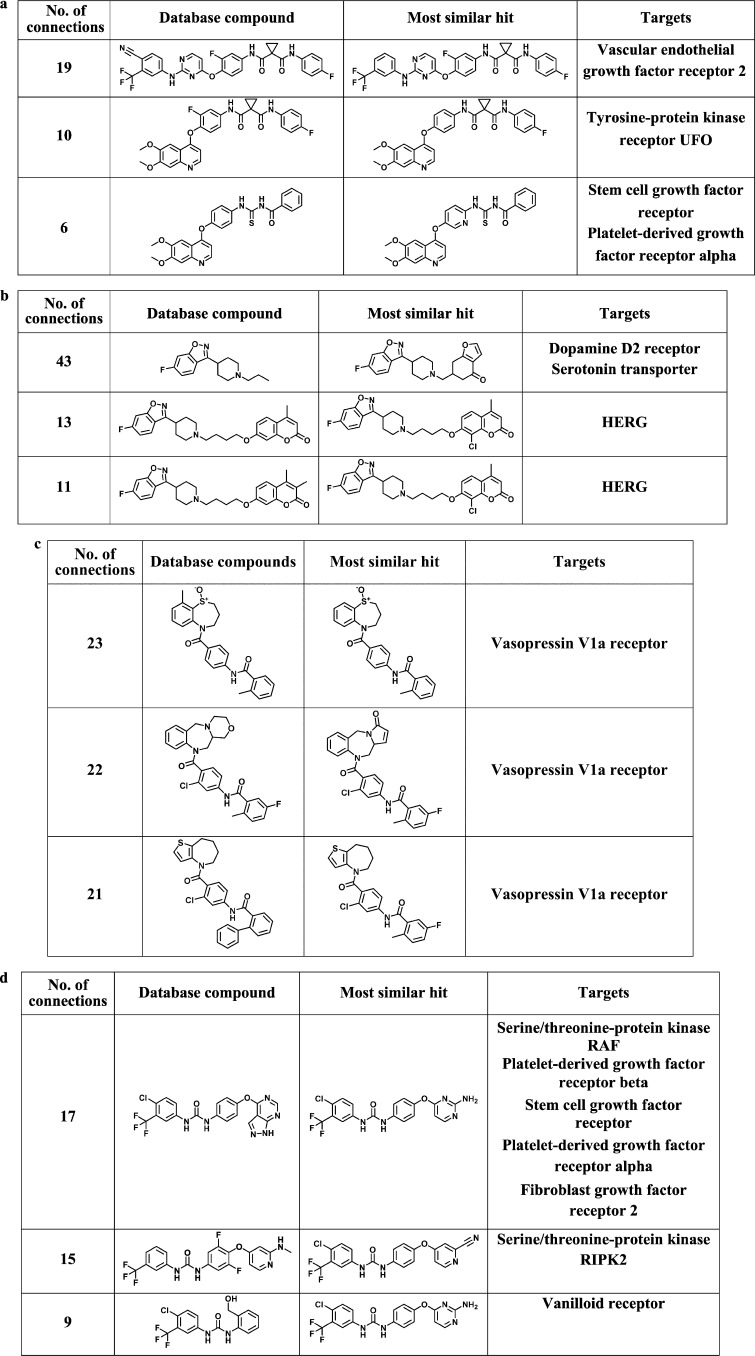
Figure 6 shows the top three database compounds from the TcMCS-based rankings that are most similar to hits having the same activity as the reference drug. These structurally closely related database compounds were frequently active against related targets or targets that have also been associated with reference drugs. Thus, close structural relationships correspond to similar compound activity profiles, as one would expect.
Figure 6.
Other bioactive compounds related to hits. Shown are the top three database compounds with other activities that are closely connected to correctly identified hits in TcMCS-CSNs. No. of connections report the total number of relationships formed with hits in the 1–200 subsets. In each case, the most similar hit is shown and ChEMBL targets are reported. Compounds are extracted from TcMCS-CSN of (a) cabozantinib, (b) iloperidone, (c) tolvaptan, and (d) sorafenib in Figure 3.
4. Concluding Remarks
Selecting novel active compounds from database rankings on the basis similarity values has been and continues to be a conundrum in ligand-based virtual screening. Given the compound class and molecular representation dependence of search calculations, it is essentially impossible to derive activity-relevant similarity threshold values for practical applications.24,25 Hence, similarity-based compound rankings have black box character and positions of active compounds can only be guessed, regardless of the virtual screening algorithms that are applied to generate rankings. Because a screening database is expected to contain only relatively few, if any, compounds having a desired biological activity, this problem is intensified by a needles-in-haystacks scenario; simply put, most compounds in rankings will be false-positives. Moreover, employing alternative similarity measures often significantly changes relative rank positions of active compounds, which further complicates hit selection. Accordingly, any attempts to aid in the interpretation of database rankings and compound selection are timely and of relevance to the field. However, these issues have thus far only been little investigated. Herein, we have made an attempt in this direction by combining similarity searching with molecular network analysis of compound rankings. Tables with compounds selected from rankings, their structures, and similarity values can be generated to focus subsequent investigation of potential hits on different subsets but network analysis adds another dimension to the analysis of rankings. Network analysis of similarity relationships provides visual access to similarity search results and, importantly, reveals similarity relationships between reference molecules and potential hits together with relationships between other database compounds. This adds chemical neighborhood and context information to similarity rankings and makes it possible to estimate the chances of success of a search trial. A series of CSNs can be conveniently generated from compound subsets across rankings, which limit network size, support interpretability, and provide a continuous view of existing similarity relationships, whereas the similarity of database compounds to reference molecules gradually decreases.
CSN analysis with known active compounds has shown that the emergence of local compound clusters is a necessary, albeit insufficient, condition for detecting active hits on the basis of molecular similarity. By contrast, an even distribution of similarity relationships between reference compounds, hits, and false-positives makes it essentially impossible to successfully select novel active compounds. To explore distributions of similarity relationships, subset CSNs can be generated for rankings using alternative similarity measures and compared. On the basis of such comparisons, similarity functions can be prioritized. In our analysis, this was demonstrated by comparing Tc- and TcMCS-based ranking. It was also shown that reference compounds in CSNs originating from TcMCS calculations generally had larger node degrees than reference compounds in CSNs from Tc-based rankings. Furthermore, although the distributions of clustering coefficients and modularity of subset CSNs from TcMCS- and Tc-based rankings were overall comparable, graphical analysis revealed that TcMCS-based CSNs often displayed more extensive local clustering of hits vs false-positives than Tc-based CSNs, resulting in further improved enrichment of hits in rankings. Taken together, the results of our analysis suggest that subset networks complement the analysis of similarity search results and provide additional insights that could not be obtained from database rankings alone. Moreover, similarity-based compound rankings might also help to facilitate network analysis of large compound data sets by replacing global network representations with series of subset networks. In this case, rankings might be generated for compounds of particular interest to select subsets at varying similarity levels for network display. This also highlights the complementarity of similarity searching and network analysis.
Acknowledgments
We thank the OpenEye Scientific Software, Inc., for providing a free academic license of the OpenEye toolkit.
Author Contributions
The study was carried out and the manuscript written with contributions of all authors. All authors have approved the final version of the manuscript.
The authors declare no competing financial interest.
References
- Lavecchia A.; Di Giovanni C. Virtual Screening Strategies in Drug Discovery: A Critical Review. Curr. Med. Chem. 2013, 20, 2839–2860. 10.2174/09298673113209990001. [DOI] [PubMed] [Google Scholar]
- Irwin J. J.; Shoichet B. K. Docking Screens for Novel Ligands Conferring New Biology. J. Med. Chem. 2016, 59, 4103–4120. 10.1021/acs.jmedchem.5b02008. [DOI] [PMC free article] [PubMed] [Google Scholar]
- Eckert H.; Bajorath J. Molecular Similarity Analysis in Virtual Screening: Foundations, Limitations and Novel Approaches. Drug Discovery Today 2007, 12, 225–233. 10.1016/j.drudis.2007.01.011. [DOI] [PubMed] [Google Scholar]
- Maggiora G.; Vogt M.; Stumpfe D.; Bajorath J. Molecular Similarity in Medicinal Chemistry. J. Med. Chem. 2014, 57, 3186–3204. 10.1021/jm401411z. [DOI] [PubMed] [Google Scholar]
- Maggiora G. M.; Shanmugasundaram V. Molecular Similarity Measures. Meth. Mol. Biol. 2004, 275, 1–50. 10.1385/1-59259-802-1:001. [DOI] [PubMed] [Google Scholar]
- Mason J. S.; Good A. C.; Martin E. J. 3-D Pharmacophores in Drug Discovery. Curr. Pharm. Des. 2001, 7, 567–597. 10.2174/1381612013397843. [DOI] [PubMed] [Google Scholar]
- Willett P. Similarity-based Virtual Screening Using 2D Fingerprints. Drug Discovery Today 2006, 11, 1046–1053. 10.1016/j.drudis.2006.10.005. [DOI] [PubMed] [Google Scholar]
- Rush T. S.; Grant J. A.; Mosyak L.; Nicholls A. A Shape-Based 3-D Scaffold Hopping Method and Its Application to a Bacterial Protein–Protein Interaction. J. Med. Chem. 2005, 48, 1489–1495. 10.1021/jm040163o. [DOI] [PubMed] [Google Scholar]
- Willett P.; Barnard J. M.; Downs G. M. Chemical Similarity Searching. J. Chem. Inf. Comput. Sci. 1998, 38, 983–996. 10.1021/ci9800211. [DOI] [Google Scholar]
- Stumpfe D.; Bajorath J. Similarity Searching. Wiley Interdiscip. Rev.: Comput. Mol. Sci. 2011, 1, 260–282. 10.1002/wcms.23. [DOI] [Google Scholar]
- Johnson M.; Maggiora G. M.. Concepts and Applications of Molecular Similarity; John Wiley & Sons: New York, 1990. [Google Scholar]
- Maggiora G.; Bajorath J. Chemical Space Networks – A Powerful New Paradigm for the Description of Chemical Space. J. Comput.-Aided Mol. Des. 2014, 28, 795–802. 10.1007/s10822-014-9760-0. [DOI] [PubMed] [Google Scholar]
- Patterson D. E.; Cramer R. D.; Ferguson A. M.; Clark R. D.; Weinberger L. E. Neighborhood Behavior – A Useful Concept for Validation of Molecular Diversity Descriptors. J. Med. Chem. 1996, 39, 3049–3059. 10.1021/jm960290n. [DOI] [PubMed] [Google Scholar]
- Rogers D.; Hahn M. Extended-Connectivity Fingerprints. J. Chem. Inf. Model. 2010, 50, 742–754. 10.1021/ci100050t. [DOI] [PubMed] [Google Scholar]
- Wishart D. S.; Feunang Y. D.; Guo A. C.; Lo E. J.; Marcu A.; Grant J. R.; Sajed T.; Johnson D.; Li C.; Sayeeda Z.; Assempour N.; Iynkkaran I.; Liu Y.; Maciejewski A.; Gale N.; Wilson A.; Chin L.; Cummings R.; Le D.; Pon A.; Knox C.; Wilson M. DrugBank 5.0: A Major Update to the DrugBank Database for 2018. Nucleic Acids Res. 2018, 46, D1074–D1082. 10.1093/nar/gkx1037. [DOI] [PMC free article] [PubMed] [Google Scholar]
- Gaulton A.; Bellis L. J.; Bento A. P.; Chambers J.; Davies M.; Hersey A.; Light Y.; McGlinchey S.; Michalovich D.; Al-Lazikani B.; Overington J. P. ChEMBL: A Large-Scale Bioactivity Database for Drug Discovery. Nucleic Acids Res. 2012, 40, D1100–D1107. 10.1093/nar/gkr777. [DOI] [PMC free article] [PubMed] [Google Scholar]
- OEChem, version 1.7.7; OpenEye Scientific Software, Inc.: Santa Fe, NM, 2012.
- Zwierzyna M.; Vogt M.; Maggiora G.; Bajorath J. Design and Characterization of Chemical Space Networks for Different Compound Datasets. J. Comput.-Aided Mol. Des. 2015, 29, 113–125. 10.1007/s10822-014-9821-4. [DOI] [PubMed] [Google Scholar]
- Zhang B.; Vogt M.; Maggiora G.; Bajorath J. Design of Chemical Space Networks Using a Tanimoto similarity Variant Based upon Maximum Common Substructures. J. Comput.-Aided Mol. Des. 2015, 29, 937–950. 10.1007/s10822-015-9872-1. [DOI] [PubMed] [Google Scholar]
- Bastian M.; Heymann S.; Jacomy M. In Gephi: An Open Source Software for Exploring and Manipulating Networks, International AAAI Conference on Weblogs and Social Media (ICWSM), 2009; pp 361–362.
- Fruchterman T. M. J.; Reingold E. M. Graph Drawing by Force-Directed Placement. Software Pract. Exper. 1991, 21, 1129–1164. 10.1002/spe.4380211102. [DOI] [Google Scholar]
- Newman M.Networks – An Introduction; Oxford University Press Inc: New York, 2010. [Google Scholar]
- Csardi G.; Nepusz T. The iGraph Software Package for Complex Network Research. InterJ. Complex Syst. 2006, 1695, 1–9. [Google Scholar]
- Vogt M.; Stumpfe D.; Geppert H.; Bajorath J. Scaffold Hopping Using Two-dimensional Fingerprints: True Potential, Black Magic, or a Hopeless Endeavor? Guidelines for Virtual Screening. J. Med. Chem. 2010, 53, 5707–5715. 10.1021/jm100492z. [DOI] [PubMed] [Google Scholar]
- Jasial S.; Hu Y.; Vogt M.; Bajorath J. Activity-Relevant Similarity Values for Fingerprints and Implications for Similarity Searching. F1000Research 2016, 5, e591. 10.12688/f1000research.8357.1. [DOI] [PMC free article] [PubMed] [Google Scholar]


