Abstract
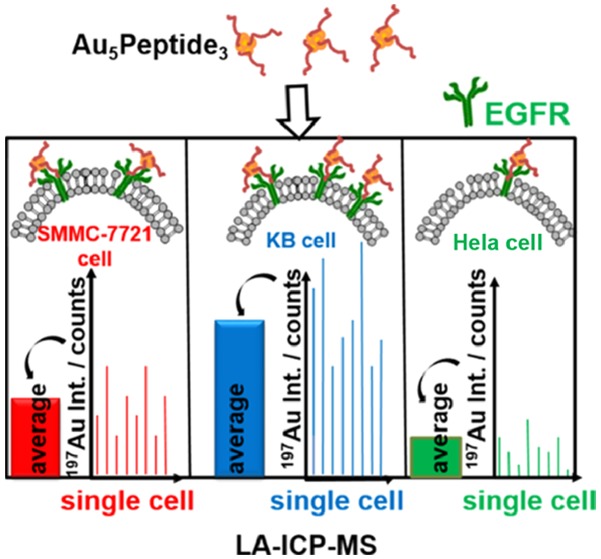
Alterations in protein (e.g., biomarkers) expression levels have a significant correlation with tumor development and prognosis; therefore, it is desired to develop precise methods to differentiate the expression level of proteins in tumor cell lines, especially at the single-cell level. Here, we report a precise and versatile approach of quantifying the protein expression levels of three tumor cell lines in situ using a peptide–Au cluster probe. The probe (Au5Peptide3) consists of a peptide with a specific cell membrane epidermal growth factor receptor (EGFR) targeting ability and an Au cluster for both cell membrane EGFR imaging using confocal microscopy and cell membrane EGFR counting by laser ablation inductively coupled plasma mass spectrometry. Utilizing the peptide–Au cluster probe, we successfully quantify the EGFR expression levels of SMMC-7721, KB, and HeLa cells at a single-cell level and differentiate the EGFR expression levels among these cell lines. The peptide–Au cluster probe, with the ability to differentiate the protein expression level of different cell lines, shows exceptional promise for providing reliable predictive and prognostic information of tumors at a single-cell level.
Introduction
Characterizing the protein quantity of a single cell can provide valuable insight into the molecular mechanisms of cellular processes, including the cellular heterogeneous response to different chemical drugs and physical stimuli.1,2 In clinical settings, information on a specific protein quantity of a single cell can help assess disease progression and prognosis.3,4 The epidermal growth factor receptor (EGFR) is an important cell-surface receptor for the maintenance of cell proliferation, differentiation, and survival.5 EGFR is overexpressed in many cancers, including head and neck, colon, and breast cancers.6−8 In several cancers, such as gastric and colon cancers, EGFR expression is associated with a poor prognosis undergoing a potentially curative surgery.8,9 Nowadays, EGFR levels are mostly quantified using enzyme immunoassay, western blot, and flow cytometric analyses.6,10,11 However, the procedures for these methods are complex. They need cell lysis and protein extraction and can only provide the EGFR level on the basis of the average of large-cell populations. As EGFR is an important biomarker in cancer progression and prognosis, and different cancer cell lines are heterogeneous in the EGFR expression level,9 an effective method to differentiate the EGFR expression levels and precisely quantify the EGFR of different cell lines at a single-cell level is desired.
Recently, some single-cell protein analysis methods have emerged. These methods were based on an antibody conjugated with lanthanide ions, and the specific protein expression level in the single cell was obtained by counting lanthanide ions using mass cytometry.12,13 However, antibody-based protein quantification methods have some shortcomings. For example, it is difficult to precisely control the number of lanthanide ions conjugated to the antibody,14−16 thus it is hard to determine the precise protein level in a single cell. In addition, the antibody is expensive. With the advantage of low immunogenicity, ease in synthesis, and low cost, peptide ligands have been pursued as a target moiety for certain proteins. In this article, we developed a new peptide–Au cluster probe to quantify EGFR in a single cell. Our peptide–Au cluster is relatively cheap and easily synthesized when compared with an antibody. In addition, in a single probe there are exactly five gold atoms; thus we can count more precisely the protein expression level in a single cell.
It is reported that EGFR overexpression is correlated with hepatocellular carcinoma,17−19 nasopharyngeal carcinoma,20,21 and cervical cancers.22,23 SMMC-7721, KB, and HeLa cells are the cells associated with the aforementioned hepatocellular carcinoma, nasopharyngeal carcinoma, and cervical cancer, respectively. The information on EGFR expression in the three cell lines is important for cancer diagnosis and therapy. Therefore, these three tumor cell lines (SMMC-7721, KB, and HeLa cells) were chosen for EGFR studies. We designed a peptide–Au cluster probe (Au5Peptide3), with a fluorescent property and a specific EGFR-targeting ability, to realize EGFR visualization in these cell lines by confocal microscopy. Then, with the help of laser ablation inductively coupled plasma mass spectrometry (LA-ICP-MS) and the molecular formula of our probe (Au5Peptide3), we could precisely quantify EGFR in a single SMMC-7721, KB, and HeLa cell by counting the Au element of the EGFR-binding peptide–Au cluster.
Results and Discussion
The peptide H2N–YHWYGYTPQNVIKKKKYCC–COOH, with two functional domains, was designed. YHWYGYTPQNVI is a specific target sequence for EGFR.24 KKKKYCC was added to the carboxyl terminal of the target sequence. KKKK was added to increase the solubility of the sequence, whereas YCC was added for capturing the Au cluster. The specific synthetic process is described in Experimental Procedures.
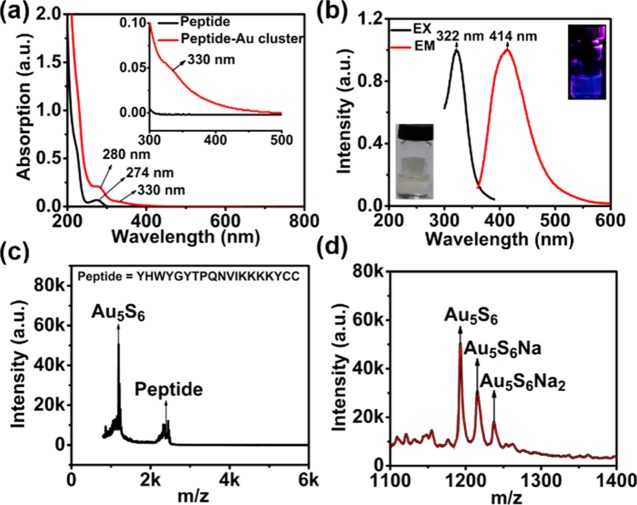
After obtaining our probe, we analyzed its absorption, fluorescence, and mass spectra. Compared to the UV–vis spectra of the free peptide (Figure 1a, black line), we found that a new absorption band appears at 330 nm, in accordance with the maximum excitation at 322 nm (Figure 1b, black line). The probe showed maximum emission at 414 nm (Figure 1b, red line) and strong blue fluorescence under UV irradiation of 365 nm (inset of Figure 1b). To quantify EGFR in a single cell accurately, we needed to acquire the precise composition of our probe. Matrix-assisted laser desorption/ionization time of flight mass spectrometry (MALDI-TOF-MS) is a popular method for studying the accurate mass of a noble metal cluster.25−27 As shown in Figure 1c,d, the peptide–Au cluster is mainly composed of fragments of Au5 plus six S atoms. We cannot see the intact peptide–Au cluster composition (Figure 1c,d), as the C–S bond of the peptide is easily broken during the desorption process.28,29 The mass spectral data in Figure 1d suggested that the composition of our probe fragment is Au5S6. As each peptide is with two Cys, for example, two S atoms, we deduce that the probe formula is Au5Peptide3.
Figure 1.
(a) UV–vis absorption spectrum of the peptide–Au cluster probe, the inset is an enlarged view between 300 and 500 nm. (b) Excitation and emission spectra of the peptide–Au cluster. Inset: Digital photographs taken without (lower left) and with (upper right) UV light irradiation (365 nm). (c) MALDI-TOF-MS of the peptide–Au cluster from 0 to 6000 m/z (S, sulfur atom). (d) Enlarged view of the peptide–Au cluster mass spectra range from 1100 to 1400 m/z.
To mark and quantify EGFR precisely, the specificity of the probe needed to be confirmed first. Figure S1 in the Supporting Information suggests that our probe can mark SMMC-7721, KB, and HeLa cells. To confirm the specific EGFR recognition of our probe, immunofluorescence assays and blocking studies were further carried out. The blue fluorescence of the probe and the red fluorescence of the EGFR antibody were well co-localized on the membranes of the SMMC-7721, KB, and HeLa cells, as depicted in Figure 2a–c, respectively. In the blocking study, we failed to see any obvious probe fluorescence on the membranes of the SMMC-7721, KB, and HeLa cells after the EGFR of these cell lines were first blocked by 5 mM free peptides, because the binding site of EGFR had been occupied by the free peptides (Figure 2d–f). All of the results support the EGFR specificity recognition of our probes.
Figure 2.
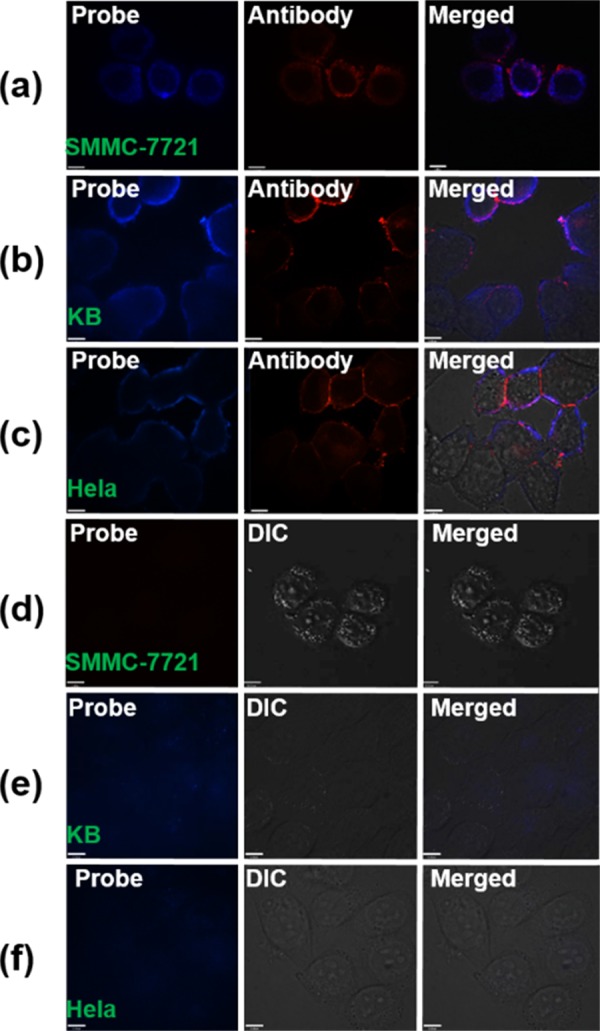
Au5Peptide3 probe-specific marking of EGFR of three cell lines. Confocal fluorescence images of the three cell lines exposed to (a–c) the Au5Peptide3 probe, followed by the EGFR antibody (mouse monoclonal antibody) and the goat antimouse IgG-TR, (d–f) 5 mM free peptide incubated first with the cells for 1 h, followed by the Au5Peptide3 probe incubated for 45 min.
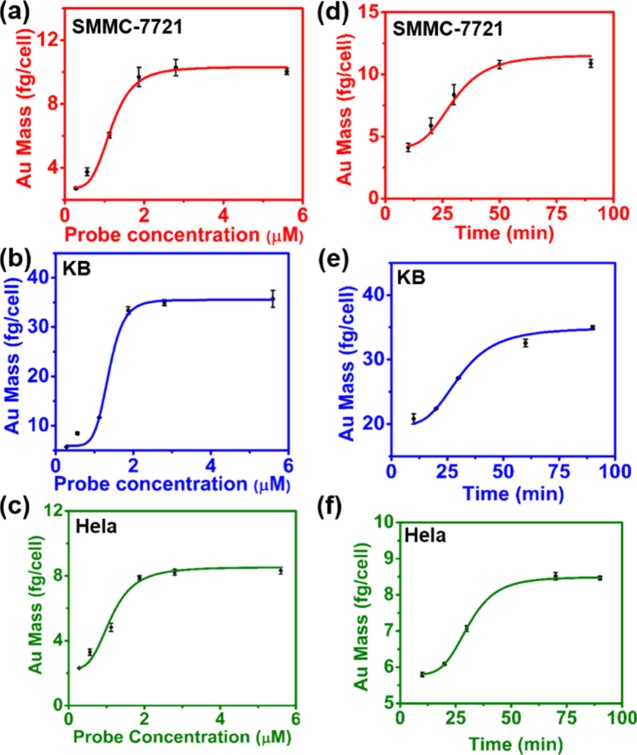
We needed to confirm the optimal labeling parameter before quantifying EGFR in the three cell lines. In this study, solution-based ICP-MS was carried out to obtain the proper probe and cell incubation conditions. Figure 3a–c suggests that the Au mass per cell was saturated when the probe reached 1.87 μM and after 1 h of incubation time. The time parameter of cell labeling was then carried out. Figure 3d–f shows that the optimal labeling time was 1 h when the probe concentration was 1.87 μM. All of these results suggest that the optimal labeling condition to count EGFR in the cells was 1.87 μM and 1 h.
Figure 3.
Average mass of Au per cell was determined by ICP-MS to optimize the cell label conditions in three cell lines exposed to (a–c) a series of concentrations of the peptide–Au cluster probe in a Roswell Park Memorial Institute (RPMI) medium for 1 h and (d–f) the probe of 1.87 μM (the optimized concentration) for different time points.
According to Figure 3a–f, under the optimal labeling conditions, the average Au mass in SMMC-7721, KB, and HeLa cells was about 11.35 ± 0.81, 33.89 ± 1.61, and 8.45 ± 0.45 fg, respectively.
As one probe contained 5 Au atoms, the number of probe molecules in one SMMC-7721, KB, and HeLa cell was about 11.35 ± 0.81, 33.89 ± 1.61, and 8.45 ± 0.45 amol, respectively, which is equal to the amount of EGFR in a single SMMC-7721, KB, and HeLa cell (Figure 4a). We then used Western blotting to confirm the accuracy of our method to differentiate EGFR expression levels in the three cell lines. According to Figure 4b, KB cells express the highest levels of EGFR among the three cell lines, followed by SMMC-7721 cells and then HeLa cells. The result of the Western blot analysis suggests the feasibility of our method to differentiate different EGFR levels in the three cell lines.
Figure 4.
(a) Average EGFR in a single SMMC-7721, KB, and HeLa cell. (b) Western blot of EGFR and β-actin extracted from HeLa, KB, and SMMC-7721 cells. β-Actin is used as a control to ensure the accuracy of immunoblotting.
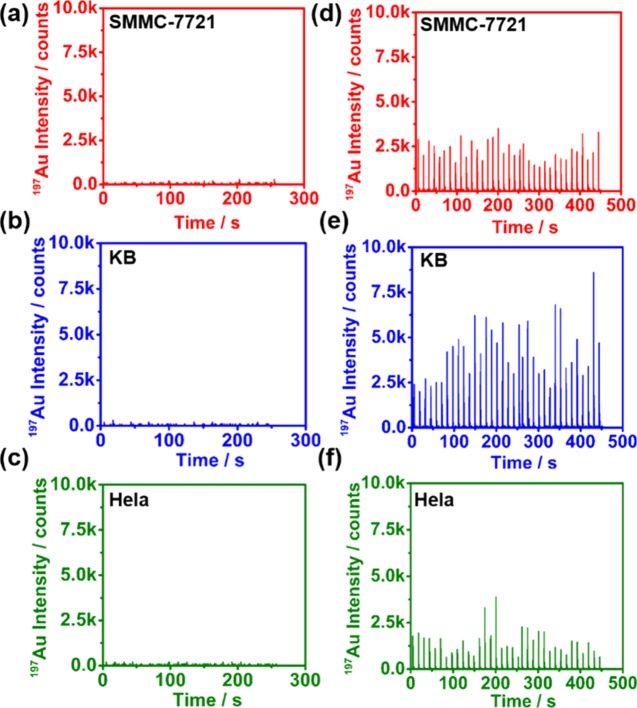
To further check the EGFR expression level in a single cell, we used LA-ICP-MS to quantify the abundance of Au (which can be precisely switched to the EGFR amount by the probe formula) under the optimized labeling conditions. The operation conditions for LA-ICP-MS is shown in Table S1. Figure 5a–f shows the transient Au signals of the three cell lines determined by LA-ICP-MS without probe treatment (a–c) and under the optimized probe labeling conditions (d–f). To obtain the relationship between the Au signal intensity and the Au concentration in a single cell, we used MicroFabJetLab (a commercial inkjet printer) as our calibration standard.30,31 The 197Au signal intensity from ablation of different contents of Au standards on glass slides and the corresponding calibration curve are shown in Figure S2. According to the Au standard calibration curve and three kinds of control cells (Figure 5a–c), we can regard the Au signal intensities under the optimized incubation conditions (Figure 5d–f) as a response to our probe (note that we first integrated the peak areas and then compared it to that of the calibration curve).
Figure 5.
Transient Au signals of the three cell lines determined by LA-ICP-MS (a–c) without any probe treatment and (d–f) under the optimal probe incubation conditions.
Under the optimal incubation condition, the mass of Au in a single cell ranged from 5.75 to 20.45 fg for SMMC-7721 cells, 16.95 to 44.69 fg for KB cells, and 1.88 to 15.19 fg for HeLa cells (see details in Figures 5d–f and S2). As one probe contains 5 Au atoms, the amount of probe (equal to the number of EGFR) of 35 cells on a single cell was from 5.75 to 20.5 amol for SMMC-7721 cells, 17 to 44.7 amol for KB cells, and 1.88 to 15.2 amol for HeLa cells. The average EGFR amount in Figure 5d–f was 13 ± 3.8 amol for SMMC-7721 cells, 34 ± 7.7 amol for KB cells, and 7.3 ± 3.6 amol for HeLa cells. These results were close to the result of 11.35 ± 0.81 amol for SMMC-7721 cells, 33.89 ± 1.61 amol for KB cells, and 8.45 ± 0.45 amol for HeLa cells per cell determined from the bulk cell digestion method in Figure 4a.
Conclusions
In conclusion, utilizing the probe, we successfully quantified three cell lines with different EGFR expression levels in a single cell. The trend of the average EGFR expression levels in the three cell lines obtained from LA-ICP-MS is in accordance with the commonly used protein quantification method, Western blot, which suggests the reliability of our probe to differentiate cells with different protein expression levels. The broad spectrum activity of our probe to quantify proteins in different cell lines makes it possible to differentiate a specific protein of multiple tumor cell lines. As the variation of a protein quantity at a single-cell level has a significant correlation with the early progression of a tumor cell, our methods can help estimate the earlier tumor development at a single-cell level.
Experimental Procedures
Materials
Peptide YHWYGYTPQNVIKKKKYCC (purity: 95%) was purchased from China Peptides. The Centrifugal Filters (MWCO: 3 kDa) were purchased from Merck. Paraformaldehyde was purchased from Sigma. The KB cell line was purchased from Cancer Institute and Hospital, Chinese Academy of Medical Sciences. The SMMC-7721 cell line was a gift from Prof. Zonghai Li, Shanghai Cancer Institute. The cell culture medium RPMI Medium Modified, DMEM/High Glucose, and the Phosphate buffer solution were purchased from Hyclone. Fetal bovine serum (FBS) was purchased from Gibco. EGFR antibody (sc-365829) and goat antimouse IgG-TR (sc-2781) were purchased from Santa Cruz Biotechnology. All of the other materials were commercially available.
Preparation of the Peptide–Au Cluster Probe
The peptide solution (1 mM, 515 μL) was prepared by dissolving it in ultrapure water. NaOH was used to adjust the pH to 10. (The whole preparation process was carried out at 42 °C.) After stirring for 5 min, HAuCl4 (25 mM, 10 μL) aqueous solution was introduced under vigorous stirring. Subsequently, the pH of the solution was adjusted to 14 by NaOH and incubated for 12 h. Finally, the probe was stored away from light at 4 °C. Before being used in the subsequent experiments, the probe was dialyzed at 3 kDa to remove the free ions and peptides.
Characterization of the Peptide–Au Cluster Probe: Product Yield of the Peptide–Au Cluster Probe
We used ICP-MS to measure the product yield of the peptide–Au cluster probe. First, the probe was purified using a dialysis tube (MWCO: 3 kDa) to remove the free ions and peptides. Then, 1 mL nitric acid and 3 mL hydrochloric acid were added to the purified and crude samples overnight. (All of the samples were run in triplicate.) Subsequently, we used the Microwave Reactions System to digest the samples and diluted them with an aqueous solution containing 2% HNO3 and 1% HCl. Then, a series of Au standard solutions (0.5, 1, 5, 10, 50 ng/mL aqueous solution containing 2% HNO3 and 1% HCl) was injected into the ICP-MS system to get the standard calibration plot. Finally, the purified and crude samples were also injected into the ICP-MS system. The product yield of the peptide–Au cluster probe was 42.15%.
Optical Spectra Study of the Peptide–Au Cluster Probe: Absorption Spectra Study
The peptide–Au cluster probe was diluted with Milli-Q water and then used for absorption spectra study. The reference solution was Milli-Q water. We obtained the spectra using a spectrophotometer (UV-1800; Shimadzu, Japan).
Fluorescent Spectra Study
We used a spectrofluorometer (RF-5301; Shimadzu, Japan) to obtain the fluorescence spectra of our probe.
MALDI-TOF-MS Study of the Peptide–Au Cluster Probe
The mass spectra were obtained by the ABI MALDI-TOF system in a linear positive mode with the matrix CHCA.
Specific Study of the Probe for EGFR in SMMC-7721, KB, and HeLa Cells: Cell Location Study of the Probe in SMMC-7721, KB, and HeLa Cells
The SMMC-7721, KB, and HeLa cells were cultured on a glass-bottomed culture dish and incubated at 37 °C for 24 h. After being washed with PBS twice and fixed with 3.7% paraformaldehyde at room temperature for 20 min, the cells were incubated with the probe for 45 min. Then, we washed them with PBS twice to remove the free probes. Finally, the cells were observed under a fluorescence microscope (Perkin Elmer Spinning Disc confocal microscope with a Nikon TI-E inverted microscope, 60× oil immersion lens was used), and pictures were acquired by UltraVIEW VoX software.
Probe and EGFR Antibody Co-Localization Study in SMMC-7721, KB, and HeLa Cells
To make sure the probe marked EGFR specifically, anti-EGFR antibody was used. First, the cells were fixed with 3.7% paraformaldehyde for 20 min and incubated with the probe for 45 min. Second, the cells were washed with PBS three times and incubated with the anti-EGFR antibody (sc-365829) in PBS for 45 min and, subsequently, in a second antibody (sc-2781) for 35 min away from light. After that, we used PBS to wash the cells three times. Finally, the cells were observed under a confocal microscope.
Blocking Study
To further confirm the specificity of our probe to EGFR, the cells were fixed in 3.7% paraformaldehyde for 20 min at room temperature and then incubated with 5 mM peptide for 1 h. After washing with PBS three times, the cells were incubated with the probe at room temperature for 45 min. Finally, the cells were observed under a confocal microscope.
Quantifying the Expression Level of EGFR in SMMC-7721, KB, and HeLa Cells
To get the optimal labeling condition, we first allowed a series of probe concentrations (0.28, 0.56, 1.12, 1.87, 2.8, 5.6 μM) to be incubated with SMMC-7721, KB, and HeLa cells for 1 h at room temperature. We then used PBST (a strong wash solution) to wash our samples 5 times and then counted using flow cytometry. Subsequently, these samples were transferred to MARS Vessels. In all of the vessels, 3 mL of nitric acid and 1 mL of hydrogen peroxide were added individually. After 24 h, these samples were digested against the Microwave Reactions System (CEM Co. MARS Xpress). After that, 1 mL of nitric acid and 3 mL of hydrochloric acid were added. The samples were then digested again using the Microwave Reactions System after 24 h. Ultimately, an aqueous solution containing 2% HNO3 and 1% HCl was added to 3 mL as the final volume. Then, we got the Au standard Calibration plot by injecting a series of Au standard solutions (0.5, 1, 5, 10, 50 ng/mL in an aqueous solution containing 2% HNO3 and 1% HCl). All of the samples were run in triplicate. We then studied the time impact on the labeling efficiency. SMMC-7721, KB, and HeLa cells were incubated with 1.87 μM of the probe at different times (10, 20, 40, 60, 70, 90 min) at room temperature. The other operation steps were the same as the ones in the study of the concentration effect on the labeling efficiency.
Semiquantitative Study of the EGFR Expression Levels in SMMC-7721, KB, and HeLa Cells by Western Blot
SMMC-7721, KB, and HeLa cells were seeded into a 6-well plate. After 24 h, the cells were lysed with 200 μL RIPA buffer (50 mM Tris–HCl, pH 7.4, 150 mM NaCl, 1% Triton X-100, 1% sodium deoxycholate, 0.1% sodium dodecyl sulfate (SDS), 1 mM sodium orthovanadate, 50 mM NaF, and 1 mM ethylenediaminetetraacetic acid) and a protease inhibitor cocktail tablet (Roche Molecular Biochemicals) for 10 min at 4 °C. Then, we collected the cell supernatant by centrifugation at 12 000 rpm for 5 min at 4 °C. The protein concentrations of the four samples were measured by the BCA assay kit (Beyotime). The samples were then mixed with 4× loading buffer, heated at 100 °C for 5 min, and subjected to 12% SDS–polyacrylamide gel electrophoresis (the proteins loaded across the lanes were equal). Finally, the proteins were transferred to the PVDF membrane and probed with specific antibodies, and protein bands were detected using the Amersham ECLTM Prime Western Blotting Detection Reagent (GE healthcare, U.K.).
Quantification of EGFR in Individual SMMC-7721, KB, and HeLa Cells by LA-ICP-MS
In the experiment, a 213 laser ablation system (ESI, Fremont) coupled to a NexION 300D ICPMS instrument (PerkinElmer, Norwalk) was used. We used helium (the flow rate was 0.8 L/min) as the ablation gas. Argon was introduced through a Y-piece after the cell was ablated. During the ablation of the NIST 611 glass, the system was tuned for a maximum 115In signal intensity, and the UO/U ratio was kept at a low level simultaneously. The operational parameters of LA-ICP-MS are given in Table S1. The STD mode was used, and the signal intensity (counts/s) was collected. In the experiment, SMMC-7721, KB, and HeLa cells were seeded into a 12-well cell culture cluster. After 12 h, 1.87 μM of the probe was incubated with the three types of cells for 1 h. Then, PBST was used to wash the cells 5 times. After the cells were dried, we introduced them into LA-ICP-MS. A 40 μm diameter area was chosen to ensure the cell was completely covered. The Au standards (2.54, 14.86, 28.93, and 133.03 fg) were analyzed individually with the same experimental procedures in the sample analysis.
Acknowledgments
This work was financially supported by the National Key Basic Research Program of China (2013CB932703, 2013CB933704) and the National Science Foundation of China (21425522, 21390414).
Supporting Information Available
The Supporting Information is available free of charge on the ACS Publications website at DOI: 10.1021/acsomega.6b00390.
Cell location study, operating conditions for LA-ICP-MS, and single-cell Au calibration standard curve (PDF)
The authors declare no competing financial interest.
Supplementary Material
References
- Wu M. Y.; Singh A. K. Single-cell protein analysis. Curr. Opin. Biotechnol. 2012, 23, 83–88. 10.1016/j.copbio.2011.11.023. [DOI] [PMC free article] [PubMed] [Google Scholar]
- Tay S.; Hughey J. J.; Lee T. K.; Lipniacki T.; Quake S. R.; Covert M. W. Single-cell NF-kappa B dynamics reveal digital activation and analogue information processing. Nature 2010, 466, 267–271. 10.1038/nature09145. [DOI] [PMC free article] [PubMed] [Google Scholar]
- Shackleton M.; Quintana E.; Fearon E. R.; Morrison S. J. Heterogeneity in Cancer: Cancer Stem Cells versus Clonal Evolution. Cell 2009, 138, 822–829. 10.1016/j.cell.2009.08.017. [DOI] [PubMed] [Google Scholar]
- Yu M.; Stott S.; Toner M.; Maheswaran S.; Haber D. A. Circulating tumor cells: approaches to isolation and characterization. J. Cell Biol. 2011, 192, 373–382. 10.1083/jcb.201010021. [DOI] [PMC free article] [PubMed] [Google Scholar]
- Yewale C.; Baradia D.; Vhora I.; Patil S.; Misra A. Epidermal growth factor receptor targeting in cancer: a review of trends and strategies. Biomaterials 2013, 34, 8690–707. 10.1016/j.biomaterials.2013.07.100. [DOI] [PubMed] [Google Scholar]
- Ciardiello F.; Tortora G. Epidermal growth factor receptor (EGFR) as a target in cancer therapy: understanding the role of receptor expression and other molecular determinants that could influence the response to anti-EGFR drugs. Eur. J. Cancer 2003, 39, 1348–1354. 10.1016/S0959-8049(03)00235-1. [DOI] [PubMed] [Google Scholar]
- Nicholson R. I.; Gee J. M. W.; Harper M. E. EGFR and cancer prognosis. Eur. J. Cancer 2001, 37, 9–15. 10.1016/S0959-8049(01)00231-3. [DOI] [PubMed] [Google Scholar]
- Galizia G.; Lieto E.; Orditura M.; Castellano P.; La Mura A.; Imperatore V.; Pinto M.; Zamboli A.; De Vita F.; Ferraraccio F. Epidermal growth factor receptor (EGFR) expression is associated with a worse prognosis in gastric cancer patients undergoing curative surgery. World J. Surg. 2007, 31, 1458–1468. 10.1007/s00268-007-9016-4. [DOI] [PubMed] [Google Scholar]
- Galizia G.; Lieto E.; Ferraraccio F.; De Vita F.; Castellano P.; Orditura M.; Imperatore V.; La Mura A.; La Manna G.; Pinto M.; Catalano G.; Pignatelli C.; Ciardiello F. Prognostic significance of epidermal growth factor receptor expression in colon cancer patients undergoing curative surgery. Ann. Surg. Oncol. 2006, 13, 823–835. 10.1245/ASO.2006.05.052. [DOI] [PubMed] [Google Scholar]
- Gao J.; Yu Y. S.; Zhang Y. Y.; Song J. J.; Chen H. W.; Li W.; Qian W. Z.; Deng L.; Kou G.; Chen J. M.; Guo Y. J. EGFR-specific PEGylated immunoliposomes for active siRNA delivery in hepatocellular carcinoma. Biomaterials 2012, 33, 270–282. 10.1016/j.biomaterials.2011.09.035. [DOI] [PubMed] [Google Scholar]
- Psyrri A.; Bamias A.; Yu Z. W.; Weinberger P. M.; Kassar M.; Markakis S.; Kowalski D.; Efstathiou E.; Camp R. L.; Rimm D. L.; Dimopoulos M. A. Subcellular localization and protein levels of cyclin-dependent kinase inhibitor p27 independently predict for survival in epithelial ovarian cancer. Clin. Cancer Res. 2005, 11, 8384–8390. 10.1158/1078-0432.CCR-05-1270. [DOI] [PubMed] [Google Scholar]
- Bendall S. C.; Simonds E. F.; Qiu P.; Amir E. A. D.; Krutzik P. O.; Finck R.; Bruggner R. V.; Melamed R.; Trejo A.; Ornatsky O. I.; Balderas R. S.; Plevritis S. K.; Sachs K.; Pe’er D.; Tanner S. D.; Nolan G. P. Single-Cell Mass Cytometry of Differential Immune and Drug Responses Across a Human Hematopoietic Continuum. Science 2011, 332, 687–696. 10.1126/science.1198704. [DOI] [PMC free article] [PubMed] [Google Scholar]
- Heath J. R.; Ribas A.; Mischel P. S. Single-cell analysis tools for drug discovery and development. Nat. Rev. Drug Discovery 2016, 15, 204–216. 10.1038/nrd.2015.16. [DOI] [PMC free article] [PubMed] [Google Scholar]
- Bodenmiller B.; Zunder E. R.; Finck R.; Chen T. J.; Savig E. S.; Bruggner R. V.; Simonds E. F.; Bendall S. C.; Sachs K.; Krutzik P. O.; Nolan G. P. Multiplexed mass cytometry profiling of cellular states perturbed by small-molecule regulators. Nat. Biotechnol. 2012, 30, 858–867. 10.1038/nbt.2317. [DOI] [PMC free article] [PubMed] [Google Scholar]
- Bjornson Z. B.; Nolan G. P.; Fantl W. J. Single-cell mass cytometry for analysis of immune system functional states. Curr. Opin. Immunol. 2013, 25, 484–494. 10.1016/j.coi.2013.07.004. [DOI] [PMC free article] [PubMed] [Google Scholar]
- Ornatsky O.; Bandura D.; Baranov V.; Nitz M.; Winnik M. A.; Tanner S. Highly multiparametric analysis by mass cytometry. J. Immunol. Methods 2010, 361, 1–20. 10.1016/j.jim.2010.07.002. [DOI] [PubMed] [Google Scholar]
- Gao J.; Yu Y.; Zhang Y.; Song J.; Chen H.; Li W.; Qian W.; Deng L.; Kou G.; Chen J.; Guo Y. EGFR-specific PEGylated immunoliposomes for active siRNA delivery in hepatocellular carcinoma. Biomaterials 2012, 33, 270–282. 10.1016/j.biomaterials.2011.09.035. [DOI] [PubMed] [Google Scholar]
- Wang H.; Jiang H.; Zhou M.; Xu Z.; Liu S.; Shi B.; Yao X.; Yao M.; Gu J.; Li Z. Epidermal growth factor receptor vIII enhances tumorigenicity and resistance to 5-fluorouracil in human hepatocellular carcinoma. Cancer Lett. 2009, 279, 30–38. 10.1016/j.canlet.2009.01.019. [DOI] [PubMed] [Google Scholar]
- Han C.; Michalopoulos G. K.; Wu T. Prostaglandin E2 receptor EP1 transactivates EGFR/MET receptor tyrosine kinases and enhances invasiveness in human hepatocellular carcinoma cells. J. Cell. Physiol. 2006, 207, 261–270. 10.1002/jcp.20560. [DOI] [PubMed] [Google Scholar]
- Ma B. B.; Poon T. C.; To K.; Zee B.; Mo F. K.; Chan C. M.; Ho S.; Teo P. M.; Johnson P. J.; Chan A. T. Prognostic significance of tumor angiogenesis, Ki 67, p53 oncoprotein, epidermal growth factor receptor and HER2 receptor protein expression in undifferentiated nasopharyngeal carcinoma-a prospective study. Head Neck 2003, 25, 864–872. 10.1002/hed.10307. [DOI] [PubMed] [Google Scholar]
- Chua D. T.; Wei W. I.; Wong M. P.; Sham J. S.; Nicholls J.; Au G. K. Phase II study of gefitinib for the treatment of recurrent and metastatic nasopharyngeal carcinoma. Head Neck 2008, 30, 863–867. 10.1002/hed.20792. [DOI] [PubMed] [Google Scholar]
- Iida K.; Nakayama K.; Rahman M. T.; Rahman M.; Ishikawa M.; Katagiri A.; Yeasmin S.; Otsuki Y.; Kobayashi H.; Nakayama S.; Miyazaki K. EGFR gene amplification is related to adverse clinical outcomes in cervical squamous cell carcinoma, making the EGFR pathway a novel therapeutic target. Br. J. Cancer 2011, 105, 420–427. 10.1038/bjc.2011.222. [DOI] [PMC free article] [PubMed] [Google Scholar]
- Soonthornthum T.; Arias-Pulido H.; Joste N.; Lomo L.; Muller C.; Rutledge T.; Verschraegen C. Epidermal growth factor receptor as a biomarker for cervical cancer. Ann. Oncol. 2011, 22, 2166–2178. 10.1093/annonc/mdq723. [DOI] [PubMed] [Google Scholar]
- Li Z. H.; Zhao R. J.; Wu X. H.; Sun Y.; Yao M.; Li J. J.; Xu Y. H.; Gu J. R. Identification and characterization of a novel peptide ligand of epidermal growth factor receptor for targeted delivery of therapeutics. FASEB J. 2005, 19, 1978–1985. 10.1096/fj.05-4058com. [DOI] [PubMed] [Google Scholar]
- Xie J. P.; Zheng Y. G.; Ying J. Y. Protein-Directed Synthesis of Highly Fluorescent Gold Nanoclusters. J. Am. Chem. Soc. 2009, 131, 888–889. 10.1021/ja806804u. [DOI] [PubMed] [Google Scholar]
- Arnold R. J.; Reilly J. P. High-resolution time-of-flight mass spectra of alkanethiolate-coated gold nanocrystals. J. Am. Chem. Soc. 1998, 120, 1528–1532. 10.1021/ja9723545. [DOI] [Google Scholar]
- Le Guevel X.; Hotzer B.; Jung G.; Hollemeyer K.; Trouillet V.; Schneider M. Formation of Fluorescent Metal (Au, Ag) Nanoclusters Capped in Bovine Serum Albumin Followed by Fluorescence and Spectroscopy. J. Phys. Chem. C 2011, 115, 10955–10963. 10.1021/jp111820b. [DOI] [Google Scholar]
- Negishi Y.; Nobusada K.; Tsukuda T. Glutathione-protected gold clusters revisited: Bridging the gap between gold(I)-thiolate complexes and thiolate-protected gold nanocrystals. J. Am. Chem. Soc. 2005, 127, 5261–5270. 10.1021/ja042218h. [DOI] [PubMed] [Google Scholar]
- Yu Y.; Luo Z. T.; Chevrier D. M.; Leong D. T.; Zhang P.; Jiang D. E.; Xie J. P. Identification of a Highly Luminescent Au-22(SG)(18) Nanocluster. J. Am. Chem. Soc. 2014, 136, 1246–1249. 10.1021/ja411643u. [DOI] [PubMed] [Google Scholar]
- Zhai J.; Wang Y.; Xu C.; Zheng L.; Wang M.; Feng W.; Gao L.; Zhao L.; Liu R.; Gao F.; Zhao Y.; Chai Z.; Gao X. Facile approach to observe and quantify the alpha(IIb)beta3 integrin on a single-cell. Anal. Chem. 2015, 87, 2546–2549. 10.1021/ac504639u. [DOI] [PubMed] [Google Scholar]
- Wang M.; Zheng L. N.; Wang B.; Chen H. Q.; Zhao Y. L.; Chai Z. F.; Reid H. J.; Sharp B. L.; Feng W. Y. Quantitative Analysis of Gold Nanoparticles in Single Cells by Laser Ablation Inductively Coupled Plasma-Mass Spectrometry. Anal. Chem. 2014, 86, 10252–10256. 10.1021/ac502438n. [DOI] [PubMed] [Google Scholar]
Associated Data
This section collects any data citations, data availability statements, or supplementary materials included in this article.


