Abstract
Nonenzyme direct electrochemical sensing of hydrogen peroxide and glucose by highly active nanomaterial-modified electrode has attracted considerable attention. Among the reported electrochemical sensing materials, hollow carbon sphere (HCS) is an attractive carbon support because of its large specific surface area, porous structure, and easy accessibility for target molecules. In this study, naked Pt nanoparticles with average size of 3.13 nm are confined in mesoporous shells of hollow carbon spheres (Pt/HCS) by using one-step synthesis, which can not only produce highly dispersed Pt nanoparticles with clean surface, but also avoid the relatively slow impregnation–reduction process. The surface area of the obtained Pt/HCS (566.30 m2 g–1) is larger than that of HCS, attributing to the enlarged surface area after Pt nanoparticles deposition. The average pore width of Pt/HCS (3.33 nm) is smaller than that of HCS (3.84 nm), indicating the filling of Pt nanoparticles in the mesopores of carbon shells. By using the as-synthesized Pt/HCS as nonenzymatic sensing material, H2O2 and glucose can be detected with high sensitivity and selectivity. The linear range toward H2O2 sensing is from 0.3 to 2338 μM, and the limit of detection (LOD) is 0.1 μM. For glucose sensing, Pt/HCS exhibited two linear ranges from 0.3 to 10 mM and from 10 to 50 mM with an LOD of 0.1 mM. In addition, the Pt/HCS exhibited higher electrochemical stability than commercial Pt/C in acid solution. The present study demonstrates that Pt/HCS is a promising sensing material for electrochemical detection of both H2O2 and glucose.
1. Introduction
According to the report from the World Health Organization in 2016, about 422 million people in the world are suffering from diabetes, a chronic disease because of abnormal levels of blood glucose.1 Therefore, it is necessary to monitor the glucose concentration in blood for the therapy of diabetes and researchers are in the pursuit of creating glucose sensors with high sensitivity, speediness, high reliability, and low cost. In addition, as an important chemical and analyte, H2O2 has been applied in various industry fields (e.g., mining, pharmaceutical industry, environment, and textile and food manufacturing),2−4 biological diagnostics fields (H2O2 is an indicator of Parkinson’s disease, cancer, stroke, arteriosclerosis, Alzheimer’s disease, etc.),5,6 and liquid-based fuel cells (H2O2 serves as an efficient oxidant).7 Among the developed diverse analytical techniques for the detection of H2O2 and glucose (fluorescence,8 colorimetric,9 chemiluminescence,10,11 high-performance liquid chromatography12), enzyme- and nonenzyme-based electrochemical methods are attractive due to their easy operation, high detection sensitivity and selectivity, etc. Enzyme-based sensors are easy to be inactive and difficult to recycle on account of being sensitive to temperature and humidity. In recent years, to achieve high-performance sensing, to increase the stability, and to lower the cost of electrochemical sensors, increasing attention has been concentrated on nonenzymatic sensing nanomaterials.
Platinum (Pt) nanoparticles have been widely used as sensing materials in nonenzymatic electrochemical hydrogen peroxide or glucose sensors due to their excellent electronic and catalytic properties for the oxidation of glucose and reduction of H2O2.13−15 Although Pt nanoparticles possess high electrocatalytic activity, their poor durability and easiness of aggregation largely restrict their practical application in electrochemical sensors. Hence, a lot of studies have focused on dispersing Pt nanoparticles on support materials, such as but not limited to graphene,16−18 porous carbon,19−21 metal organic framework,22 UiO-66,23 carbon nanotube,24,25 MCM-22,26 mesoporous carbon sphere,27,28 and hollow carbon sphere (HCS).29−31 Graphene-based and UiO-66-based Pt nanoparticles have been applied in the fabrication of electrochemical sensors for the sensitive detection of hydrogen peroxide18,23 and glucose.16,17 On the other hand, as a kind of promising carbon support material, hollow carbon sphere (HCS) has attracted increasing attention due to its high surface area for dispersing metal nanoparticles, hollow interior structure and porous carbon shell to provide abundant mass transport channels and confine nanoparticles in the pores, high mechanical and chemical stability to resist acidic and alkali corrosion, excellent biocompatibility to carry drug molecules, and good electrical conductivity.32−36 It should be noted that at present most studies concerning Pt nanoparticles supported on hollow carbon spheres focus on the electrocatalytic performances for oxygen reduction reaction,28,29 methanol oxidation reaction,27 and supercapacitors.37 In the previous studies, it was found that by confining Pt nanoparticles in porous carbon structure29,30 or ordered mesoporous carbon spheres,27,38 the electrochemical stability and long-term catalytic performance of Pt nanoparticles can be improved remarkably. For electrochemical sensors, Luhana et al.31 reported a novel enzymatic glucose sensor by depositing Pt nanoparticles-decorated hollow carbon spheres on glassy carbon (GC) electrode (GCE) immobilized with glucose oxidase. However, there is relatively few research on studying the H2O2- and glucose-sensing performances of Pt nanoparticles confined in hollow carbon spheres without glucose oxidase.
Herein, small and surface-clean Pt nanoparticles confined in mesoporous shells of hollow carbon spheres (Pt/HCS) were prepared in a one-pot synthesis by adding Pt precursor into the HCS synthesis system. HCS acts as a porous template to provide mesopores for confinement of Pt nanoparticles with controlled size and to prevent the aggregation of Pt nanoparticles. The Pt nanoparticles confined in HCS can not only provide active surface and increase the surface area, but also enhance the conductivity of the material. The synthesized Pt/HCS showed high sensing performances for nonenzymatic electrochemical detection of hydrogen peroxide and glucose due to the high catalytic activity and stability of the highly dispersed Pt nanoparticles. The electrochemical sensor fabricated from the Pt/HCS exhibited potential application in real samples.
2. Results and Discussion
2.1. Synthesis and Characterization of Pt Nanoparticles Confined in Mesoporous Shells of Hollow Carbon Spheres (Pt/HCSs)
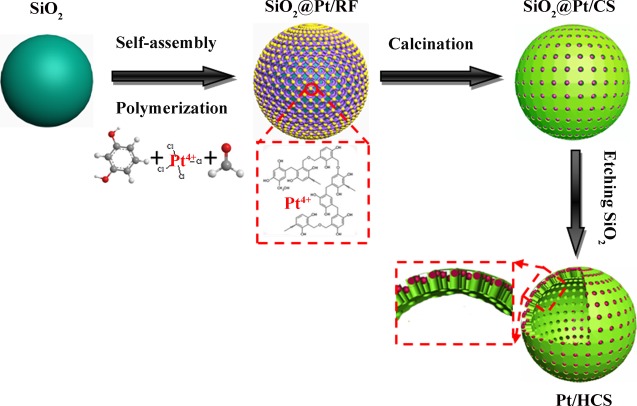
In this study, mesoporous carbon structure was chosen to confine Pt nanoparticles owing to the following advantages. First, the mesoporous carbon allows the formation of nanoparticle catalyst during the calcination process at high temperature. Second, the carbon channels can prevent the sintering of the formed Pt nanoparticles and the final size of Pt nanoparticles can be automatically controlled by the dimension of the mesoporous channels. Third, the porous structure ensures a good spatial distribution of Pt nanoparticles.39,40 Fourth, by depositing Pt nanoparticles in porous carbon matrix, the high electronic conductivity of carbon is beneficial for the application of Pt/HCS as electrocatalyst in electrochemical sensors. It should be noted that metal nanoparticles confined in mesoporous structures are usually prepared by the impregnation–reduction–annealing method.19−21,27,37,39,40 In the reported method, metal ions were introduced first in the pores of the mesoporous structure through the incipient wetness impregnation. The metal ions were then reduced to metal clusters under reduction condition and finally transformed into metal nanoparticles through the annealing treatment. This multistep synthesis method is experimentally complicated and difficult to control the structure of product. In the present study, one-step process was used to prepare Pt/HCS by introducing Pt precursor in the formation process of HCS. Meanwhile, on the basis of the previous study,30 H2PtCl6 precursor can also initiate the polymerization of furfuryl alcohol. Therefore, H2PtCl6 can not only serve as the Pt precursor, but also initiate the polymerization of resorcinol and formaldehyde for the preparation of carbon spheres. On the surface of SiO2 spheres obtained by the hydrolysis of tetraethoxysilane (TEOS), H2PtCl6 is surrounded by the polymerized phenolic resin, which serves as a protecting agent to prevent the agglomeration of Pt nanoparticles in the subsequent carbonization process. With the present method, highly dispersed Pt nanoparticles confined in HCS can be easily prepared.
The synthesis process of Pt/HCS is schematically illustrated in Scheme 1. As described in Experimental Section, SiO2 spheres were first obtained by the hydrolysis of TEOS. Pt ions can be self-assembled into the phenolic resin molecular after resorcinol, formaldehyde, and K2PtCl4 were added in the reaction system. Pt/HCS can be finally prepared through the thermal annealing process at 800 °C and the removal of internal SiO2 sphere template. The obtained Pt nanoparticles are confined in the mesoporous carbon shell, and the mesopores of HCS can restrict the movement and shedding of Pt nanoparticles to improve their stability.
Scheme 1. Schematic Illustration of the Formation Process of Pt/HCS.
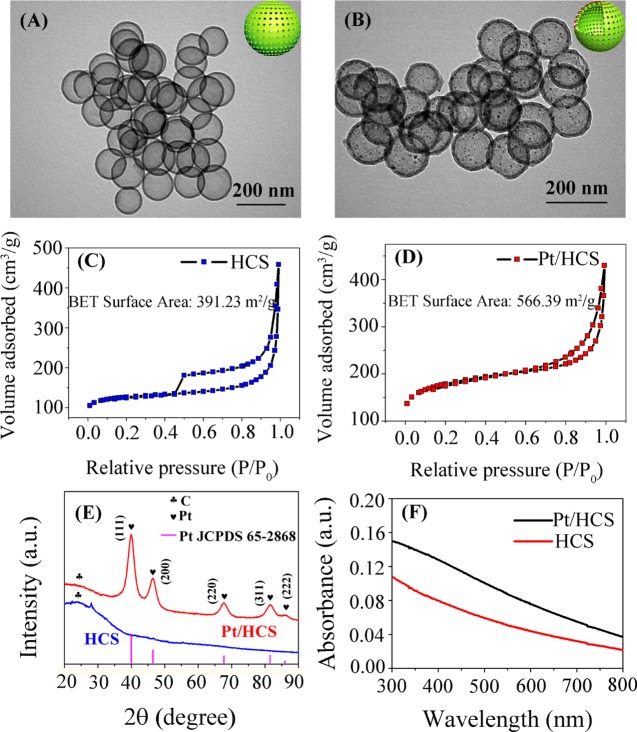
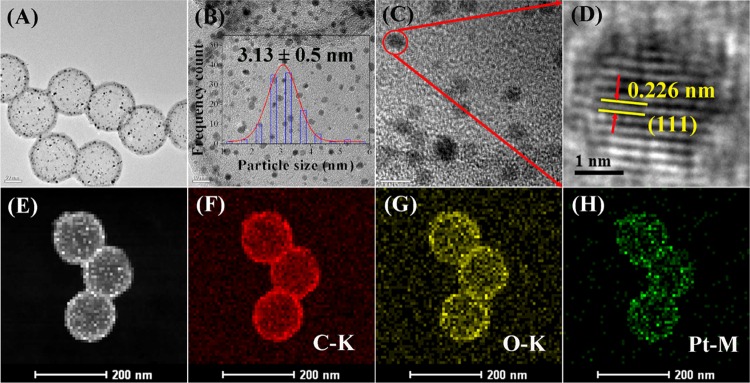
Figure 1A shows the transmission electron microscopy (TEM) image of HCS. It can be seen that monodispersed HCS with a smooth surface and an average diameter of about 140 nm can be synthesized without the presence of Pt precursor. The nitrogen adsorption–desorption curve of HCS in Figure 1C shows a typical IV type isotherm, indicating that HCS has mesoporous structure. The HCS material was measured to have a Brunauer–Emmett–Teller (BET) surface area of 391.23 m2 g–1 and an average pore width (by BET) of 3.84 nm. Figure 1B displays the TEM image of Pt/HCS. Compared to the structure of HCS shown in Figure 1A, the diameter of Pt/HCS has no obvious change, but small Pt nanoparticles distributed inside the shell of HCS can be seen clearly. Such result indicates that with the addition of H2PtCl6 during the synthesis of HCS, Pt nanoparticles can be in situ produced in the carbon mesopores. Meanwhile, it is interesting that the BET surface area of Pt/HCS increases to 566.30 m2 g–1, as shown in Figure 1D, and the adsorption average pore width (by BET) decreases to 3.33 nm. On the basis of the increased BET surface area and the reduced pore width of Pt/HCS compared to HCS, it can be speculated that the formed Pt nanoparticles are confined in the mesoporous shell of HCS. The confined Pt nanoparticles could enlarge the surface area of Pt/HCS and occupy parts of the carbon mesopores to some extent. In addition, on the basis of the size-distribution histogram shown in the inset of Figure 2B, the mean size of Pt nanoparticles is 3.13 nm, which is smaller than the pore size of HCS (3.84 nm).
Figure 1.
TEM images of HCS (A) and Pt/HCS (B). The insets at the top-right corner of (A) and (B) are the schematic illustrations of HCS and Pt/HCS, respectively. N2 adsorption and desorption isotherms of HCS (C) and Pt/HCS (D). (E) X-ray powder diffraction (XRD) patterns of HCS and Pt/HCS. (F) UV–visible (vis) absorption spectra of HCS and Pt/HCS.
Figure 2.
(A–D) High-resolution TEM (HRTEM) images of Pt/HCS at different magnifications. Scanning transmission electron microscopy (STEM) image of Pt/HCS (E) and the corresponding element mappings of C (F), O (G), and Pt (H). The inset in B shows the size-distribution histogram of Pt nanoparticles in Pt/HCS.
The crystal phases of the prepared materials were characterized by XRD. Figure 1E shows the XRD patterns of HCS and Pt/HCS. The broad peaks at 2θ of 25° in both XRD spectra correspond to the (002) plane of carbon. Compared to that of HCS, the XRD pattern of Pt/HCS shows additional sharp diffraction peaks at 2θ of 39.75, 46.23, 67.45, 81.24, and 85.69°, corresponding to the (111), (200), (220), (311), and (222) facets of Pt (JCPDS 65-2868). Meanwhile, according to the Scherrer equation, the size of Pt nanoparticles was calculated to be 3.9 nm based on the (111) peak, which is close to that obtained from TEM measurement. Figure 1F shows the UV–vis absorption spectra of Pt/HCS and HCS in water. The absorption curves of both HCS and Pt/HCS show an exponential decay profile. It is noteworthy that Pt nanoparticles do not exhibit detectable localized surface plasmon resonance band,41 suggesting that the Pt nanoparticles has small size and they could be confined in the mesoporous shell of HCS.
Figure 2A–D shows the HRTEM images of Pt/HCS at different magnifications. It can be observed that Pt nanoparticles with an average size of 3.13 nm (Figure 2B inset) are evenly dispersed in HCS. From the HRTEM image in Figure 2D, the interplanar distance of 0.226 nm matches well with the (111) lattice plane of Pt crystal. High-angle annular dark-field scanning transmission electron microscopy (HAADF-STEM) image (Figure 2E) and the corresponding elemental mappings of C, O, and Pt (Figure 2F–H) obviously indicate the uniform distribution of C, O, and Pt elements in the carbon shell, which also suggests the successful confinement of Pt nanoparticles in the shell of HCS.
X-ray photoelectron spectroscopy (XPS) measurements were performed to study the chemical composition and states of the Pt/HCS sensing material. Figures 3A and S2A show the survey XPS images of Pt/HCS and HCS, respectively. Compared to the survey spectrum of HCS, the prominent signal at 73.0 eV in Figure 3A is from the Pt nanoparticles in Pt/HCS. The high-resolution Pt 4f spectrum of Pt/HCS in Figure 3B exhibits two main single peaks at 71.0 and 74.3 eV, which can be assigned to Pt0 4f7/2 and Pt0 4f5/2, respectively, revealing the metallic state of Pt nanoparticles.16,21 The C 1s XPS images of Pt/HCS (Figure 3C) and HCS (Figure S2B) clearly show the three main types of carbon: C–C (284.5 eV), C–O (286.2 eV), and C=O (288.8 eV). On the other hand, it can be seen that the peak of C–C in HCS (Figure S2B) is predominant and the peaks of C–O and C=O are relatively weak. Compared to HCS, the peaks of C–O and C=O are relatively stronger in Pt/HCS, which could be ascribed to that Pt precursor in the reaction system accelerates the polymerization of resorcinol and formaldehyde and thus introduces more oxygen-containing functional groups.
Figure 3.
XPS survey image (A), and high-resolution XPS images of Pt 4f (B) and C 1s (C) of Pt/HCS.
Raman spectroscopy was then employed to study the amorphous and graphitic carbon contents in the HCS and Pt/HCS using the intensity ratio of D-band to G-band (ID/IG).42Figure S3A shows the Raman spectra of HCS and Pt/HCS, in which the two peaks at 1356 and 1596 cm–1 correspond to the disordered graphite (D-band) and graphite (G-band) carbon. The ID/IG value of Pt/HCS (0.71) is close to that of the HCS (0.79), indicating the similar defect level in the two samples. These results reveal that the formed Pt nanoparticles confined in the mesoporous shell of HCS do not change the degree of graphitization of carbon shells, which is consistent with the results of TEM and BET.
2.2. Amperometric H2O2 Detection Based on Pt/HCS-Modified Electrode
Electrochemical impedance spectroscopy measurements were first carried out to investigate the electrical conductivity of HCS- and Pt/HCS-modified electrodes. The semicircle diameter in a typical Nyquist plot can reflect the charge-transfer resistance (Rct) at the interface of electrode and electrolyte. It is well known that a smaller semicircle means a higher electron transfer rate of an interface and a higher electrical conductivity of material. The Nyquist plots in Figure S3B clearly show that the semicircle diameter of Pt/HCS is smaller than that of HCS, indicating that the introduction of Pt nanoparticles can improve the conductivity of HCS.
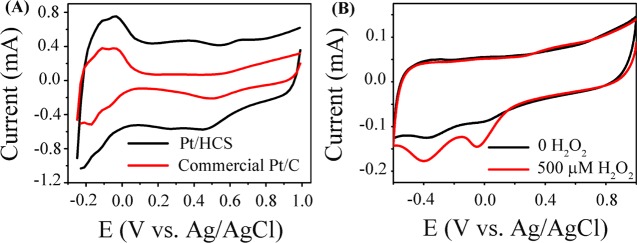
The electrochemical properties of Pt/HCS were studied by cyclic voltammetry (CV) in acid solution using commercial Pt/C as a reference material, as presented in Figure 4A. Similar to the commercial Pt/C, the CV curve of Pt/HCS shows the characteristic voltammetric peaks of Pt and carbon, suggesting the clean surface of Pt nanoparticles confined in the mesoporous carbon shell. It can be seen that there are three pairs of characteristic peaks for Pt/HCS: the Pt oxidation peak at 0.65 V, the reduction of Pt oxide at 0.46 V in the reversed potential scan, and the adsorption and desorption of hydrogen between −0.2 and 0 V. The corresponding reactions can be described with the following equations
| 1 |
| 2 |
| 3 |
Meanwhile, a couple of redox peaks at 0.39 and 0.24 V can be observed, which can be assigned to the redox of oxygen-containing functional groups (carboxylic, carbonyls, and phenolic hydroxyls) on the surface of HCS.30,43 Compared to Pt/C, Pt/HCS shows larger double-layer charging current due to the large surface area of carbon shells of hollow carbon spheres. As shown in Figure S4A, similar characteristic CV peaks can be observed for Pt/C and Pt/HCS in neutral phosphate-buffered saline (PBS), but the peak potentials show a slight shift. The hydrogen adsorption and desorption region moves to −0.5 to 0.3 V, the Pt oxidation peak shifts to 0.56 V, and the reduction peak of Pt oxides moves to around 0.0 V.
Figure 4.
(A) CV curves of Pt/HCS and commercial Pt/C in 0.1 M N2-saturated HClO4 solution at a scan rate of 100 mV s–1. (B) CV curves of Pt/HCS-modified GC electrode in 0.1 M PBS (pH = 7.4) solution with the absence and presence of 500 μM H2O2 at a scan rate of 50 mV s–1.
For Pt/HCS, at certain potentials, the naked Pt nanoparticles can provide active sites for the reduction of H2O2 and therefore produce amperometric signals according to the following equation44,45
| 4 |
On the other hand, on the basis of the previous studies,46,47 as an oxidant, H2O2 can react with the reactive carbon atoms on the surface of carbon materials (e.g., reduced graphene oxide). Therefore, on the surface of HCS, hydrogen peroxide could be also reduced to generate reduction current. However, from the electrochemical results below, the HCS shows much lower catalytic activity for the H2O2 reduction.
Figure 4B presents the CV curves of Pt/HCS in 0.1 M PBS (pH = 7.4) solution with and without 500 μM H2O2 at a potential scan rate of 50 mV s–1. For Pt/HCS in 0.1 M PBS, two small peaks at −0.06 and −0.36 V can be observed, corresponding to the reduction of Pt oxide and defective sites of HCS.20,48 For comparison, the CV curve of HCS modified on GCE was also recorded in 0.1 M PBS (pH = 7.4) solution, as shown in Figure S4B. One can see that the CV curve of HCS shows only one reduction peak at about −0.32 V, which proves that the peak at −0.36 V in Figure 4B comes from the hollow carbon spheres. As shown in Figure 4B, upon the addition of 500 μM H2O2, the electrochemical reduction currents show much increase. The enhanced electrochemical current signals could be ascribed to the electrochemical reduction of H2O2 on the clean surface of Pt nanoparticles confined in HCS.
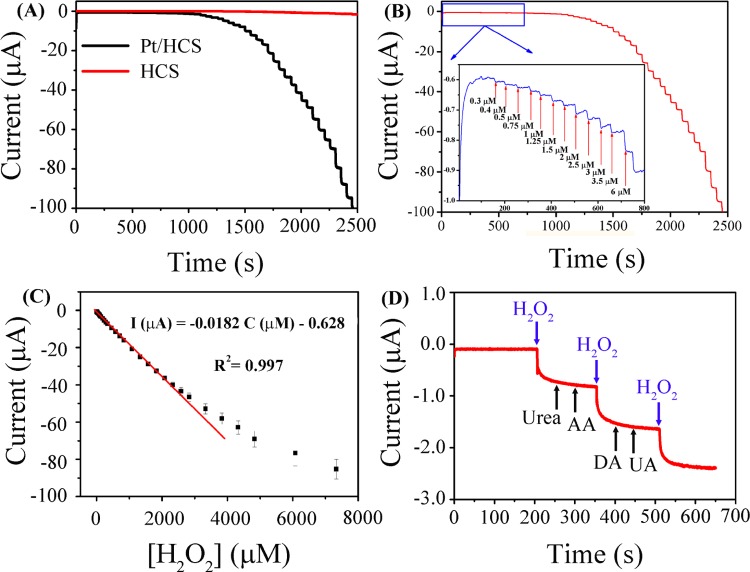
The current–time (i–t) curves of H2O2 reduction on Pt/HCS and HCS (Figure 5A) demonstrate that Pt/HCS exhibits much higher catalytic activity and higher sensing sensitivity than HCS toward H2O2 detection. Figure 5B shows the typical i–t curve from Pt/HCS under successive addition of H2O2 in 0.1 M N2-saturated PBS solution. A ladderlike plot can be observed, which shows the current response to the successive addition of H2O2. When micromolar levels of H2O2 (as low as 0.3 μM shown in the inset of Figure 5B) are added in the system, obvious current responses are discernible. However, as displayed in Figure S4C, only when the concentration of H2O2 is higher than 5 μM, obvious current responses can be observed on the HCS, indicating the much higher sensing performance of Pt/HCS for the H2O2 detection. Figure 5C shows the calibration curves of Pt/HCS for the quantitative analysis of hydrogen peroxide. At the concentration range of 0.3–2388 μM, the calibration equation can be described as I (μA) = −0.0182C (μM) – 0.628 with a calibration coefficient of 0.997. The limit of detection (LOD) was calculated to be 0.1 μM based on a signal-to-noise ratio of 3 (S/N = 3), which is lower than that from other Pt-based sensing materials, for example, Pt@UiO-66 (5 μM)23 and the Pt supported on ordered mesoporous carbons (Pt/OMCs, 1.2 μM).20
Figure 5.
(A) i–t curves of H2O2 reduction on Pt/HCS- and HCS-modified GCE. (B) Amperometric response of Pt/HCS-modified GCE to successive addition of H2O2 at the potential of −0.1 V in 0.1 M PBS solution (pH = 7.4); the inset shows the amplified current signal at low concentrations of H2O2. (C) The corresponding calibration plot of Pt/HCS for the detection of hydrogen peroxide. (D) The current response of Pt/HCS to the addition of 0.1 M H2O2 and 0.1 M different interfering analytes in 0.1 M PBS solution (pH = 7.4) at −0.1 V. AA: ascorbic acid; DA: dopamine; UA: uric acid.
The improved electrochemical sensing properties of Pt/HCS could be ascribed to the unique structure and synergistic effect of Pt and HCS. On the one hand, as shown in the TEM images, the highly dispersed Pt nanoparticles confined in the mesoporous carbon shells can provide abundant Pt active sites for the reduction of H2O2 molecules. On the other hand, the mesopores in HCS can not only prevent the agglomeration of Pt nanoparticles, but also provide channels to enhance the mass transportation in electrochemical reactions. Moreover, the interference effects of urea, ascorbic acid, dopamine, uric acid, and metal ions toward the H2O2 determination on Pt/HCS were also investigated (Figures 5D and S5). It can be seen that an obvious staircase can be detected upon the addition of H2O2, whereas negligible signals can be observed upon the addition of the studied interference analytes. Therefore, the Pt/HCS shows good anti-interference properties for the detection of hydrogen peroxide.
2.3. Electrochemical Detection of Glucose Based on Pt/HCS-Modified Electrode
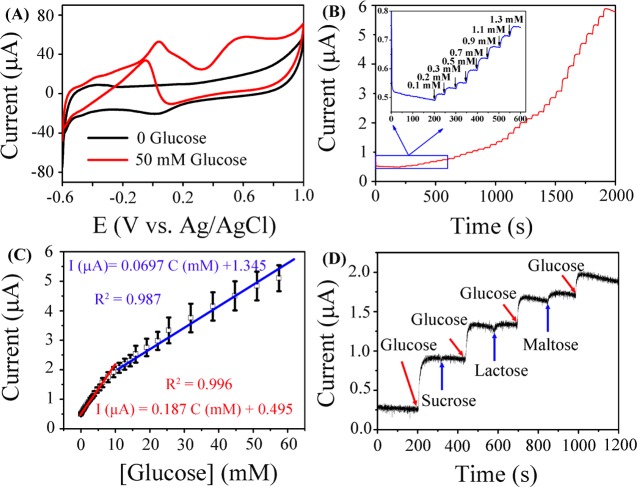
The electrocatalytic activity of Pt/HCS for glucose oxidation was first evaluated by cyclic voltammetry in 0.1 M PBS with the absence and presence of 50 mM glucose. As shown in Figure 6A, CV features of Pt can be observed for Pt/HCS in the electrolyte without glucose (black line), including the hydrogen desorption and adsorption current peaks at low-potential region (−0.6 to −0.3 V) and the Pt oxide formation/reduction at high potentials.49,50 However, in the presence of 50 mM glucose in 0.1 M PBS, a much different CV curve was obtained, suggesting the electrocatalytic activity of Pt/HCS for the oxidation of glucose. In the CV curve, the first small oxidation peak at −0.4 V during the positive scan may be attributed to the electrochemical adsorption of glucose on the Pt/HCS.51 With the potential scanning, the adsorbed glucose can be oxidized to gluconic acid and give the second oxidation current peak at 0.04 V.49,52 With the further increase of potential, the accumulation of glucose intermediates on the surface of Pt/HCS reaches the highest limit value and inhibits the further oxidation of glucose, leading to the decrease of current. When the potential increases to 0.4 V, Pt–OH is formed, which can catalyze the oxidation of glucose intermediates to form gluconolactone or gluconic acid, resulting in the increase of current with a peak at 0.6 V.20,49 The decrease of current at higher potentials could be ascribed to the formation of thick Pt oxide. On the other hand, during the negative potential scan, more and more Pt active sites are liberated from the reduction of Pt oxide and glucose starts oxidation at the potential around 0.05 V, leading to the increase of oxidation current and the appearance of the peak at around −0.05 V.
Figure 6.
(A) CVs of Pt/HCS in N2-saturated 0.1 M PBS (pH = 7.4) solution with and without 50 mM glucose at a scan rate of 5 mV s–1. (B) Amperometric response of Pt/HCS-modified GCE to successive addition of glucose at the potential of 0.6 V in N2-saturated 0.1 M PBS solution (pH = 7.4); the inset shows the amplified current signal at low concentrations of glucose. (C) The corresponding calibration curve of Pt/HCS for the detection of glucose. (D) The current response of Pt/HCS to the addition of 2 mM glucose and 2 mM different interfering analytes (sucrose, lactose, and maltose) in 0.1 M PBS solution (pH = 7.4) at 0.6 V.
Amperometric response of Pt/HCS to successive addition of glucose was then studied in 0.1 M PBS (pH = 7.4) at 0.6 V. Figure 6B displays the typical i–t curve of Pt/HCS for the oxidation of glucose. The inset in Figure 6B shows the corresponding electrochemical response to the glucose at low concentrations. On the basis of these i–t measurements, the corresponding calibration curve for the detection of glucose can be obtained. As displayed in Figure 6C, Pt/HCS has two linear responses to glucose concentration: one is from 0.3 to 10 mM with the corresponding calibration equation of I (μA) = 0.187C (mM) + 0.495 (R2 = 0.996) and another one is from 10 to 50 mM with the corresponding calibration equation of I (μA) = 0.0697C (mM) + 1.345 (R2 = 0.987). It is well known that the physiological level of glucose is from 3 to 8 mM, which is in the first linear detection range, indicating the potential application of Pt/HCS in the practical detection of glucose.17,53 The LOD of glucose was calculated to be 0.1 mM based on a signal-to-noise ratio of 3 (S/N = 3). The sensing selectivity of Pt/HCS for glucose was also studied by examining the electrochemical response of Pt/HCS to other sugars. Figure 6D shows the amperometric responses of Pt/HCS with successive addition of 2 mM glucose, 2 mM sucrose, 2 mM lactose, and 2 mM maltose. It can be seen that negligible current response can be detected upon the injection of sucrose, lactose, and maltose. Therefore, the present Pt/HCS has high sensing selectivity for the electrochemical detection of glucose among these sugars.
The above electrochemical results sufficiently indicate that the Pt nanoparticles confined in unique carbon mesoporous structure have promising application for electrochemically sensing H2O2 and glucose with high sensitivity and selectivity.
The durability of Pt/HCS was studied by accelerated degradation tests (ADTs) in 0.1 M HClO4 solution using commercial Pt/C as a reference. The evolutions of CV curves from Pt/HCS and Pt/C over 5000 cycles of ADTs are shown in Figure S6A,B, respectively. By comparing the CVs in Figure S6A,B, obviously the current intensity from commercial Pt/C shows rapider attenuation than from the Pt/HCS. As shown in Figure S6D, after 5000 potential cycles, the peak current intensity of Pt/C at 0.5 V reduces by 75%. However, for the Pt/HCS, the peak current shows unnoticeable change after 1000 cycles and maintains over 70% of the initial one after 5000 cycles. These results strongly indicate that Pt/HCS has enhanced the electrochemical durability in comparison to the Pt/C catalyst. In Pt/HCS, with Pt nanoparticles confined in carbon mesopores, the porous structure of HCS can not only prevent the agglomeration of Pt nanoparticles, but also protect the Pt nanoparticles from corrosion to a certain extent.
2.4. Real Sample Analysis
The practical application of Pt/HCS was evaluated by detecting the H2O2 and glucose in human blood serum sample. The serum sample was first deoxygenated before adding in PBS solution to avoid the interference of oxygen.
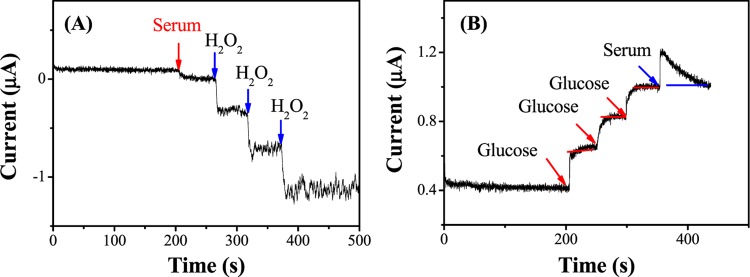
To figure out the concentration of H2O2 in human blood serum, i–t curves of adding 100 μL of serum sample and successively injecting 2 μL (0.1 M) of H2O2 standard solution in 10 mL of PBS (0.1 M, pH 7.4) at −0.1 V are recorded in Figure 7A. The results calculated based on regression equation in Figure 5C are shown in Table 1. The high recovery between 98.95 and 102.8% suggests the promising application of the present Pt/HCS for H2O2 detection in the blood serum. To detect the concentration of glucose in human blood serum, i–t curves of adding 10 μL (1 M) of glucose standard solution (three times) and 50 μL of serum are recorded in Figure 7B. As shown in Table 2, recoveries higher than 98.2% were obtained. Meanwhile, the glucose concentration calculated by this method is 5.6 mM, which is close to that measured by a glucometer in hospital (5.7 mM), indicating that the electrochemical sensor is practically useful for glucose detection.
Figure 7.
(A) i–t curve of Pt/HCS-modified GCE upon the addition of human serum (100 μL), followed by successive addition of 20 μM H2O2 three times in 0.1 M PBS. (B) Response of Pt/HCS-modified GCE to 1 mM glucose and serum (50 μL) in 0.1 M PBS.
Table 1. Determination of H2O2 in Human Serum.
| samples | added concentration (μM) | increased concentration (μM) | mean recovery (%) |
|---|---|---|---|
| serum | 4.68 | ||
| H2O2 | 20 | 19.91 | 98.95 |
| H2O2 | 20 | 20.04 | 100.2 |
| H2O2 | 20 | 19.82 | 102.8 |
Table 2. Determination of Glucose in Human Serum.
| samples | added concentration (mM) | increased concentration (mM) | mean recovery (%) |
|---|---|---|---|
| serum | 5.7 | 5.6 | 98.2 |
| glucose | 1.0 | 1.022 | 102.2 |
| glucose | 1.0 | 0.994 | 99.4 |
| glucose | 1.0 | 1.150 | 115.0 |
3. Conclusions
In this study, surface-clean Pt nanoparticles confined in porous shell of hollow carbon spheres (Pt/HCSs) were successfully synthesized by adding Pt precursor in the synthesis process of HCS and the Pt/HCS showed high sensing performances for the electrochemical detection of hydrogen peroxide and glucose. In this study, the mesoporous carbon shell structure plays the following roles for improving the catalytic and sensing properties of Pt/HCS. First, the mesoporous structure serves as template to restrain the Pt nanoparticles size and prevent the agglomeration of Pt nanoparticles in the calcination and electrochemical sensing processes. Second, the large numbers of porous carbon channels facilitate the entry of detected molecules (H2O2 and glucose) and are conducive to mass transfer in the electrochemical sensing process. Third, by confining Pt nanoparticles in carbon matrix, the obtained Pt/HCS has excellent electronic conductivity, which is favorable for its application in electrochemical sensing. Fourth, this unique structure can protect nanoparticles from corrosion to some extent in the electrochemical environment. Due to the above structural advantages and the highly active surface of naked Pt nanoparticles, the prepared Pt/HCS exhibited a high sensing performance for H2O2 detection with a wide linearity between 0.3 and 2338 μM and a detection limit of 0.1 μM, and a high sensing performance for glucose with linear ranges of 0.3–10 and 10–50 mM and a detection limit of 0.1 mM. In addition, Pt/HCS has high sensing selectivity for both H2O2 and glucose detection. Moreover, the ADT experiments indicated that Pt/HCS is more stable than commercial Pt/C in acid solution. The present study shows that Pt/HCS is a potential candidate as an advanced electrochemical sensing material or electrocatalyst for electrochemical analysis and electrocatalysis applications.
4. Experimental Section
4.1. Chemical Reagents and Materials
Potassium tetrachloroplatinate(II) (K2PtCl4, 98%), tetraethoxysilane (TEOS, ≥98%), and dopamine (DA) were obtained from Sigma-Aldrich. Resorcinol (≥99.5%), ammonia solution (25–28%), and formaldehyde solution (37.0–40.0%) were purchased from Sinopharm Chemical Reagent Co., Ltd. Anhydrous ethanol (≥99.7%), sodium dihydrogen phosphate dehydrate (NaH2PO4·2H2O, >99.0%), sodium phosphate dibasic dodecahydrate (Na2HPO4·12H2O, >99.0%), hydrogen peroxide (H2O2, AR grade, 30%), glucose (C6H12O6·H2O, AR grade), urea (CO(NH2)2, AR grade), and ascorbic acid (AA, C6H8O6, AR grade) were provided by Beijing Chemical Works. Uric acid (UA, C5H4N4O3, AR grade) was obtained from Wokai Chemical Limited (China). Hydrofluoric acid (HF, ≥40%) was acquired from Shen Yang Hua Dong Chemical Works. Perfluorosulfonic acid–poly(tetrafluoroethylene) copolymer (Nafion, 5% w/w solution) was obtained from Alfa Aesar. Perchloric acid (HClO4, AR grade) was supplied by Tianjin Chemical Reagent Co., Ltd. Commercial Pt/C (20 wt % of 2–5 nm Pt nanoparticles on Vulcan XC-72R carbon support) used in this study was obtained from Alfa Aesar. The water used in the experiments was prepared by a Nanopure water system (18.3 MΩ cm). Human blood serum was obtained from Affiliated Hospital of Northeast Normal University in Changchun, China. Different concentrations of H2O2 solutions were freshly prepared when needed. All of the chemicals in experiments were used without any further purification.
4.2. Synthesis of Pt Nanoparticles Confined in Mesoporous Pores of Hollow Carbon Spheres (Pt/HCS)
Pt/HCS was synthesized from K2PtCl4 and phenolic resin by a modified Stöber method. Typically, TEOS (0.4 mL) dispersed in 30 mL ethanol was dropped into the solution containing 20 mL of ethanol, 6 mL of water, and 2 mL of ammonia solution in a round-bottom flask. After stirring for 1 h at room temperature, the solution color changed gradually to slight milky white. Then, 0.1 g of resorcinol, 0.14 mL of formaldehyde solution, and 2 mL of K2PtCl4 solution (20 mM) were separately added into the reaction solution. After stirring for 24 h at room temperature, the resulting product was collected by centrifugation and washed with deionized water and anhydrous ethanol several times. The obtained product was dried in an oven at 60 °C for several hours. The dried powder product was transferred into a ceramic boat and placed in a tubular furnace to calcinate at 800 °C for 1 h at a heating rate of 5 °C min–1. The black product was stirred in HF solution for 24 h to etch the SiO2 template. The product was precipitated by centrifugation, washed with water and ethanol several times, and dried in an oven at 60 °C for several hours.
For comparison, HCS was also synthesized by the same method without the addition of Pt precursor solution.
4.3. Material Characterizations
Morphologies of the samples were characterized by a Hitachi H-600 transmission electron microscope operated at 100 kV. High-resolution TEM (HRTEM), high-angle annular dark-field scanning transmission electron microscopy (HAAD-STEM), corresponding elements mapping, and energy-dispersive X-ray measurements were all conducted on a JEM-2010 (HR) microscope with an accelerating voltage of 200 kV. X-ray powder diffraction (XRD) patterns were collected on a D8 ADVAVCE powder diffractometer (Brukey Company) using Cu Kα radiation (λ = 0.154 nm at 30 kV, 15 mA). UV–vis measurements were performed on a UV-3000PC spectrophotometer purchased from Shanghai Mapada Instruments Co., Ltd. X-ray photoelectron spectroscopy (XPS) was carried out using a VG Thermo ESCALAB 250 spectrometer operated at 120 W. The Barrett–Emmett–Teller (BET) surface area, nitrogen adsorption–desorption isotherms, and pore size-distribution curves were acquired on a Micromeritics ASAP 2020 V 4.0 system at the analysis bath temperature of −196.012 °C and the equilibration interval of 10 s.
4.4. Electrochemical Sensing Measurements
All electrochemical tests were carried out on a CHI 660D electrochemical workstation with a standard three-electrode system at room temperature. A commercial glassy carbon electrode (GCE) (Tianjin Aidahengsheng Science-Technology Development Co., Ltd., 3.0 mm in diameter) modified with the prepared catalyst material, a Pt coil, and an Ag/AgCl (KCl-saturated) electrode were used as working, counter, and reference electrodes, respectively. Before use, the GCE was polished with alumina slurry to obtain a clean mirror surface. Before preparing working electrode, the catalyst ink was prepared by dispersing 2 mg of Pt/HCS in 0.8 mL of deionized water and 0.2 mL of ethanol under magnetic stirring. Then, 10 μL (2 mg mL–1) of catalyst ink and 2.5 μL of Nafion (5‰ w/w solution) was dropped onto the prepolished GCE by a pipette and dried at room temperature.
The electrolyte used in the electrochemical experiments was prepared by dissolving 0.57 g of NaH2PO4·12H2O and 2.87 g of Na2HPO4·2H2O in 250 mL of ultrapure water to obtain 0.1 M (PH = 7.4) phosphate-buffered saline (PBS) at room temperature. Cyclic voltammogram (CV) measurements were performed in the potential range of −0.6 to 1.0 V in N2-saturated PBS solution. Amperometric i–t curves were recorded in N2-saturated PBS solution under stirring. All of the i–t measurements were conducted three times.
4.5. Electrochemical Stability of Pt/HCS in Acid Solution
The electrochemical stabilities of Pt/HCS and commercial Pt/C were examined by accelerated degradation tests (ADTs), in which 5000 cyclic potential sweeps were conducted in a 0.1 M HClO4 electrolyte in the potential range of −0.25 to 1.0 V (vs Ag/AgCl) at a scan rate of 100 mV s–1. For preparing the working electrode, 20 μL of catalyst inks (2 mg mL–1) and 5 μL of Nafion (5‰ w/w solution) were modified on a GCE (5 mm in diameter) at room temperature.
Acknowledgments
This work was supported by National Key Research and Development Plan (2016YFA0203200), the National Science Foundation of China (Nos. 21575134, 21633008, 21405149, and 21773224), and K. C. Wong Education Foundation.
Supporting Information Available
The Supporting Information is available free of charge on the ACS Publications website at DOI: 10.1021/acsomega.7b01549.
More structural characterizations and electrochemical measurements (PDF)
The authors declare no competing financial interest.
Supplementary Material
References
- World Health Organization . Global Report on Diabetes, 2016.
- Chen W.; Cai S.; Ren Q.-Q.; Wen W.; Zhao Y.-D. Recent Advances in Electrochemical Sensing for Hydrogen Peroxide: A Review. Analyst 2012, 137, 49–58. 10.1039/c1an15738h. [DOI] [PubMed] [Google Scholar]
- Karam P.; Halaoui L. I. Sensing of H2O2 at Low Surface Density Assemblies of Pt Nanoparticles in Polyelectrolyte. Anal. Chem. 2008, 80, 5441–5448. 10.1021/ac702358d. [DOI] [PubMed] [Google Scholar]
- Bartlett P. N.; Birkin P. R.; Wang J. H.; Palmisano F.; De Benedetto G. An Enzyme Switch Employing Direct Electrochemical Communication between Horseradish Peroxidase and a Poly(Aniline) Film. Anal. Chem. 1998, 70, 3685–3694. 10.1021/ac971088a. [DOI] [PubMed] [Google Scholar]
- Amatore C.; Arbault S.; Bruce D.; de Oliveira P.; Erard M.; Vuillaume M. Characterization of the Electrochemical Oxidation of Peroxynitrite: Relevance to Oxidative Stress Bursts Measured at the Single Cell Level. Chem. – Eur. J. 2001, 7, 4171–4179. . [DOI] [PubMed] [Google Scholar]
- Miller E. W.; Albers A. E.; Pralle A.; Isacoff E. Y.; Chang C. J. Boronate-Based Fluorescent Probes for Imaging Cellular Hydrogen Peroxide. J. Am. Chem. Soc. 2005, 127, 16652–16659. 10.1021/ja054474f. [DOI] [PMC free article] [PubMed] [Google Scholar]
- Raman R. K.; Shukla A. K. A Direct Borohydride/Hydrogen Peroxide Fuel Cell with Reduced Alkali Crossover. Fuel Cells 2007, 7, 225–231. 10.1002/fuce.200600023. [DOI] [Google Scholar]
- Zhang R.; Chen W. Recent Advances in Graphene-Based Nanomaterials for Fabricating Electrochemical Hydrogen Peroxide Sensors. Biosens. Bioelectron. 2017, 89, 249–268. 10.1016/j.bios.2016.01.080. [DOI] [PubMed] [Google Scholar]
- Chen J.; Ge J.; Zhang L.; Li Z.; Qu L. Poly(Styrene Sulfonate) and Pt Bifunctionalized Graphene Nanosheets as an Artificial Enzyme to Construct a Colorimetric Chemosensor for Highly Sensitive Glucose Detection. Sens. Actuators, B 2016, 233, 438–444. 10.1016/j.snb.2016.04.118. [DOI] [Google Scholar]
- Luo F.; Lin Y.; Zheng L.; Lin X.; Chi Y. Encapsulation of Hemin in Metal–Organic Frameworks for Catalyzing the Chemiluminescence Reaction of the H2O2–Luminol System and Detecting Glucose in the Neutral Condition. ACS Appl. Mater. Interfaces 2015, 7, 11322–11329. 10.1021/acsami.5b01706. [DOI] [PubMed] [Google Scholar]
- Xu S.; Li X.; Li C.; Li J.; Zhang X.; Wu P.; Hou X. In Situ Generation and Consumption of H2O2 by Bienzyme–Quantum Dots Bioconjugates for Improved Chemiluminescence Resonance Energy Transfer. Anal. Chem. 2016, 88, 6418–6424. 10.1021/acs.analchem.6b01000. [DOI] [PubMed] [Google Scholar]
- Asahina T.; Kashiwagi A.; Nishio Y.; Ikebuchi M.; Harada N.; Tanaka Y.; Takagi Y.; Saeki Y.; Kikkawa R.; Shigeta Y. Impaired Activation of Glucose-Oxidation and NADPH Supply in Human Endothelial-Cells Exposed to H2O2 in High-Glucose Medium. Diabetes 1995, 44, 520–526. 10.2337/diab.44.5.520. [DOI] [PubMed] [Google Scholar]
- Katsounaros I.; Schneider W. B.; Meier J. C.; Benedikt U.; Biedermann P. U.; Auer A. A.; Mayrhofer K. J. Hydrogen Peroxide Electrochemistry on Platinum: Towards Understanding the Oxygen Reduction Reaction Mechanism. Phys. Chem. Chem. Phys. 2012, 14, 7384–7391. 10.1039/c2cp40616k. [DOI] [PubMed] [Google Scholar]
- Qiang L.; Vaddiraju S.; Patel D.; Papadimitrakopoulos F. Edge-Plane Microwire Electrodes for Highly Sensitive H2O2 and Glucose Detection. Biosens. Bioelectron. 2011, 26, 3755–3760. 10.1016/j.bios.2011.02.021. [DOI] [PMC free article] [PubMed] [Google Scholar]
- Hoa L. T.; Sun K. G.; Hur S. H. Highly Sensitive Non-Enzymatic Glucose Sensor Based on Pt Nanoparticle Decorated Graphene Oxide Hydrogel. Sens. Actuators, B 2015, 210, 618–623. 10.1016/j.snb.2015.01.020. [DOI] [Google Scholar]
- Chang G.; Shu H.; Huang Q.; Oyama M.; Ji K.; Liu X.; He Y. Synthesis of Highly Dispersed Pt Nanoclusters Anchored Graphene Composites and Their Application for Non-Enzymatic Glucose Sensing. Electrochim. Acta 2015, 157, 149–157. 10.1016/j.electacta.2015.01.085. [DOI] [Google Scholar]
- Meng L.; Xia Y.; Liu W.; Zhang L.; Zou P.; Zhang Y. Hydrogen Microexplosion Synthesis of Platinum Nanoparticles/Nitrogen Doped Graphene Nanoscrolls as New Amperometric Glucose Biosensor. Electrochim. Acta 2015, 152, 330–337. 10.1016/j.electacta.2014.11.180. [DOI] [Google Scholar]
- Zhang Y.; Bai X.; Wang X.; Shiu K.-K.; Zhu Y.; Jiang H. Highly Sensitive Graphene–Pt Nanocomposites Amperometric Biosensor and Its Application in Living Cell H2O2 Detection. Anal. Chem. 2014, 86, 9459–9465. 10.1021/ac5009699. [DOI] [PubMed] [Google Scholar]
- Su C.; Zhang C.; Lu G.; Ma C. Nonenzymatic Electrochemical Glucose Sensor Based on Pt Nanoparticles/Mesoporous Carbon Matrix. Electroanalysis 2010, 22, 1901–1905. 10.1002/elan.200900633. [DOI] [Google Scholar]
- Bo X.; Ndamanisha J. C.; Bai J.; Guo L. Nonenzymatic Amperometric Sensor of Hydrogen Peroxide and Glucose Based on Pt Nanoparticles/Ordered Mesoporous Carbon Nanocomposite. Talanta 2010, 82, 85–91. 10.1016/j.talanta.2010.03.063. [DOI] [PubMed] [Google Scholar]
- Zeng J.; Francia C.; Dumitrescu M. A.; Videla A. H. A. M.; Ijeri V. S.; Specchia S.; Spinelli P. Electrochemical Performance of Pt-Based Catalysts Supported on Different Ordered Mesoporous Carbons (Pt/OMCS) for Oxygen Reduction Reaction. Ind. Eng. Chem. Res. 2012, 51, 7500–7509. 10.1021/ie2016619. [DOI] [Google Scholar]
- Wang C.; deKrafft K. E.; Lin W. Pt Nanoparticles@Photoactive Metal–Organic Frameworks: Efficient Hydrogen Evolution Via Synergistic Photoexcitation and Electron Injection. J. Am. Chem. Soc. 2012, 134, 7211–7214. 10.1021/ja300539p. [DOI] [PubMed] [Google Scholar]
- Xu Z.; Yang L.; Xu C. Pt@UiO-66 Heterostructures for Highly Selective Detection of Hydrogen Peroxide with an Extended Linear Range. Anal. Chem. 2015, 87, 3438–3444. 10.1021/ac5047278. [DOI] [PubMed] [Google Scholar]
- Deb A. K.; Das S. C.; Saha A.; Wayu M. B.; Marksberry M. H.; Baltz R. J.; Chusuei C. C. Ascorbic Acid, Acetaminophen, and Hydrogen Peroxide Detection Using a Dendrimer-Encapsulated Pt Nanoparticle Carbon Nanotube Composite. J. Appl. Electrochem. 2016, 46, 289–298. 10.1007/s10800-016-0922-8. [DOI] [Google Scholar]
- Sun Y.; He K.; Zhang Z.; Zhou A.; Duan H. Real-Time Electrochemical Detection of Hydrogen Peroxide Secretion in Live Cells by Pt Nanoparticles Decorated Graphene–Carbon Nanotube Hybrid Paper Electrode. Biosens. Bioelectron. 2015, 68, 358–364. 10.1016/j.bios.2015.01.017. [DOI] [PubMed] [Google Scholar]
- Liu L.; Díaz U.; Arenal R.; Agostini G.; Concepción P.; Corma A. Generation of Subnanometric Platinum with High Stability During Transformation of a 2D Zeolite into 3D. Nat. Mater. 2017, 16, 132–138. 10.1038/nmat4757. [DOI] [PubMed] [Google Scholar]
- Zhang C.; Xu L.; Shan N.; Sun T.; Chen J.; Yan Y. Enhanced Electrocatalytic Activity and Durability of Pt Particles Supported on Ordered Mesoporous Carbon Spheres. ACS Catal. 2014, 4, 1926–1930. 10.1021/cs500107t. [DOI] [Google Scholar]
- Su F.; Tian Z.; Poh C. K.; Wang Z.; Lim S. H.; Liu Z.; Lin J. Pt Nanoparticles Supported on Nitrogen-Doped Porous Carbon Nanospheres as an Electrocatalyst for Fuel Cells. Chem. Mater. 2010, 22, 832–839. 10.1021/cm901542w. [DOI] [Google Scholar]
- Yan Z.; Xie J.; Zong S.; Zhang M.; Sun Q.; Chen M. Small-Sized Pt Particles on Mesoporous Hollow Carbon Spheres for Highly Stable Oxygen Reduction Reaction. Electrochim. Acta 2013, 109, 256–261. 10.1016/j.electacta.2013.07.085. [DOI] [Google Scholar]
- Yang C.; Zhou M.; Xu Q. Confining Pt Nanoparticles in Porous Carbon Structures for Achieving Durable Electrochemical Performance. Nanoscale 2014, 6, 11863–11870. 10.1039/C4NR03555K. [DOI] [PubMed] [Google Scholar]
- Luhana C.; Bo X.-J.; Ju J.; Guo L.-P. A Novel Enzymatic Glucose Sensor Based on Pt Nanoparticles-Decorated Hollow Carbon Spheres-Modified Glassy Carbon Electrode. J. Nanopart. Res. 2012, 14, 1158 10.1007/s11051-012-1158-0. [DOI] [Google Scholar]
- Fang B.; Kim J. H.; Kim M.-S.; Yu J.-S. Hierarchical Nanostructured Carbons with Meso-Macroporosity: Design, Characterization, and Applications. Acc. Chem. Res. 2013, 46, 1397–1406. 10.1021/ar300253f. [DOI] [PubMed] [Google Scholar]
- Roberts A. D.; Li X.; Zhang H. Porous Carbon Spheres and Monoliths: Morphology Control, Pore Size Tuning and Their Applications as Li-Ion Battery Anode Materials. Chem. Soc. Rev. 2014, 43, 4341–4356. 10.1039/C4CS00071D. [DOI] [PubMed] [Google Scholar]
- Li Y.; Shi J. Hollow-Structured Mesoporous Materials: Chemical Synthesis, Functionalization and Applications. Adv. Mater. 2014, 26, 3176–3205. 10.1002/adma.201305319. [DOI] [PubMed] [Google Scholar]
- Zhang P.; Qiao Z.-A.; Dai S. Recent Advances in Carbon Nanospheres: Synthetic Routes and Applications. Chem. Commun. 2015, 51, 9246–9256. 10.1039/C5CC01759A. [DOI] [PubMed] [Google Scholar]
- Du X.; Zhao C.; Zhou M.; Ma T.; Huang H.; Jaroniec M.; Zhang X.; Qiao S.-Z. Hollow Carbon Nanospheres with Tunable Hierarchical Pores for Drug, Gene, and Photothermal Synergistic Treatment. Small 2017, 1602592 10.1002/smll.201602592. [DOI] [PubMed] [Google Scholar]
- Fan Y.; Liu P.-F.; Huang Z.-Y.; Jiang T.-W.; Yao K.-L.; Han R. Porous Hollow Carbon Spheres for Electrode Material of Supercapacitors and Support Material of Dendritic Pt Electrocatalyst. J. Power Sources 2015, 280, 30–38. 10.1016/j.jpowsour.2015.01.096. [DOI] [Google Scholar]
- Scofield M. E.; Liu H.; Wong S. S. A Concise Guide to Sustainable PEMFCs: Recent Advances in Improving Both Oxygen Reduction Catalysts and Proton Exchange Membranes. Chem. Soc. Rev. 2015, 44, 5836–5860. 10.1039/C5CS00302D. [DOI] [PubMed] [Google Scholar]
- Prieto G.; Zečević J.; Friedrich H.; de Jong K. P.; de Jongh P. E. Towards Stable Catalysts by Controlling Collective Properties of Supported Metal Nanoparticles. Nat. Mater. 2013, 12, 34–39. 10.1038/nmat3471. [DOI] [PubMed] [Google Scholar]
- Baldizzone C.; Mezzavilla S.; Carvalho H. W. P.; Meier J. C.; Schuppert A. K.; Heggen M.; Galeano C.; Grunwaldt J.-D.; Schüth F.; Mayrhofer K. J. J. Confined-Space Alloying of Nanoparticles for the Synthesis of Efficient PtNi Fuel-Cell Catalysts. Angew. Chem., Int. Ed. 2014, 53, 14250–14254. 10.1002/anie.201406812. [DOI] [PubMed] [Google Scholar]
- Landry A. M.; Iglesia E. Synthesis of Bimetallic AuPt Clusters with Clean Surfaces Via Sequential Displacement-Reduction Processes. Chem. Mater. 2016, 28, 5872–5886. 10.1021/acs.chemmater.6b02346. [DOI] [Google Scholar]
- Yu Z.-L.; Xin S.; You Y.; Yu L.; Lin Y.; Xu D.-W.; Qiao C.; Huang Z.-H.; Yang N.; Yu S.-H.; Goodenough J. B. Ion-Catalyzed Synthesis of Microporous Hard Carbon Embedded with Expanded Nanographite for Enhanced Lithium/Sodium Storage. J. Am. Chem. Soc. 2016, 138, 14915–14922. 10.1021/jacs.6b06673. [DOI] [PubMed] [Google Scholar]
- Wang J.; Swain G. M.; Tachibana T.; Kobashi K. Incorporation of Pt Particles in Boron-Doped Diamond Thin Films Applications in Electrocatalysis. Electrochem. Solid-State Lett. 2000, 3, 286–289. 10.1149/1.1391126. [DOI] [Google Scholar]
- Hall S. B.; Khudaish E. A.; Hart A. L. Electrochemical Oxidation of Hydrogen Peroxide at Platinum Electrodes. Part IV: Phosphate Buffer Dependence. Electrochim. Acta 1999, 44, 4573–4582. 10.1016/S0013-4686(99)00183-8. [DOI] [Google Scholar]
- Chen D.; Zhuang X.; Zhai J.; Zheng Y.; Lu H.; Chen L. Preparation of Highly Sensitive Pt Nanoparticles–Carbon Quantum Dots/Ionic Liquid Functionalized Graphene Oxide Nanocomposites and Application for H2O2 Detection. Sens. Actuators, B 2018, 255, 1500–1506. 10.1016/j.snb.2017.08.156. [DOI] [Google Scholar]
- Leonardi S. G.; Aloisio D.; Donato N.; Russo P. A.; Ferro M. C.; Pinna N.; Neri G. Amperometric Sensing of H2O2 Using Pt–TiO2/Reduced Graphene Oxide Nanocomposites. ChemElectroChem 2014, 1, 617–624. 10.1002/celc.201300106. [DOI] [Google Scholar]
- Chu X.; Zhu Q.; Dai W.-L.; Fan K. Excellent Catalytic Performance of Graphite Oxide in the Selective Oxidation of Glutaraldehyde by Aqueous Hydrogen Peroxide. RSC Adv. 2012, 2, 7135–7139. 10.1039/c2ra21068a. [DOI] [Google Scholar]
- Zhou M.; Shang L.; Li B.; Huang L.; Dong S. The Characteristics of Highly Ordered Mesoporous Carbons as Electrode Material for Electrochemical Sensing as Compared with Carbon Nanotubes. Electrochem. Commun. 2008, 10, 859–863. 10.1016/j.elecom.2008.03.008. [DOI] [Google Scholar]
- Wu G.-h.; Song X.-h.; Wu Y.-F.; Chen X.-m.; Luo F.; Chen X. Non-Enzymatic Electrochemical Glucose Sensor Based on Platinum Nanoflowers Supported on Graphene Oxide. Talanta 2013, 105, 379–385. 10.1016/j.talanta.2012.10.066. [DOI] [PubMed] [Google Scholar]
- Wang J.; Thomas D. F.; Chen A. Nonenzymatic Electrochemical Glucose Sensor Based on Nanoporous PtPb Networks. Anal. Chem. 2008, 80, 997–1004. 10.1021/ac701790z. [DOI] [PubMed] [Google Scholar]
- Ernst S.; Heitbaum J.; Hamann C. H. The Electrooxidation of Glucose in Phosphate Buffer. J. Electroanal. Chem. Interfacial Electrochem. 1979, 100, 173–183. 10.1016/S0022-0728(79)80159-X. [DOI] [Google Scholar]
- Paulus U. A.; Wokaun A.; Scherer G. G.; Schmidt T. J.; Stamenkovic V.; Markovic N. M.; Ross P. N. Oxygen Reduction on High Surface Area Pt-Based Alloy Catalysts in Comparison to Well Defined Smooth Bulk Alloy Electrodes. Electrochim. Acta 2002, 47, 3787–3798. 10.1016/S0013-4686(02)00349-3. [DOI] [Google Scholar]
- Shu H.; Cao L.; Chang G.; He H.; Zhang Y.; He Y. Direct Electrodeposition of Gold Nanostructures onto Glassy Carbon Electrodes for Non-Enzymatic Detection of Glucose. Electrochim. Acta 2014, 132, 524–532. 10.1016/j.electacta.2014.04.031. [DOI] [Google Scholar]
Associated Data
This section collects any data citations, data availability statements, or supplementary materials included in this article.


