Abstract
Long noncoding RNAs (lncRNAs) are emerging as key players in multiple cellular pathways1, but their modes of action, and how those are dictated by sequence remain elusive. lncRNAs tend to be enriched in the nuclear fraction, whereas most mRNAs are overtly cytoplasmic2, although several studies have found that hundreds of mRNAs in various cell types are retained in the nucleus3,4. It is thus conceivable that some mechanisms that promote nuclear enrichment are shared between lncRNAs and mRNAs. In order to identify elements that can force nuclear localization in lncRNAs and mRNAs we screened libraries of short fragments tiled across nuclear RNAs, which were cloned into the untranslated regions of an efficiently exported mRNA. The screen identified a short sequence derived from Alu elements and bound by HNRNPK that increases nuclear accumulation. We report that HNRNPK binding to C-rich motifs outside Alu elements is also associated with nuclear enrichment in both lncRNAs and mRNAs, and this mechanism is conserved across species. Our results thus detail a novel pathway for regulation of RNA accumulation and subcellular localization that has been co-opted to regulate the fate of transcripts that integrated Alu elements.
The detailed mechanisms and sequence elements that can direct nuclear enrichment remain unknown for the majority of long RNAs, with a few exceptions5–8. We hypothesized that the nuclear localization observed for some of the lncRNAs and mRNAs is encoded in short sequence elements capable of autonomously dictating nuclear enrichment in an otherwise efficiently exported transcript. In order to systematically identify such regions, we designed a library of 5,511 sequences of 109 nt, composed of fragments that tile the exonic sequences of 37 human lncRNAs, 13 3' UTRs of mRNAs enriched in the nucleus in mouse liver3, and four homologs of the abundant nuclear lncRNA MALAT1 (Supplementary Tables 1 and 2). These tiles were cloned into the 5' and 3' UTRs of AcGFP mRNA (NucLibA library, Figure 1a). Offsets between consecutive tiles were typically 25 nt (10 nt in MALAT1 and TERC and 50 nt in the longer XIST and MEG3 genes). After transfection into MCF7 cells in triplicates, we sequenced the inserts from GFP mRNAs from whole cell extract (WCE), nuclear (Nuc), and cytoplasmic (Cyt) fractions, as well as from the input plasmids (>10 million reads per sample, Supplementary Table 3). Normalized counts of unique molecular identifiers (UMIs, Supplementary Table 2) were used to evaluate the effect of each inserted tile on expression levels and subcellular localization of the GFP mRNA (Supplementary Table 4).
Figure 1. NucLibA analysis and the SIRLOIN element.
a, Experimental approach. b, Nyc/Cyt ratios of tiles when cloned into the indicated region of AcGFP. Tiles overlapping repetitive elements are in black and other tiles are in gray. The region that overlaps the SIRLOIN element is shaded. c, Sequence alignment of four of the most effective tiles, the consensus sequence of AluSx repeat family, and the SIRLOIN element. C/T-rich hexamers are in black, and the regions in JPX#9 and PVT1#22 that were mutagenized in NucLibB are underlined. d, qRT-PCR determination of the abundance of AcGFP mRNA with the indicated fragments cloned into the 3’ UTR. n=10–14 independent fractionations. Mean±SEM is shown. e, Imaging flow cytometry of AcGFP and MALAT1 mRNA, the fraction of the signal overlapping with DAPI signal out of the total signal intensity is displayed. Values above boxes indicate P-values compared to control (two-sided Wilcoxon test). n=570–3621 independent cells. Boxplots show 5th, 25th, 50th, 75th and 95th percentiles. f-g, Nuc/Cyt ratios for RNAs with the indicated number of SIRLOINs or their antisense in MCF7 cells (f) and each of ten ENCODE cell lines (g). Boxplots show 5th, 25th, 50th, 75th and 95th percentiles. In f P-values are for sense vs. antisense comparisons (two-sided Wilcoxon). Asterisks in g indicate P<0.01 (two-sided Wilcoxon) when comparing to transcripts without SIRLOINs. n>185 genes in each group.
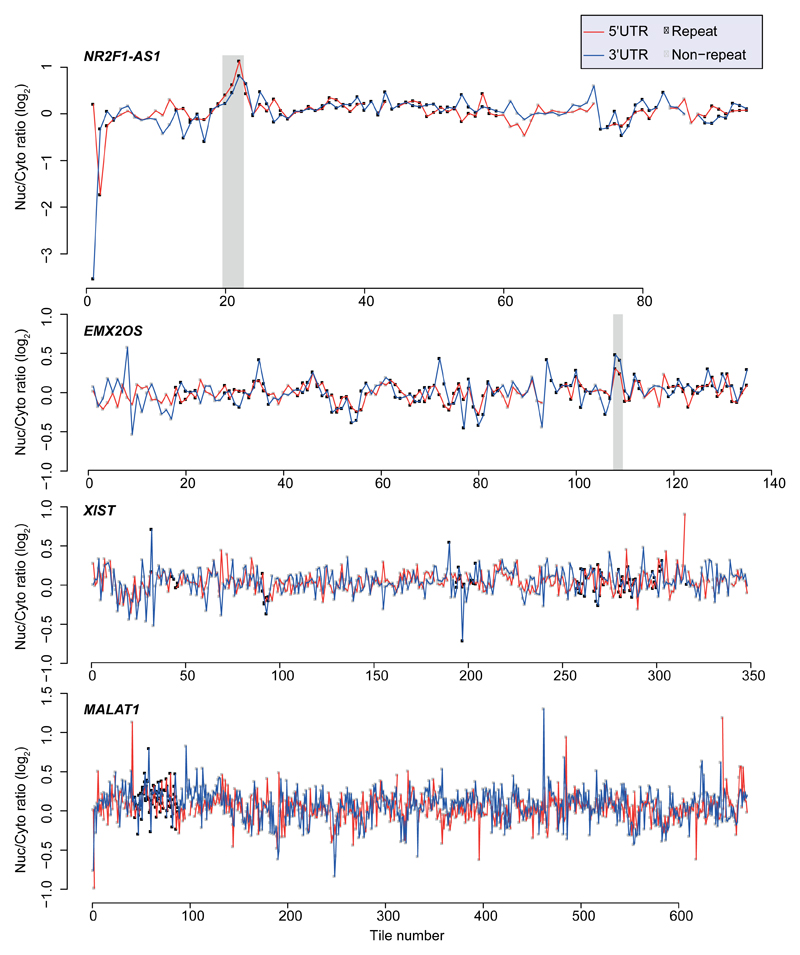
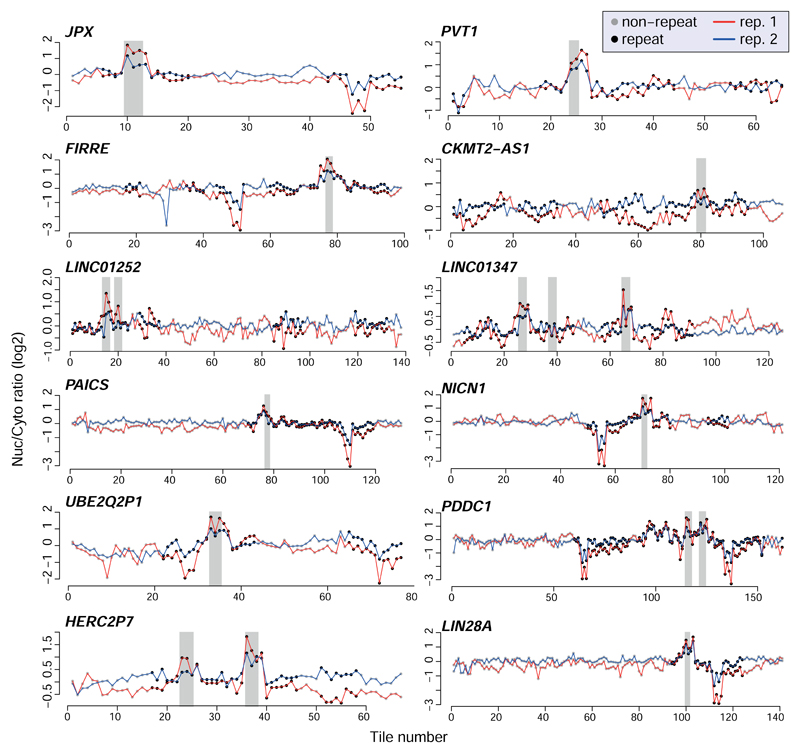
In order to identify high-confidence effects, we focused on consecutive tiles with a consistent effect on localization. We identified 19 regions from 14 genes spanning 2–4 overlapping tiles, with each of the tiles associated with a >30% nuclear enrichment (Supplementary Table 5). The three regions where the tiles had the highest enrichments originated from the lncRNAs JPX, PVT1, and NR2F1-AS1, and those had similar activity when placed in either the 3' or 5' UTR of the GFP mRNA (Figure 1b and Extended Data Figure 1). These tiles overlapped Alu repeat sequences inserted in an ‘antisense’ orientation, and the overlap region between the active patches converged on a 42 nt fragment that contained three stretches of at least six pyrimidines (C/T), two of which were similar to each other and matched the consensus RCCTCCC (R=A/G). We named this 42 nt sequence element SIRLOIN (SINE-derived nuclear RNA LOcalizatIoN) (Figure 1c). We validated a SIRLOIN-containing tile cloned individually for its ability to drive nuclear enrichment of the GFP mRNA using qRT-PCR (Figure 1d, the MALAT1 ~600 nt “region M”5 is used as positive control) and imaging flow cytometry with the PrimeFlow™ RNA assay (Figure 1e).
Interestingly, despite the fact that overall, there was no significant correlation between the effects of individual tiles on expression levels and on localization (R=0.001, P=0.82), SIRLOIN-containing tiles were associated with consistently lower AcGFP RNA expression levels (R=-0.31 between effects on localization and expression, P=8.5·10-3). SIRLOIN elements thus affect both the localization and the expression levels of transcripts.
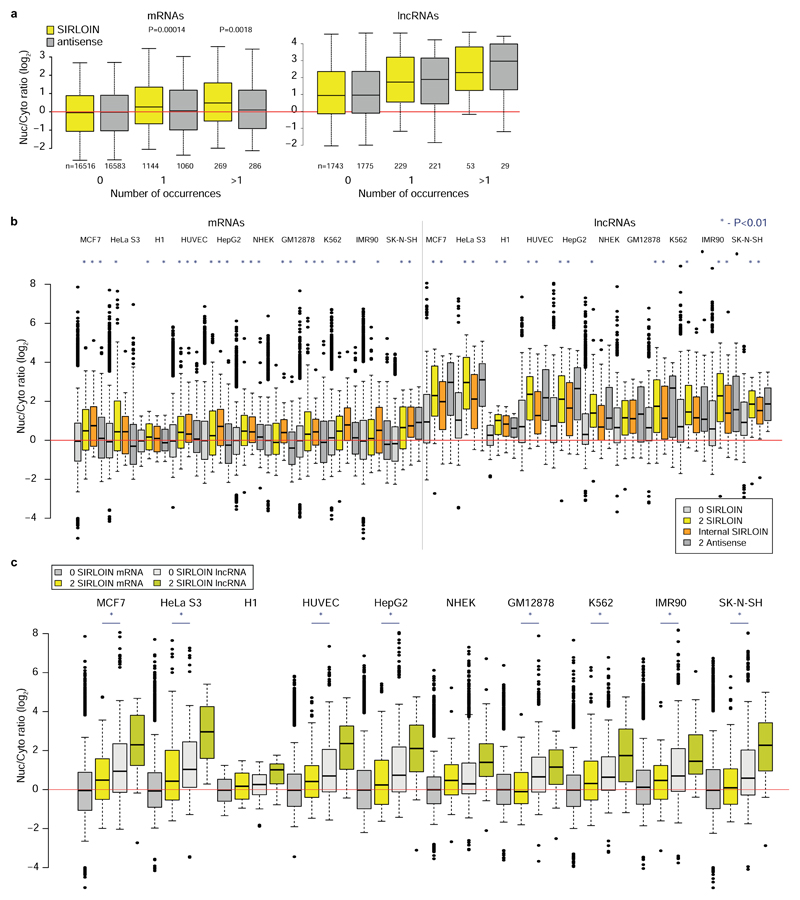
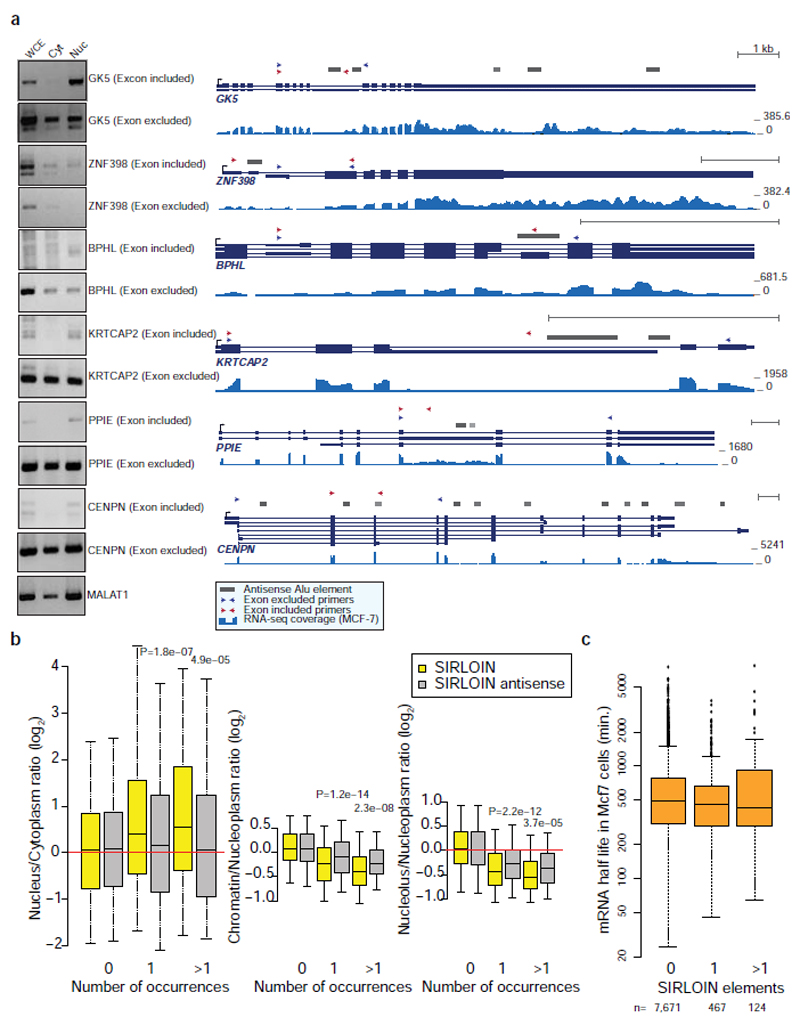
In RNA-seq data from subcellular fractions2, SIRLOIN elements were associated with nuclear enrichment in MCF7 cells (Figure 1f and Extended Data Figure 2a), and two or more SIRLOIN elements were associated with a significant (P<0.01, Wilcoxon test; 1.24–2.41 fold on average) nuclear enrichment in nine out of ten ENCODE cell lines (Figure 1g). Interestingly, single SIRLOIN elements in internal exons were associated with stronger nuclear enrichment (Figure 1g, 1.35–2.84 fold change on average), with similar trends observed for both mRNAs and lncRNAs (Extended Data Figure 2b-c). When a gene had well expressed alternative isoforms with and without SIRLOIN elements in internal exons, those isoforms with the SIRLOIN element were more nuclear (1.07–1.53 fold on average, P<0.05 in 7/10 cell lines, Wilcoxon test, Extended Data Figure 3a and Supplementary Note 1). When comparing nucleoplasmic, chromatin and nucleolar fractions in K562, SIRLOIN-overlapping genes were significantly depleted from the chromatin and nucleolar fractions (Extended Data Figure 3b), suggesting that SIRLOIN-containing transcripts accumulate in the nucleoplasm. There was no significant difference in mRNA half-lives between SIRLOIN-overlapping and other mRNAs (Extended Data Figure 3c, data from9).
Alu elements are the most common SINE elements in the human genome, covering ~10% of the genome sequence10. Alus are enriched in transcribed regions and had a substantial impact on transcriptome evolution, for example through the contribution of new exons11 and polyadenylation sites12,13. Such events are actively suppressed in mRNAs14, but are common in lncRNAs15. Alu elements were also reported to act as functional modules in lncRNAs via intramolecular7 and intermolecular16 pairing with other Alus17. SIRLOIN elements are quite common – 13.1% of lncRNAs and 7.5% of human mRNAs have a SIRLOIN element, and 3.4% vs. 0.3% have a SIRLOIN element in an internal exon, which we find to be more effective. Exonization of Alus thus contributes to the tendency of lncRNAs to be enriched in the nucleus and expressed at lower levels when compared with mRNAs.
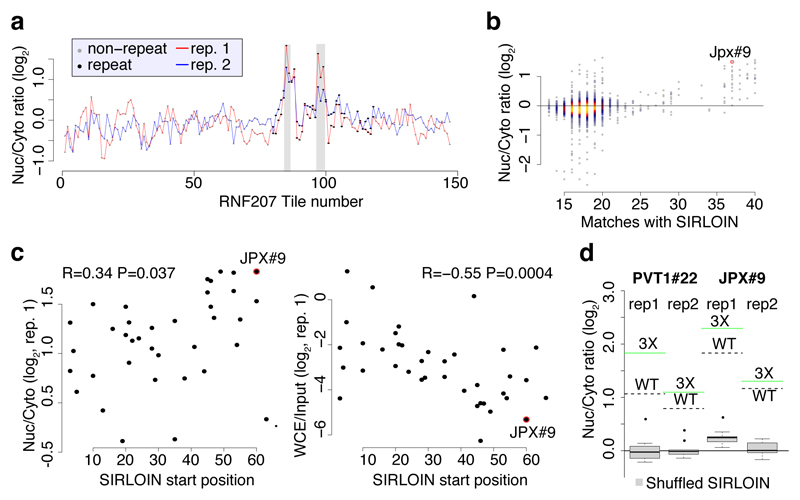
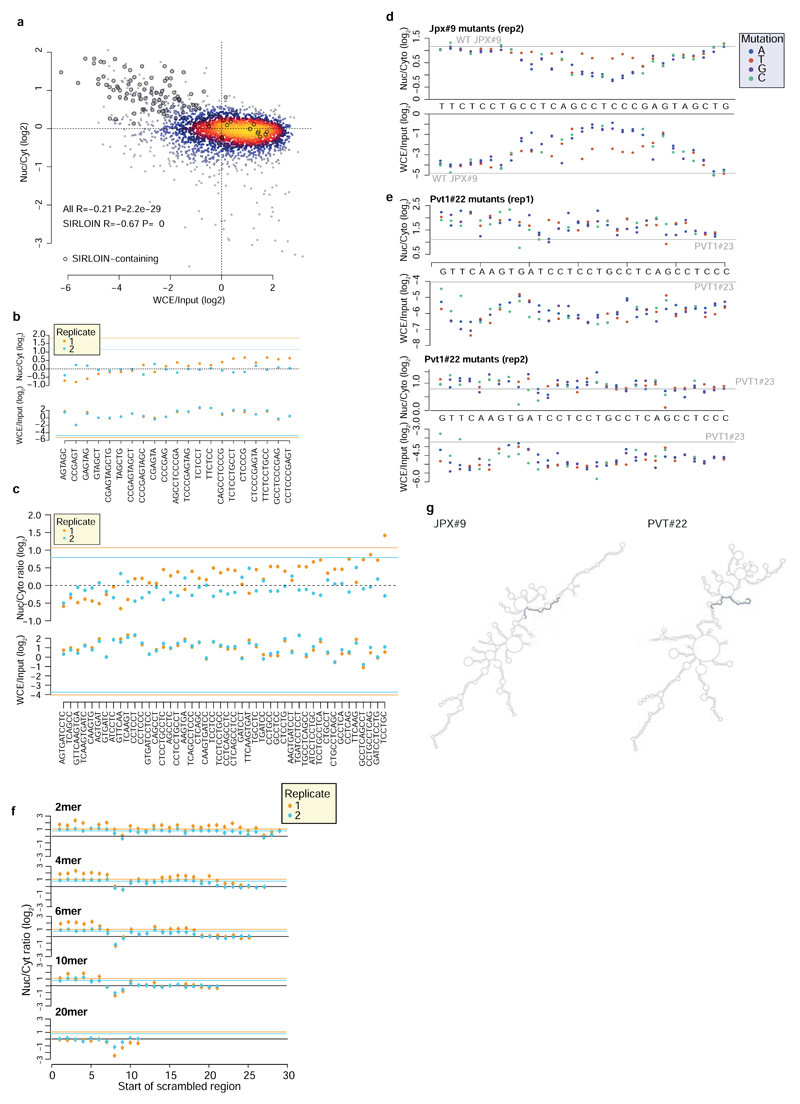
We next designed and cloned into the 3' UTR of the AcGFP mRNA a second library, NucLibB (Supplementary Tables 6-8), that included tiles from additional lncRNAs, mRNAs that overlapped SIRLOIN elements, and a large number of sequence variations within two 30 nt fragments of JPX#9 and PVT1#22 that were two of the most effective tiles in NucLibA. Using NucLibB we validated the nuclear-enrichment activity of the JPX and PVT1 SIRLOINs, and identified 18 additional SIRLOIN-overlapping regions from five lncRNAs and five mRNAs that led to nuclear enrichment (Supplementary Table 9). In some cases, several regions from the same transcript were effective in mediating nuclear localization (Figure 2a and Extended Data Figure 4) and SIRLOIN-matching elements were consistently active (Figure 2b). SIRLOIN-containing sequences in NucLibB also had a substantial negative impact on expression levels, which correlated with effects on localization (Spearman R=–0.6, P<10-16, Extended Data Figure 5a). Interestingly, among the SIRLOIN-containing sequences in NucLibB, those that had a SIRLOIN closer to the 3' end were more enriched in the nucleus (R=0.34, P=0.037) and more poorly expressed (R=−0.55, P=0.0004), suggesting that SIRLOIN context affects its activity (Figure 2c).
Figure 2. NucLibB analysis.
a, Effects of the tiles in RNF207 mRNA, otherwise as in 1a. b, Similarity to a SIRLOIN element (number of matching bases, without allowing indels) and Nuc/Cyt ratios in NucLibB. Coloring indicates the local point density. Only wt tiles were used, n=1,465. c, SIRLOIN position in the tile and localization (left) or expression levels (right). Spearman correlation, n=52. d, Boxplots show 5th, 25th, 50th, 75th and 95th percentiles of Nuc/Cyt ratios of shuffled, dinucleotide-preserving sequences of the indicated tiles (n=10). Horizontal lines show the effects of the WT sequence and of sequences containing 3 core parts of the SIRLOIN element (underlined in Figure 1c).
Shuffled SIRLOIN sequences of JPX#9 and PVT1#22 (preserving their dinucleotide composition) did not impose nuclear enrichment, as expected (Figure 2d). Three repeats of core SIRLOIN parts from JPX#9 and PVT1#22 cloned into one tile caused stronger nuclear enrichment than sequences containing only one SIRLOIN element (3.26 vs. 2.4-fold on average, Figure 2d). NucLibB also contained sequences composed of repetitions of individual 6- or 10-mers from the cores of JPX#9 and PVT1#22 SIRLOIN elements, separated by AT dinucleotides. While we observed more nuclear-enrichment activity from the C/T-rich elements (Extended Data Figure 5b-c), such sequences exerted very limited effects on either nuclear enrichment or expression levels, suggesting that secondary structure or sequences beyond the C/T-rich motifs are important for SIRLOIN function.
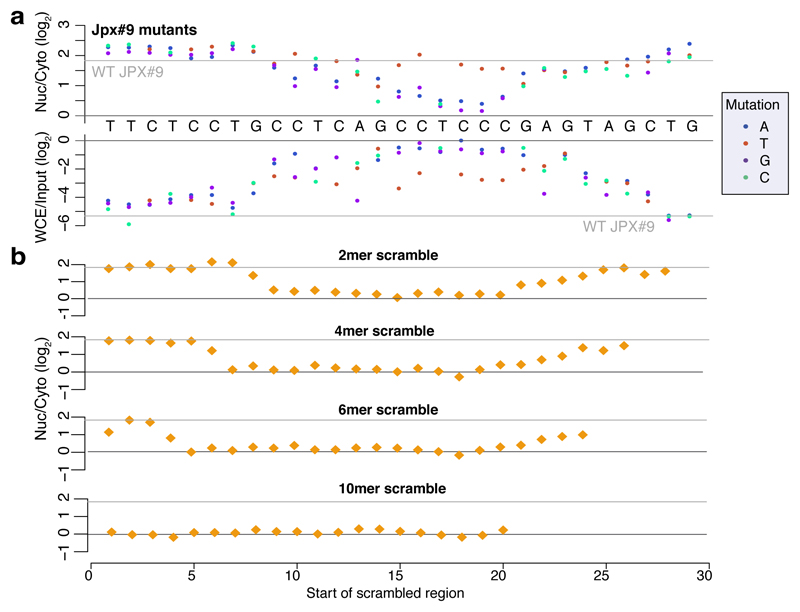
Single point mutations to purines (A/G) in the second RCCTCCC motif of JPX#9 were sufficient to abolish the effect of the sequence on both localization and expression levels, whereas C→T mutations in that region had little effect (Figure 3a and Extended Data Figure 5d). More extensive changes, alternating A↔T and G↔C, were deleterious also when made outside of the RCCTCCC motif, suggesting that additional parts of SIRLOIN are essential for its function, but can tolerate single base changes (Figure 3b). The PVT1#22 sequence was interestingly more resilient to changes, and single point mutations had a limited effect on activity (Extended Data Figure 5e). More extensive changes to PVT1#22, including mutating four bases in the 3' part of its SIRLOIN element, were sufficient to abolish activity (Extended Data Figure 5f). We conclude that the second RCCTCCC motif is the most important part of the SIRLOIN element, but that other SIRLOIN regions also contribute to its function.
Figure 3. Effect of SIRLOIN sequence changes on element activity.
a, Localization (top) and expression levels (bottom) for sequence variants that are identical to JPX#9 except for the indicated base change. Horizontal gray line indicates the corresponding level for the wt sequence. b, Localization for sequences where the indicated number of bases were scrambled with C↔G and A↔T changes. The position of the point indicates the first base of the scrambled region.
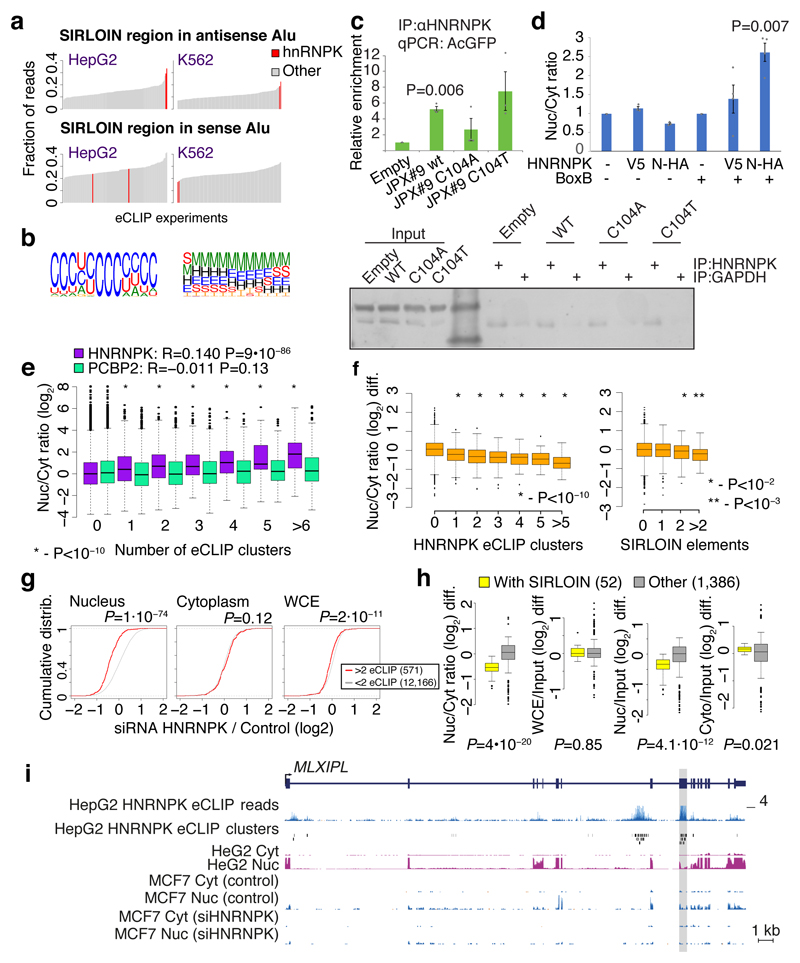
We next hypothesized that SIRLOIN elements act through interactions with specific RNA-binding proteins. To this end, we queried the ENCODE eCLIP datasets for protein-RNA interaction sites specifically enriched in SIRLOINs (see Methods). eCLIP experiments for HNRNPK, an abundant nuclear RNA binding protein with known roles in the biology of specific lncRNAs18,19, ranked first among 112 factors in this analysis (Supplementary Table 11 and Figure 4a). Reassuringly, the motif enriched in the HNRNPK binding peaks throughout the transcriptome, as identified by GraphProt20 (see Methods), was a pyrimidine-rich sequence with a CCTCC core (Figure 4b), consistent with the known preferences of HNRNPK for C-rich sequences21, and matching the RCCTCCC sequence we identified in the mutagenesis analysis. Moreover, the three KH RNA-binding domains of HNRNPK were previously shown to act cooperatively in binding sequences with triplets of C/T-rich regions22, fitting the sequence architecture of the SIRLOIN elements. GraphProt analysis also suggested the C/T-rich motif is preferentially bound in a structured context (Figure 4b), consistent with our observation that simple repeats of short motifs from SIRLOIN were not functional. Using RNA immunoprecipitation (RIP) with an HNRNPK-specific antibody, we validated that HNRNPK binds to AcGFP mRNA supplemented with SIRLOIN elements, but not to a single-nucleotide mutant that was not effective in nuclear enrichment (Figure 4c). Tethering of an HNRNPK protein to the 3' UTR of a Luciferase mRNA using a λN peptide-BoxB system23 was sufficient for inducing a ~3-fold nuclear enrichment, suggesting a direct causal role of HNRNPK in the process (Figure 4d).
Figure 4. HNRNPK drives nuclear localization of SIRLOIN-containing transcripts.
a, HNRNPK binding sites are enriched in the SIRLOIN element within Alu repeats (see Methods). b, Sequence (left) and structure (right) logo of the motif enriched in HNRNPK eCLIP clusters (HepG2 cells, first replicate), as identified by GraphProt. Structural annotation: stems (S), external regions (E), hairpins (H), internal loops (I), multiloops (M) and bulges (B). c, Enrichments of the AcGFP RNA with the indicated inserts following immunoprecipitation (IP) using an HNRNPK antibody, normalized to the GAPDH antibody. n=4 independent experiments. P-values computed using two-sided t-test. Mean±SEM shown. d, Localization of Renilla luciferase mRNA with and without five BoxB hairpins in the 3' UTR, either without expression of exogenous HNRNPK (-) or with expression of an HNRNPK fused to the indicated tag (V5 or N-HA, which binds BoxB). n=3–4 independent experiments, P-value computed using two-sided t-test. Bars show mean±SEM. e, Localization vs. number of eCLIP clusters in HepG2 cells. Asterisks indicate significant difference between genes with the indicated number of clusters and genes without clusters (two-sided Wilcoxon). Boxplots show 5th, 25th, 50th, 75th and 95th percentiles. n>60 genes in each group. f, Change in the Nuc/Cyt ratio following HNRNPK knockdown. P-values computed using two-sided Wilcoxon compared to genes with no eCLIP clusters or no SIRLOIN elements). Boxplots show 5th, 25th, 50th, 75th and 95th percentiles. n>60 genes in each group. g, Changes in expression following HNRNPK knockdown in the indicated sample (two-sided Wilcoxon). h, Changes in the indicated ratios for NucLibB fragments following HNRNPK knockdown. Each plot shows the difference between the ratio following transfection of HNRNPK siRNA and a non-targeting control. Boxplots show 5th, 25th, 50th, 75th and 95th percentiles. P-values computed using two-sided Wilcoxon test. i, HNRNPK binding and the MLXIPL gene. eCLIP reads/clusters are from HepG2 cells (replicate 1) from the ENCODE data portal. Expression levels in HepG2 nuclear levels were capped to allow visual comparison. The exon enriched with HNRNPK binding is shaded.
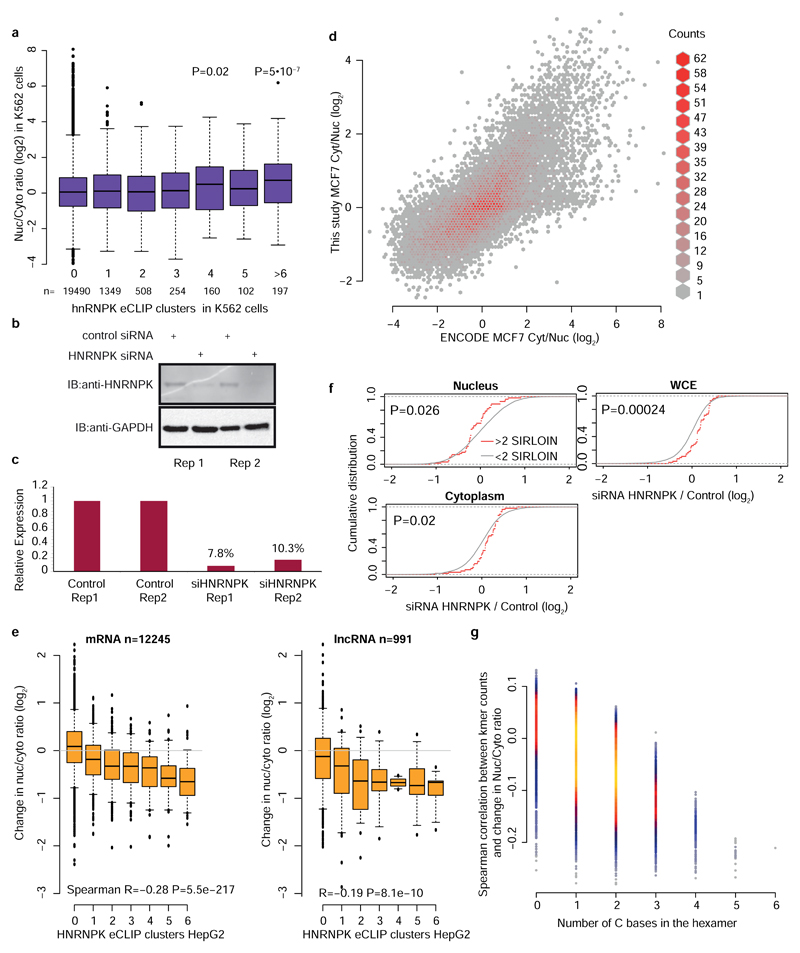
We then tested whether HNRNPK binding was also associated with nuclear enrichment in transcripts that do not contain SIRLOIN elements. Strikingly, the number of HNRNPK binding clusters in eCLIP data correlated with stronger nuclear enrichment of lncRNAs and mRNAs in HepG2 cells (Figure 4e, Spearman R=0.14 P<10-16, see Supplementary Table 11 for correlations with other factors) and to a lesser extent in K562 cells (R=0.05, P=3.6×10⁻⁷, Extended Data Figure 6a), and this correlation was essentially identical when considering only transcripts that did not contain any SIRLOIN elements (R=0.15 for HepG2). The correlation between HNRNPK binding events and nuclear enrichment was highly significant when controlling for transcript length and expression levels (R=0.2, P<10-16 in HepG2 cells and R=0.07, P<10-16 in K562 cells). Simple counts of C-rich motifs in transcript sequences were also significantly correlated with nuclear enrichment, with stronger correlations when considering counts only in the internal exons (Supplementary Note 2 and Extended Data Figure 7). In contrast, in K562 cells there was no correlation between the number of HNRNPK eCLIP clusters and chromatin/nucleoplasm ratios (R=-0.006, P=0.57; R=-0.01, P=0.0169 when controlling for expression levels and transcript length). There was no correlation between nuclear enrichment and number of eCLIP binding peaks of a different poly(C) binding protein, PCBP2 (HepG2 cells, Figure 4e).
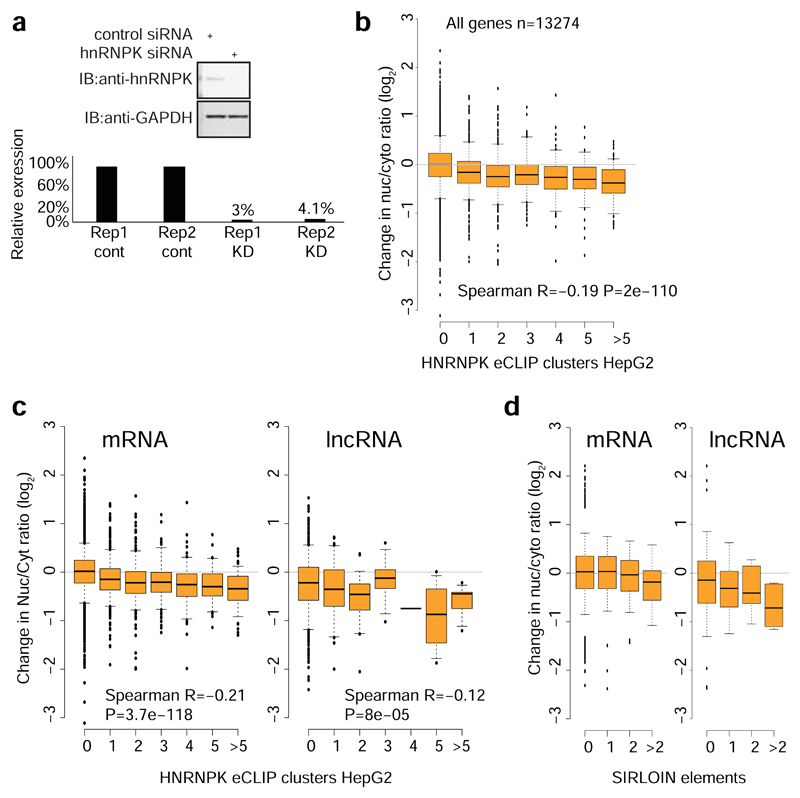
To validate the role of HNRNPK in regulation of its bound targets, we knocked down HNRNPK in MCF7 cells using siRNAs (Extended Data Figure 6b-d). Following HNRNPK knockdown, we observed a substantial effect on subcellular enrichment of hundreds of genes, with 397 genes becoming 2-fold more nuclear enriched and 283 genes becoming more cytoplasmic. Decrease in nuclear enrichment was significantly correlated with the number of HNRNPK eCLIP clusters (Spearman R=-0.22 between change in Nuc/Cyt ratio and number of eCLIP clusters, P<10-16; R=-0.26 partial correlation controlling for transcript length and expression levels in MCF7 cells, Figure 4f); with similar effects observed in mRNAs and lncRNAs (Extended Data Figure 6e). Genes with >1 SIRLOIN elements were significantly less enriched in the nucleus following HNRNPK knockdown (Figure 4f and Extended Data Figure 6f). Interestingly, when examining eCLIP-defined targets, changes in nuclear enrichment were mostly due to a reduction of transcript levels in the nucleus (21% on average) accompanied by mild increase in cytoplasmic levels (10% on average), overall resulting in slightly decreased expression levels of HNRNPK targets following knockdown (4% on average, Figure 4g). Similar results were obtained following HNRNPK knockdown in HeLa cells (Extended Data Figure 8), and when testing the NucLibB library following HNRNPK knockdown (Figure 4h and Supplementary Note 3). These results suggest that HNRNPK binding drives nuclear enrichment driven by SIRLOIN elements, but other factors likely contribute to decrease in overall expression levels associated with SIRLOIN integration.
Our observation of repeated C/T-rich elements globally associated with nuclear enrichment and lower expression levels are also supported by previous studies of individual mRNAs and lncRNAs. For example, nuclear retention elements have been previously associated with decreased overall expression levels in β-globin mRNA24. An AGCCC motif has been reported to be important for nuclear retention of the BORG lncRNA6. A survey of known nuclear enrichment elements in ExportAid25 revealed several viral sequences containing closely spaced C/T hexamers, such as the Cis-acting Inhibitory Element (CIE) of the HTLV-1 and the two short polypyrimidine tracts associated with nuclear retention in HBV26. Viral RNAs may thus also rely on HNRNPK-mediated nuclear enrichment for maintaining low expression levels and nuclear retention during latency. Surprisingly, some well-studied nuclear lncRNAs, such as XIST and NEAT1 did not contain any regions which exhibited consistent nuclear-enrichment activity in our system, suggesting that their regions encoding nuclear enrichment are either longer than the 109 nt tiles, or are not active in our specific expression context. The MALAT1 ~600 nt “region M” sequence5 causes strong nuclear enrichment in our system (Figure 1e), and another group found longer regions driving nuclear localization in XIST and other lncRNAs27 and so we suggest that multiple independent pathways are likely responsible for nuclear enrichment in lncRNAs and mRNAs, recognizing specific RNA sequences and/or other features of the RNP. It is also likely that the nuclear retention of individual RNA molecules is affected by more than one pathway. Since the contribution of each SIRLOIN element to nuclear enrichment, at least in the UTR context, is ~2-fold, additional pathways likely contribute to localization of those SIRLOIN-containing RNAs that are strongly enriched in the nucleus (e.g., PVT128).
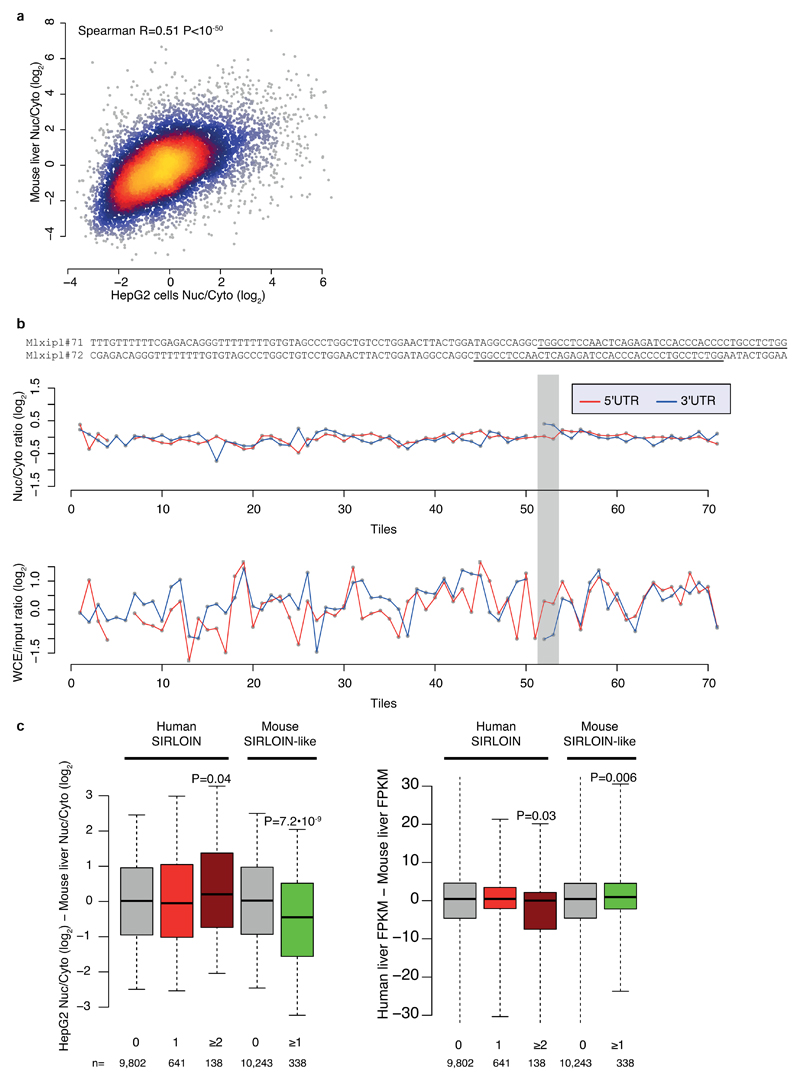
The pathway uncovered here is likely relevant for at least some of the transcripts previously observed to be enriched in the nucleus in vivo in mice3 (Supplementary Note 4). For instance, the transcription factor MLXIPL (also known as ChREBP) was previously shown to be retained in nuclear speckles in the mouse liver, beta cells, and intestine3. MLXIPL has a long internal exon containing multiple HNRNPK binding sites, is strongly enriched in the nucleus in various human cell lines, and was strongly affected by HNRNPK knockdown in MCF7 cells (Figure 4i). We also identified a SIRLOIN-like element in the mouse B1 repeats, and together with the human SIRLOIN element it appears to have contributed to divergence in expression levels and localization between the two species (Supplementary Note 4 and Extended Data Figure 9).
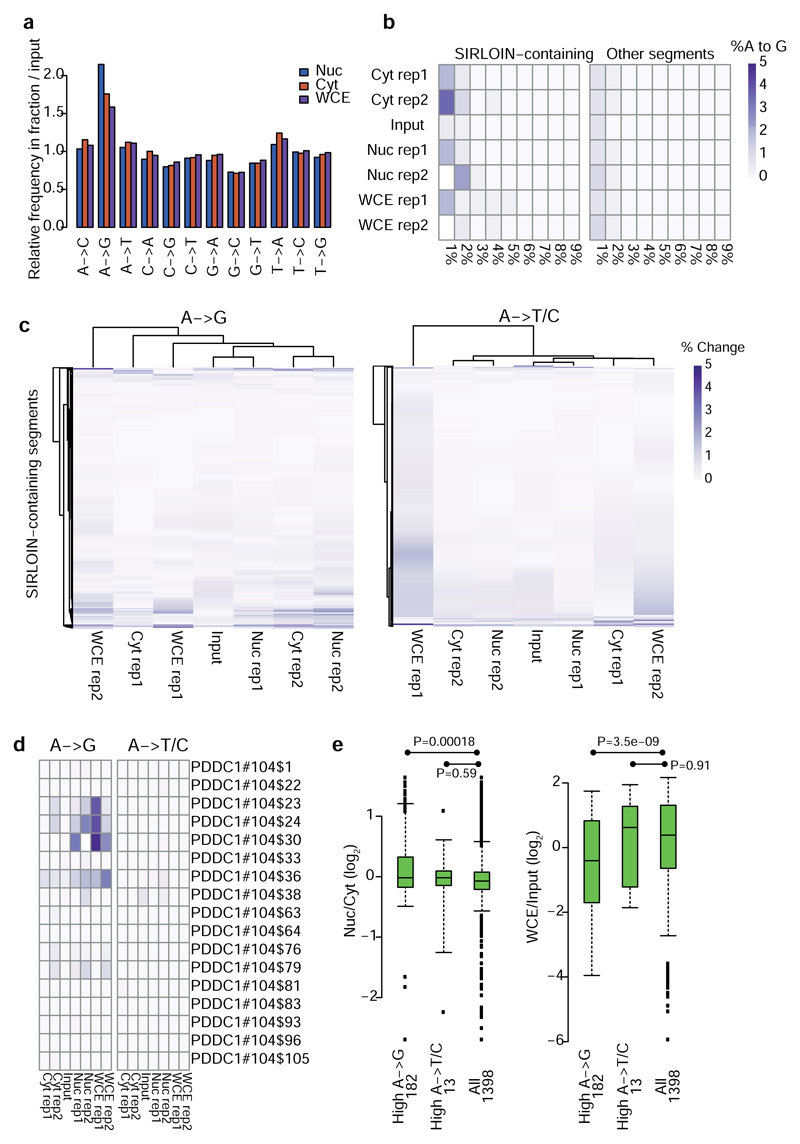
The mechanism through which HNRNPK affects nuclear enrichment is currently unclear. Since HNRNPK is interacting with splicing factors and was shown to affect splicing of specific genes29, and intron retention is associated with nuclear retention30, the HNRNPK-induced nuclear enrichment could be mediated by effects on RNA splicing, however this is unlikely to be the case (Supplementary Note 5). RNA editing, which was suggested to play a causal role in nuclear retention of inverted Alu repeats7 is also unlikely to be involved (Supplementary Note 6 and Extended Data Figure 10).
The nuclear enrichment mechanism we discovered is more common in lncRNAs, but also employed by some mRNAs, and so highlights the opportunities embodied in studying lncRNAs, which employ unique functional mechanisms and are under different selective pressures than mRNAs, to a general enhancement of our understanding of RNA biology. We expect that increasing understanding of the repertoire of lncRNA functions in cells will enable similar high-throughput approaches for identification of additional sequence and structural elements shared across lncRNAs, and expedite classification of these enigmatic genes into functional families.
Methods
Cell culture and transfection
MCF7 and HeLa cells (ATCC) were grown in DMEM (Gibco) containing 10% fetal bovine serum and Penicillin-Streptomycin mixture (1%) at 37°C in a humidified incubator with 5% CO2. Cell lines have not been authenticated and were routinely tested for mycoplasma contamination. Plasmids transfections were performed using PolyEthylene Imine (PEI)31 (PEI linear, Mr 25000, Polyscience Inc). RNA was extracted 24hr following library transfections.
Library design
Oligonucleotide pools were purchased from Twist Bioscience (San Francisco, CA). Tiles overlapping EcoRI, BglII, BamHI recognition sequences were excluded in both libraries and tiles overlapping HindIII, XbaI and NotI were also excluded in NucLibA.
Plasmid library construction
Oligo pool was amplified by PCR (25ng template in 4.8ml reaction, divided into 96 50µl reactions, see Supplementary Table 12 for primer sequences), concentrated using Amicon tubes (UFC503096, Millipore) and purified using AMpure beads (A63881, Beckman) at 2:1 beads:sample ratio according to manufacturer’s protocol. The insert was digested with EcoRI and BglII and cloned into likewise digested pAcGFP1-C1 or pAcGFP1-N1 (Clontech) for 3’ and 5’ insertion respectively.
The ligation was transformed into E. coli electrocompetent bacteria (60117-2, Lucigen) and plated on 15x15cm LB/Amp agar plates. Colonies were scraped off the plate and DNA was extracted using plasmid maxi kit (12163, Qiagen).
Extraction of cytoplasmic and nuclear RNA
Cells were washed twice in cold PBS and resuspended in 300µl RLN buffer (50mM Tris•Cl pH8, 140mM NaCl, 1.5mM MgCl2, 10mM EDTA, 1mM DTT, 0.5% NP-40, 10U/ml RNAse inhibitor) and incubated on ice for 5 min. The extract was centrifuged for 5min at 300g in a cold centrifuge and the supernatant was transferred to a new tube, centrifuged again for 1min at 500g in a cold centrifuge, the supernatant (cytoplasmic fraction) was transferred again to a new tube and RNA was extracted using TRIREAGENT (MRC). The nuclear pellet was washed once in 300µl buffer RLN and resuspended in 1ml of buffer S1 (250mM Sucrose, 10mM MgCl2, 10U/ml RNAse inhibitor), layered over 3ml of buffer S3 (880mM Sucrose, 0.5mM MgCl2, 10U/ml RNAse inhibitor), and centrifuged for 10min at 2800g in a cold centrifuge. The supernatant was removed and RNA was extracted from the nuclear pellet using TRIREAGENT.
Sequencing library generation
One microgram of RNA was used for cDNA production using the qScript Flex cDNA synthesis kit (95049, Quanta) and a gene specific primer containing part of the Illumina RD2 region. The entire cDNA reaction was diluted into 100µl second strand reaction with a mix of 6 primers introducing a unique molecular identifier (UMI) and a shift as well as part of the Illumina RD1 region. The second strand reaction was carried for a single cycle using Phusion Hot Start Flex DNA Polymerase (NEB, M0535), purified using AMpure beads at 1.5:1 beads: sample ratio, and eluted in 20µl of ddH2O. 15µl of the second strand reaction were used for amplification with barcoded primers, the amplified libraries were purified by two-sided AMpure purification first with 0.6:1 beads to sample ratio followed by a 1:1 ratio.
NucLibA samples were sequenced with 119 nt reads and the NucLibB samples with 75 nt paired-end reads on an Illumina NextSeq 500 machine.
Library data analysis
The sequenced reads were used to count individual library tiles using a custom Java script. We only considered R1 reads that contained the TTGATTCGATATCCGCATGCTAGC adapter sequence, and extracted the unique molecular identifier (UMI) sequence preceding the adapter. In R2 read, we removed the CGGCTTGCGGCCGCACTAGT adaptor and added the 3 bases preceding it to the UMI. Each read was then matched to the sequences in the library, without allowing indels. The matching allowed mismatches only at position with Illumina sequencing quality of at least 35 and we allowed up to two mismatches in the first 15 nt (“seed”), and no more than 4 overall mismatches. If a read matched more than one library sequence, the sequence with the fewest mismatches was selected, and if the read matched more than one library sequence with the same number of mismatches, it was discarded. Per-read mismatches were counted for the RNA editing analysis. See Supplementary Table 3 for read mapping statistics. The output from this step was a table of counts of reads mapping to each library sequence in each library (Supplementary Tables 2 and 7).
Only fragments with at least 10 reads on average in the WCE samples were used in subsequent analysis (5,153 fragments in NucLibA), and the number of UMIs mapping to each fragment was normalized to compute UPMs (UMI per million UMIs). We then used those to compute nuclear/cytoplasmic and WCE/input ratios after adding a pseudocount of 0.5 to each UPM (Supplementary Tables 4 and 8).
Human transcriptome analysis
RefSeq transcript database (downloaded from the UCSC genome browser hg19 assembly on 30/06/2016) was used for all analyses, unless noted otherwise. Only transcripts of exonic length of at least 200 nt were considered, and for entries mapping to multiple genomic loci, only one of the loci was used. We quantified the isoform-level expression levels using RSEM32 v1.2.31 in the ENCODE data (parameters --no-bam-output --bowtie2 --p 32 --forward-prob 0) and computed the average fraction of each isoform among the isoforms of each gene. Only isoforms whose relative abundance was >25% were considered. Fold-changes between nuclear and cytoplasmic fractions were computed using DESeq233 v1.12.4 with default parameters. A transcript was considered to contain a SIRLOIN element or its antisense if it aligned with the sequence (without indels) with no more than eight mismatches.
Alternative isoform analysis
For comparison of alternative isoforms containing SIRLOIN elements, we used the GENCODE v26 transcript annotations, excluding transcripts with “retained_intron” biotype to avoid likely targets of nonsense mediated decay. Transcript expression levels were quantified using RSEM, and only transcripts with FPKM(nucleus)+FPKM(cytoplasm)≥1 on average across the two replicates and isoform usage >5% in at least one fraction were considered. For each of these transcripts, we computed the log2-transformed fold changes between the nuclear and the cytoplasmic expression levels, adding a pseudocount of 0.5 to each FPKM, and averaged the ratios between the two replicates. We then considered genes that had at least one isoform with a SIRLOIN in an internal exon and one isoform without, and averaged the nuclear/cytoplasmic ratios for the isoforms in each group, resulting in two values per gene. These were then compared using Wilcoxon rank-sum test for paired samples. Selected pairs were then further validated by RT-PCR (Extended Figure 3a). Cytoplasmic and nuclear RNA were extracted as described above and cDNA was generated with qScript Flex cDNA synthesis kit (95049, Quanta), using oligo-dT. PCR was preformed using Phusion Hot Start Flex DNA Polymerase (NEB M0535).
eCLIP data analysis
For alignment of eCLIP reads to Alu elements, We built a STAR aligner34 index using the JPX and PVT1 Alu fragments, and aligned library reads to it using STAR with parameters: --outSAMstrandField intronMotif --readFilesCommand zcat --runThreadN 32 --outSAMtype BAM SortedByCoordinate --outWigType bedGraph read1_5p. We then computed for each experiment the number of R2 reads whose 5' base mapped within the SIRLOIN fragment in either PVT1 or JPX sequence compared to the rest of the Alu sequence in each orientation (Supplementary Table 10).
In order to identify the sequence and structural preferences of the motif in HNRNPK eCLIP clusters, we downloaded the eCLIP binding clusters identified by the ENCODE pipeline (accession ENCFF861DAK) from the ENCODE portal and used GraphProt15 with default parameters (‘train’ module) to compare the eCLIP peaks to control peaks randomly sampled peaks of the same length from the same transcripts. The model identified by GraphProt had accuracy of 93% on this training and the sequence and structure motif logos were obtained from it using GraphProt with default parameters (‘motif’ module).
RIP
RNA IP was performed according to the native RIP protocol described in Gagliardi & Matarazzo35. Anti-HNRNPK (RN019P, MLB) and Anti-GAPDH (C-2118S, Cell Signaling) were pre-incubated for 1h with protein-A/G magnetic beads (L00277, A2S) at 5µg antibody/ 50µl bead slurry. Extract from 2x10⁶ cells was added to the beads and incubated overnight rotating at 4°c. Precipitated RNA was extracted and analyzed by RT-qPCR (see Supplementary Table 12 for primers).
Imaging Flow Cytometry
MALAT1 and AcGFP mRNAs were labeled using the PrimeFlow RNA Assay kit (88-18009-204 Affymetrix) according to the manufacturer’s protocol. MALAT1 probes were labeled with Alexa Flour 647 (VA1-11317) and AcGFP probes were labeled with Alexa Flour 750 (VF6-14335), nuclei were stained with DAPI. Cells were visualized using the ImageStream®X Mark II (Amnis) and images were analyzed using image analysis software (IDEAS 6.2; Amnis Corp). Images were compensated for fluorescent dye overlap by using single-stain controls. Cells were gated for single cells, using the area and aspect ratio features, and for focused cells, using the Gradient RMS feature, as previously described36. To calculate the nuclear fraction of each transcript, the intensity of either Alexa Flour 647 or Alexa Flour 750 within the nucleus (as defined by the Morphology mask on the DAPI staining - Channel 7) was measured, and divided by the total intensity for each cell.
RNA-seq
MCF7 or HeLa cells were transfected with 10nM siRNA pool targeting HNRNPK or with control pool (Dharmacon) using Lipofectamin 3000 reagent (L3000001, Thermo Fisher), RNA was extracted 72 hrs post-transfection and libraries were prepared using the SENSE mRNA-Seq Library prep kit (SKU: 001.24, Lexogen) according to manufacturer’s protocol.
RNA-seq reads were mapped to the human genome (hg19 assembly) with STAR40 v020201 and transcript levels were quantified using RSEM38 with parameters --no-bam-output --bowtie2 --p 32. Fold-changes were computed using DESeq239 with default parameters.
HNRNPK knockdown in cells expressing NucLibB
MCF7 cells were transfected with siRNA pool or non-targeting control as described above. 48 hours post transfection the cells were washed and transfected with NucLibB plasmid pool. RNA was extracted after an additional 24 hours and libraries were prepared as described above. Libraries were analyzed the same way as described above and nuclear/cytoplasmic, nuclear/input, cytoplasmic/input and WCE/input ratios were used after adding a pseudocount of 0.5 to each UPM. Ratios for the two HNRNPK siRNA replicates were averaged.
Splicing analysis
MCF7 knockdown data was analyzed using MISO37 v0.5.4 with default parameters comparing the HNRNPK KD samples to controls using differential splicing annotations obtained from the MISO website (miso_annotations_hg19_v2). After filtering for significant events (--num-inc 1 --num-exc 1 --num-sum-inc-exc 10 --delta-psi 0.20 --bayes-factor 10), only 45 events were significant in 30 comparisons (2 replicates, 3 fractions, 5 alternative splicing event types). Analysis of overall splicing efficiency was performed as previously described38, evaluating the fraction of intron spanning reads out of all the reads that overlap splice junctions.
Conservation analysis
RefSeq transcripts for which we quantified nuclear/cytoplasmic ratios were mapped to Ensembl transcripts and human and mouse orthologs were obtained from Ensembl Compara 80. Nuclear/cytoplasmic ratios were compared between HepG2 (ENCODE data) and mouse liver3 and expression levels between human liver expression (HPA data39) and ENCODE mouse liver expression, both quantified using RSEM (parameters --no-bam-output --bowtie2 --p 32). Only genes with FPKM≥0.5 in at least one of the datasets were considered for the analysis. Overlaps with Alu and B1 elements were computed using RepeatMasker data from the UCSC genome browser.
Hexamer analysis
Sequences for RefSeq transcripts described above were extracted from the UCSC genome browser. Occurrences of all possible hexamers (allowing overlaps) were counted in either all the exons, or just in the internal or terminal exons. Then, for each hexamer, the Spearman correlation coefficient was computed between the total number of occurrences of the motif and the nuclear/cytoplasmic ratio as computed by DESeq2 (with default parameters).
Tethering of hnRNPK to a reporter plasmid
pCIneo-RL-5xBoxB and pCIneo-N-HA were a kind gift from Ramesh Pillai. pT7-V5-SBP-C1-HshnRNPK was a gift from Elisa Izaurralde (Addgene plasmid #64923). pCIneo-RL was generated by digestion of pCIneo-RL-5xBoxB with XbaI and XhoI, the overhangs were filled in by Klenow polymerases and ligated.
N-HA-hnRNPK vector was generated by swapping the V5-SBP in pT7-V5-SBP-C1-HshnRNPK with the N-HA region from pCIneo-N-HA. Cells were transfected with the reporters in the presence of the different hnRNPK construct or of a control vector (pcDNA3.1), cytoplasmic and nuclear RNA was extracted 48hr post transfection. The expression of the construct was verified by western blotting using anti-V5 antibody (Abcam ab206564) and anti-HA antibody (BioLegend HA.11).
Statistics
All correlations were computed using Spearman correlation, unless otherwise indicated.
Extended Data
Extended Data Figure 1. Effects of tiles in NucLibA on localization.
Nuclear/cytoplasmic ratios for of all the tiles in the indicated lncRNAs when cloned into the indicated region of AcGFP. Tiles overlapping repetitive elements are in black and other tiles are in gray. Regions with segments containing the SIRLOIN elements are shaded.
Extended Data Figure 2. Nuclear/cytoplasmic ratios for lncRNAs and mRNAs.
a, Nuclear/cytoplasmic expression ratios for mRNAs and lncRNAs containing the indicated number of SIRLOIN elements or SIRLOIN reverse complement (antisense) in MCF7 cells (ENCODE data). Otherwise, as indicated in 1f. b, Nuclear/cytoplasmic expression ratio in mRNAs (left) and lncRNAs (right) in ten ENCODE cell lines. Transcripts without SIRLOIN elements, with two SIRLOIN elements, with a SIRLOIN element in one of the internal exons, or with two antisense SIRLOIN elements are compared. Asterisks above the “2 SIRLOIN” and “Internal SIRLOIN” boxes indicate P<0.01 by two-sided Wilcoxon test relative to the genes with no SIRLOIN elements. Asterisks above the “2 Antisense” boxes indicate P<0.01 relative to the “2 SIRLOIN” boxes. Otherwise, as indicated in 1g. n=29–16,694 genes per group. c, A rearranged version of part of b which facilitates visual comparison between mRNAs with at least two SIRLOIN elements and lncRNAs without SIRLOIN elements. Asterisks indicate P<0.01 by two-sided Wilcoxon test. n=50–16,694 genes per group.
Extended Data Figure 3. Comparison of splicing isoforms, chromatin enrichment and mRNA half-lives.
a, Semi-quantitative RT-PCR in the indicated fraction (left) and gene structures (right) of genes with multiple alternative isoforms, some of which contain SIRLOIN elements. Gene structures taken from RefSeq, UCSC or GENCODE genes, and Alu annotations are from the UCSC genome browser. Arrows indicate positions of the primers used for RT-PCR. RNA-seq coverage taken from MCF-7 RNA-seq from the ENCODE project. Experiments were repeated once. b, RNA-seq–based expression ratios comparing nuclear/cytoplasmic, chromatin/nucleoplasmic, and nucleolar/nucleoplasmic RNA fractions for RNAs with the indicated number of SIRLOIN or antisense SIRLOIN elements (data from the ENCODE project). n=82–17,481 genes per group. Boxplots show 5th, 25th, 50th, 75th and 95th percentiles. P-values computed using two-sided Wilcoxon test. c, Comparison of half-lives in MCF-7 cells9 for the protein-coding genes with the indicated number of SIRLOIN elements. Boxplots show 5th, 25th, 50th, 75th and 95th percentiles.
Extended Data Figure 4. Nuclear/cytoplasmic ratios for NucLibB tiles.
Effects of all the tiles in the indicated lncRNAs and mRNAs on nuclear/cytoplasmic expression ratios when cloned into the 3' UTR of AcGFP. Tiles overlapping other repetitive elements are in black, and other tiles are in gray. Regions of consecutive tiles overlapping SIRLOIN elements are shaded in gray.
Extended Data Figure 5. Statistics and mutagenesis results in NucLibB.
a, Correlation between nuclear/cytoplasmic ratios and expression levels of sequences in NucLibB (only WT sequences were analyzed and two replicates were pooled, n=2,930 for all data and n=104 for SIRLOIN data). SIRLOIN-containing sequences are circled. Coloring indicates the local point density. Both replicates are plotted together and correlations and P-values were computed using Spearman correlation. b-c, Nuc/Cyt ratios and expression levels of 109 nt fragments containing repetitions of the indicated motifs from JPX#9 (b) and NucLibA PVT1#22 (c), separated by “AT” dinucleotides. Horizontal lines indicate levels of NucLibB JPX#9 (b) and PVT1#23 (c) sequence (the closest to the NucLibA PVT1#22 sequence). d, Effects of mutations in repeat 2 of JPX#9 on localization (top) and expression levels (bottom). e, Effects of mutations in PVT1#22. Note that the WT sequence of PVT1#22 from NucLibA was not included in NucLibB, and so the values of PVT1#23, which is the closest to that sequence in NucLibB is shown. f, Effect of shuffles of the indicated kmers in PVT1#22 sequence. g, Predicted secondary structures of full-length AcGFP mRNA with the indicated inserts. Secondary structure prediction by the Vienna package RNAfold server with default parameters. The SIRLOIN elements are indicated in blue.
Extended Data Figure 6. HNRNPK regulation in K562 and MCF7 cells.
a, Ratios of expression levels in the nucleus/cytoplasm for transcripts with the indicated number of eCLIP clusters for HNRNPK in K652 cells. P-values indicate significance difference by two-sieded Wilcoxon test between the genes with the indicated number of clusters and genes without eCLIP clusters. Boxplots show 5th, 25th, 50th, 75th and 95th percentiles. b, Knockdown of HNRNPK in MCF7 cells using siRNAs assessed by Western blot. Experiment was performed twice and both replicates are shown. c, HNRNPK mRNA levels measured by qRT-PCR. Each bar presents a single independent experiment. d, Correlation between cytoplasmic/nuclear ratios in MCF7 cells in the ENCODE data and in the RNA-seq data collected in this study. Hexagons are colored based on the number of genes. n= 13,235. e, Ratios of expression levels in the nucleus/cytoplasm for transcripts with the indicated number of eCLIP clusters for HNRNPK in HepG2 cells, separately for lncRNAs and mRNAs. Otherwise as in 4f. f, Effects of HNRNPK knockdown on expression levels in the indicated sample, for lncRNAs and mRNAs containing the indicated number of SIRLOIN elements. Otherwise as in 4f. g, Spearman correlation coefficients between the number of appearances of hexamers in the internal exons of transcripts and the change in nuclear/cytoplasmic ratios following HNRNPK knockdown (average of two replicates). Hexamers are grouped by the number of C bases in the hexamer. Coloring indicates the local point density.
Extended Data Figure 7. Correlations between hexamer occurrences and nuclear/cytoplasmic ratios in human and mouse cells.
a, Spearman correlation coefficients between hexamers with the indicated number of bases and nuclear/cytoplasmic ratios in human HepG2 cells. Each point represents a hexamer sequence, the occurrences of which were counted in the all exons of all >200 nt RefSeq transcripts. Coloring indicates the local point density. R values indicate Spearman correlation coefficients between the number of indicated bases in the hexamer and the nuclear/cytoplasmic ratios b, Spearman correlation computed as in a, for each of ten human ENCODE cell lines, and three mouse cell types, when examining the indicated transcript types, and the indicated exon subsets.
Extended Data Figure 8. HNRNPK knockdown in HeLa cells.
a, Representative Western blot (top) and qRT-PCR quantification of HNRNPK knockdown (each bar is showing the level in a single experiment). Experiment was repeated twice. b, Changes in nuclear/cytoplasmic ratios of genes with the indicated number of HNRNPK eCLIP peaks following HNRNPK knockdown (DESeq2 analysis of two independent replicates). Otherwise as in Figure 4f. n=91–11,016 genes. c, As in b, separately for mRNA and lncRNAs. n=85–10,077 mRNAs per group, 6-939 lncRNAs per group. d, Changes in nuclear/cytoplasmic ratios of mRNAs and lncRNAs with the indicated number of SIRLOIN elements. Otherwise as in Figure 4f. n=53–11,172 mRNAs per group, 10-891 lncRNAs per group.
Extended Data Figure 9. SIRLOIN-like element in mouse.
a, Comparison of nuclear/cytoplasmic ratios for orthologous genes in human HepG2 cells (ENCODE data) and mouse liver3. n=10,160 conserved genes. Coloring indicates the local point density. Correlation computed using Spearman correlation. b, Top: sequences of the Mxlipl#71/72 tiles in NucLibA. Center: nuclear/cytoplasmic ratios for each tile with a sufficient number of reads in NucLibA. Bottom: WCE/input expression levels for each tile. The region of tiles #71-72 is shaded in gray. c, Left: Difference in log-transformed nuclear/cytoplasmic ratios between orthologous genes with the indicated number of human SIRLOIN elements or mouse SIRLOIN-like elements. Right: Differences in overall expression levels, human liver expression data taken from the Human Proteome Atlas39, mouse liver expression data taken from the ENCODE project. P-values computed using two-sided Wilcoxon test. Boxplots show 5th, 25th, 50th, 75th and 95th percentiles.
Extended Data Figure 10. RNA editing in SIRLOIN elements.
a, Normalized frequencies of all position base substitutions in each fraction, normalized to their occurrence in the input libraries. Samples from NucLibB were analyzed, and all these samples were sequenced in the same NextSeq sequencing run. The number of substitutions was tallied for reads with <6 mutations relative to the reference library sequence. The count of each mutation type in each sample was then divided by the total number of mutations in the sample, the two replicates were averaged, and the number of mutations in each sample type was divided by the number in the input library. b, For each reference A base in the indicated sample and the indicated group of segments, we computed the fraction of reads that contained a mutation to a G. The positions were then binned in 1% bins, and the heatmap shows that fraction of bases mapping to each bin. In all cases, >90% the As were found in the <1% editing bin, which is not shown. Each row corresponds to a single experiment. c, In each heatmap, each row corresponds to an A in a segment containing a SIRLOIN element, and the fraction of reads containing an A->G or A->T/C mutation is shown in each sample. Each column corresponds to a single experiment. d, Same as C, but showing a specific SIRLOIN-containing segment. e, Correlation between high levels of RNA editing, localization (left) and expression levels (right). “High A->X” are those segments where the mean A->X mutation levels were at least 3 times higher than the median across all segments, in at least 3 of the 4 libraries (Nucleus/Cytoplasm, 2 replicates). Numbers near each group name correspond to sample size. Nuc/Cyt and WCE/Input levels were averaged across the two replicates. Boxplots show 5th, 25th, 50th, 75th and 95th percentiles and P-values were computed using two-sided Wilcoxon test.
Supplementary Material
Supplementary Information is available in the online version of the paper.
Acknowledgements
We thank R. Pillai, S. Schwarz, S. Itzkovitz, N. Stern Ginossar, and members of the Ulitsky lab for helpful discussions and comments on the manuscript. We thank Z. Porat from the Weizmann Institute FACS core for assistance with Imaging Flow Cytometry. This research was supported by the Israeli Centers for Research Excellence [1796/12]; Israel Science Foundation [1242/14 and 1984/14]; European Research Council lincSAFARI; Minerva Foundation; Lapon Raymond; and the Abramson Family Center for Young Scientists. I.U. is incumbent of the Sygnet Career Development Chair for Bioinformatics.
Footnotes
Author contributions
Y.L. and I.U. conceived and designed the study. Y.L. carried out all experiments and I.U. carried out computational analysis. YL and IU wrote the manuscript.
Data availability
All sequencing data are available in the SRA database, accession SRP111756. Source data for figures 1b,d-g, 2a-d, 3a-b, and 4a,c-h are provided with the paper.
Author information: Reprints and permissions information is available at www.nature.com/reprints.
The authors declare no competing financial interests.
References
- 1.Ulitsky I, Bartel DP. lincRNAs: Genomics, Evolution, and Mechanisms. Cell. 2013;154:26–46. doi: 10.1016/j.cell.2013.06.020. [DOI] [PMC free article] [PubMed] [Google Scholar]
- 2.Derrien T, et al. The GENCODE v7 catalog of human long noncoding RNAs: Analysis of their gene structure, evolution, and expression. Genome research. 2012;22:1775–1789. doi: 10.1101/gr.132159.111. 22/9/1775 [pii] [DOI] [PMC free article] [PubMed] [Google Scholar]
- 3.Bahar Halpern K, et al. Nuclear Retention of mRNA in Mammalian Tissues. Cell reports. 2015;13:2653–2662. doi: 10.1016/j.celrep.2015.11.036. [DOI] [PMC free article] [PubMed] [Google Scholar]
- 4.Battich N, Stoeger T, Pelkmans L. Control of Transcript Variability in Single Mammalian Cells. Cell. 2015;163:1596–1610. doi: 10.1016/j.cell.2015.11.018. [DOI] [PubMed] [Google Scholar]
- 5.Miyagawa R, et al. Identification of cis- and trans-acting factors involved in the localization of MALAT-1 noncoding RNA to nuclear speckles. RNA. 2012;18:738–751. doi: 10.1261/rna.028639.111. rna.028639.111 [pii] [DOI] [PMC free article] [PubMed] [Google Scholar]
- 6.Zhang B, et al. A novel RNA motif mediates the strict nuclear localization of a long noncoding RNA. Molecular and cellular biology. 2014;34:2318–2329. doi: 10.1128/MCB.01673-13. [DOI] [PMC free article] [PubMed] [Google Scholar]
- 7.Chen LL, DeCerbo JN, Carmichael GG. Alu element-mediated gene silencing. The EMBO journal. 2008;27:1694–1705. doi: 10.1038/emboj.2008.94. [DOI] [PMC free article] [PubMed] [Google Scholar]
- 8.Prasanth KV, et al. Regulating gene expression through RNA nuclear retention. Cell. 2005;123:249–263. doi: 10.1016/j.cell.2005.08.033. [DOI] [PubMed] [Google Scholar]
- 9.Schueler M, et al. Differential protein occupancy profiling of the mRNA transcriptome. Genome biology. 2014;15:R15. doi: 10.1186/gb-2014-15-1-r15. [DOI] [PMC free article] [PubMed] [Google Scholar]
- 10.Versteeg R, et al. The human transcriptome map reveals extremes in gene density, intron length, GC content, and repeat pattern for domains of highly and weakly expressed genes. Genome research. 2003;13:1998–2004. doi: 10.1101/gr.1649303. [DOI] [PMC free article] [PubMed] [Google Scholar]
- 11.Lev-Maor G, Sorek R, Shomron N, Ast G. The birth of an alternatively spliced exon: 3' splice-site selection in Alu exons. Science. 2003;300:1288–1291. doi: 10.1126/science.1082588. [DOI] [PubMed] [Google Scholar]
- 12.Chen C, Ara T, Gautheret D. Using Alu elements as polyadenylation sites: A case of retroposon exaptation. Molecular biology and evolution. 2009;26:327–334. doi: 10.1093/molbev/msn249. [DOI] [PubMed] [Google Scholar]
- 13.Tajnik M, et al. Intergenic Alu exonisation facilitates the evolution of tissue-specific transcript ends. Nucleic acids research. 2015;43:10492–10505. doi: 10.1093/nar/gkv956. [DOI] [PMC free article] [PubMed] [Google Scholar]
- 14.Zarnack K, et al. Direct competition between hnRNP C and U2AF65 protects the transcriptome from the exonization of Alu elements. Cell. 2013;152:453–466. doi: 10.1016/j.cell.2012.12.023. [DOI] [PMC free article] [PubMed] [Google Scholar]
- 15.Kelley DR, Rinn JL. Transposable elements reveal a stem cell specific class of long noncoding RNAs. Genome biology. 2012;13:R107. doi: 10.1186/gb-2012-13-11-r107. gb-2012-13-11-r107 [pii] [DOI] [PMC free article] [PubMed] [Google Scholar]
- 16.Gong C, Maquat LE. lncRNAs transactivate STAU1-mediated mRNA decay by duplexing with 3' UTRs via Alu elements. Nature. 2011;470:284–288. doi: 10.1038/nature09701. nature09701 [pii] [DOI] [PMC free article] [PubMed] [Google Scholar]
- 17.Johnson R, Guigo R. The RIDL hypothesis: transposable elements as functional domains of long noncoding RNAs. RNA. 2014;20:959–976. doi: 10.1261/rna.044560.114. [DOI] [PMC free article] [PubMed] [Google Scholar]
- 18.Dimitrova N, et al. LincRNA-p21 activates p21 in cis to promote Polycomb target gene expression and to enforce the G1/S checkpoint. Molecular cell. 2014;54:777–790. doi: 10.1016/j.molcel.2014.04.025. [DOI] [PMC free article] [PubMed] [Google Scholar]
- 19.Chu C, et al. Systematic discovery of Xist RNA binding proteins. Cell. 2015;161:404–416. doi: 10.1016/j.cell.2015.03.025. [DOI] [PMC free article] [PubMed] [Google Scholar]
- 20.Maticzka D, Lange SJ, Costa F, Backofen R. GraphProt: modeling binding preferences of RNA-binding proteins. Genome biology. 2014;15:R17. doi: 10.1186/gb-2014-15-1-r17. [DOI] [PMC free article] [PubMed] [Google Scholar]
- 21.Choi HS, et al. Poly(C)-binding proteins as transcriptional regulators of gene expression. Biochemical and biophysical research communications. 2009;380:431–436. doi: 10.1016/j.bbrc.2009.01.136. [DOI] [PMC free article] [PubMed] [Google Scholar]
- 22.Paziewska A, Wyrwicz LS, Bujnicki JM, Bomsztyk K, Ostrowski J. Cooperative binding of the hnRNP K three KH domains to mRNA targets. FEBS letters. 2004;577:134–140. doi: 10.1016/j.febslet.2004.08.086. [DOI] [PubMed] [Google Scholar]
- 23.Baron-Benhamou J, Gehring NH, Kulozik AE, Hentze MW. Using the lambdaN peptide to tether proteins to RNAs. Methods in molecular biology. 2004;257:135–154. doi: 10.1385/1-59259-750-5:135. [DOI] [PubMed] [Google Scholar]
- 24.Akef A, Lee ES, Palazzo AF. Splicing promotes the nuclear export of beta-globin mRNA by overcoming nuclear retention elements. RNA. 2015;21:1908–1920. doi: 10.1261/rna.051987.115. [DOI] [PMC free article] [PubMed] [Google Scholar]
- 25.Giulietti M, Milantoni SA, Armeni T, Principato G, Piva F. ExportAid: database of RNA elements regulating nuclear RNA export in mammals. Bioinformatics. 2015;31:246–251. doi: 10.1093/bioinformatics/btu620. [DOI] [PubMed] [Google Scholar]
- 26.Roy D, Bhanja Chowdhury J, Ghosh S. Polypyrimidine tract binding protein (PTB) associates with intronic and exonic domains to squelch nuclear export of unspliced RNA. FEBS letters. 2013;587:3802–3807. doi: 10.1016/j.febslet.2013.10.005. [DOI] [PubMed] [Google Scholar]
- 27.Shukla CJ, et al. High-throughput identification of RNA nuclear enrichment sequences. bioRxiv. 2017 doi: 10.1101/189654. [DOI] [PMC free article] [PubMed] [Google Scholar]
- 28.Cabili MN, et al. Localization and abundance analysis of human lncRNAs at single-cell and single-molecule resolution. Genome biology. 2015;16:20. doi: 10.1186/s13059-015-0586-4. [DOI] [PMC free article] [PubMed] [Google Scholar]
- 29.Bomsztyk K, Denisenko O, Ostrowski J. hnRNP K: one protein multiple processes. BioEssays: news and reviews in molecular, cellular and developmental biology. 2004;26:629–638. doi: 10.1002/bies.20048. [DOI] [PubMed] [Google Scholar]
- 30.Braunschweig U, et al. Widespread intron retention in mammals functionally tunes transcriptomes. Genome research. 2014;24:1774–1786. doi: 10.1101/gr.177790.114. [DOI] [PMC free article] [PubMed] [Google Scholar]
- 31.Durocher Y, Perret S, Kamen A. High-level and high-throughput recombinant protein production by transient transfection of suspension-growing human 293-EBNA1 cells. Nucleic acids research. 2002;30:E9. doi: 10.1093/nar/30.2.e9. [DOI] [PMC free article] [PubMed] [Google Scholar]
- 32.Li B, Dewey CN. RSEM: accurate transcript quantification from RNA-Seq data with or without a reference genome. BMC bioinformatics. 2011;12:323. doi: 10.1186/1471-2105-12-323. [DOI] [PMC free article] [PubMed] [Google Scholar]
- 33.Love MI, Huber W, Anders S. Moderated estimation of fold change and dispersion for RNA-seq data with DESeq2. Genome biology. 2014;15:550. doi: 10.1186/s13059-014-0550-8. [DOI] [PMC free article] [PubMed] [Google Scholar]
- 34.Dobin A, et al. STAR: ultrafast universal RNA-seq aligner. Bioinformatics. 2013;29:15–21. doi: 10.1093/bioinformatics/bts635. [DOI] [PMC free article] [PubMed] [Google Scholar]
- 35.Gagliardi M, Matarazzo MR. RIP: RNA Immunoprecipitation. Methods in molecular biology. 2016;1480:73–86. doi: 10.1007/978-1-4939-6380-5_7. [DOI] [PubMed] [Google Scholar]
- 36.George TC, et al. Quantitative measurement of nuclear translocation events using similarity analysis of multispectral cellular images obtained in flow. J Immunol Methods. 2006;311:117–129. doi: 10.1016/j.jim.2006.01.018. [DOI] [PubMed] [Google Scholar]
- 37.Katz Y, Wang ET, Airoldi EM, Burge CB. Analysis and design of RNA sequencing experiments for identifying isoform regulation. Nature methods. 2010;7:1009–1015. doi: 10.1038/nmeth.1528. [DOI] [PMC free article] [PubMed] [Google Scholar]
- 38.Tilgner H, et al. Deep sequencing of subcellular RNA fractions shows splicing to be predominantly co-transcriptional in the human genome but inefficient for lncRNAs. Genome research. 2012;22:1616–1625. doi: 10.1101/gr.134445.111. 22/9/1616 [pii] [DOI] [PMC free article] [PubMed] [Google Scholar]
- 39.Fagerberg L, et al. Analysis of the human tissue-specific expression by genome-wide integration of transcriptomics and antibody-based proteomics. Molecular & cellular proteomics : MCP. 2014;13:397–406. doi: 10.1074/mcp.M113.035600. [DOI] [PMC free article] [PubMed] [Google Scholar]
Associated Data
This section collects any data citations, data availability statements, or supplementary materials included in this article.


