Abstract
Development of techniques for detection of mental fatigue has varied applications in areas where sustaining attention is of critical importance like security and transportation. The objective of this study is to develop a novel real-time driving fatigue detection methodology based on dry Electroencephalographic (EEG) signals. The study has employed two methods in the online detection of mental fatigue: power spectrum density (PSD) and sample entropy (SE). The wavelet packets transform (WPT) method was utilized to obtain the (4–7 Hz), (8–12 Hz) and (13–30 Hz) bands frequency components for calculating corresponding PSD of the selected channels. In order to improve the fatigue detection performance, the system was individually calibrated for each subject in terms of fatigue-sensitive channels selection. Two fatigue-related indexes: ()/ and / were computed and then fused into an integrated metric to predict the degree of driving fatigue. In the case of SE extraction, the mean of SE averaged across two EEG channels (‘O1h’ and ‘O2h’) was used for fatigue detection. Ten healthy subjects participated in our study and each of them performed two sessions of simulated driving. In each session, subjects were required to drive simulated car for 90 min without any break. The results demonstrate that our proposed methods are effective for fatigue detection. The prediction of fatigue is consistent with the observation of reaction time that was recorded during simulated driving, which is considered as an objective behavioral measure.
Keywords: Driving fatigue, Electroencephalogram, Dry electrodes, PSD and entropy, Channel selection
Introduction
The rising number of traffic accidents has became a major issue in our daily life and has attracted concern from both the society and the governments (Williamson et al. 2011). Experts agree that driving fatigue is a significant cause for traffic accidents and is believed to account for 20–30% of all vehicle accidents (Rau 2005). This, in reality, is a conservative estimate and it is understood that the actual contribution of fatigue to road accidents is significantly higher than the mentioned (Zhao et al. 2011). Mental fatigue is defined as a feeling of extreme physical or mental tiredness, resulting in the reduction of the ability of an individual to focus at a given task, leading to errors and an irregular driving aptitude (Khushaba et al. 2011). Behaviourally, an increase in reaction time and an increase in false alarms are classic estimators of the onset of mental fatigue (Ba et al. 2017). Therefore, the development of a wireless and mobile system that can identify fatigue status to prevent disastrous traffic events is a crucial and an urgent topic of study. Previous studies have focussed on the detection and quantification of fatigue by measuring physiological biomarkers extracted from electroencephalogram (EEG), electrooculogram (EOG), and electromyogram (EMG) (Kar et al. 2010; Hirvonen et al. 2010; Chew et al. 2016). Compared with machine vision based biometrics (Jo et al. 2011), neurophysiology-based measures provide a detailed account of the driver’s brain state by objective characterization of brain signals (LaFleur et al. 2013). Among numerous physiological indicators available to estimate the driver’s fatigue level, the EEG signal has been proven to be one of the most predictive and reliable indicator of task induced fatigue (Panicker et al. 2011). Previous efforts for development of automatic systems, to detect driver drowsiness from EEG signals, can be broadly classified into three categories (Wang et al. 2015; Zhao et al. 2017; Dai et al. 2017): (1) power spectrum based analysis, (2) entropy based analysis, (3) brain networks based analysis.
In this paper, we have used power spectrum analysis and entropy analysis as major estimators of mental fatigue. Several attempts have been made to predict driver drowsiness by detecting changes in all the major EEG frequency bands ( (0.5–3.5 Hz), (4–8 Hz), (8–13 Hz), (13–30 Hz)) (Eoh et al. 2005; Jap et al. 2009; Liang et al. 2006). These frequency bands provide a plethora of interesting and relevant information that can be used as features for classification of alert vs fatigued cognitive states. Established estimators like usage of statistically relevant features (mean, median, variance, standard deviation) of sub-bands and changes in power are some of the previous attempts made for prediction of mental fatigue using multi-channel EEG (Gharagozlou et al. 2015; Gurudath and Riley 2014). There have also been efforts for estimation of fatigue using signal channel but they have not yielded significant performance accuracy (Atchley et al. 2014). EEG signals are known to be highly specific and vary in great detail among individuals. Thus, the best way to categorize these signals is to develop classifiers that account for individual variability so that they are robust enough to be applied beyond the controlled laboratory settings (Zhang et al. 2015; Hu 2017).
Jap et al. have used four parameters /, /, ()/ and ()/() separately for fatigue prediction (Jap et al. 2009). In this work, we further propose an integrated metric combined by averaging the PSD of ()/ and /, and have applied a subject specific procedure for selection of fatigue sensitive channels to predict the driving fatigue. In order to make the study more robust and easily applicable in realistic situation, the employed EEG recording headset is wireless and characterizes advanced dry-sensor technology (Myrden and Chau 2017). Latest EEG headset using the 3D printed products from Cognionics, Inc., USA, was used to reduce subject discomfort, extensive time for subject preparation and substantially higher impedances between the scalp and the electrodes. The integration of easily wearable EEG headset and the development of fatigue index using a combination of predictors of drowsiness have made our study more applicable to realistic settings.
Methodology and materials
Recruitment of subjects
To evaluate the performance of the proposed driving fatigue detection system, ten healthy subjects (seven males and three females, aged 20.6 ± 3.2) from National University of Singapore participated in the driving fatigue experiments at the Cognitive Engineering Laboratory of Singapore Institute for Neurotechnology (SINAPSE). All the experiments were carried out in the afternoon from 3 to 5 pm as it was easier to induce fatigue. All subjects were right-handed and had normal or corrected-to-normal vision. Subjects were asked to refrain from consuming caffeine and alcohol approximately 4 and 24 h respectively before they participated in the experiments.
The experiments were approved by the Institutional Review Board of the National University of Singapore,written informed consent was obtained from all subjects before the experiment and monetary compensation was given for their participation. System calibration was performed during their first visit to the laboratory and the data collected was used in validation of the driving fatigue detection system by online experimentation during the second section. In order to acquire a complete evaluation of the proposed system, subjective workload and satisfaction were assessed with the NASA Task Load Index (NASA-TLX) questionnaire after each session (Mugler et al. 2010; Riccio et al. 2011).
Experimental setup and task
Experimental setup
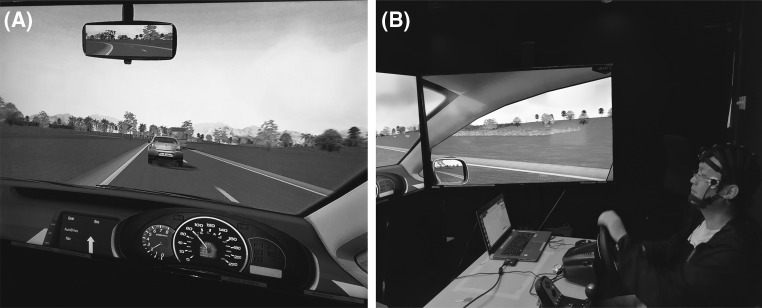
As shown in Fig. 1, the driving fatigue detection system mainly consists of two components: a simulated driving system and a wireless dry EEG acquisition system. The simulated driving system comprises of three 65 inches LCD screens, a driving simulator (Logitech G27 Racing Wheel) and a host computer which provides a driving environment. The wireless dry EEG acquisition system is a highly integrated product and includes an EEG headset, a bluetooth module transmitter and receiver. Twenty four dry sensors are used to measure electroencephalogram from the subject’s scalp. The analog signals from the electrode sensors are sent through an amplifier, converted into digital signals and then sent wireless by a bluetooth module transmitter. The bluetooth receiver collects the converted digital signals for further processing in the host laptop. The Intel(R)Core(TM)i5-6200U Duo 2.4 GHz host laptop (Toshiba) is used to run the acquisition software and the driving fatigue detection algorithm.
Fig. 1.
a A scenery of the road captured from the screen, the guide car breaks randomly with the lings flashing. b The simulated driving system used for the implementation of the proposed protocol
Experiment task
The experiment was performed with the subject seated at 1.8 m in the front of three screens displaying the simulated driving immersive 3D environment while the task lasted for about 1.5 h. The subjects were asked to respond in a timely manner upon presentation of relevant visual stimuli while driving a simulated car in a two-way rural road. They are encouraged to drive at a safe distance in order to avoid rear-end collision and crashes with the cars from the other lane. The reaction time (RT) is recorded during the experiment, which is defined as the visual stimuli of break signal in the guide car and the break signal made by the participant. The interval of the break signal in the guide car was set to be randomly distributed. The experimental task is designed similar to the protocol being followed in our previous study (Abbasi et al. 2017). The total duration of the experiment is about 1.5 h, that is when the guide car turns left and stop, subjects are requested to stop the engine. Then, a questionnaire is self-completed by the subject independently according to the NASA task load index.
EEG data acquisition
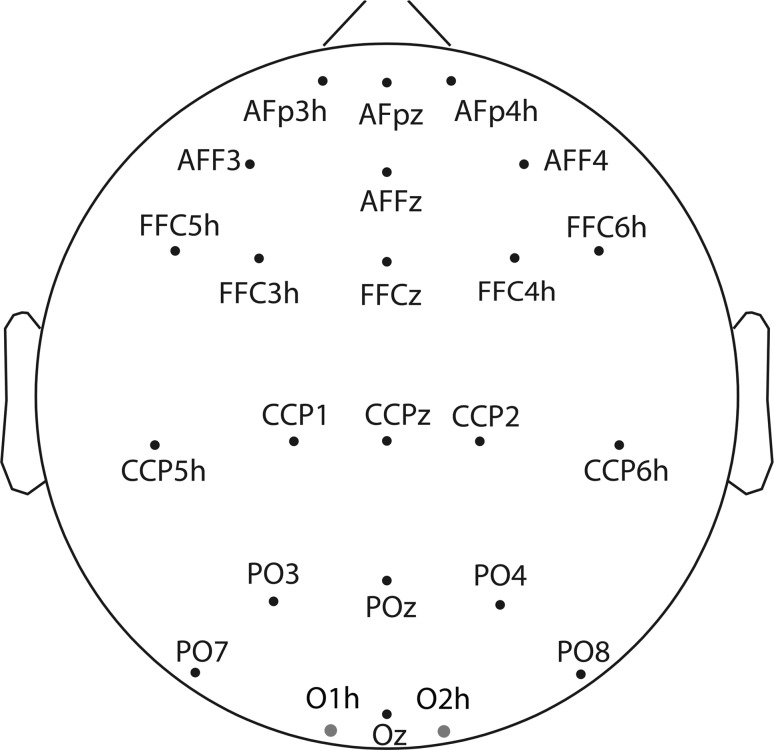
During the driving fatigue experiment, the subjects were requested to wear a wireless EEG cap throughout the experimental task. The EEG signals are referenced to the right and left mastoids. As shown in Fig. 2, 24 standard dry electrodes, placed in the frontal, central, parietal, and occipital regions of the head were used for data acquisition in accordance with the modified international 10–20 system of electrode placement. All impedances are kept below 2000 k. The EEG signals are amplified, sampled at a rate of 250 Hz, and band-pass filtered between 0.5 and 100 Hz in the acquisition software.
Fig. 2.
The names and positions of the 24 Dry-EEG electrodes. The two channels marked in red are used for sample entropy calculation. (Color figure online)
Algorithm
As shown in Fig. 3, we designed two driving fatigue prediction algorithms: power spectrum density analysis and sample entropy analysis. The power spectrum density analysis algorithm includes signal preprocessing, discrete wavelet transform, system calibration, sensitive channels PSD calculation and integrated metric fatigue prediction. The sample entropy analysis algorithm includes signal preprocessing, discrete wavelet transform, sample entropy calculation and fatigue prediction.
Fig. 3.
The flow chart of the proposed two driving fatigue prediction algorithms
System calibration and signal preprocessing
As mentioned before, our study has employed subject specific approach for detection of driver fatigue (Wang et al. 2014). Thus, the first visit of the participating subjects were used for system calibration by collection of the training data necessary for the validation of the online algorithm. The process of system calibration includes selection of fatigue sensitive channels.
Channels selection
Channels selection is necessary for accurate prediction of driving fatigue. Thus, the training data was used to determine the channels that are more susceptible to the onset of mental fatigue. The correlation between the two fatigue related indexes described below, power spectrum density and experiment time was calculated. If the value of the correlation for a specific channel is higher than the pre-established threshold, the channel is selected for the online test. The threshold for this study is set at 0.75. Finally, the channels with significant associations were retained and were characterized as fatigue-sensitive channels. Once the significantly altered channels were obtained, we calculated the fatigue index according to previously findings in fatigue studies (Jap et al. 2009; Larman 2012). Power spectrum values within , , and frequency bands were employed to calculate two fatigue related indexes: ()/ and /, which were summed across those selected channels.
Preprocessing
The acquired data were processed and analyzed using EEGLAB (Delorme and Makeig 2004) during the preprocessing stage. The EEG signals preprocessing steps included spatial filtering with common average reference (CAR) (Ludwig et al. 2009), detrending, removing of mean and then band-pass filtering at 0.5–32 Hz. We extract segments of 10 s EEG signals with a sliding window of 5 s for power spectrum density analysis and segments of 2 s with a sliding window of 1 s for sample entropy analysis.
Power spectrum density analysis
Discrete wavelet transform
We applied the discrete wavelet transform (DWT) (Amiri and Asadi 2009; Zhang et al. 2014) with the following parameters for EEG power spectrum analysis (Wang et al. 2015): Daubechies wavelet of db4 and decomposition level of six. DWT is particularly effective for representing various aspects of signals where other signal processing approaches are not as effective (Coifman et al. 1994). In order to reveal the spectral dynamics of the brain activity, the features were extracted by wavelet packets for each channel of interest. The powers in the , , bands associated with these channels were collected for power spectrum analysis using DWT. Further, the wavelet-packet decomposition was performed at the j-th level of EEG signals for a given set of sub-band coefficients of length . These wavelet coefficient vectors can be represented using the following equation:
| 1 |
where Hz, which is the sampling frequency in this study and . The frequency indexes vary from 0 to for the frequency ranges between zero to the Nyquist frequency (125 Hz) with an original sampling frequency of 250 Hz. Figure 4 illustrates the decomposition of the original EEG signals with a WPT of levels 1, 2, 3, 4, 5 and 6 used in this study.
Fig. 4.
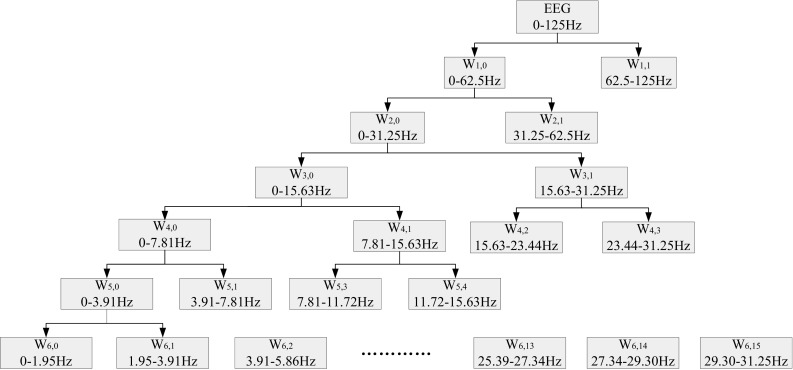
Wavelet packets transform (WPT) decomposition over six levels
The frequency bands , , are defined by acquiring the mean of corresponding frequency ranges in relevant level and is summarized in Table 1.
Table 1.
Frequency bands extracted from the wavelet coefficients and grouped into corresponding frequency bands
| Wavelet coefficients | Frequency range | Frequency bands |
|---|---|---|
| – | 3.91–7.81 Hz | |
| – | 7.81–13.67 Hz | |
| – | 13.67–31.25 Hz |
Inverse wavelet transform
In order to reconstruct the original signal, inverse wavelet transform was applied to the wavelet coefficients in the following manner:
band of the EEG signal was constructed using the wavelet coefficients –.
band was reconstructed using the wavelet coefficients –.
bands was reconstructed using the wavelet coefficients –.
The summary of this analysis can be found in Table 1. The recovered EEG signals were further used for power spectrum density calculation.
Power spectrum density
In the power spectrum density calculation, we applied a sliding Hamming window with a length of 2500 (10 s) and an overlap of 1250 (5 s) sampling points for the spectral estimation. Firstly, the estimation of the parameters for the model is performed from a given data sequence x(n), . Secondly, we used the autoregressive (AR) method for modelling the data sequence x(n) as the output of a causal and discrete filter (Li et al. 2017). This method can be represented using the following equation:
| 2 |
where a(k) is the AR coefficient, x(n) is the white noise of variance equal to , and p is the order of the AR model. From the estimation of AR parameters, we can calculate the PSD:
| 3 |
where is the total least squares error. The model order is taken as here. The PSD results of each frequency band are then normalized to obtain the relative PSD of one band with respect to the other relevant frequency bands.
| 4 |
where and is determined by the selected sub-band frequency.
Integrated metric for fatigue detection
On the basis of Eqs. (3) and (4), the relative powers are computed as well. An integrated metric by averaging two fatigue related indexes which based on the sum PSD of ()/ and / is used for prediction of the driving fatigue:
| 5 |
where n is the number of fatigue-sensitive channels for the first fatigue related index, while m is the number of fatigue-sensitive channels for the second fatigue related index.
Sample entropy analysis
Before we calculate the sample entropy of ‘O1h’ and ‘O2h’, it is customary to calculate the power spectrum energy first. As the wavelet has an orthogonal basis at , the j-th level power spectrum energy of the wavelet coefficients for each frequency bands is calculated by the following equation (Lee et al. 2014):
| 6 |
here the band of 0.01–31.25 Hz is taken into account, which is corresponding with –.
Sample entropy (Richman and Moorman 2000) is used to measure the complexity of EEG and is estimated using the following equations:
| 7 |
| 8 |
where and . We use a sliding window with the length of 2 s (500 sample points) and 1 s (250 sample points) overlapping to calculate the SE of EEG from channels ‘O1h’ and ‘O2h’. This is because the occipital region has been previously pinpointed to exhibit significant change in entropy and complexity related to fatigue (Zhang et al. 2014).
Results
Power spectrum density analysis
We show the power spectrum analysis results of these selected channels with significant fatigue-related patterns for the subject 1 in Fig. 5. The index of most of these channels exhibited a positive association with the time, both indexes of ()/ and / in the specific channels can be see clearly.
Fig. 5.
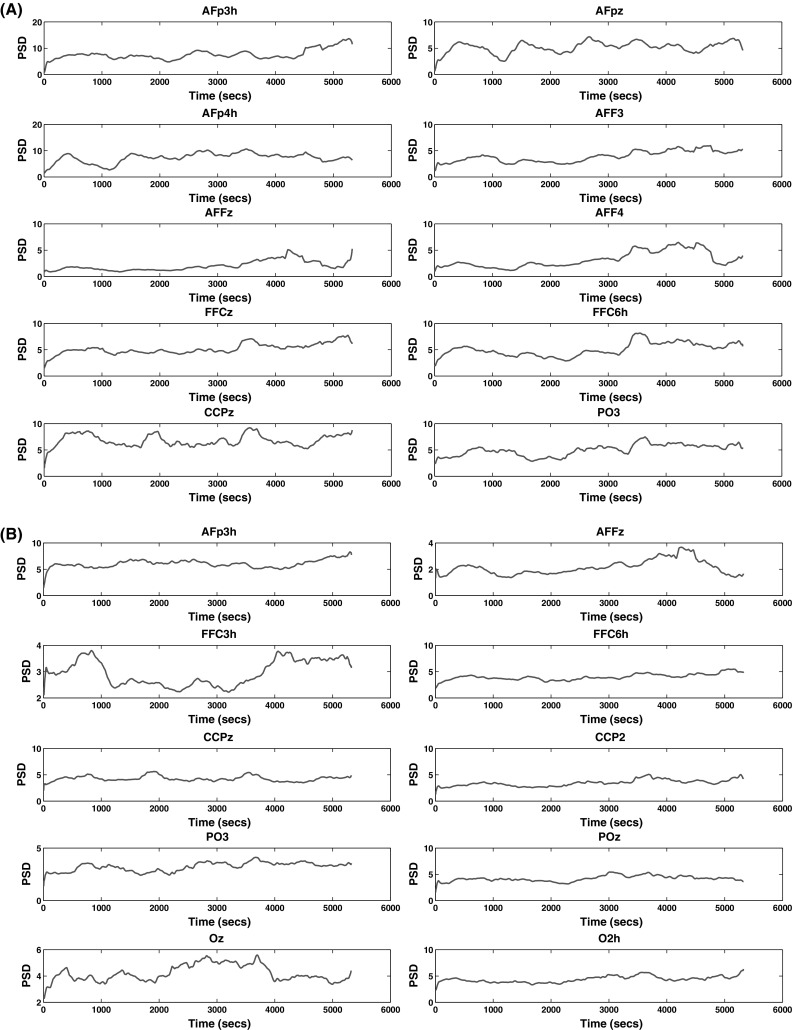
a, b Are the ()/ and / fatigue index for fatigue-sensitive channels of subject 1 respectively
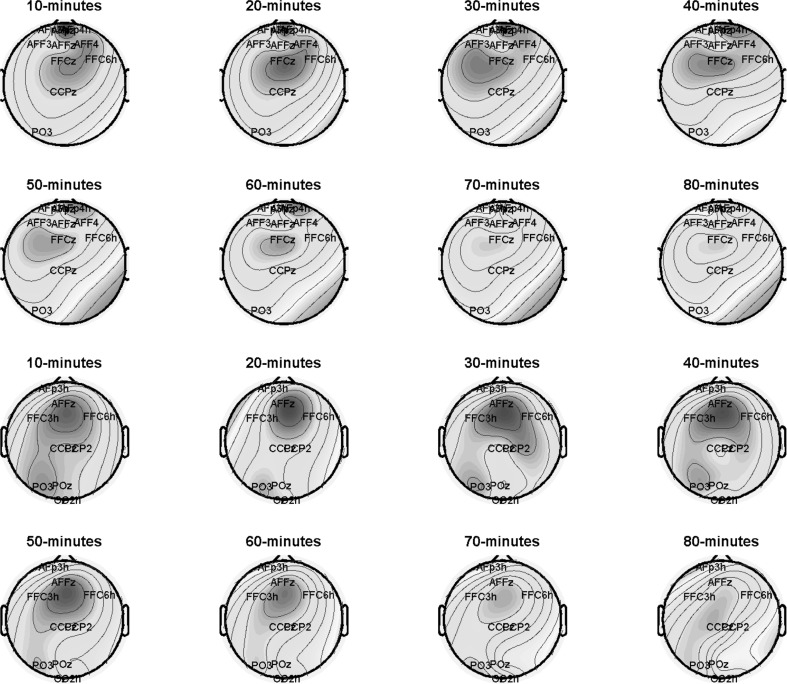
Furthermore, one-way analysis of variance (ANOVA) (González-Rodríguez et al. 2012) is used to analyze the differences among the means of fatigue-related indexes and their associated procedures. In Fig. 6, the means of ()/ and / of subject 1 during the whole process of rested to fatigued states every 10 min are calculated, the ANOVA results are (F = 2.88, p = 0.01) and (F = 2.61, p = 0.019) respectively, which revealed a significant effect of time-on-task.
Fig. 6.
The first and second rows present the topographic map of fatigue-related index ()/ constructed through integrating the channel-based fatigue index, means of the every 10 mins of subject 1. The third and fourth rows present the topographic map of fatigue-related index /) constructed through integrating the channel-based fatigue index, means of the every 10 mins of subject 1
Using these pre-selected channels, we assessed the fatigue index the integration of the channel-based indexes online (Fig. 7), where a gradually increasing pattern was observed. It demonstrated that the subjects were detected to be in a state significantly different than the initial phase, suggesting increased levels of fatigue.
Fig. 7.
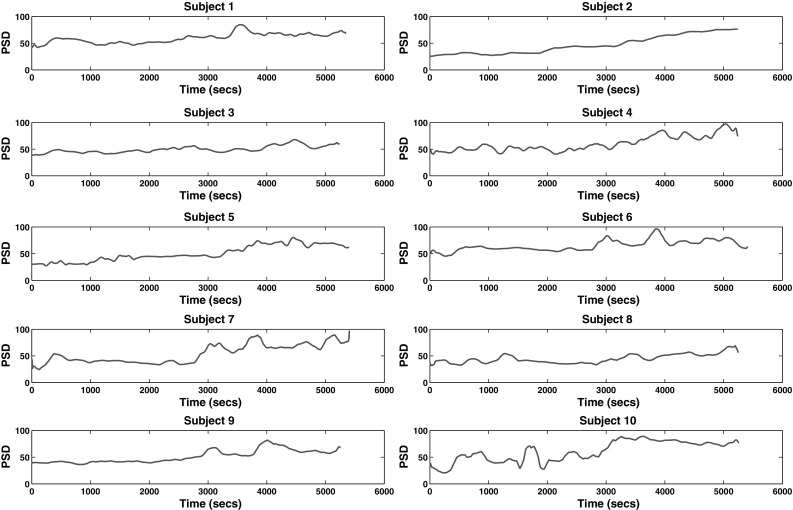
Power spectrum density integrated metrics for driving fatigue prediction during the online experiment of 5400 s (90 mins) for subject 1 to subject 10
Sample entropy analysis
For the sample entropy (SE) analysis, the mean SE of channels ‘O1h’ and ‘O2h’ was used for fatigue level predication (Fig. 8). Previous research indicated consistent patterns of fatigue which are correlated with entropy changes observed on EEG (Zhao et al. 2011). In our analysis, for most subjects, decreasing values of SE are observed, suggesting the effects of fatigue are reflected in SE trends.
Fig. 8.
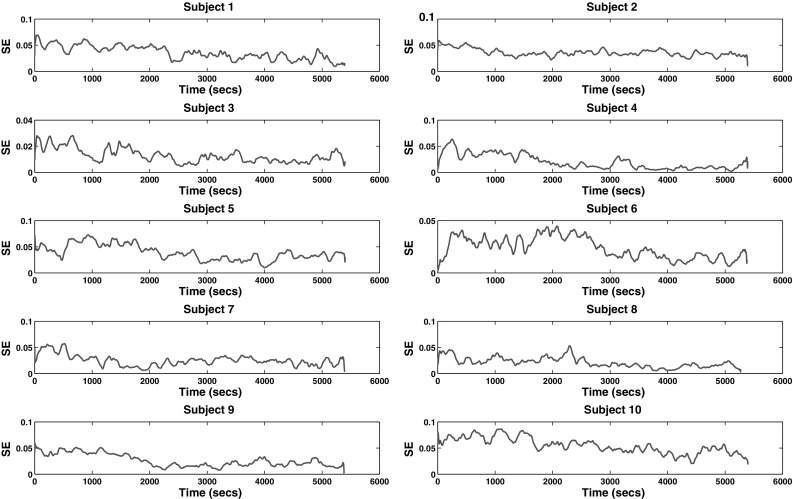
Sample entropy fatigue index for driving fatigue prediction during the online experiment of 5400 s (90 mins) for subject 1 to subject 10
NASA-TLX analysis
The NASA-TLX contains six factors, each of which has 20 steps scoring from 0 to 100. The questionnaire was self-completed by these subjects independently. The given scores are reported in Fig. 9. The average score for the factor “Mental demand” is equal to 77 and “Frustration” is equal to 66, which indicate that after 90 min of driving, most of the drivers perceived high levels of mental fatigue. According to the NASA-TLX, the factor of “Performance” represents how satisfied was the subject with his performance in accomplishing the driving task. The more satisfying, the lower score. So the average score 33 means that all the subjects can effectively complete the driving task with relative ease.
Fig. 9.
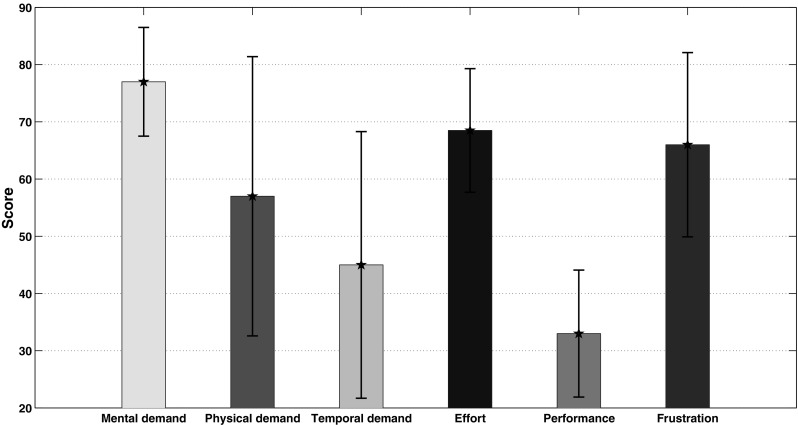
Mean value and standard deviation of the NASA-TLX scores given by the ten subjects
Reaction time analysis
During online experiments, in order to validate the proposed integrated metric for driving fatigue detection, we record the reaction time to evaluate the behavioral performance of subjects. The reaction time is defined as the interval between the visual stimuli of brake signal in the guide car and the breaking action took by the participant. Guiding car braking is triggered randomly during the whole online experiment. The reaction time of the ten subjects are shown in Fig. 10. The results of reaction time analysis indicate the changing process of the subjects from the alert phase to fatigue phase, which are well consistent with the prediction of integrated metric fatigue index.
Fig. 10.
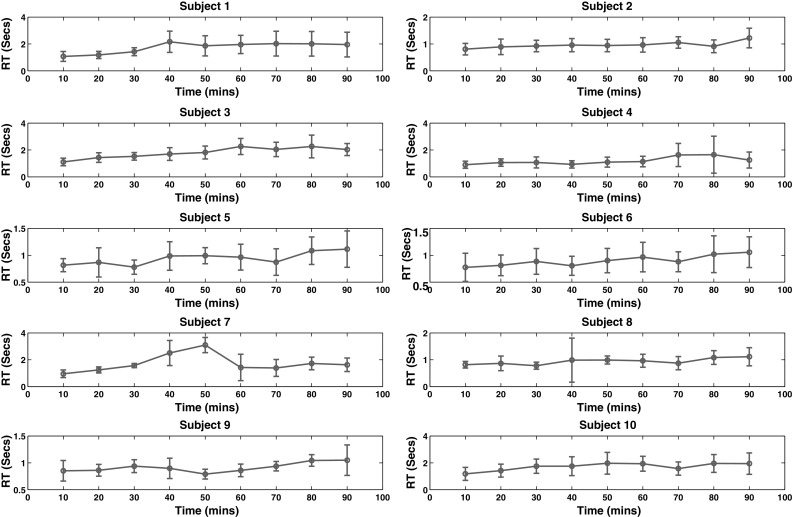
Effects of time-on-task on behavioral performance in terms of reaction time. Mean and standard deviation of reaction time were calculated for the driving fatigue detection experiment with a non-overlapping 10-min bin
Discussion
Onset of mental fatigue exhibits high level of individual variability
Mental fatigue onset is seen to have variable patterns amongst the subjects performing the same task and under the same conditions. As seen in the Fig. 7, for some subjects, there is an sharp increase in the power spectrum density integrated metrics for fatigue prediction with the time on task, showing a marked increase in the prediction curve (subject 4 and subject 10). The other subjects are shown to have a more slow and conservative increase in the prediction curve as the task progresses (subjects 3 and subject 8). A similar trend is exhibited in the entropy specific properties for fatigue detection (Fig. 8). This phenomenon has been explored in literature and is seen to have similar outcome (Wu et al. 2016; Charbonnier et al. 2016). Therefore, system calibration for individual detection of fatigue sensitive channels is of utmost importance, making the algorithm more robust and applicable in realistic conditions.
Comparison of the two methods
In this paper, we have assessed two methods for estimating mental fatigue levels: power spectrum density and sample entropy analysis. From the prediction lines, there is obvious increasing trend of power spectrum density and decreasing trend of sample entropy during the experiment. It demonstrated that the subjects were detected to be in a fatigue state, significantly different than the initial state at the beginning of experiments. However, the change of PSD prediction line is more clear than the SE prediction line, making PSD more robust for setting a threshold for early prediction of fatigue.
Conclusion
In this paper, a novel real-time driving fatigue detection system based on wireless dry EEG headset has been proposed. Power spectrum density (PSD) and sample entropy (SE) are applied in the online detection of mental fatigue. For the PSD method, three frequency bands , and are extracted by wavelet packets transform and their corresponding power spectrum density is obtained. Furthermore, an integrated metric from subject specific fatigue-sensitive channels by combining the two fatigue related indexes, ()/ and / is used to predict the driving fatigue. For the sample entropy method, the average SE of EEG from ‘O1h’ and ‘O2h’ is calculated, and used for fatigue detection. Ten healthy subjects participated in the experiment for two sessions, each being conducted for 90 mins. From the results of the fatigue-related index constructed through integrating the channel-based fatigue index, there is an increasing trend being observed during the experiment as the onset of fatigue occurs. There is also a decreasing trend observed in the sample entropy patterns when the driving fatigue appears. This study indicated that both the proposed fatigue related indexes are effective indicators for prediction of driver fatigue.
Acknowledgements
This study was supported by the Defence Science Organisation (DSO) of Singapore under Grant Number R-719-000-027-592, Technology Development Project of Guangdong Province (No. 2017A010101034), Innovation Projects for Science supported by Department of Education of Guangdong Province (No. 2016KTSCX141), Science Foundation for Young Teachers of Wuyi University (No. 2018td02), Jiangmen Research and Development Program ([2017]268) and the China Scholarship Council ([2016]5113).
Contributor Information
Junhua Li, Email: juhalee@nus.edu.sg.
Anastasios Bezerianos, Email: tassos.bezerianos@nus.edu.sg.
References
- Abbasi NI, Bodala IP, Bezerianos A, Sun Y, Al-Nashash H, Thakor NV (2017) Role of multisensory stimuli in vigilance enhancement-a single trial event related potential study. In: 39th annual international conference of the IEEE engineering in medicine and biology society (EMBC), 2017. IEEE, pp 2446–2449 [DOI] [PubMed]
- Amiri GG, Asadi A. Comparison of different methods of wavelet and wavelet packet transform in processing ground motion records. Int J Civ Eng. 2009;7(4):248–257. [Google Scholar]
- Atchley P, Chan M, Gregersen S. A strategically timed verbal task improves performance and neurophysiological alertness during fatiguing drives. Hum Factors. 2014;56(3):453–462. doi: 10.1177/0018720813500305. [DOI] [PubMed] [Google Scholar]
- Ba Y, Zhang W, Wang Q, Zhou R, Ren C. Crash prediction with behavioral and physiological features for advanced vehicle collision avoidance system. Transp Res Part C Emerg Technol. 2017;74:22–33. doi: 10.1016/j.trc.2016.11.009. [DOI] [Google Scholar]
- Charbonnier S, Roy RN, Bonnet S, Campagne A. Eeg index for control operators mental fatigue monitoring using interactions between brain regions. Expert Syst Appl. 2016;52:91–98. doi: 10.1016/j.eswa.2016.01.013. [DOI] [Google Scholar]
- Chew LH, Teo J, Mountstephens J. Aesthetic preference recognition of 3D shapes using eeg. Cogn Neurodyn. 2016;10(2):165–173. doi: 10.1007/s11571-015-9363-z. [DOI] [PMC free article] [PubMed] [Google Scholar]
- Coifman RR, Meyer Y, Quake S, Wickerhauser MV. Signal processing and compression with wavelet packets. In: Byrnes JS, Hargreaves KA, Berry K, editors. Wavelets and their applications. Dordrecht: Springer; 1994. pp. 363–379. [Google Scholar]
- Dai Z, de Souza J, Lim J, Ho PM, Chen Y, Li J, Thakor N, Bezerianos A, Sun Y. Eeg cortical connectivity analysis of working memory reveals topological reorganization in theta and alpha bands. Front Hum Neurosci. 2017;11(12):783–790. doi: 10.3389/fnhum.2017.00237. [DOI] [PMC free article] [PubMed] [Google Scholar]
- Delorme A, Makeig S. Eeglab: an open source toolbox for analysis of single-trial eeg dynamics including independent component analysis. J Neurosci Methods. 2004;134(1):9–21. doi: 10.1016/j.jneumeth.2003.10.009. [DOI] [PubMed] [Google Scholar]
- Eoh HJ, Chung MK, Kim S-H. Electroencephalographic study of drowsiness in simulated driving with sleep deprivation. Int J Ind Ergon. 2005;35(4):307–320. doi: 10.1016/j.ergon.2004.09.006. [DOI] [Google Scholar]
- Gharagozlou F, Saraji GN, Mazloumi A, Nahvi A, Nasrabadi AM, Foroushani AR, Kheradmand AA, Ashouri M, Samavati M. Detecting driver mental fatigue based on eeg alpha power changes during simulated driving. Iran J Public Health. 2015;44(12):1693–1702. [PMC free article] [PubMed] [Google Scholar]
- González-Rodríguez G, Colubi A, Gil MÁ. Fuzzy data treated as functional data: a one-way anova test approach. Comput Stat Data Anal. 2012;56(4):943–955. doi: 10.1016/j.csda.2010.06.013. [DOI] [Google Scholar]
- Gurudath N, Riley HB. Drowsy driving detection by eeg analysis using wavelet transform and k-means clustering. Procedia Comput Sci. 2014;34:400–409. doi: 10.1016/j.procs.2014.07.045. [DOI] [Google Scholar]
- Hirvonen K, Puttonen S, Gould K, Korpela J, Koefoed VF, Müller K. Improving the saccade peak velocity measurement for detecting fatigue. J Neurosci Methods. 2010;187(2):199–206. doi: 10.1016/j.jneumeth.2010.01.010. [DOI] [PubMed] [Google Scholar]
- Hu J. Comparison of different features and classifiers for driver fatigue detection based on a single eeg channel. Comput Math Methods Med. 2017;9(4):832–843. doi: 10.1155/2017/5109530. [DOI] [PMC free article] [PubMed] [Google Scholar]
- Jap BT, Lal S, Fischer P, Bekiaris E. Using eeg spectral components to assess algorithms for detecting fatigue. Expert Syst Appl. 2009;36(2):2352–2359. doi: 10.1016/j.eswa.2007.12.043. [DOI] [Google Scholar]
- Jo J, Lee SJ, Jung HG, Park KR, Kim J. Vision-based method for detecting driver drowsiness and distraction in driver monitoring system. Opt Eng. 2011;50(12):13202–13209. doi: 10.1117/1.3657506. [DOI] [Google Scholar]
- Kar S, Bhagat M, Routray A. Eeg signal analysis for the assessment and quantification of drivers fatigue. Transp Res Part F Traffic Psychol Behav. 2010;13(5):297–306. doi: 10.1016/j.trf.2010.06.006. [DOI] [Google Scholar]
- Khushaba RN, Kodagoda S, Lal S, Dissanayake G. Driver drowsiness classification using fuzzy wavelet-packet-based feature-extraction algorithm. IEEE Trans Biomed Eng. 2011;58(1):121–131. doi: 10.1109/TBME.2010.2077291. [DOI] [PubMed] [Google Scholar]
- LaFleur K, Cassady K, Doud A, Shades K, Rogin E, He B. Quadcopter control in three-dimensional space using a noninvasive motor imagery-based brain-computer interface. J Neural Eng. 2013;10(4):1308–1326. doi: 10.1088/1741-2560/10/4/046003. [DOI] [PMC free article] [PubMed] [Google Scholar]
- Larman C. Applying UML and patterns: an introduction to object oriented analysis and design and interative development. London: Pearson Education India; 2012. [Google Scholar]
- Lee B-G, Lee B-L, Chung W-Y. Mobile healthcare for automatic driving sleep-onset detection using wavelet-based eeg and respiration signals. Sensors. 2014;14(10):17915–17936. doi: 10.3390/s141017915. [DOI] [PMC free article] [PubMed] [Google Scholar]
- Li X, Shang X, Morales-Esteban A, Wang Z. Identifying p phase arrival of weak events: the akaike information criterion picking application based on the empirical mode decomposition. Comput Geosci. 2017;100:57–66. doi: 10.1016/j.cageo.2016.12.005. [DOI] [Google Scholar]
- Liang S, Lin C, Wu R, Chen Y, Huang T, Jung T (2006) Monitoring driver’s alertness based on the driving performance estimation and the eeg power spectrum analysis. In: 27th annual international conference of the engineering in medicine and biology society, 2005. IEEE-EMBS 2005. IEEE, pp 5738–5741 [DOI] [PubMed]
- Ludwig KA, Miriani RM, Langhals NB, Joseph MD, Anderson DJ, Kipke DR. Using a common average reference to improve cortical neuron recordings from microelectrode arrays. J Neurophysiol. 2009;101(3):1679–1689. doi: 10.1152/jn.90989.2008. [DOI] [PMC free article] [PubMed] [Google Scholar]
- Mugler EM, Ruf CA, Halder S, Bensch M, Kubler A. Design and implementation of a p300-based brain-computer interface for controlling an internet browser. IEEE Trans Neural Syst Rehabil Eng. 2010;18(6):599–609. doi: 10.1109/TNSRE.2010.2068059. [DOI] [PubMed] [Google Scholar]
- Myrden A, Chau T. A passive eeg-bci for single-trial detection of changes in mental state. IEEE Trans Neural Syst Rehabil Eng. 2017;25(4):345–356. doi: 10.1109/TNSRE.2016.2641956. [DOI] [PubMed] [Google Scholar]
- Panicker R, Puthusserypady S, Sun Y. An asynchronous p300 bci with ssvep-based control state detection. IEEE Trans Biomed Eng. 2011;99:1781–1788. doi: 10.1109/TBME.2011.2116018. [DOI] [PubMed] [Google Scholar]
- Rau PS (2005) Drowsy driver detection and warning system for commercial vehicle drivers: field operational test design, data analyses, and progress. In: National Highway Traffic Safety Administration 05–0192
- Riccio A, Leotta F, Bianchi L, Aloise F, Zickler C, Hoogerwerf EJ, Kubler A, Mattia D, Cincotti F. Workload measurement in a communication application operated through a p300-based brain-computer interface. J Neural Eng. 2011;8(2):876–884. doi: 10.1088/1741-2560/8/2/025028. [DOI] [PubMed] [Google Scholar]
- Richman JS, Moorman JR. Physiological time-series analysis using approximate entropy and sample entropy. Am J Physiol Heart Circ Physiol. 2000;278(6):2039–2049. doi: 10.1152/ajpheart.2000.278.6.H2039. [DOI] [PubMed] [Google Scholar]
- Wang H, Li Y, Long J, Yu T, Gu Z. An asynchronous wheelchair control by hybrid eeg-eog brain-computer interface. Cogn Neurodyn. 2014;8(5):399–409. doi: 10.1007/s11571-014-9296-y. [DOI] [PMC free article] [PubMed] [Google Scholar]
- Wang H, Zhang C, Shi T, Wang F, Ma S. Real-time eeg-based detection of fatigue driving danger for accident prediction. Int J Neural Syst. 2015;25(02):643–651. doi: 10.1142/S0129065715500021. [DOI] [PubMed] [Google Scholar]
- Wang R, Wang J, Yu H, Wei X, Yang C, Deng B. Power spectral density and coherence analysis of alzheimers eeg. Cogn Neurodyn. 2015;9(3):291–304. doi: 10.1007/s11571-014-9325-x. [DOI] [PMC free article] [PubMed] [Google Scholar]
- Williamson A, Lombardi DA, Folkard S, Stutts J, Courtney TK, Connor JL. The link between fatigue and safety. Accid Anal Prev. 2011;43(2):498–515. doi: 10.1016/j.aap.2009.11.011. [DOI] [PubMed] [Google Scholar]
- Wu D, Lawhern VJ, Gordon S, Lance BJ, Lin C-T. Driver drowsiness estimation from eeg signals using online weighted adaptation regularization for regression (owarr) IEEE Trans Fuzzy Syst. 2016;10(5):1493–1502. [Google Scholar]
- Zhang C, Wang H, Fu R. Automated detection of driver fatigue based on entropy and complexity measures. IEEE Trans Intell Transp Syst. 2014;15(1):168–177. doi: 10.1109/TITS.2013.2275192. [DOI] [Google Scholar]
- Zhang L, Gan JQ, Wang H. Localization of neural efficiency of the mathematically gifted brain through a feature subset selection method. Cogn Neurodyn. 2015;9(5):495–508. doi: 10.1007/s11571-015-9345-1. [DOI] [PMC free article] [PubMed] [Google Scholar]
- Zhao C, Zheng C, Zhao M, Liu J, Tu Y. Automatic classification of driving mental fatigue with eeg by wavelet packet energy and kpca-svm. Int J Innov Comput Control. 2011;7(3):1157–1168. [Google Scholar]
- Zhao C, Zhao M, Yang Y, Gao J, Rao N, Lin P. The reorganization of human brain networks modulated by driving mental fatigue. IEEE J Biomed Health Inform. 2017;21(3):743–755. doi: 10.1109/JBHI.2016.2544061. [DOI] [PubMed] [Google Scholar]


