

Abstract
Angiogenin (ANG) is a secretory ribonuclease that promotes the proliferation of endothelial cells, leading to angiogenesis. This function relies on its ribonucleolytic activity, which is low for simple RNA substrates. Upon entry into the cytosol, ANG is sequestered by the ribonuclease inhibitor protein (RNH1). We find that ANG is a potent cytotoxin for RNH1-knockout HeLa cells, belying its inefficiency as a nonspecific catalyst. The toxicity does, however, rely on the ribonucleolytic activity of ANG and a cytosolic localization, which lead to the accumulation of particular tRNA fragments (tRFs), such as tRF-5 Gly-GCC. These up-regulated tRFs are highly cytotoxic at physiological concentrations. Although ANG is well-known for its promotion of cell growth, our results reveal that ANG can also cause cell death.
Keywords: CRISPR, tRNA-derived fragment, oxidative stress ribonuclease inhibitor, RNA processing
INTRODUCTION
Angiogenin (ANG) is a protein in the pancreatic-type ribonuclease (ptRNase) superfamily. Early on, ANG was identified as a promoter of neovascularization in human tumors (Fett et al. 1985). For the past three decades, this ribonuclease has continued to be implicated in new biological processes, from reproduction to inflammation to neuroprotection (Badet 1999; Kieran et al. 2008; Sheng and Xu 2016; Lyons et al. 2017). Although the diversity of its roles is unique in the ptRNase superfamily, ANG does share many fundamental properties with other ptRNases, such as catalysis of RNA cleavage after pyrimidine residues and a high affinity for the cytosolic ribonuclease inhibitor protein (RNH1). Still, ANG is best described by its differences (Riordan 2001; Haigis et al. 2003; Smith and Raines 2006). Unlike other RNases, ANG has a cell-surface receptor, and is readily endocytosed into human cells (Hu et al. 1993, 1997; Skorupa et al. 2012). ANG also contains a nuclear localization signal (NLS) and is known to act on both cytosolic and nuclear RNAs (Moroianu and Riordan 1994; Lixin et al. 2001; Hoang and Raines 2017). Most strikingly, ANG exhibits 104-fold less activity than typical ptRNases toward simple RNA substrates (Leland et al. 2002; Eller et al. 2014). Whereas most ptRNases degrade extracellular RNA efficiently and promiscuously (Sorrentino and Libonati 1994; Sorrentino 2010), ANG seems to have evolved to cleave specific RNA substrates within cells.
One of the recently discovered actions of ANG is to generate tRNA-derived small RNA fragments (tRFs) in stressed cells. Under normal growth conditions, ANG localizes in the nucleolus and promotes rDNA transcription by cleaving promoter-associated RNA (Hoang and Raines 2017). In contrast, hypoxia and starvation cause ANG to localize to stress granules (Emara et al. 2010; Pizzo et al. 2013). Within these granules, ANG cleaves the anticodon loop of tRNAs, producing tRFs (Yamasaki et al. 2009; Ivanov et al. 2011; Saikia and Hatzoglou 2015). These tRFs perform diverse cellular functions, such as participating in translational silencing or degrading specific mRNAs by an RNAi-like mechanism (Ivanov et al. 2011, 2014; Deng et al. 2015; Lyons et al. 2016), though a complete understanding is not at hand (Lyons et al. 2017).
ANG function is regulated tightly in cellulo. RNH1 binds to ANG with femtomolar affinity, inactivating its ribonucleolytic activity (Lee et al. 1989; Papageorgiou et al. 1997; Dickson et al. 2005). RNH1 contains 32 cysteine residues, all of which must be reduced for RHN1 to retain its function (Fominaya and Hofsteenge 1992; Blázquez et al. 1996; Kim et al. 1999). Because RNH1 resides in the cytosol and most ptRNases carry out their functions in the extracellular matrix, RNH1 acts as an “intercellular sentry,” protecting cellular RNA from degradation by endocytosed ptRNases (Haigis et al. 2003). This designation is apparent from the greatly increased toxicity of RNase 1, which is the most abundant ptRNase in humans, for RNH1 knockout cells (Thomas et al. 2016). Still, the sensitivity of RNH1 to oxidation and subsequent inactivation could play a role in its cellular function (Kim et al. 1999; Pizzo et al. 2013).
Here, we demonstrate that—in the absence of RNH1 and despite its low enzymatic activity—ANG is a potent cytotoxin. Its toxicity is mediated by small tRNA fragments, which are up-regulated upon ANG treatment in RNH1-knockout cells. These tRFs, which induce cytotoxicity in cellulo, are not up-regulated in RNase 1-treated cells. Thus, the degradation of specific cellular RNAs by ANG leads to greater cytotoxicity than does the nonspecific degradation of RNA by RNase 1. This work highlights the importance of ANG in tRF production, and provides insight into the biological roles of ANG and its inhibitor.
RESULTS
Cytotoxicity of ANG
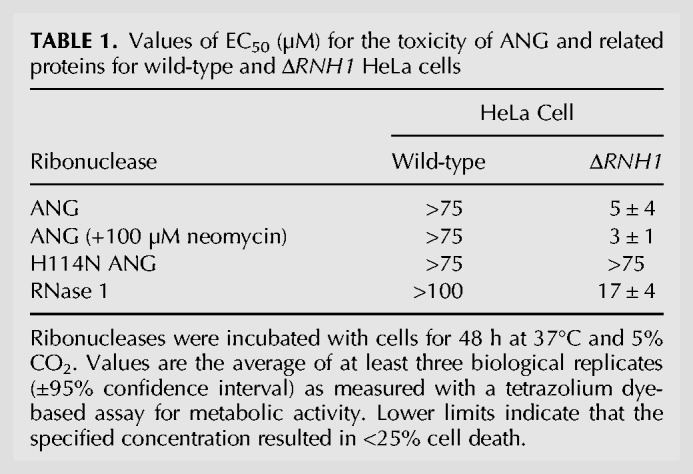
Recently, we reported on the toxicity of RNase 1 for ΔRNH1 HeLa cells generated with CRISPR–Cas9 (Thomas et al. 2016). Remarkably, cell viability assays revealed that ANG is threefold more toxic to ΔRNH1 HeLa cells than is RNase 1 (Table 1), despite having 104-fold less enzymatic activity (Leland et al. 2002; Eller et al. 2014). Assays with H114N ANG, which is an inactive catalyst (Shapiro and Vallee 1989), demonstrated that cytotoxicity relies on catalytic activity. Moreover, the cytotoxicity of ANG is unaffected by neomycin, which blocks its localization to the nucleolus (Hu 1998; Bárcena et al. 2015), suggesting that ANG acts elsewhere.
TABLE 1.
Values of EC50 (µM) for the toxicity of ANG and related proteins for wild-type and ΔRNH1 HeLa cells
Cellular uptake and localization of ANG
We began our investigation of this anomaly by using flow cytometry to measure the cellular uptake of ANG relative to that of RNase 1 (Fig. 1A). We found that ANG uptake was 14-fold greater than that of RNase 1 in wild-type HeLa cells, and 20-fold greater in ΔRNH1 HeLa cells. Increased uptake of ANG versus RNase 1 is expected, as ANG is known to bind a specific cell-surface receptor, whereas RNase 1 is endocytosed via a dynamin-independent pathway (Hu et al. 1997; Haigis and Raines 2003; Skorupa et al. 2012). Still, the greater uptake of ANG is not able to explain its anomalous cytotoxicity.
FIGURE 1.
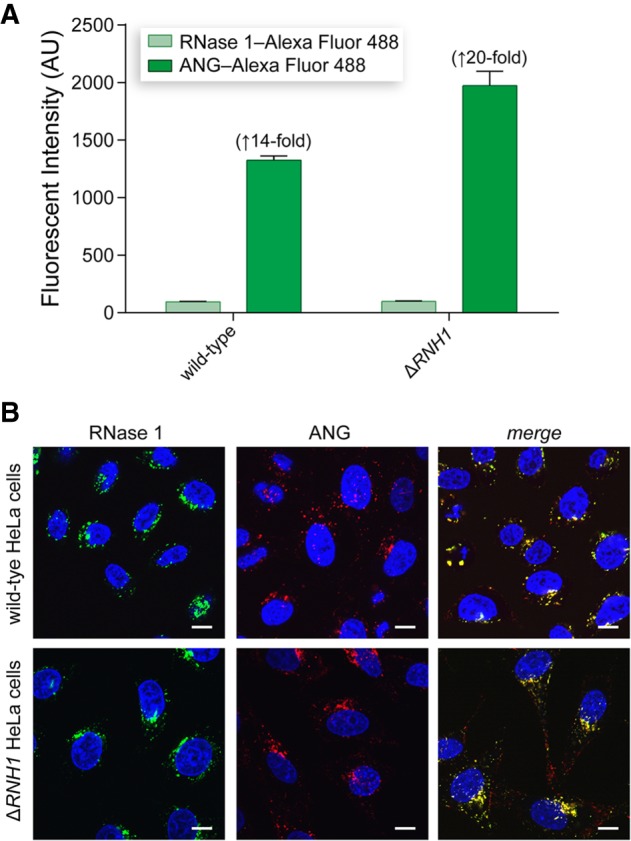
Characterization of ANG uptake and localization in wild-type and ΔRNH1 HeLa cells. (A) Bar graphs showing the cellular uptake of ANG and RNase 1. (B) Confocal microscopy images showing the cellular localization of fluorophore-labeled ANG and RNase 1. Scale bar, 10 µM.
Next, we sought to discern the mode-of-action of ANG in ΔRNH1 cells. The function of ANG is determined largely by its cellular localization. We visualized ANG uptake and localization using confocal microscopy (Fig. 1B). Fluorophore-labeled ANG and RNase 1 exhibited punctate staining in both wild-type and ΔRNH1 cells, which results from its localization to endocytic vesicles (Chao and Raines 2013; Eller et al. 2014). This result is not surprising, as only a small fraction of endocytosed ptRNases escape from endocytic vesicles and enter the cytosol (Chao and Raines 2013).
Effect of ANG on cellular tRF levels
Many functions of ANG are manifested in the nucleus, but under certain stress conditions ANG can relocate to the cytosol and produce tRFs (Yamasaki et al. 2009; Emara et al. 2010; Ivanov et al. 2011). RNH1 plays an integral role in this process, and the partial knockdown of RNH1 leads to tRF production in unstressed cells (Yamasaki et al. 2009; Pizzo et al. 2013). To determine whether tRFs were up-regulated after ANG treatment, we surveyed the small RNAs within ANG- and RNase 1-treated cells. The results revealed the accumulation of tRF-length fragments in ANG-treated ΔRNH1 cells but not in wild-type cells (Fig. 2). In contrast, RNase 1 produced random degradation in both cell lines. Hence, ANG-induced toxicity could be mediated by small RNAs.
FIGURE 2.

Graphs showing the effect of ptRNase-treatment on small RNAs (10–50 nt) in wild-type and ΔRNH1 HeLa cells. (A) ANG-treated ΔRNH1 cells. (B) ANG-treated wild-type cells. (C) RNase 1-treated ΔRNH1 cells. (D) RNase 1-treated wild-type cells.
To investigate further the production of small RNAs in ANG-treated cells, we determined the sequence of small RNAs in wild-type and ΔRNH1 cells treated with ANG, RNase 1, or vehicle (PBS). This analysis, which included RNA species of the lengths of tRFs, full-length tRNAs, and miRNAs, provided a comprehensive profile of small RNA populations. A principal components analysis (PCA) revealed that ANG-treated ΔRNH1 cells segregated from all other sample types and conditions (Fig. 3A). This segregation is due to the abundance of particular tRFs (Supplemental Table 1).
FIGURE 3.
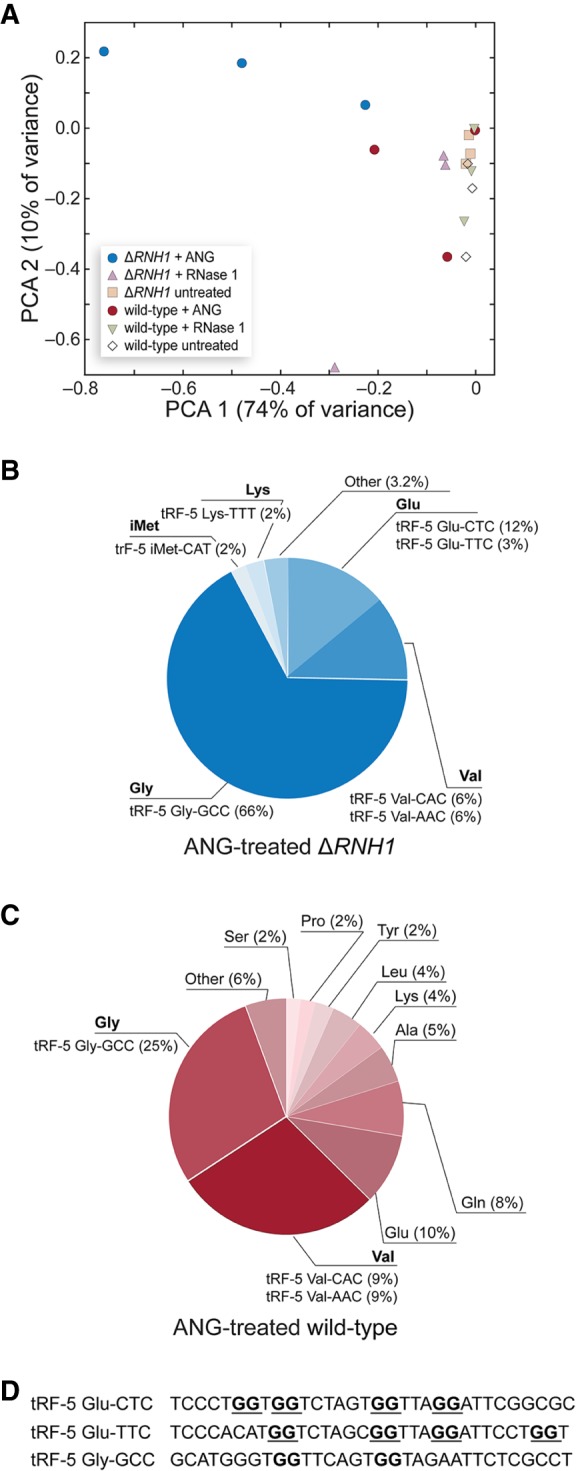
Effect of ptRNase-treatment on tRF levels in wild-type and ΔRNH1 HeLa cells. (A) Principal component analysis of normalized tRF levels in ANG-, RNase 1-, or untreated cells. (B) Abundance of tRFs in ANG-treated ΔRNH1 cells. Values are the average of three biological replicates. (C) Abundance of tRFs in ANG-treated wild-type cells. (D) Predicted G-quadruplex forming motifs in up-regulated tRFs.
We identified 35 tRFs that were differentially regulated (P ≤ 0.05) in our samples. Although most of these tRFs were down-regulated in ANG-treated samples, certain tRFs were up-regulated sharply after ANG treatment. Indeed, the vast majority of tRFs in ΔRNH1 cells could be attributed to just five fragments from glycine, valine, or glutamine tRNAs (Fig. 3B,C). tRF-5 Gly-GCC was up-regulated to an especially high level, constituting 66% of the tRFs in ANG-treated ΔRNH1 cells and 25% in ANG-treated wild-type cells. Another tRF in this group, tRF-5 Glu-CTC, constituted up to 18% of the total tRF population in ANG or RNase 1-treated populations, but was not measured in untreated samples.
We investigated whether the up-regulation of particular tRFs could account for ANG toxicity. To do so, we transfected synthetic tRFs, as well as their DNA analogs, into both wild-type and ΔRNH1 cells. Cytotoxicity assays on transfected cells revealed that highly up-regulated tRFs produced significant cell death at concentrations as low as ∼1 µM (Fig. 4A). At ∼3 µM concentrations, Gly and Glu tRFs were highly cytotoxic, leading to cell viabilities as low as 15% (Fig. 4B). Both of these concentrations are physiologically relevant (Ivanov et al. 2011). Other tRFs did not elicit such a dramatic response. tRF-Gln-CTC, which was up-regulated but not in high abundance in ANG-treated ΔRNH1 cells, produced significant toxicity only in ΔRNH1 cells, whereas tRF-Lys-CTT, which is of constant abundance, caused significantly less toxicity at all concentrations than did its highly up-regulated counterparts. Thus, the up-regulation of particular tRFs could be responsible for the cytotoxicity of ANG.
FIGURE 4.

Bar graphs showing the effect of tRF transfection on the viability of (A) ΔRNH1 and (B) wild-type HeLa cells. Cell viability (±95% confidence interval) after transfection of 1 or 3 µg of an RNA or DNA species. Significant cell death compared to transfection reagent (jetPRIME) are marked by asterisks, where (*) refers to P ≤ 0.05; (**) P ≤ 0.01; and (***) P ≤ 0.001. One microgram or 3 µg transfection corresponds to ∼1 or 3 µM RNA species in cell culture medium.
Effect of ANG on cellular tRNA levels
The results from our transfection experiment suggest that tRFs alone can mediate cellular toxicity. Still, it is important to investigate whether tRNA degradation also contributes to the toxicity (Saikia and Hatzoglou 2015). For example, an increase in a specific tRF is coupled to a decrease in its corresponding tRNA. We surveyed our small RNA data for the corresponding mature tRNAs of differentially regulated tRFs. In all samples, there was a set of 85 tRNAs, which corresponded to 140 tRFs. Of these 85 tRNAs, 50 were produced differentially (P ≤ 0.05), and 31 were down-regulated. Still, only 11 of these significantly down-regulated tRNAs corresponded to up-regulated tRFs (Supplemental Table 3). This number is a small fraction of the ∼600 tRNAs encoded by the human genome. In addition, this set of 11 did not correspond to any highly abundant tRFs, and tRNAs corresponding to tRFs Gly-GCC, Glu-CTC, and Glu-TTC were slightly up-regulated upon treatment with ANG. Another discrepancy between tRF levels and the levels of their corresponding tRNAs has been reported previously (Yamasaki et al. 2009; Saikia et al. 2012b).
Although specific tRNAs were not down-regulated in ANG-treated samples, tRNAs were down-regulated globally after ANG treatment (Fig. 5A). Global tRNA down-regulation has been reported previously in ANG-treated Xenopus oocytes, which lack RNH1, and was used to explain ANG toxicity in this system (Saxena et al. 1992). Our observation of tRNA down-regulation in both wild-type and ΔRNH1 cells indicates, however, that tRNA down-regulation cannot fully explain ANG toxicity.
FIGURE 5.

Heat maps showing the effect of ANG on tRNA and miRNA levels in wild-type and ΔRNH1 cells. Log2(fold change) in abundance from the indicated conditions are clustered hierarchically. (A) tRNA. (B) miRNA.
Effect of ANG on cellular miRNA levels
To complete our small RNA analysis, we investigated differences in miRNA levels in ΔRNH1 cells. ANG has also been reported to cleave miRNAs (Weng et al. 2012; Sheng and Xu 2016), and that cleavage could exacerbate the toxicity of ANG for ΔRNH1 cells. We found differential levels in 48 mature miRNAs (Fig. 5B; Supplemental Table 4). Although 48 miRNAs were identified, only 13 of these miRNAs were regulated differentially in more than one comparison. Of these, three were regulated differentially in ANG-treated cells versus RNase 1- and untreated cells, indicating that they might be regulated by ANG. miRNA-enrichment analysis of these three miRNAs produced no significant shared biological processes (GO terms). Thus, we expanded our analysis to include those miRNAs up-regulated in ANG-treated versus untreated cells. Then, miRNA enrichment analysis, semantic reduction, and network analysis provided several sets of unique GO terms for up-regulated and down-regulated miRNAs. Some of the GO terms enriched in up-regulated miRNAs included acetyl- and methyl-transferase activities, as well as those for protein folding and receptor binding, whereas down-regulated miRNAs were enriched in oxidoreductase activity and transcription factor activation (Supplemental Table 5). Nonetheless, the large set of miRNA targets and biological processes lacked clear commonalities.
RNA motifs affected by ANG
Our small RNA analysis demonstrates differential small RNA levels in wild-type and ΔRNH1 cells. To better understand why certain tRFs and miRNAs were up-regulated in ANG-treated samples, we performed motif analysis on up-regulated tRFs and miRNAs. This analysis did not reveal any significantly enriched motifs in differentially regulated sequences. We also investigated the presence of potential G-quadruplex structures, which have been reported to be important for tRF function (Ivanov et al. 2014; Lyons et al. 2016). Although up-regulated tRFs in ANG-treated ΔRNH1 cells lacked the G-quadruplex–forming terminal oligo-guanine (TOG) motif which has been studied previously, both Glu-TTC and Glu-CTC sequences contained GG-rich motifs that could form higher order structures (Fig. 3D; Ivanov et al. 2011). Di-guanine motifs are, however, frequent in tRFs, complicating assignment of these structures as the main determinant of ANG binding and cleavage.
DISCUSSION
ANG was the first substance shown to initiate the growth of a human organ (Fett et al. 1985). We have uncovered a previously unknown action of ANG, one that leads to cytotoxicity rather than cell proliferation. When unchecked by RNH1, ANG is not only cytotoxic, but threefold more so than RNase 1. This toxicity is linked to the catalytic activity of ANG but not its ability to enter the nucleus. Because ANG is a 10,000-fold less active catalyst than RNase 1 against simple substrates, these results are surprising.
To uncover the underlying basis for the cytotoxicity of ANG, we assessed its cellular uptake and localization. Flow cytometry revealed that ANG did enter cells more readily than did RNase 1 (Fig. 1A), though the increase was modest compared to the 30,000-fold difference in cytotoxic activity per unit of enzymatic activity. Likewise, confocal imaging revealed that the localization of RNase 1 and ANG were similar, and that ANG localization did not differ in wild-type and ΔRNH1 cells (Fig. 1B). Together, these data suggested to us that ANG causes cell death in the cytosol by an unusual mechanism, perhaps based on the cleavage of particular RNAs.
Small RNA sequencing allowed us to pinpoint which RNAs are responsible for the cytotoxicity of ANG. tRFs were a logical candidate, as the regulation of tRFs by ANG in the cytosol was known (Yamasaki et al. 2009; Ivanov et al. 2011; Li and Hu 2012; Saikia and Hatzoglou 2015; Lyons et al. 2017). Sequencing revealed that a subset of five tRFs was highly abundant in ANG-treated ΔRNH1 cells, making up >90% of the total tRF population. Two of these five tRFs have known functions: one, tRF-Glu-CTC, targets apolipoprotein E receptor 2 during RSV infection (Wang et al. 2013; Deng et al. 2015). tRF-Gly-GCC has been shown to inhibit protein translation, regulate MERVL targets, and inhibit cell proliferation (Ivanov et al. 2011; Saikia et al. 2012a; Li et al. 2016; Sharma et al. 2016). It is up-regulated after ischemic injury, and its expression is tied to the expression of ANG (Li et al. 2016). The dramatic up-regulation of this tRF in our model along with the data in these previous reports suggest that tRF-Gly-GCC has a significant biological role that is linked to ANG.
To understand this dichotomy, we investigated the cytotoxicity of up-regulated tRFs in both wild-type and ΔRNH1 cells. We found that the tRF species up-regulated by ANG produced significant cytotoxicity, with tRF-Gly-GCC and tRF-Glu-CTC causing the highest levels of cell death in a dose-dependent manner. Notably, these most toxic tRFs (Fig. 4) are the ones that are most abundant in ANG-treated ΔRNH1 cells (Fig. 3). Both RNA and DNA analogs of these tRFs caused toxicity, which agrees with previous reports (Ivanov et al. 2014). We note that endogenous tRNAs as well as the tRfs from which they are derived are modified in human cells, while our transfected tRFs are unmodified. tRNA modifications could affect tRF function (Blanco et al. 2014).
Although tRF sequences were the foci of our investigations, small RNA analysis also allowed us to measure tRNA levels. tRNA cleavage was used to explain ANG toxicity in Xenopus oocytes, which do not produce a homolog of RNH1 (Saxena et al. 1992). Our analysis did demonstrate a significant global decrease in tRNA levels upon treatment with ANG, but this decrease occurred in both wild-type and ΔRNH1 cells. Thus, tRNA down-regulation is unlikely to be responsible for the toxicity of ANG for ΔRNH1 cells.
Finally, miRNAs were differentially regulated in ANG-treated cells, but did not produce the sharp contrast in abundance that occurred in the tRF population. GO-term enrichment and analysis followed the same theme; although unique GO terms did exist for up-regulated and down-regulated miRNAs, those terms did not reveal any underlying biological processes that could explain the toxicity of ANG for ΔRNH1 cells. These data suggest that ANG might regulate certain miRNAs but without the consequences derived from the regulation of tRFs.
The differential regulation of tRFs and miRNAs by ANG provokes a question: Why are certain sequences highly up-regulated in ΔRNH1 cells? The increase in specific tRFs and miRNAs suggests that ANG binds and cleaves certain RNAs efficiently. ANG is known to bind an angiogenin binding element (ABE) in genomic DNA (Xu et al. 2003), but this binding motif (which is a string of CTs) is not present in our small RNAs. Motif analysis also did not identify any significantly enriched motifs in up-regulated versus down-regulated small RNA sequences. We also considered whether our small RNA sequences could form G-quadruplex structures, which are known to affect RNA stability and tRF function (Ivanov et al. 2011, 2014). Two of the highly up-regulated tRFs did contain oligo-G motifs that could form G-quadruplex structures, but the tRF with the highest abundance, tRF-5 Gly-GCC, did not contain such a motif. Further structure–function analysis is necessary to reveal the basis for this substrate specificity.
Conclusions
Historically, ANG has been shown to contribute to a myriad of cellular processes linked by a common thread: ribonucleolytic activity that promotes cell survival and proliferation (Riordan 2001; Sheng and Xu 2016). Our data alter the perception of ANG. Specifically, we have discovered that ANG can be a potent cytotoxin. ANG induces cell death by a unique mechanism—the robust up-regulation of cytotoxic tRFs. This finding contrasts with previous demonstrations of the ability of certain tRFs to arrest protein translation and encourage cell survival (Emara et al. 2010; Ivanov et al. 2011, 2014; Li and Hu 2012). Thus, under differing conditions, tRFs produced by ANG can lead to cell survival or cell death.
MATERIALS AND METHODS
Materials
Reagents were from Sigma Chemical, Invitrogen, or VWR, and were used without further purification. Synthetic tRFs and DNAs were from Integrated DNA Technologies. Aqueous solutions were made with water that was generated with an Atrium Pro water purification system from Sartorius and had resistivity ≥18 MΩ · cm−1.
HeLa cell culture
HeLa cells were cultured in Dulbecco's modified Eagle's medium (DMEM) containing fetal bovine serum (FBS) (10% v/v) and penicillin–streptomycin solution (1% v/v). Cells were incubated at 37°C in a humidified incubator under 5% v/v CO2(g).
Generation of RNH1–knockout HeLa cells
CRISPR–Cas9-mediated knockout of RNH1 in HeLa cells (ΔRNH1) and its subsequent validation by immunoblotting were performed as described previously (Thomas et al. 2016).
Purification of ribonucleases
RNase 1, ANG, and their variants were purified as described previously (Rutkoski et al. 2005; Thomas et al. 2016). The Alexa Fluor 647–ANG conjugate was prepared from Q19C ANG, and the Alexa Fluor 488–RNase 1 conjugate was prepared from P19C RNase 1 by S-alkylation of Cys19 using methods described previously (Lomax et al. 2012; Sundlass et al. 2013).
Assays of cell viability
Cell-viability assays were performed with the CellTiter 96 AQueous One Solution Cell Proliferation Assay from Promega, which is a tetrazolium dye-based assay for metabolic activity. Cells were grown, treated, and assessed as described previously (Thomas et al. 2016). Briefly, cells were grown in the wells of a 96-well plate. After 24 h, the medium was replaced with FBS-free DMEM containing various concentrations of analyte proteins. In some assays, neomycin was added to a concentration of 100 µM. (This concentration of neomycin alone produced no detectable toxicity.) All cells were then allowed to incubate for another 48 h before the addition of the MTS reagent and data collection. Data were analyzed with the program Prism from GraphPad. Values of EC50, which is the concentration of analyte that gives half-maximal cell viability, were calculated by using the equation:
| (1) |
where y is cell viability, x is the concentration of analyte, and h is the Hill coefficient. All values were the average of at least three biological replicates.
Microscopy
Prior to experiments, HeLa cells were plated for 24 h at a density of 200,000 cells/mL in 0.2 mL of medium in the wells of an eight-well µ-chamber from Ibidi. On the day of an experiment, all cells were washed with serum-free DMEM (3 × 0.2 mL). Cells were incubated with either 5 µM of Alexa Fluor 488–RNase 1 conjugate or Alexa Fluor 647–ANG conjugate (or both) for 3 h at 37°C under 5% v/v CO2(g). Nuclear counterstaining was performed with Hoechst 33342 from Invitrogen for the final 5 min at 37°C. Cells were washed with serum-free DMEM prior to imaging. Imaging was performed with an A1R+ resonant scanning confocal microscope from Nikon.
Flow cytometry
Cells were grown to a density of 200,000 cells/mL in 2.0 mL of complete growth medium in the wells of a flat-bottomed six-well plate. After 24 h, cells were washed with serum-free DMEM (3 × 2 mL). Cells were then incubated with 5 µM of Alexa Fluor 488–RNase 1 conjugate or Alexa Fluor 647–ANG conjugate (or both) for 3 h at 37°C under 5% v/v CO2(g). Cells were then washed with PBS and treated with trypsin/EDTA (0.25% w/v) for 5 min at 37°C under 5% v/v CO2(g). The trypsin was diluted with DMEM containing 10% v/v FBS, and the cells were collected by centrifugation at 400g for 5 min. The supernatant was decanted, and the cell pellet was resuspended in 1 mL of medium. The suspension was strained through a 35-µm filter into a polystyrene flow cytometry test tube from BD Biosciences. Fluorescence was measured with a FACSCalibur flow cytometer from BD Biosciences. The mean fluorescence per cell was determined in triplicate for 10,000 cells, and the data were analyzed with software from FlowJo.
Small RNA profiling
The small RNA profiles of RNase 1-treated, ANG-treated, and untreated cells were measured with the small RNA gel-electrophoresis chip from Agilent Technologies. Cells were grown to 80%–100% confluency in DMEM containing FBS (10% v/v) and penicillin–streptomycin solution (1% v/v), then counted with a Coulter cell counter and seeded into a flat-bottomed six-well plate at 100,000 cells per well. The cells were incubated for 24 h, after which the medium was replaced with FBS-free DMEM containing RNase 1 or ANG in PBS. Concentrations were chosen to produce ∼75% and ∼50% cell viability, which corresponded to 0.75 and 4 µM treatments of ANG and 1.5 and 18 µM treatments of RNase 1, respectively. After a 48-h incubation, RNA from each well was isolated with the miRCURY Cell and Plant RNA Isolation kit from Exiqon following the manufacturer's instructions. A small aliquot from each sample was then loaded onto a small RNA chip using the Small RNA Analysis kit from Agilent Technologies. Samples were analyzed at the University of Wisconsin Biotechnology Center with a 2100 Bioanalyzer system from Agilent Technologies.
Small RNA sequencing
The sequences of small RNA species, including miRNAs, tRFs, and full-length tRNAs, were determined with technology from Illumina. Briefly, cells were plated, treated, and harvested using the same methods and concentrations described above for small RNA profiling. RNA was also purified from samples using the miRCURY kit but with the addition of purified RNH1 (∼20 µg) to the cell lysate of RNase 1-treated samples to minimize RNA degradation. After collecting three biological replicates per condition, sample concentrations were measured with a Nanovue spectrophotometer from GE Healthcare prior to their sequencing. Sequences were obtained by using standard Illumina TruSeq small RNA protocols with the following exceptions. After adaptor ligation and reverse transcription, the PCR product was subjected to gel electrophoresis, and a band corresponding to 145–300 bp was excised from the gel. These lengths correspond to RNA of 20–175 nt, which includes miRNA, tRF, and tRNA species. All samples were then run on one lane of a HiSeq 2500 instrument from Illumina. Notably, the high-throughput sequencing of tRFs and full-length tRNAs can be affected by tertiary structure and post-transcriptional modifications (Wilusz 2015; Lyons et al. 2017). These effects are, however, expected to be constant among samples herein, enabling meaningful comparisons (Okamura 2012; Olvedy et al. 2016).
miRNA and tRNA sequence analysis
Analyses performed for both tRNA and miRNA sequences
Data were checked for quality with FastQC and then loaded into iSMart, which allows access to a variety of small RNA analysis tools through a Virtual Box-based graphical user interface (Panero et al. 2017). Fastq files were first loaded into Cutadapt to remove TruSeq small RNA adaptor sequences (Martin 2011). Reads aligning to rRNA sequences were filtered out, and then cut reads were aligned to hg19 miRNA and tRNA libraries using the recommended defaults for sRNABench (Rueda et al. 2015). The analysis of differential abundance from three biological replicates per condition was performed by using NOISeqBIO with reads per million (RPM) normalization (Tarazona et al. 2015). Normalized read-counts for each sample were exported into a spreadsheet and then loaded into Cluster3.0 for principal components analysis (PCA) (de Hoon et al. 2004). Reads whose probability of having a differential abundance was ≥95%, which corresponds to P ≤ 0.05, were compiled into a table for clustering analysis. This table was then loaded into Cluster 3.0 to perform hierarchical clustering using centroid linkages. Clusters were visualized with Java Treeview (Saldanha 2004) or MATLAB.
Analyses performed only for tRNA sequences
During sRNABench alignment, the minimum read-length for tRNA alignment was increased from 16 to 32 nt to filter out any reads that should align to tRFs. These parameters did reduce substantially the number of tRNAs that were identified as having differential levels, from >500 with a 16-nt minimum to 306 with a 32-nt minimum. Nonetheless, fold changes followed the same trends under both conditions.
Analyses performed only for miRNA sequences
miRNA sequences from specific hierarchical clusters were loaded into the web-based tool miEAA and analyzed for enrichment using the default settings (Backes et al. 2016). Significant GO annotations for sets of miRNAs with differential abundance were then loaded into the REVIGO web server for term reduction and analysis (Supek et al. 2011). REVIGO reduction was performed using the Small Allowed Similarity setting. These lists were then loaded into Cytoscape 3.5.0 for network analysis (Shannon et al. 2003). Lastly, sequences were loaded into the DREME web server to perform motif analysis (Bailey 2011). Up-regulated miRNA sequences were compared to down-regulated sequences to check for possible ANG binding motifs. In all cases, significant differences correspond to P ≤ 0.05.
tRF sequence analysis
tRF analysis requires several processing steps to identify reads corresponding to full-length tRNAs and genomic tRNA transcripts. The tRF2Cancer web server was used for tRF analysis (Zheng et al. 2016). Briefly, cut reads from the CutAdapt tool on the iSMart Virtual Machine were collapsed using the FASTX-Toolkit developed by G.H. Hannon (Cold Spring Harbor Laboratory, NY). Reads were then loaded into the tRF2Cancer server and analyzed with default parameters except that the maximum read-length was increased to 32 to include as many tRF species as possible. The alignment score (which corresponds to RPM) was used as a normalized value for PCA with Cluster 3.0. Each biological replicate was then normalized by the total reads per replicate, and differential abundance was assessed by using NOISeqBIO. Only tRFs that were present in two of the three biological replicates were considered in this analysis. The filtering and analysis (including motif analysis) of tRFs with differential abundance was then performed as described for miRNAs and tRNAs. Lastly, G-quadruplex structure was investigated by using the QGRS mapper web server (Kikin et al. 2006).
Transfection of synthetic tRFs
tRFs with 5′-phosphate groups were obtained from IDT as described previously (Emara et al. 2010). The sequences were P-5′-tRF-Gly-GCC: GCAUGGGUGGUUCAGUGGUAGAAUUCUCGCCU, P-5′-tRF-Gln-CTG: GGUUCCAUGGUGUAAUGGUUAGCACUCUGGAC, and P-5′-tRF-Glu-CTC: UCCCUGGUGGUCUAGUGGUUAGGAUUCGGCGC. The single-stranded DNA analogs of these sequences were also obtained from IDT, as was a control DNA that did not vary in level across treatment conditions (5′-tRF-Lys-CTT: GCCCGGCTAGCTCAGTCGGTAGAGCATGAGAC). To assess tRF toxicity, each tRF and DNA analog was transfected into wild-type and ΔRNH1 cells, which were then grown as described above for cell viability assays. jetPRIME transfection reagents from Polyplus Transfection were used according to the manufacturer's instructions, and each tRF and DNA analog was incubated with the reagent for at least 10 min prior to its addition to cell culture medium. After a 1-h incubation, the medium was removed and replaced with FBS-free medium. Cells were then allowed to incubate for an additional 48 h before their viability was assayed as described above. Cells were also treated with transfection reagent alone to ensure that toxicity was not due to transfection conditions. All values were the compilation of at least three biological replicates. Significant differences were calculated by Student's t-test using the program Prism.
SUPPLEMENTAL MATERIAL
Supplemental material is available for this article.
Supplementary Material
ACKNOWLEDGMENTS
We are grateful to Professor Jin-Soo Kim and Dr. Eunji Kim of Seoul National University for generating and providing ΔRNH1 HeLa cells. S.P.T. was supported by a National Science Foundation Graduate Research Fellowship. T.T.H. was supported by an Advanced Opportunity/Graduate Research Scholar Fellowship and by Molecular Biosciences Training grant T32 GM007215 (National Institutes of Health). This work was supported by grant R01 CA073808 (National Institutes of Health). We thank the University of Wisconsin Biotechnology Center DNA Sequencing Facility for providing facilities and services for small RNA sequencing. Flow cytometry was performed at the University of Wisconsin Carbone Cancer Center Flow Cytometry Laboratory, which was supported by Grant P30 CA014520 (National Institutes of Health). Confocal microscopy was performed at the University of Wisconsin–Madison Biochemistry Optical Core, which was established with support from the University of Wisconsin–Madison Department of Biochemistry Endowment.
Footnotes
Article is online at http://www.rnajournal.org/cgi/doi/10.1261/rna.065516.117.
REFERENCES
- Backes C, Khaleeq QT, Meese E, Keller A. 2016. miEAA: microRNA enrichment analysis and annotation. Nucleic Acids Res 44: W110–W116. [DOI] [PMC free article] [PubMed] [Google Scholar]
- Badet J. 1999. Angiogenin, a potent mediator of angiogenesis. Biological, biochemical and structural properties. Pathol Biol (Paris) 47: 345–351. [PubMed] [Google Scholar]
- Bailey TL. 2011. DREME: motif discovery in transcription factor ChIP-seq data. Bioinformatics 27: 1653–1659. [DOI] [PMC free article] [PubMed] [Google Scholar]
- Bárcena C, Stefanovic M, Tutusaus A, Martinez-Nieto GA, Martinez L, García-Ruiz C, de Mingo A, Caballeria J, Fernandez-Checa JC, Marí M, et al. 2015. Angiogenin secretion from hepatoma cells activates hepatic stellate cells to amplify a self-sustained cycle promoting liver cancer. Sci Rep 5: 7916. [DOI] [PMC free article] [PubMed] [Google Scholar]
- Blanco S, Dietmann S, Flores JV, Hussain S, Kutter C, Humphreys P, Lukk M, Lombard P, Treps L, Popis M, et al. 2014. Aberrant methylation of tRNAs links cellular stress to neuro-developmental disorders. EMBO J 33: 2020–2039. [DOI] [PMC free article] [PubMed] [Google Scholar]
- Blázquez M, Fominaya JM, Hofsteenge J. 1996. Oxidation of sulfhydryl groups of ribonuclease inhibitor in epithelial cells is sufficient for its intracellular degradation. J Biol Chem 271: 18638–18642. [DOI] [PubMed] [Google Scholar]
- Chao TY, Raines RT. 2013. Fluorogenic label to quantify the cytosolic delivery of macromolecules. Mol Biosyst 9: 339–342. [DOI] [PMC free article] [PubMed] [Google Scholar]
- de Hoon MJ, Imoto S, Nolan J, Miyano S. 2004. Open source clustering software. Bioinformatics 20: 1453–1454. [DOI] [PubMed] [Google Scholar]
- Deng J, Ptashkin RN, Chen Y, Cheng Z, Liu G, Phan T, Deng X, Zhou J, Lee I, Lee YS, et al. 2015. Respiratory syncytial virus utilizes a tRNA fragment to suppress antiviral responses through a novel targeting mechanism. Mol Ther 23: 1622–1629. [DOI] [PMC free article] [PubMed] [Google Scholar]
- Dickson KA, Haigis MC, Raines RT. 2005. Ribonuclease inhibitor: Structure and function. Prog Nucleic Acid Res Mol Biol 80: 349–374. [DOI] [PMC free article] [PubMed] [Google Scholar]
- Eller CH, Lomax JE, Raines RT. 2014. Bovine brain ribonuclease is the functional homolog of human ribonuclease 1. J Biol Chem 289: 25996–26006. [DOI] [PMC free article] [PubMed] [Google Scholar]
- Emara MM, Ivanov P, Hickman T, Dawra N, Tisdale S, Kedersha N, Hu Gf, Anderson P. 2010. Angiogenin-induced tRNA-derived stress-induced RNAs promote stress-induced stress granule assembly. J Biol Chem 285: 10959–10968. [DOI] [PMC free article] [PubMed] [Google Scholar]
- Fett JW, Strydom DJ, Lobb RR, Alderman EM, Bethune JL, Riordan JF, Vallee BL. 1985. Isolation and characterization of angiogenin, an angiogenic protein from human carcinoma cells. Biochemistry 24: 5480–5486. [DOI] [PubMed] [Google Scholar]
- Fominaya JM, Hofsteenge J. 1992. Inactivation of ribonuclease inhibitor by thiol–disulfide exchange. J Biol Chem 267: 24655–24660. [PubMed] [Google Scholar]
- Haigis MC, Raines RT. 2003. Secretory ribonucleases are internalized by a dynamin-independent endocytic pathway. J Cell Sci 116: 313–324. [DOI] [PMC free article] [PubMed] [Google Scholar]
- Haigis MC, Kurten EL, Raines RT. 2003. Ribonuclease inhibitor as an intracellular sentry. Nucleic Acids Res 31: 1024–1032. [DOI] [PMC free article] [PubMed] [Google Scholar]
- Hoang TT, Raines RT. 2017. Molecular basis for the autonomous promotion of cell proliferation by angiogenin. Nucleic Acids Res 45: 818–831. [DOI] [PMC free article] [PubMed] [Google Scholar]
- Hu Gf. 1998. Neomycin inhibits angiogenin-induced angiogenesis. Proc Natl Acad Sci 95: 9791–9795. [DOI] [PMC free article] [PubMed] [Google Scholar]
- Hu GF, Strydom DJ, Fett JW, Riordan JF, Vallee BL. 1993. Actin is a binding protein for angiogenin. Proc Natl Acad Sci 90: 1217–1221. [DOI] [PMC free article] [PubMed] [Google Scholar]
- Hu Gf, Riordan JF, Vallee BL. 1997. A putative angiogenin receptor in angiogenin-responsive human endothelial cells. Proc Natl Acad Sci 94: 2204–2209. [DOI] [PMC free article] [PubMed] [Google Scholar]
- Ivanov P, Emara MM, Villen J, Gygi SP, Anderson P. 2011. Angiogenin-induced tRNA fragments inhibit translation initiation. Mol Cell 43: 613–623. [DOI] [PMC free article] [PubMed] [Google Scholar]
- Ivanov P, O'Day E, Emara MM, Wagner G, Lieberman J, Anderson P. 2014. G-quadruplex structures contribute to the neuroprotective effects of angiogenin-induced tRNA fragments. Proc Natl Acad Sci 111: 18201–18206. [DOI] [PMC free article] [PubMed] [Google Scholar]
- Kieran D, Sebastia J, Greenway MJ, King MA, Connaughton D, Concannon CG, Fenner B, Hardiman O, Prehn JH. 2008. Control of motoneuron survival by angiogenin. J Neurosci 28: 14056–14061. [DOI] [PMC free article] [PubMed] [Google Scholar]
- Kikin O, D'Antonio L, Bagga PS. 2006. QGRS Mapper: a web-based server for predicting G-quadruplexes in nucleotide sequences. Nucleic Acids Res 34: W676–W682. [DOI] [PMC free article] [PubMed] [Google Scholar]
- Kim BM, Schultz LW, Raines RT. 1999. Variants of ribonuclease inhibitor that resist oxidation. Protein Sci 8: 430–434. [DOI] [PMC free article] [PubMed] [Google Scholar]
- Lee FS, Shapiro R, Vallee BL. 1989. Tight-binding inhibition of angiogenin and ribonuclease A by placental ribonuclease inhibitor. Biochemistry 28: 225–230. [DOI] [PubMed] [Google Scholar]
- Leland PA, Staniszewski KE, Park C, Kelemen BR, Raines RT. 2002. The ribonucleolytic activity of angiogenin. Biochemistry 41: 1343–1350. [DOI] [PubMed] [Google Scholar]
- Li S, Hu GF. 2012. Emerging role of angiogenin in stress response and cell survival under adverse conditions. J Cell Physiol 227: 2822–2826. [DOI] [PMC free article] [PubMed] [Google Scholar]
- Li Q, Hu B, Hu Gw, Chen Cy, Niu X, Liu J, Zhou Sm, Zhang C1, Wang Y, Deng ZF. 2016. tRNA-derived small non-coding RNAs in response to ischemia inhibit angiogenesis. Sci Rep 6: 20850. [DOI] [PMC free article] [PubMed] [Google Scholar]
- Lixin R, Efthymiadis A, Henderson B, Jans DA. 2001. Novel properties of the nucleolar targeting signal of human angiogenin. Biochem Biophys Res Commun 284: 185–193. [DOI] [PubMed] [Google Scholar]
- Lomax JE, Eller CH, Raines RT. 2012. Rational design and evaluation of mammalian ribonuclease cytotoxins. Methods Enzymol 502: 273–290. [DOI] [PMC free article] [PubMed] [Google Scholar]
- Lyons SM, Achorn C, Kedersha NL, Anderson PJ, Ivanov P. 2016. YB-1 regulates tiRNA-induced stress granule formation but not translational repression. Nucleic Acids Res 44: 6949–6960. [DOI] [PMC free article] [PubMed] [Google Scholar]
- Lyons SM, Fay MM, Akiyama Y, Anderson PJ, Ivanov P. 2017. RNA biology of angiogenin: current state and perspectives. RNA Biol 14: 171–178. [DOI] [PMC free article] [PubMed] [Google Scholar]
- Martin M. 2011. Cutadapt removes adapter sequences from high-throughput sequencing reads. EMBnetjournal 17: 10–12. [Google Scholar]
- Moroianu J, Riordan JF. 1994. Nuclear translocation of angiogenin in proliferating endothelial cells is essential to its angiogenic activity. Proc Natl Acad Sci 91: 1677–1681. [DOI] [PMC free article] [PubMed] [Google Scholar]
- Okamura K. 2012. Diversity of animal small RNA pathways and their biological utility. Wiley Interdiscip Rev RNA 3: 351–368. [DOI] [PubMed] [Google Scholar]
- Olvedy M, Scaravilli M, Hoogstrate Y, Visakorpi T, Jenster G, Martens-Uzunova ES. 2016. A comprehensive repertoire of tRNA-derived fragments in prostate cancer. Oncotarget 7: 24766–24777. [DOI] [PMC free article] [PubMed] [Google Scholar]
- Panero R, Rinaldi A, Memoli D, Nassa G, Ravo M, Rizzo F, Tarallo R, Milanesi L, Weisz A, Giurato G. 2017. iSmaRT: A toolkit for a comprehensive analysis of small RNA-seq data. Bioinformatics 33: 938–940. [DOI] [PubMed] [Google Scholar]
- Papageorgiou AC, Shapiro R, Acharya KR. 1997. Molecular recognition of human angiogenin by placental ribonuclease inhibitor—an X-ray crystallographic study at 2.0 Å resolution. EMBO J 16: 5162–5177. [DOI] [PMC free article] [PubMed] [Google Scholar]
- Pizzo E, Sarcinelli C, Sheng J, Fusco S, Formiggini F, Netti P, Yu W, D'Alessio G, Hu Gf. 2013. Ribonuclease/angiogenin inhibitor 1 regulates stress-induced subcellular localization of angiogenin to control growth and survival. J Cell Sci 126: 4308–4319. [DOI] [PMC free article] [PubMed] [Google Scholar]
- Riordan JF. 2001. Angiogenin. Methods Enzymol 341: 263–273. [DOI] [PubMed] [Google Scholar]
- Rueda A, Barturen G, Lebron R, Gomez-Martin C, Alganza A, Oliver JL, Hackenberg M. 2015. sRNAtoolbox: an integrated collection of small RNA research tools. Nucleic Acids Res 43: W467–W473. [DOI] [PMC free article] [PubMed] [Google Scholar]
- Rutkoski TJ, Kurten EL, Mitchell JC, Raines RT. 2005. Disruption of shape-complementarity markers to create cytotoxic variants of ribonuclease A. J Mol Biol 354: 41–54. [DOI] [PubMed] [Google Scholar]
- Saikia M, Hatzoglou M. 2015. The many virtues of tRNA-derived stress-induced RNAs (tiRNAs): discovering novel mechanisms of stress response and effect on human health. J Biol Chem 290: 29761–29768. [DOI] [PMC free article] [PubMed] [Google Scholar]
- Saikia M, Krokowski D, Guan BJ, Ivanov P, Parisien M, Hu Gf, Anderson P, Pan T, Hatzoglou M. 2012a. Genome-wide identification and quantitative analysis of cleaved tRNA fragments induced by cellular stress. J Biol Chem 287: 42708–42725. [DOI] [PMC free article] [PubMed] [Google Scholar]
- Saikia M, Krokowski D, Guan BJ, Ivanov P, Parisien M, Hu Gf, Anderson P, Pan T, Hatzoglou M. 2012b. Genome-wide identification and quantitative analysis of cleaved tRNA fragments induced by cellular stress. J Biol Chem 287: 42708–42725. [DOI] [PMC free article] [PubMed] [Google Scholar]
- Saldanha AJ. 2004. Java Treeview—extensible visualization of microarray data. Bioinformatics 20: 3246–3248. [DOI] [PubMed] [Google Scholar]
- Saxena SK, Rybak SM, Davey RT Jr, Youle RJ, Ackerman EJ. 1992. Angiogenin is a cytotoxic, tRNA-specific ribonuclease in the RNase A superfamily. J Biol Chem 267: 21982–21986. [PubMed] [Google Scholar]
- Shannon P, Markiel A, Ozier O, Baliga NS, Wang JT, Ramage D, Amin N, Schwikowski B, Ideker T. 2003. Cytoscape: a software environment for integrated models of biomolecular interaction networks. Genome Res 13: 2498–2504. [DOI] [PMC free article] [PubMed] [Google Scholar]
- Shapiro R, Vallee BL. 1989. Site-directed mutagenesis of histidine-13 and histidine-114 of human angiogenin. Alanine derivatives inhibit angiogenin-induced angiogenesis. Biochemistry 28: 7401–7408. [DOI] [PubMed] [Google Scholar]
- Sharma U, Conine CC, Shea JM, Boskovic A, Derr AG, Bing XY, Belleannee C, Kucukural A, Serra RW, Sun F, et al. 2016. Biogenesis and function of tRNA fragments during sperm maturation and fertilization in mammals. Science 351: 391–396. [DOI] [PMC free article] [PubMed] [Google Scholar]
- Sheng J, Xu Z. 2016. Three decades of research on angiogenin: a review and perspective. Acta Biochim Biophys Sin 48: 399–410. [DOI] [PMC free article] [PubMed] [Google Scholar]
- Skorupa A, King MA, Aparicio IM, Dussmann H, Coughlan K, Breen B, Kieran D, Concannon CG, Marin P, Prehn JH. 2012. Motoneurons secrete angiogenin to induce RNA cleavage in astroglia. J Neurosci 32: 5024–5038. [DOI] [PMC free article] [PubMed] [Google Scholar]
- Smith BD, Raines RT. 2006. Genetic selection for critical residues in ribonucleases. J Mol Biol 362: 459–478. [DOI] [PubMed] [Google Scholar]
- Sorrentino S. 2010. The eight human “canonical” ribonucleases: molecular diversity, catalytic properties, and special biological actions of the enzyme proteins. FEBS Lett 584: 2194–2200. [DOI] [PubMed] [Google Scholar]
- Sorrentino S, Libonati M. 1994. Human pancreatic-type and nonpancreatic-type ribonucleases: a direct side-by-side comparison of their catalytic properties. Arch Biochem Biophys 312: 340–348. [DOI] [PubMed] [Google Scholar]
- Sundlass NK, Eller CH, Cui Q, Raines RT. 2013. Contribution of electrostatics to the binding of pancreatic-type ribonucleases to membranes. Biochemistry 52: 6304–6312. [DOI] [PMC free article] [PubMed] [Google Scholar]
- Supek F, Bosnjak M, Skunca N, Smuc T. 2011. REVIGO summarizes and visualizes long lists of gene ontology terms. PLoS One 6: e21800. [DOI] [PMC free article] [PubMed] [Google Scholar]
- Tarazona S, Furio-Tari P, Turra D, Pietro AD, Nueda MJ, Ferrer A, Conesa A. 2015. Data quality aware analysis of differential expression in RNA-seq with NOISeq R/Bioc package. Nucleic Acids Res 43: e140. [DOI] [PMC free article] [PubMed] [Google Scholar]
- Thomas SP, Kim E, Kim JS, Raines RT. 2016. Knockout of the ribonuclease inhibitor gene leaves human cells vulnerable to secretory ribonucleases. Biochemistry 55: 6359–6362. [DOI] [PMC free article] [PubMed] [Google Scholar]
- Wang Q, Lee I, Ren J, Ajay SS, Lee YS, Bao X. 2013. Identification and functional characterization of tRNA-derived RNA fragments (tRFs) in respiratory syncytial virus infection. Mol Ther 21: 368–379. [DOI] [PMC free article] [PubMed] [Google Scholar]
- Weng C, Dong H, Chen G, Zhai Y, Bai R, Hu H, Lu L, Xu Z. 2012. miR-409–3p inhibits HT1080 cell proliferation, vascularization and metastasis by targeting angiogenin. Cancer Lett 323: 171–179. [DOI] [PubMed] [Google Scholar]
- Wilusz JE. 2015. Removing roadblocks to deep sequencing of modified RNAs. Nat Methods 12: 821–822. [DOI] [PMC free article] [PubMed] [Google Scholar]
- Xu Zp, Tsuji T, Riordan JF, Hu Gf. 2003. Identification and characterization of an angiogenin-binding DNA sequence that stimulates luciferase reporter gene expression. Biochemistry 42: 121–128. [DOI] [PubMed] [Google Scholar]
- Yamasaki S, Ivanov P, Hu Gf, Anderson P. 2009. Angiogenin cleaves tRNA and promotes stress-induced translational repression. J Cell Biol 185: 35–42. [DOI] [PMC free article] [PubMed] [Google Scholar]
- Zheng LL, Xu WL, Liu S, Sun WJ, Li JH, Wu J, Yang JH, Qu LH. 2016. tRF2Cancer: a web server to detect tRNA-derived small RNA fragments (tRFs) and their expression in multiple cancers. Nucleic Acids Res 44: W185–W193. [DOI] [PMC free article] [PubMed] [Google Scholar]
Associated Data
This section collects any data citations, data availability statements, or supplementary materials included in this article.