

Abstract
Lymph node metastasis is an important prognosis factor in non‐small cell lung cancer (NSCLC) patients. The aim of this study was to investigate the role of epithelial to mesenchymal transition (EMT) in lymph node progression in the early stages of NSCLC. We studied a retrospective cohort of 160 consecutive surgically treated NSCLC patients with available frozen tumor samples for expression of EMT markers (CDH1, CTNNB1, CDH2, and VIMENTIN), inducers (TGFB1, c‐MET, and CAIX), and transcription factors (EMT‐TF:SNAI1, SNAI2, ZEB1, TWIST1, and TWIST2). Partial EMT was more frequent in N1‐2 (N+) vs N0 patients (P < .01). TGFB1 (P = .02) as well as SNAI2 (P < .01) and TWIST1 (P = .04) were the most differentially expressed genes in N+ tumors. In this group, ZEB1 was correlated with all EMT inducers and other EMT‐TFs were overexpressed depending on the inducers. CAIX was an independent prognostic factor for overall survival (IC 95% HR: 1.10‐5.14, P = .03). Partial EMT is involved in lymph node progression of NSCLC patients and depends on the TGFβ pathway. EMT‐TFs are differentially expressed depending on EMT inducers. CAIX might be a relevant prognostic marker in early stage NSCLC.
Keywords: epithelial‐mesenchymal transition, hypoxia, lymph node metastasis, nonsmall cell lung cancer, SNAI2, TGFβ, TWIST1
1. INTRODUCTION
Non‐small cell lung cancer (NSCLC) is the leading cause of cancer‐related death worldwide.1 Surgical resection is the best treatment for early stage NSCLC patients (I to IIIA UICC stage), which includes lymph node metastasis (N1, N2 status) or not (N0 status).2, 3 Although surgery improves overall survival (OS), local relapse or distant metastasis is frequent and leads to mortality.4 Lymph node status is an independent prognostic factor of NSCLC, but the mechanisms underlying progression from N0 status to N+ status remain poorly understood.5
During embryonic development, polarized epithelial cells can undergo morphological changes to mesenchymal cells by so‐called epithelial‐mesenchymal transition (EMT). These cells lose their epithelial features to become mesenchymal‐like cells, without cell‐to‐cell contacts.6 EMT also occurs in inflammatory processes and in cancer progression, in which EMT could be involved in invasion, migration, and anti‐apoptotic features as well as drug resistance.7 EMT is reversible, via mesenchymal‐epithelial transition (MET), which could occur in metastatic localizations.8
The EMT phenotype can be described analyzing epithelial markers, such as E‐Cadherin and β‐Catenin, and mesenchymal markers, such as N‐Cadherin and Vimentin.6, 9 E‐Cadherin depletion leads to nuclear relocalization of β‐Catenin, supporting EMT.10, 11 EMT effectors are also called EMT transcriptional factors (EMT‐TFs). These proteins are transcriptional repressors of epithelial markers, such as CDH1, which encodes the E‐cadherin protein, and/or transcriptional activators of mesenchymal markers, such as CDH2, which encodes the N‐Cadherin protein.4, 12, 13, 14, 15 EMT‐TF are represented by the zinc‐finger proteins SNAI1 (SNAIL), SNAI2 (SLUG), ZEB1, and ZEB2 as well as the basic helix‐loop‐helix factors TWIST1 and TWIST2, among others.6, 14 EMT inducers include several signaling pathways, such as TGFβ, epithelial growth factor (EGF), hepatocyte growth factor (HGF), and its receptor c‐MET, AKT‐mTOR, MAPK/ERK, NF‐ĸB, Wnt, Hedgehog, Notch, or hypoxia.12
In NSCLC, EMT could be an important process for development of local lymph nodes or distant metastasis.16, 17, 18 To our knowledge, this is the first systematic analysis of different EMT actors in early stage NSCLC depending on the lymph node status, which is the first step for lung tumor progression. The aim of this retrospective study was to describe some EMT markers, effectors, and inducers in a retrospective cohort of early stage NSCLC by comparing N0 and N+ patients.
2. PATIENTS AND METHODS
2.1. Patients and tumor tissue samples
We retrospectively reviewed all consecutive NSCLC patients treated by surgery between January 2010 and December 2012 at the University Hospital of Strasbourg, France (Figure S1). We selected patients for which sufficient formalin‐fixed paraffin‐embedded (FFPE) material and frozen sections of the tumor were available, with a tumor cellularity beyond 30% of tumor cells. Research was conducted according to the recommendations outlined in the Helsinki Declaration. Patients provided signed consent, and approval from the Institutional Review Board was obtained (Comité d'Ethique du CHU de Strasbourg, 4, rue Kirschleger, 67085 Strasbourg Cedex, France, N° 2013‐35, Pr. B. Geny, obtained October 8th, 2013). Patients were separated in two groups depending on lymph node status: the N0 group of patients without lymph node metastasis and N+ group of patients with lymph node metastasis (N1 or N2 status). Clinical data concerning age, gender, smoking history, chemotherapy, or EGFR Tyrosine Kinase Inhibitors (TKI) treatment, recurrence, and death were collected. A nonsmoker patient was defined as smoking less than 100 cigarettes in a lifetime. Pathological staging was based on the TNM (Tumor‐Node‐Metastasis) guidelines of the UICC (Union for International Cancer Control) 7th edition for the classification of lung cancer.5 NSCLC were classified according to the 2004 WHO classification.19 Adenocarcinomas (ADC) were re‐classified according to recent IASLC/ATS/ERS recommendations.20 Follow‐up was completed on 1 April 2015, which was defined as the deadline date.
2.2. Immunohistochemical analysis
Formalin‐fixed paraffin‐embedded blocks representative of the tumor were selected. Four micrometer sections were obtained from paraffin blocks. Two primary monoclonal antibodies were used: a c‐MET rabbit monoclonal antibody (SP44 clone, prediluted, Roche Tissue Diagnostics/Ventana Medical Systems, Tucson, AZ, USA) and carbonic anhydrase IX (CAIX) rabbit polyclonal antibody (Ab15086 clone, 1/1000, Cambridge, MA, USA). Immunohistochemistry (IHC) was performed using a Ventana Benchmark IHC platform. Subsequent steps were performed with the UltraView Universal DAB Detection Kit (Roche Tissue Diagnostics/Ventana Medical Systems, Tucson, AZ, USA). Two pathologists (CE, PLVQ) independently graded the staining intensity of all tumors. For each tumor specimen, the results from the two pathologists were averaged, and if the difference was over 10%, common reading and grading were performed. For c‐MET, the following intensity scores were assigned: no signal, 0; weak complete membranous signal, 1; moderate complete membranous signal (similar to normal alveolar epithelium), 2; and intense complete membranous signal, 3. For CAIX, the following intensity scores were assigned: no signal, 0; weak cytoplasmic and/or membranous signal, 1; moderate cytoplasmic and/or membranous signal, 2; and intense cytoplasmic and/or membranous signal, 3. The fraction of stained cells was determined for each intensity score. For c‐MET and CAIX, the tumor was considered positive (protein overexpression) if 50% or more tumor cells were labeled with intensity scores of 2 or 3.
2.3. EGFR, KRAS, BRAF, HER2, and PIK3CA mutational status and ALK gene rearrangement analysis
Molecular analyses were performed on FFPE tumor samples as previously described.21
2.4. Real‐time quantitative reverse transcription PCR (RT‐qPCR)
After morphological control for the presence of ≥30% tumor cells on H&E tissue sections, total RNA was extracted from frozen samples of each tumor with TRIzol reagent according to the manufacturer's protocol (Thermo Fisher Scientific, Waltham, MA, USA). Nontumoral frozen lung tissues (n = 10) were used for relative qPCR. The integrity of total RNA (RIN) was verified in all samples with an Agilent 2100 Bioanalyser (Agilent Technologies, Santa Clara, CA, USA). RNA quantification was performed by spectrophotometry (Nanodrop 2000, Thermo Fisher Scientific, Waltham, MA, USA), and complementary DNA (cDNA) was synthetized by reverse transcription (RT) from 1 μg of total RNA with the Superscript VILO cDNA Synthesis Kit (Thermo Fisher Scientific, Waltham, MA, USA). The following genes were studied: CDH1, CDH2, CTNNB1, VIMENTIN, SNAI1, SNAI2, ZEB1, TWIST1, TWIST2, TGFB1, TGFBR1, TGFBR2, c‐MET, HIF1α, and HIF2α, and normalized with the reference gene PBGD (QuantiTect Primer, Qiagen, Hilden, Germany). Quantitative real‐time polymerase chain reaction (qPCR) was performed using the QuantiTect SYBR Green PCR Kit (Qiagen, Hilden, Germany) in a total volume of 10 μL on a Roche LightCycler 480 Real‐Time PCR System (Roche Diagnostics, Indianapolis, IN, USA). Real‐time qPCR was performed under the following conditions: denaturation at 94°C for 15 seconds, annealing at 55°C for 30 seconds and extension at 72°C for 30 seconds. The experiments were performed in triplicate. The relative levels of gene expression were represented as ΔCt = Cttarget gene − Ctreference gene, and the relative ratios of gene expression between NSCLC tissues and a pool of nontumorous lung tissues were calculated by the 2−ΔΔCt method. For CDH1 and CTNNB1, gene expression was considered lost when the relative ratio values were lower than 0.5. For all other genes, overexpression was defined by a relative ratio above 2. For EMT phenotype analysis, partial EMT was defined by normal E‐Cadherin expression with N‐Cadherin overexpression, while total EMT was defined by E‐Cadherin loss of expression combined with N‐Cadherin overexpression.
2.5. Statistical analysis
The association of the clinical and pathological characteristics with the IHC and RT‐qPCR results was analyzed using the chi‐square test and Fisher's exact test. Overall survival (OS) was defined as the period of time from the date of surgery to the date of death or defined deadline date (1 April 2015). Relapse‐free survival (RFS) was defined as the period of time from the date of surgery to the date of relapse or defined deadline date. The Kaplan‐Meier method was used to calculate RFS or OS, and the survival curves were compared using the Log‐rank test. Univariate and multivariate analyses were performed using Cox proportional hazards models. All factors with a value of P ≤ .05 in univariate analysis were included in the multivariate analyses. In the analyses, P ≤ .05 was considered statistically significant. Statistical analyses were performed using the IBM SPSS Statistics 20.0 software for windows (IBM Corp, Armonk, NY, USA).
3. RESULTS
3.1. Clinical, pathological, and molecular characteristics of patients
There were 138 smokers (86%) and 18 (11%) never smokers (Table 1). Histological analysis reported 116 (72%) cases of adenocarcinomas (ADC), 38 (24%) cases of squamous cell carcinomas (SCC), and six (4%) cases of other types of carcinomas. Lymph node metastasis (N+) was present in 80 (50%) patients, with N1 and N2 status in 39% and 41% cases, respectively. Molecular analysis showed 15 (9%) tumors with EGFR mutations (four deletions, eight L858R mutations, and four other EGFR mutations) and 51 (32%) tumors with KRAS mutations (40 codon 12 mutations and 11 codon 13 mutations); the other mutations were rare (two BRAF V600E mutations, one HER2 insertion, and four PIK3CA mutations). No ALK rearrangement was found. When comparing the N0 group with the N+ group, more SCC cases were present in the N+ group (n = 26 in N+ vs n = 12 in N0, respectively, P = .02). N+ patients received more frequently neoadjuvant chemotherapy (14 vs 6 in N+ and N0, respectively, P = .05) and EGFR TKI treatment (15 vs 6 in N+ and N0, respectively, P = .04).
Table 1.
Clinical, pathological, and molecular characteristics of patients
| All patients | N0 | N+ | P value | |
|---|---|---|---|---|
| Total N (%) | 160 (100) | 80 (50) | 80 (50) | |
| Clinical features | ||||
| Age at diagnosis | ||||
| ≤60 y | 66 (41) | 31 (39) | 35 (44) | NS |
| >60 y | 94 (59) | 49 (61) | 45 (56) | |
| Gender | ||||
| Male | 109 (68) | 55 (69) | 54 (68) | NS |
| Female | 51 (32) | 25 (31) | 26 (32) | |
| Smocking history | ||||
| Never smoked | 18 (11) | 9 (11) | 9 (11) | NS |
| Ex‐smoker | 62 (39) | 24 (30) | 38 (47) | |
| Current smoker | 76 (47) | 45 (56) | 31 (39) | |
| Unknown | 4 (3) | 2 (3) | 2 (3) | |
| Neoadjuvant chemotherapy | ||||
| No | 140 (87) | 74 (93) | 66 (82) | .05 |
| Yes | 20 (13) | 6 (7) | 14 (18) | |
| TKI treatment | ||||
| No | 128 (80) | 67 (84) | 61 (76) | .04 |
| Yes | 21 (13) | 6 (7) | 15 (19) | |
| Unknown | 11 (7) | 7 (9) | 4 (5) | |
| Pathological features | ||||
| Histology | ||||
| Adenocarcinomas | 116 (72) | 64 (80) | 52 (64) | .02 |
| Solid predominant | 39 (24) | 19 (24) | 20 (25) | |
| Acinar predominant | 48 (30) | 22 (28) | 26 (33) | |
| Papillary predominant | 6 (4) | 4 (5) | 2 (2) | |
| Micropapillary predominant | 9 (6) | 7 (9) | 2 (2) | |
| Lepidic predominant | 10 (6) | 8 (10) | 2 (2) | |
| Mucinous predominant | 2 (1) | 2 (2) | 0 (0) | |
| Colloid predominant | 2 (1) | 2 (2) | 0 (0) | |
| Squamous cell carcinomas | 38 (24) | 12 (15) | 26 (33) | |
| Othersa | 6 (4) | 4 (5) | 2 (3) | |
| pT‐Stage | ||||
| 1 | 39 (24) | 25 (31) | 14 (18) | NS |
| 2 | 67 (42) | 34 (42) | 33 (41) | |
| 3 | 43 (27) | 15 (19) | 28 (35) | |
| 4 | 11 (7) | 6 (8) | 5 (6) | |
| Thoracic UICC Stage | ||||
| IA | 25 (16) | 25 (31) | 0 (0) | <.001 |
| IB | 28 (17) | 28 (35) | 0 (0) | |
| IIA | 26 (16) | 6 (7) | 20 (25) | |
| IIB | 16 (10) | 15 (19) | 1 (1) | |
| IIIA | 62 (39) | 6 (8) | 56 (70) | |
| IIIB | 3 (2) | 0 (0) | 3 (4) | |
| Molecular features | ||||
| Mutation status | ||||
| EGFR mutation | 15 (9) | 8 (9) | 7 (9) | NS |
| KRAS mutation | 51 (32) | 28 (35) | 23 (29) | |
| BRAF mutation | 2 (1) | 0 (0) | 2 (2) | |
| HER2 mutation | 1 (1) | 0 (0) | 1 (1) | |
| PIK3CA mutation | 4 (3) | 5 (5) | 1 (1) | |
| ALK rearrangement | 0 (0) | 0 (0) | 0 (0) | |
| Wild type | 87 (54) | 41 (51) | 46 (58) | |
Two adenosquamous carcinomas and five nonsmall cell carcinomas with neuroendocrine features.
N0 = Patients with lymph node tumor status N0; N+ = Patients with lymph node tumor status N1 or N2; TKI = EGFR Tyrosine kinase inhibitor; NS = Not significant; P‐value <.05 statistically significant.
3.2. Expression of EMT markers and effectors according to lymph node status
Most of the tumors presented epithelial marker expression; 132 (92%) tumors presented CDH1 (E‐Cadherin) expression, and 131 (92%) tumors presented CTNNB1 (β‐Catenin) expression (Table 2). CDH1 and CTNNB1 expression were not different in the N0 compared to the N+ group of tumors. Mesenchymal EMT marker analyses showed that 71 (50%) tumors presented CDH2 (N‐Cadherin) overexpression and 18 (13%) tumors presented VIMENTIN overexpression. CDH2 overexpression was significantly more frequent in the N+ group compared to the N0 group (n = 43, 60% vs n = 28, 39%, P = .01), and similar results were found for VIMENTIN overexpression (n = 13, 18% in the N+ group vs n = 5, 7% in the N0 group, P = .04). Partial EMT was observed in half of the tumors (n = 70, 49%) and only one tumor presented a total EMT phenotype (in the N+ group—data not shown). Finally, tumors with partial EMT were more frequently described in the N+ group than in the N0 group (n = 43, 60% vs n = 27, 38%, P < .01). Among the EMT effectors analyzed, TWIST1 was the most frequently overexpressed EMT‐TF (n = 105, 73%), while ZEB1 was the least overexpressed EMT‐TF (n = 9, 6%). TWIST1 was more frequently overexpressed in the N+ group compared to the N0 group (n = 58, 81% vs n = 47, 66%, respectively, P = .04). SNAI2 was also more frequently overexpressed in the N+ group compared to the N0 group (n = 47, 65% vs n = 29, 41%, respectively, P < .01).
Table 2.
Expression of EMT markers, effectors, and inducers according to lymph node status
| All patients | N0 | N+ | P value | |
|---|---|---|---|---|
| Total N (%) | 143 (100) | 71 (50) | 72 (50) | |
| EMT markersa | ||||
| CDH1 (E‐Cadherin) | 132 (92) | 67 (94) | 65 (90) | NS |
| CTNNB1 (β‐Catenin) | 131 (92) | 68 (96) | 63 (88) | NS |
| CDH2 (N‐Cadherin) | 71 (50) | 28 (39) | 43 (60) | .01 |
| VIMENTIN | 18 (13) | 5 (7) | 13 (18) | .04 |
| Partial EMT | 70 (49) | 27 (38) | 43 (60) | <.01 |
| EMT effectorsa | ||||
| SNAI1 | 34 (24) | 13 (18) | 21 (29) | NS |
| SNAI2 | 76 (53) | 29 (41) | 47 (65) | <.01 |
| ZEB1 | 9 (6) | 2 (3) | 7 (10) | NS |
| TWIST1 | 105 (73) | 47 (66) | 58 (81) | .04 |
| TWIST2 | 32 (22) | 12 (17) | 20 (28) | NS |
| EMT inducersa | ||||
| TGFβ markers | ||||
| TGFB1 | 47 (33) | 17 (24) | 30 (42) | .02 |
| TGFBR1 | 46 (32) | 22 (31) | 24 (33) | NS |
| TGFBR2 | 8 (6) | 4 (6) | 4 (6) | NS |
| c‐MET markers | ||||
| c‐MET IHCb | 75 (52) | 38 (47) | 37 (46) | NS |
| c‐MET | 75 (52) | 36 (51) | 39 (54) | NS |
| Hypoxia markers | ||||
| CAIX IHCb | 15 (9) | 7 (9) | 8 (10) | NS |
| HIF1α | 88 (62) | 44 (62) | 44 (61) | NS |
| HIF2α | 1 (1) | 1 (1) | 0 (0) | NS |
Preserved expression for CDH1 and CTNNB1 genes, overexpression for the other genes.
IHC: Immunohistochemistry scoring system for c‐MET and CAIX proteins: overexpression if ≥50% (intensity scores 2 + 3) of labeled tumors cells.
IHC performed on n = 160 tumors. EMT = Epithelial‐mesenchymal transition; N0 = Patients with lymph node tumor status N0; N+ = Patients with lymph node tumor status N1 or N2; Partial EMT = overexpression of CDH2 with normal expression of CDH1; CAIX = Carbonic anhydrase IX; NS = Not significant; P‐value <.05 statistically significant.
3.3. Expression of EMT inducers according to lymph node status
The TGFB1 (TGFβ), TGFBR1, and TGFBR2 genes were overexpressed in 47 (33%), 46 (32%), and 8 (6%) tumors, respectively (Table 2). TGFB1 was more frequently overexpressed in the N+ group of tumors compared to the N0 group (n = 30, 42% vs n = 17, 24%, respectively, P = .02). C‐MET was shown to be overexpressed in 75 (52%) tumors by immunohistochemistry as well as RT‐qPCR analysis (Figure S2). CAIX protein was shown to be overexpressed in 15 (9%) tumors by immunohistochemistry. HIF1α and HIF2α overexpression were reported in 88 (62%) cases and 1 (1%) tumor, respectively. Neither c‐MET and CAIX protein nor HIF1α or HIF2α overexpression were associated with lymph node status.
3.4. Correlations between SNAI2 and TWIST1 expression and EMT markers according to lymph node status
As SNAI2 was more frequently overexpressed in N+ compared to N0 tumors, we analyzed the EMT phenotype depending on SNAI2 expression (Table 3). Epithelial markers were conserved in N+ tumors overexpressing SNAI2, suggesting a partial EMT phenotype. Indeed, mesenchymal markers were more often overexpressed when SNAI2 expression was increased. SNAI2 overexpression was significantly correlated with CDH2 or VIMENTIN overexpression in the whole group, (P ≤ .001). Both correlations were observed in the N+ group (P = .003 and P = .002, respectively). In the N0 group, only CDH2 overexpression was correlated with SNAI2 overexpression (P = .001). SNAI2 overexpression was significantly correlated with partial EMT features in the whole group (P < .001) as well as in the N0 or N+ groups (P = .003). In summary, SNAI2 overexpression was correlated with partial EMT, which was more often observed in the N+ group and was particularly correlated with CDH2 and VIMENTIN overexpression in the N+ group. As TWIST1 was more frequently overexpressed in N+ tumors compared to N0 tumors, we also analyzed the EMT phenotype depending on TWIST1 expression (Table 3). No correlation was observed between TWIST1 overexpression and EMT epithelial marker expression, but mesenchymal markers were more often overexpressed when TWIST1 expression was increased. Indeed, TWIST1 overexpression was correlated with VIMENTIN overexpression in the N+ group of tumors (P = .05) and with CDH2 overexpression in the N0 group of tumors (P < .001). Finally, TWIST1 overexpression was associated with an increased number of tumors with a partial EMT phenotype, which were more frequent in the N+ group of tumors (n = 37, 64%) compared to the N0 group of tumors (n = 26, 55%).
Table 3.
Correlations between SNAI2 and TWIST1 expression and EMT markers according to lymph node status
| All patients | N0 | N+ | |||||||
|---|---|---|---|---|---|---|---|---|---|
| Total N (%) | 143 (100) | 71 (50) | 72 (50) | ||||||
| SNAI2 expression | Normal (n = 67) | Overexpressed (n = 76) | P value | Normal (n = 42) | Overexpressed (n = 29) | P value | Normal (n = 25) | Overexpressed (n = 47) | P value |
| CDH1 (E‐Cadherin) | |||||||||
| Preserved | 60 (90) | 72 (95) | NS | 40 (95) | 27 (93) | NS | 20 (80) | 45 (96) | .05 |
| Decreased | 7 (10) | 4 (5) | 2 (5) | 2 (7) | 5 (20) | 2 (4) | |||
| CTNNB1 (β‐Catenin) | |||||||||
| Preserved | 60 (90) | 71 (93) | NS | 41 (98) | 27 (93) | NS | 19 (76) | 44 (94) | .04 |
| Decreased | 7 (10) | 5 (7) | 1 (2) | 2 (7) | 6 (24) | 3 (6) | |||
| CDH2 (N‐Cadherin) | |||||||||
| Normal | 48 (72) | 24 (32) | <.001 | 32 (76) | 11 (38) | .001 | 16 (64) | 13 (28) | .003 |
| Overexpressed | 19 (28) | 52 (68) | 10 (24) | 18 (62) | 9 (36) | 34 (72) | |||
| VIMENTIN | |||||||||
| Normal | 66 (99) | 59 (78) | <.001 | 41 (98) | 25 (86) | NS | 25 (100) | 34 (72) | .002 |
| Overexpressed | 1 (1) | 17 (22) | 1 (2) | 4 (14) | 0 (0) | 13 (28) | |||
| Partial EMT | |||||||||
| No partial EMT | 48 (72) | 25 (33) | <.001 | 32 (76) | 12 (41) | .003 | 16 (64) | 13 (28) | .003 |
| Partial EMT | 19 (28) | 51 (67) | 10 (24) | 17 (59) | 9 (36) | 34 (72) | |||
| TWIST1 expression | Normal (n = 38) | Overexpressed (n = 105) | P value | Normal (n = 24) | Overexpressed (n = 47) | P value | Normal (n = 14) | Overexpressed (n = 58) | P value |
|---|---|---|---|---|---|---|---|---|---|
| CDH1 (E‐Cadherin) | |||||||||
| Preserved | 34 (90) | 98 (93) | NS | 22 (92) | 45 (96) | NS | 12 (86) | 53 (91) | NS |
| Decreased | 4 (10) | 7 (7) | 2 (8) | 2 (4) | 2 (14) | 5 (9) | |||
| CTNNB1 (β‐Catenin) | |||||||||
| Preserved | 34 (90) | 97 (92) | NS | 23 (96) | 45 (96) | NS | 11 (79) | 52 (90) | NS |
| Decreased | 4 (10) | 8 (8) | 1 (4) | 2 (4) | 3 (21) | 6 (10) | |||
| CDH2 (N‐Cadherin) | |||||||||
| Normal | 31 (82) | 41 (39) | <.001 | 23 (96) | 20 (43) | <.001 | 8 (57) | 21 (36) | NS |
| Overexpressed | 7 (18) | 64 (61) | 1 (4) | 27 (57) | 6 (43) | 37 (64) | |||
| VIMENTIN | |||||||||
| Normal | 36 (95) | 89 (85) | NS | 22 (92) | 44 (94) | NS | 14 (100) | 45 (78) | .05 |
| Overexpressed | 2 (5) | 16 (15) | 2 (8) | 3 (6) | 0 (0) | 13 (22) | |||
| Partial EMT | |||||||||
| No partial EMT | 31 (82) | 42 (40) | <.001 | 23 (96) | 21 (45) | <.001 | 8 (57) | 21 (36) | NS |
| Partial EMT | 7 (18) | 63 (60) | 1 (4) | 26 (55) | 6 (43) | 37 (64) | |||
EMT = Epithelial‐mesenchymal transition; N0 = Patients with lymph node tumor status N0; N+ = Patients with lymph node tumor status N1 or N2; Partial EMT = overexpression of CDH2 with normal expression of CDH1; NS = Not significant; P‐value <.05 statistically significant.
3.5. Correlations between TGFB1, c‐MET, and CAIX expression and EMT markers/effectors according to lymph node status
As TGFB1 was more frequently overexpressed in N+ tumors compared to N0 tumors, we analyzed the population depending on the expression of TGFB1, one of the best inducers of EMT (Table 4). TGFB1 overexpression was correlated with the overexpression of the mesenchymal markers CDH2 and VIMENTIN (P < .001) and, consequently, with partial EMT (P < .001). In the N+ group of tumors, TGFB1 overexpression was correlated with the expression of epithelial markers (CDH1, P = .02 and CTNNB1, P = .05), overexpression of mesenchymal markers (CDH2, P = .001 and VIMENTIN, P < .001) and, consequently, with partial EMT (P < .001). When TGFB1 was overexpressed, partial EMT was more often reported in the N+ group (n = 25, 83%) than in the N0 group (n = 11, 65%). In the entire cohort, EMT‐TF overexpression (SNAI1, SNAI2, ZEB1, TWIST1, and TWIST2) was correlated with TGFB1 overexpression. By subgroup analysis, EMT‐TF was differentially correlated with TGFB1 overexpression, depending on the N status. Indeed, ZEB1 overexpression alone was correlated with TGFB1 overexpression only in the N+ group (P = .02). In summary, TGFB1 overexpression was more frequently observed in the N+ group as well as correlated with partial EMT in the N0 group and especially in the N+ group. The correlation of TGFB1 overexpression with EMT‐TF appeared to be different between the N0 and N+ groups, with ZEB1 involvement in the latter.
Table 4.
Correlations between TGFB1expression and EMT markers/effectors according to lymph node status
| All patients | N0 | N+ | |||||||
|---|---|---|---|---|---|---|---|---|---|
| Total N (%) | 143 (100) | 71 (50) | 72 (50) | ||||||
| TGFB1 expression | Normal (n = 96) | Overexpressed (n = 47) | P value | Normal (n = 54) | Overexpressed (n = 17) | P value | Normal (n = 42) | Overexpressed (n = 30) | P value |
| CDH1 (E‐Cadherin) | |||||||||
| Preserved | 85 (89) | 47 (100) | .01 | 50 (93) | 17 (100) | NS | 35 (83) | 30 (100) | .02 |
| Decreased | 11 (11) | 0 (0) | 4 (7) | 0 (0) | 7 (17) | 0 (0) | |||
| CTNNB1 (β‐Catenin) | |||||||||
| Preserved | 85 (89) | 46 (98) | .05 | 51 (94) | 17 (100) | NS | 34 (81) | 29 (97) | .05 |
| Decreased | 11 (11) | 1 (2) | 3 (6) | 0 (0) | 8 (19) | 1 (3) | |||
| CDH2 (N‐Cadherin) | |||||||||
| Normal | 61 (64) | 11 (23) | <.001 | 37 (69) | 6 (35) | .02 | 24 (57) | 5 (17) | .001 |
| Overexpressed | 35 (36) | 36 (77) | 17 (31) | 11 (65) | 18 (43) | 25 (83) | |||
| VIMENTIN | |||||||||
| Normal | 94 (98) | 31 (66) | <.001 | 53 (98) | 13 (76) | .01 | 41 (98) | 18 (60) | < .001 |
| Overexpressed | 2 (2) | 16 (34) | 1 (2) | 4 (24) | 1 (2) | 12 (40) | |||
| Partial EMT | |||||||||
| No partial EMT | 62 (65) | 11 (23) | <.001 | 38 (70) | 6 (35) | .01 | 24 (57) | 5 (17) | < .001 |
| Partial EMT | 34 (35) | 36 (77) | 16 (30) | 11 (65) | 18 (43) | 25 (83) | |||
| SNAI1 | |||||||||
| Normal | 84 (88) | 25 (53) | <.001 | 48 (89) | 10 (59) | .01 | 36 (86) | 15 (50) | .001 |
| Overexpressed | 12 (12) | 22 (47) | 6 (11) | 7 (41) | 6 (14) | 15 (50) | |||
| SNAI2 | |||||||||
| Preserved | 60 (63) | 7 (15) | <.001 | 37 (69) | 5 (29) | .005 | 23 (55) | 2 (7) | <.001 |
| Decreased | 36 (37) | 40 (85) | 17 (31) | 12 (71) | 19 (45) | 28 (93) | |||
| ZEB1 | |||||||||
| Normal | 94 (98) | 40 (85) | .006 | 53 (98) | 16 (94) | NS | 41 (98) | 24 (80) | .02 |
| Overexpressed | 2 (2) | 7 (15) | 1 (2) | 1 (6) | 1 (2) | 6 (20) | |||
| TWIST1 | |||||||||
| Normal | 32 (33) | 6 (13) | .006 | 21 (39) | 3 (18) | NS | 11 (26) | 3 (10) | NS |
| Overexpressed | 64 (67) | 41 (87) | 33 (61) | 14 (82) | 31 (74) | 27 (90) | |||
| TWIST2 | |||||||||
| Normal | 82 (85) | 29 (62) | .002 | 48 (89) | 11 (65) | .03 | 34 (81) | 18 (60) | .05 |
| Overexpressed | 14 (18) | 18 (38) | 6 (11) | 6 (35) | 8 (19) | 12 (40) | |||
EMT = Epithelial‐mesenchymal transition; N0 = Patients with lymph node tumor status N0; N+ = Patients with lymph node tumor status N1 or N2; Partial EMT = overexpression of CDH2 with normal expression of CDH1; NS = Not significant; P‐value <.05 statistically significant.
We also analyzed two other potential inducers of EMT, c‐MET, and hypoxia (explored by CAIX protein expression) (Tables S1 and S2, Figure S2). C‐MET overexpression was correlated with EMT epithelial marker expression and overexpression of VIMENTIN, especially in the N+ group of tumors (P = .002). When c‐MET was overexpressed, partial EMT was more frequent in the N+ group (n = 25, 64%) compared to the N0 group of tumors (n = 16, 44%). No EMT‐TF was correlated with c‐MET overexpression in the N0 group of tumors, while SNAI1 and ZEB1 overexpression was correlated with c‐MET overexpression in the N+ group (P = .02 and P = .01, respectively). CAIX protein overexpression was correlated with overexpression of the mesenchymal marker CDH2 only in the N+ group (P = .01). Moreover, all cases of N+ tumors overexpressing CAIX presented a partial EMT phenotype. No EMT‐TF was correlated with CAIX overexpression in the N0 group of tumors, while SNAI2 and ZEB1 overexpression was correlated with CAIX overexpression in the N+ group (P = .03). In summary, c‐MET and CAIX overexpression was associated with mesenchymal markers more often in the N+ group. Finally, some EMT‐TFs were correlated with overexpression of the EMT inducers c‐MET or CAIX only in the N+ group of tumors.
3.6. Survival analysis
The median time of clinical follow‐up of patients was 37 months (range 1‐63 months). In univariate analysis, neither EMT markers nor EMT effectors were observed as prognostic factors in the present study (Table 5) (Table S3). The EMT inducer CAIX protein was a bad prognostic factor for RFS and OS (P = .003 and P = .05, respectively). Indeed, there was a significant decrease in RFS for patients with tumors overexpressing CAIX (median RFS time is 9 months vs 42 months, P = .002), and the same results were observed for OS (median OS time is 27 months vs not reached, P = .048) (Figure 1). In multivariate analyses, CAIX was an independent prognostic factor (HR 2.99, 95% CI: 1.58‐5.65, P = .001 for RFS and HR 2.38, 95% CI: 1.10‐5.14, P = .03 for OS).
Table 5.
Multivariate Cox model analysis for relapse‐free survival and overall survival
| All patients (N = 160) | Relapse‐free survival | Overall survival | ||||
|---|---|---|---|---|---|---|
| HR | 95% CI | P value | HR | 95% CI | P value | |
| Gender: female vs male | 1.10 | 0.66‐1.82 | .72 | 1.03 | 0.56‐1.89 | .92 |
| Age at diagnosis: >60 vs ≤60 y | 1.11 | 0.69‐1.81 | .65 | 1.03 | 0.58‐1.81 | .91 |
| UICC stage: I‐II vs III | 2.20 | 1.37‐3.53 | .001 | 1.62 | 0.92‐2.86 | .10 |
| Neoadjuvant chemotherapy: yes vs no | 1.88 | 1.02‐3.45 | .04 | 2.09 | 1.06‐4.12 | .03 |
| IHCa CAIX positive vs negative | 2.99 | 1.58‐5.65 | .001 | 2.38 | 1.10‐5.14 | .03 |
IHC: Immunohistochemistry scoring system for CAIX protein, positive if ≥50% (intensity scores 2 + 3) of labeled tumors cells, negative if <50% (intensity scores 2 + 3) of labeled tumor cells.
HR, Hazard Ratio; CI, Confidence Interval; P‐value <.05 statistically significant.
Figure 1.
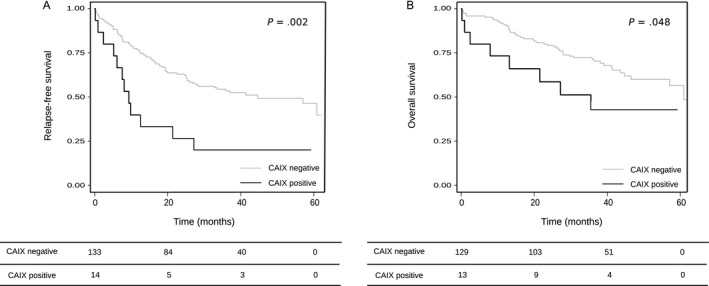
Relapse‐free survival (A) and Overall survival (B) and CAIX expression. Median time of clinical follow‐up: 37 mo (range 1‐63 mo). Median RFS time: 9 mo (CAIX positive) vs 42 mo (CAIX negative), P = .002. Median OS time: 27 mo (CAIX positive) vs not reached (CAIX negative), P = .048. CAIX: Carbonic anhydrase IX. Immunohistochemistry scoring system for CAIX protein: negative if <50% (intensity scores 2 + 3) of labeled tumor cells, positive if ≥50% (intensity scores 2 + 3) of labeled tumors cells
4. DISCUSSION
Epithelial to mesenchymal transition may be involved in cancer progression and in lymph node progression of NSCLC. Previous studies have been conducted to assess individual EMT markers in NSCLC, but to our knowledge, no studies have examined several EMT markers simultaneously. In the present study, we investigated the expression of EMT markers, effectors, and inducers in early stage NSCLC and separated tumors into N0 and N+ groups to describe their combined role in the development of lymph node metastasis. E‐Cadherin and β‐Catenin are classical markers for the epithelial phenotype. The present results showed that the majority of tumors had conserved expression of the epithelial markers CDH1 (92%) and CTNNB1 (92%). Previous studies on E‐Cadherin expression in NSCLC tested by immunohistochemistry report conserved protein expression ranging from 32% to 88% in tumors depending on the IHC cutoff value.22, 23, 24, 25, 26, 27, 28, 29 Moreover, an association of E‐Cadherin loss of IHC expression and the N+ status of patients was reported in several stages I to IV NSCLC cohorts.23, 24, 28, 29, 30, 31, 32, 33 Two other studies that analyzed CDH1 expression in stage I to III NSCLC tumors reported an opposite association between CDH1 expression and N status, with one study reporting preserved CDH1 expression and the other study reporting lost CDH1 expression.34, 35 In summary, loss of epithelial markers, such as CDH1 and CTNNB1, was a rare event in the present early stage NSCLC cohort.
Vimentin is a key marker of the mesenchymal phenotype.9 N‐Cadherin is less used, but it is interesting to analyze its expression combined with E‐Cadherin to follow the “Cadherin switch” of EMT.9 The present results show overexpression of CDH2 and VIMENTIN in 50% and 13% of tumors, respectively, with a correlation with N+ status. Expression of N‐Cadherin in NSCLC has been studied by IHC in several NSCLC cohorts, with 9% to 43% of tumors showing overexpression.22, 36, 37, 38 IHC expression of VIMENTIN was also previously investigated in NSCLC, with 7%‐66% of overexpression depending on the IHC cutoff value.16, 24, 27, 29, 30, 38, 39, 40, 41, 42, 43, 44, 45 One study quantified CDH2 expression by RT‐qPCR in 30 NSCLC (stages I to IV) and found that 67% of tumors had N‐Cadherin overexpression, with a bad prognosis value.37 Four studies have found an association between VIMENTIN IHC overexpression and N+ status of NSCLC.24, 29, 30, 45 VIMENTIN overexpression was reported to be a bad prognostic marker in some NSCLC cohorts.24, 27, 29, 39, 43, 44, 45 In summary, the present results suggest a role for CHD2 and VIMENTIN in the development of lymph node metastasis, even if they are not prognostic factors in early stages of NSCLC.
Total EMT (loss of CDH1 expression associated with overexpression of CDH2) was observed in only one tumor in the present study. Partial EMT (expression of CDH1 associated with overexpression of CDH2) was observed in 49% of tumors. This partial EMT was significantly more frequent in the N+ group of patients, suggesting a role for EMT in lymph node progression in early stage lung cancers. In fact, some authors have recently proposed that tumors with a partial EMT phenotype (defined as expressing of epithelial and mesenchymal markers) could have more metastatic features than tumors with a total EMT phenotype.46, 47 This finding could be explained through the migration of tumoral cell clusters instead of isolated tumor cells.
Among EMT inducers, TGFβ is a major EMT inducer in cancer and induces the EMT‐TFs SNAI1, SNAI2, ZEB1, and ZEB2.18 We showed that TGFB1 is overexpressed in 33% of tumors, with a greater frequency observed in the N+ group of tumors. In previous studies, TGFβ protein or gene expression analyses have revealed a large range of overexpression, from 18% to 87%, in NSCLC depending on the technique (protein or gene analysis) or cutoff.39, 48, 49, 50 The present study is, to our knowledge, the first to identify a correlation between TGFB1 overexpression and N+ status in NSCLC patients. We also showed that TGFB1 overexpression is correlated with overexpression of the mesenchymal markers CDH2 and VIMENTIN and partial EMT, especially in the N+ group of patients. One study found that the TGFβ‐activated SMAD3/4 complex upregulates N‐Cadherin expression in NSCLC cells and that SMAD3/4 expression was correlated with N‐Cadherin expression in a NSCLC cohort.51 Another in vitro assay showed that TGFβ could enhance VIMENTIN and SNAI2 expression in NSCLC cells.52 In the present study, we found correlations between the overexpression of TGB1 and EMT‐TFs SNAI1, SNAI2, ZEB1, TWIST1, and TWIST2, but with differences among N status. Indeed, ZEB1 overexpression alone was correlated with overexpressed TGFB1, but only in the N+ group. In summary, TGFβ may be a strong EMT inducer in the present cohort, especially in the N+ group, suggesting its role in lymph node progression in early stages of NSCLC patients.
Another EMT inducer, c‐MET, was overexpressed in half of the tumors (52%) examined in the present study, which corresponds to the frequency of other studies in NSCLC, but without differences between the N+ and N0 groups.21, 53, 54 In the present study, overexpression of c‐MET was mostly correlated with VIMENTIN overexpression. No correlation was observed with CDH2 overexpression, independent of the group of patients. We also described a correlation between c‐MET and EMT‐TFs SNAI1 and ZEB1 overexpression, but only in the N+ group. Some authors suggest that SNAI1 could be induced by c‐MET, and a recent study on hepatocellular carcinoma cells and tumors showed a correlation of c‐MET overexpression with VIMENTIN, SNAI1 and ZEB1 overexpression that could be explained by overexpression of the transcriptional factor FoxM1.55, 56, 57 In summary, c‐MET may be a less important EMT inducer than TGFB1 in NSCLC patients, without differences among the N status, but involving different EMT‐TFs, such as ZEB1 and SNAI1, only in the N+ group of tumors.
Hypoxia is also an EMT inducer associated with the TGFβ and c‐MET pathways.55, 58 Overexpression of HIF1α and HIF2α was observed in 63% and 1% of tumors in the present cohort, respectively, which is in the range of different studies for HIF1α but under the range for HIF2α.59, 60, 61 As CAIX is a target protein of HIF1α, but more stable than HIF1α, we examined CAIX protein expression with EMT features. CAIX was overexpressed in only 9% of the tumors examined in the present study, which is lower than that reported in other studies on NSCLC cohorts, in which 24% to 38% of tumors showed overexpressed CAIX protein.60, 62, 63 In the present study, when CAIX overexpression was not different between N groups, its correlation with the mesenchymal marker CDH2 and partial EMT was only observed in the N+ group. CAIX overexpression was also correlated with EMT‐TFs SNAI2 and ZEB1 overexpression only in the N+ group. No previous studies have reported a correlation between CAIX and EMT markers/effectors in NSCLC. However, in tongue squamous cell carcinoma (in vitro and in tumor tissue samples), an investigation showed that CAIX and ZEB1 protein expression are correlated and that CAIX ould be regulated by ZEB1.64 A correlation between CAIX and SNAI2 was also reported by IHC analysis in basal‐like breast carcinomas.65 In summary, CAIX may, such as c‐MET, be a less important EMT inducer than TGFB1 in NSCLC patients, without differences depending on the N status, but involving different EMT‐TFs, only in the N+ group of tumors.
Two EMT effectors, SNAI2 and TWIST1, were more often overexpressed in the N+ group of tumors. In the present study, SNAI2 was overexpressed in 53% of cases, and in the N+ group, SNAI2 was more frequently overexpressed and primarily correlated with the mesenchymal markers and EMT inducers TGFB1 and CAIX. The present study is, to our knowledge, the first to report these associations in a NSCLC cohort. Nevertheless, the association between SNAI2 overexpression and the presence of lymph node metastasis has already been described by protein and gene analysis in tongue squamous cell carcinoma and breast and colorectal cancers, as well as the correlation of SNAI2 overexpression with N‐Cadherin and Vimentin overexpression.66, 67, 68 TWIST1 was overexpressed in 73% of the present cases and more frequently overexpressed in the N+ group. TWIST1 was investigated in several NSCLC cohorts by IHC, with overexpression ranging from 11% to 68% 37, 38, 43, 69, 70, 71 or gene expression at 57%.37 Similar to the present study, a correlation between TWIST and CDH2 protein expression was found in a NSCLC cohort, but without data regarding the N status.38 As in the present study, a previous study found an association of TWIST1 protein overexpression with lymph node metastasis in lung cancer, supporting the role of TWIST1 in local progression.72 In the present work, TWIST1 overexpression was associated with VIMENTIN overexpression, especially in N+ tumors. The present study showed that even if TWIST1 was related to partial EMT phenotype, its overexpression was not correlated with the overexpression of EMT inducers, such as TGFB1, c‐MET, and CAIX, in the N+ group of tumors. These results suggest that TWIST1 could be involved in the EMT process by other inducers, such as EGFR.73 Finally, even if ZEB1 is not differentially overexpressed between the N+ and N0 groups, it appears to be correlated with the three EMT inducers TGFB1, c‐MET, and CAIX only in the N+ group of tumors. In summary, the present results suggest that EMT‐TFs are differentially related to EMT inducers in the N+ group of tumors and could promote the development of lymph node metastasis in early stage NSCLC.
Finally, the present results showed no prognostic value of EMT markers or effectors in the early stages of NSCLC. Nevertheless, the EMT inducer CAIX was shown to be an independent bad prognosis factor for RFS as well as for OS. The prognostic value of CAIX has also been reported in studies of NSCLC.60, 62, 74, 75 HIF1α and HIF2α protein overexpression was shown to have a bad prognostic value in NSCLC, and one meta‐analysis based on 30 studies also showed an association between HIF1α overexpression and lymph node‐positive tumors in NSCLC.59, 61, 62, 74, 76 Finally, CAIX overexpression had a negative impact on prognosis in the present cohort of early stage NSCLC patients. This effect could be explained by the potential role of CAIX in the development of a partial EMT phenotype in the N+ group through the EMT effectors SNAI1 and ZEB1.
In conclusion, although the present study is retrospective with a small number of NSCLC patients for whom frozen tumors were available, we showed for the first time that the EMT‐TFs SNAI2 and TWIST1 (and to a lesser extent ZEB1) could be involved through different pathways in lymph node progression. Only EMT inducer CAIX overexpression was a bad prognosis factor. In the future, these findings could be validated by further “in vitro” models as well as prospective clinical studies.
CONFLICT OF INTEREST
The authors declare no conflicts of interest.
Supporting information
ACKNOWLEDGMENTS
We acknowledge the CRB (Centre de Ressources Biologiques), Biological Resources Centre, Strasbourg, France. We are grateful to Julie Buffa for technical assistance.
Emprou C, Le Van Quyen P, Jégu J, et al. SNAI2 and TWIST1 in lymph node progression in early stages of NSCLC patients. Cancer Med. 2018;7:3278–3291. 10.1002/cam4.1545
REFERENCES
- 1. Siegel RL, Miller KD, Jemal A. Cancer statistics, 2016. CA Cancer J Clin. 2016;66:7‐30. [DOI] [PubMed] [Google Scholar]
- 2. Eberhardt WEE, De Ruysscher D, Weder W, et al. 2nd ESMO Consensus Conference in Lung Cancer: locally advanced stage III non‐small‐cell lung cancer. Ann Oncol Off J Eur Soc Med Oncol ESMO. 2015;26:1573‐1588. [DOI] [PubMed] [Google Scholar]
- 3. Vansteenkiste J, Crinò L, Dooms C, et al. 2nd ESMO Consensus Conference on Lung Cancer: early‐stage non‐small‐cell lung cancer consensus on diagnosis, treatment and follow‐up. Ann Oncol Off J Eur Soc Med Oncol ESMO. 2014;25:1462‐1474. [DOI] [PubMed] [Google Scholar]
- 4. Williams BA, Sugimura H, Endo C, et al. Predicting postrecurrence survival among completely resected nonsmall‐cell lung cancer patients. Ann Thorac Surg. 2006;81:1021‐1027. [DOI] [PubMed] [Google Scholar]
- 5. Sobin LH, Compton CC. TNM seventh edition: what's new, what's changed: communication from the International Union Against Cancer and the American Joint Committee on Cancer. Cancer. 2010;116:5336‐5339. [DOI] [PubMed] [Google Scholar]
- 6. Kalluri R, Weinberg RA. The basics of epithelial‐mesenchymal transition. J Clin Invest. 2009;119:1420‐1428. [DOI] [PMC free article] [PubMed] [Google Scholar]
- 7. Thiery JP. Epithelial‐mesenchymal transitions in tumour progression. Nat Rev Cancer. 2002;2:442‐454. [DOI] [PubMed] [Google Scholar]
- 8. Thiery JP. Epithelial‐mesenchymal transitions in development and pathologies. Curr Opin Cell Biol. 2003;15:740‐746. [DOI] [PubMed] [Google Scholar]
- 9. Zeisberg M, Neilson EG. Biomarkers for epithelial‐mesenchymal transitions. J Clin Invest. 2009;119:1429‐1437. [DOI] [PMC free article] [PubMed] [Google Scholar]
- 10. Heuberger J, Birchmeier W. Interplay of cadherin‐mediated cell adhesion and canonical Wnt signaling. Cold Spring Harb Perspect Biol. 2010;2:a002915. [DOI] [PMC free article] [PubMed] [Google Scholar]
- 11. Orsulic S, Huber O, Aberle H, Arnold S, Kemler R. E‐cadherin binding prevents beta‐catenin nuclear localization and beta‐catenin/LEF‐1‐mediated transactivation. J Cell Sci. 1999;112(Pt 8):1237‐1245. [DOI] [PubMed] [Google Scholar]
- 12. Lamouille S, Xu J, Derynck R. Molecular mechanisms of epithelial‐mesenchymal transition. Nat Rev Mol Cell Biol. 2014;15:178‐196. [DOI] [PMC free article] [PubMed] [Google Scholar]
- 13. Nieto MA. The snail superfamily of zinc‐finger transcription factors. Nat Rev Mol Cell Biol. 2002;3:155‐166. [DOI] [PubMed] [Google Scholar]
- 14. Peinado H, Olmeda D, Cano A. Snail, Zeb and bHLH factors in tumour progression: an alliance against the epithelial phenotype? Nat Rev Cancer. 2007;7:415‐428. [DOI] [PubMed] [Google Scholar]
- 15. Yang J, Mani SA, Donaher JL, et al. Twist, a master regulator of morphogenesis, plays an essential role in tumor metastasis. Cell. 2004;117:927‐939. [DOI] [PubMed] [Google Scholar]
- 16. Soltermann A, Tischler V, Arbogast S, et al. Prognostic significance of epithelial‐mesenchymal and mesenchymal‐epithelial transition protein expression in non‐small cell lung cancer. Clin Cancer Res Off J Am Assoc Cancer Res. 2008;14:7430‐7437. [DOI] [PubMed] [Google Scholar]
- 17. Tse JC, Kalluri R. Mechanisms of metastasis: epithelial‐to‐mesenchymal transition and contribution of tumor microenvironment. J Cell Biochem. 2007;101:816‐829. [DOI] [PubMed] [Google Scholar]
- 18. Yang J, Weinberg RA. Epithelial‐mesenchymal transition: at the crossroads of development and tumor metastasis. Dev Cell. 2008;14:818‐829. [DOI] [PubMed] [Google Scholar]
- 19. Travis WD, Brambilla E, Müller‐Hermelink HK, Harris CC. Pathology and Genetics of Tumours of the Lung, Pleura, Thymus and Heart, 2004. Third edition ‐ WHO ‐ OMS ‐ http://apps.who.int/bookorders/anglais/detart1.jsp?codlan=1&codcol=70&codcch=10&content=1. Accessed September 26, 2016.
- 20. Travis WD, Brambilla E, Burke AP, Marx A, Nicholson AG. WHO Classification of Tumours of the Lung, Pleura, Thymus and Heart, 2015. Fourth edition ‐ WHO ‐ OMS ‐ http://apps.who.int/bookorders/WHP/detart1.jsp?sesslan=1&codlan=1&codcol=70&codcch=4007. Accessed September 21, 2016. [DOI] [PubMed]
- 21. Weingertner N, Meyer N, Voegeli A‐C, et al. Correlation between MET protein expression and MET gene copy number in a Caucasian cohort of non‐small cell lung cancers according to the new IASLC/ATS/ERS classification. Pathology (Phila). 2015;47:320‐328. [DOI] [PubMed] [Google Scholar]
- 22. Fan C, Miao Y, Zhang X, et al. Btbd7 contributes to reduced E‐cadherin expression and predicts poor prognosis in non‐small cell lung cancer. BMC Cancer. 2014;14:704. [DOI] [PMC free article] [PubMed] [Google Scholar]
- 23. Jiang W, Fan H, Qian C, Ding J, Wang Q, Pang X. Prognostic value of high FoxC2 expression in resectable non‐small cell lung cancer, alone or in combination with E‐cadherin expression. BMC Cancer. 2016;16:16. [DOI] [PMC free article] [PubMed] [Google Scholar]
- 24. Kong F‐F, Qu Z‐Q, Yuan H‐H, et al. Overexpression of FOXM1 is associated with EMT and is a predictor of poor prognosis in non‐small cell lung cancer. Oncol Rep. 2014;31:2660‐2668. [DOI] [PubMed] [Google Scholar]
- 25. Matsubara D, Kishaba Y, Yoshimoto T, et al. Immunohistochemical analysis of the expression of E‐cadherin and ZEB1 in non‐small cell lung cancer. Pathol Int. 2014;64:560‐568. [DOI] [PubMed] [Google Scholar]
- 26. Matsuwaki R, Ishii G, Zenke Y, et al. Immunophenotypic features of metastatic lymph node tumors to predict recurrence in N2 lung squamous cell carcinoma. Cancer Sci. 2014;105:905‐911. [DOI] [PMC free article] [PubMed] [Google Scholar]
- 27. Sung WJ, Park K‐S, Kwak SG, Hyun D‐S, Jang JS, Park K‐K. Epithelial‐mesenchymal transition in patients of pulmonary adenocarcinoma: correlation with cancer stem cell markers and prognosis. Int J Clin Exp Pathol. 2015;8:8997‐9009. [PMC free article] [PubMed] [Google Scholar]
- 28. Yang Y‐L, Chen M‐W, Xian L. Prognostic and clinicopathological significance of downregulated E‐cadherin expression in patients with non‐small cell lung cancer (NSCLC): a meta‐analysis. PLoS ONE. 2014;9:e99763. [DOI] [PMC free article] [PubMed] [Google Scholar]
- 29. Zhou L, Yu L, Wu S, Feng Z, Song W, Gong X. Clinicopathological significance of KAI1 expression and epithelial‐mesenchymal transition in non‐small cell lung cancer. World J Surg Oncol. 2015;13:234. [DOI] [PMC free article] [PubMed] [Google Scholar]
- 30. Chikaishi Y, Uramoto H, Tanaka F. The EMT status in the primary tumor does not predict postoperative recurrence or disease‐free survival in lung adenocarcinoma. Anticancer Res. 2011;31:4451‐4456. [PubMed] [Google Scholar]
- 31. Liu D, Huang C, Kameyama K, et al. E‐cadherin expression associated with differentiation and prognosis in patients with non‐small cell lung cancer. Ann Thorac Surg. 2001;71:949‐954; discussion 954‐955. [DOI] [PubMed] [Google Scholar]
- 32. Shibanuma H, Hirano T, Tsuji K, et al. Influence of E‐cadherin dysfunction upon local invasion and metastasis in non‐small cell lung cancer. Lung Cancer Amst Neth. 1998;22:85‐95. [DOI] [PubMed] [Google Scholar]
- 33. Sulzer MA, Leers MP, van Noord JA, Bollen EC, Theunissen PH. Reduced E‐cadherin expression is associated with increased lymph node metastasis and unfavorable prognosis in non‐small cell lung cancer. Am J Respir Crit Care Med. 1998;157:1319‐1323. [DOI] [PubMed] [Google Scholar]
- 34. Shiwu WU, Lan Y, Wenqing S, Lei Z, Yisheng T. Expression and clinical significance of CD82/KAI1 and E‐cadherin in non‐small cell lung cancer. Arch Iran Med. 2012;15:707‐712. [PubMed] [Google Scholar]
- 35. Wu C, Zhu W, Qian J, et al. WT1 promotes invasion of NSCLC via suppression of CDH1. J Thorac Oncol Off Publ Int Assoc Study Lung Cancer. 2013;8:1163‐1169. [DOI] [PubMed] [Google Scholar]
- 36. Grinberg‐Rashi H, Ofek E, Perelman M, et al. The expression of three genes in primary non‐small cell lung cancer is associated with metastatic spread to the brain. Clin Cancer Res Off J Am Assoc Cancer Res. 2009;15:1755‐1761. [DOI] [PubMed] [Google Scholar]
- 37. Hui L, Zhang S, Dong X, Tian D, Cui Z, Qiu X. Prognostic significance of twist and N‐cadherin expression in NSCLC. PLoS ONE. 2013;8:e62171. [DOI] [PMC free article] [PubMed] [Google Scholar]
- 38. Miura N, Yano T, Shoji F, et al. Clinicopathological significance of Sip1‐associated epithelial mesenchymal transition in non‐small cell lung cancer progression. Anticancer Res. 2009;29:4099‐4106. [PubMed] [Google Scholar]
- 39. Al‐Saad S, Al‐Shibli K, Donnem T, Persson M, Bremnes RM, Busund L‐T. The prognostic impact of NF‐kappaB p105, vimentin, E‐cadherin and Par6 expression in epithelial and stromal compartment in non‐small‐cell lung cancer. Br J Cancer. 2008;99:1476‐1483. [DOI] [PMC free article] [PubMed] [Google Scholar]
- 40. Dauphin M, Barbe C, Lemaire S, et al. Vimentin expression predicts the occurrence of metastases in non small cell lung carcinomas. Lung Cancer Amst Neth. 2013;81:117‐122. [DOI] [PubMed] [Google Scholar]
- 41. Kim H, Yoo SB, Sun P, et al. Alteration of the E‐Cadherin/β‐Catenin complex is an independent poor prognostic factor in lung adenocarcinoma. Korean J Pathol. 2013a;47:44‐51. [DOI] [PMC free article] [PubMed] [Google Scholar]
- 42. Liu Y, Gai L, Liu J, Cui Y, Zhang Y, Feng J. Expression of poly(C)‐binding protein 1 (PCBP1) in NSCLC as a negative regulator of EMT and its clinical value. Int J Clin Exp Pathol. 2015;8:7165‐7172. [PMC free article] [PubMed] [Google Scholar]
- 43. Shi Y, Wu H, Zhang M, Ding L, Meng F, Fan X. Expression of the epithelial‐mesenchymal transition‐related proteins and their clinical significance in lung adenocarcinoma. Diagn Pathol. 2013;8:89. [DOI] [PMC free article] [PubMed] [Google Scholar]
- 44. Tadokoro A, Kanaji N, Liu D, et al. Vimentin regulates invasiveness and is a poor prognostic marker in non‐small cell lung cancer. Anticancer Res. 2016;36:1545‐1551. [PubMed] [Google Scholar]
- 45. Zhang H, Liu J, Yue D, et al. Clinical significance of E‐cadherin, β‐catenin, vimentin and S100A4 expression in completely resected squamous cell lung carcinoma. J Clin Pathol. 2013;66:937‐945. [DOI] [PubMed] [Google Scholar]
- 46. Diepenbruck M, Christofori G. Epithelial‐mesenchymal transition (EMT) and metastasis: yes, no, maybe? Curr Opin Cell Biol. 2016;43:7‐13. [DOI] [PubMed] [Google Scholar]
- 47. Jolly MK, Boareto M, Huang B, et al. Implications of the Hybrid Epithelial/Mesenchymal Phenotype in Metastasis. Front Oncol. 2015;5:155. [DOI] [PMC free article] [PubMed] [Google Scholar]
- 48. Bennett WP, el‐Deiry WS, Rush WL, et al. p21waf1/cip1 and transforming growth factor beta 1 protein expression correlate with survival in non‐small cell lung cancer. Clin Cancer Res Off J Am Assoc Cancer Res. 1998;4:1499‐1506. [PubMed] [Google Scholar]
- 49. Boldrini L, Calcinai A, Samaritani E, et al. Tumour necrosis factor‐alpha and transforming growth factor‐beta are significantly associated with better prognosis in non‐small cell lung carcinoma: putative relation with BCL‐2‐mediated neovascularization. Br J Cancer. 2000;83:480‐486. [DOI] [PMC free article] [PubMed] [Google Scholar]
- 50. Kim J‐W, Koh Y, Kim D‐W, et al. Clinical Implications of VEGF, TGF‐β1, and IL‐1β in Patients with Advanced Non‐small Cell Lung Cancer. Cancer Res Treat Off J Korean Cancer Assoc. 2013b;45:325‐333. [DOI] [PMC free article] [PubMed] [Google Scholar]
- 51. Yang H, Wang L, Zhao J, et al. TGF‐β‐activated SMAD3/4 complex transcriptionally upregulates N‐cadherin expression in non‐small cell lung cancer. Lung Cancer Amst Neth. 2015;87:249‐257. [DOI] [PubMed] [Google Scholar]
- 52. Tirino V, Camerlingo R, Bifulco K, et al. TGF‐β1 exposure induces epithelial to mesenchymal transition both in CSCs and non‐CSCs of the A549 cell line, leading to an increase of migration ability in the CD133 + A549 cell fraction. Cell Death Dis. 2013;4:e620. [DOI] [PMC free article] [PubMed] [Google Scholar]
- 53. Casadevall D, Gimeno J, Clavé S, et al. MET expression and copy number heterogeneity in nonsquamous non‐small cell lung cancer (nsNSCLC). Oncotarget. 2015;6:16215‐16226. [DOI] [PMC free article] [PubMed] [Google Scholar]
- 54. Guo B, Cen H, Tan X, Liu W, Ke Q. Prognostic value of MET gene copy number and protein expression in patients with surgically resected non‐small cell lung cancer: a meta‐analysis of published literatures. PLoS ONE. 2014;9:e99399. [DOI] [PMC free article] [PubMed] [Google Scholar]
- 55. Boccaccio C, Comoglio PM. Invasive growth: a MET‐driven genetic programme for cancer and stem cells. Nat Rev Cancer. 2006;6:637‐645. [DOI] [PubMed] [Google Scholar]
- 56. Meng F‐D, Wei J‐C, Qu K, et al. FoxM1 overexpression promotes epithelial‐mesenchymal transition and metastasis of hepatocellular carcinoma. World J Gastroenterol. 2015;21:196‐213. [DOI] [PMC free article] [PubMed] [Google Scholar]
- 57. Zhang J‐P, Zeng C, Xu L, Gong J, Fang J‐H, Zhuang S‐M. MicroRNA‐148a suppresses the epithelial‐mesenchymal transition and metastasis of hepatoma cells by targeting Met/Snail signaling. Oncogene. 2014;33:4069‐4076. [DOI] [PubMed] [Google Scholar]
- 58. Rankin EB, Giaccia AJ. Hypoxic control of metastasis. Science. 2016;352:175‐180. [DOI] [PMC free article] [PubMed] [Google Scholar]
- 59. Andersen S, Eilertsen M, Donnem T, et al. Diverging prognostic impacts of hypoxic markers according to NSCLC histology. Lung Cancer Amst Neth. 2011;72:294‐302. [DOI] [PubMed] [Google Scholar]
- 60. Giatromanolaki A, Koukourakis MI, Sivridis E, et al. Expression of hypoxia‐inducible carbonic anhydrase‐9 relates to angiogenic pathways and independently to poor outcome in non‐small cell lung cancer. Cancer Res. 2001;61:7992‐7998. [PubMed] [Google Scholar]
- 61. Wang Q, Hu D, Rui Y, Jiang A, Liu Z, Huang L. Prognosis value of HIF‐1α expression in patients with non‐small cell lung cancer. Gene. 2014;541:69‐74. [DOI] [PubMed] [Google Scholar]
- 62. Giatromanolaki A, Koukourakis MI, Sivridis E, et al. DEC1 (STRA13) protein expression relates to hypoxia‐ inducible factor 1‐alpha and carbonic anhydrase‐9 overexpression in non‐small cell lung cancer. J Pathol. 2003;200:222‐228. [DOI] [PubMed] [Google Scholar]
- 63. Ilie M, Mazure NM, Hofman V, et al. High levels of carbonic anhydrase IX in tumour tissue and plasma are biomarkers of poor prognostic in patients with non‐small cell lung cancer. Br J Cancer. 2010;102:1627‐1635. [DOI] [PMC free article] [PubMed] [Google Scholar]
- 64. Zheng G, Peng C, Jia X, et al. ZEB1 transcriptionally regulated carbonic anhydrase 9 mediates the chemoresistance of tongue cancer via maintaining intracellular pH. Mol Cancer. 2015;14:84. [DOI] [PMC free article] [PubMed] [Google Scholar]
- 65. Storci G, Sansone P, Trere D, et al. The basal‐like breast carcinoma phenotype is regulated by SLUG gene expression. J Pathol. 2008;214:25‐37. [DOI] [PubMed] [Google Scholar]
- 66. Liu T, Zhang X, Shang M, et al. Dysregulated expression of Slug, vimentin, and E‐cadherin correlates with poor clinical outcome in patients with basal‐like breast cancer. J Surg Oncol. 2013;107:188‐194. [DOI] [PubMed] [Google Scholar]
- 67. Toiyama Y, Yasuda H, Saigusa S, et al. Increased expression of Slug and Vimentin as novel predictive biomarkers for lymph node metastasis and poor prognosis in colorectal cancer. Carcinogenesis. 2013;34:2548‐2557. [DOI] [PubMed] [Google Scholar]
- 68. Wang C, Liu X, Huang H, et al. Deregulation of Snai2 is associated with metastasis and poor prognosis in tongue squamous cell carcinoma. Int J Cancer. 2012;130:2249‐2258. [DOI] [PMC free article] [PubMed] [Google Scholar]
- 69. Hung J‐J, Yang M‐H, Hsu H‐S, Hsu W‐H, Liu J‐S, Wu K‐J. Prognostic significance of hypoxia‐inducible factor‐1alpha, TWIST1 and Snail expression in resectable non‐small cell lung cancer. Thorax. 2009;64:1082‐1089. [DOI] [PubMed] [Google Scholar]
- 70. Jiang W, Pang X‐G, Wang Q, Shen Y‐X, Chen X‐K, Xi J‐J. Prognostic role of Twist, Slug, and Foxc2 expression in stage I non‐small‐cell lung cancer after curative resection. Clin Lung Cancer. 2012;13:280‐287. [DOI] [PubMed] [Google Scholar]
- 71. Merikallio H, Kaarteenaho R, Pääkkö P, et al. Zeb1 and twist are more commonly expressed in metastatic than primary lung tumours and show inverse associations with claudins. J Clin Pathol. 2011;64:136‐140. [DOI] [PubMed] [Google Scholar]
- 72. Wei L, Sun J‐J, Cui Y‐C, et al. Twist may be associated with invasion and metastasis of hypoxic NSCLC cells. Tumour Biol J Int Soc Oncodevelopmental Biol Med. 2016;37:9979‐9987. [DOI] [PubMed] [Google Scholar]
- 73. Pallier K, Cessot A, Côté J‐F, et al. TWIST1 a new determinant of epithelial to mesenchymal transition in EGFR mutated lung adenocarcinoma. PLoS ONE. 2012;7:e29954. [DOI] [PMC free article] [PubMed] [Google Scholar]
- 74. Kim SJ, Rabbani ZN, Dewhirst MW, et al. Expression of HIF‐1alpha, CA IX, VEGF, and MMP‐9 in surgically resected non‐small cell lung cancer. Lung Cancer Amst Neth. 2005;49:325‐335. [DOI] [PubMed] [Google Scholar]
- 75. Kim SJ, Rabbani ZN, Vollmer RT, et al. Carbonic anhydrase IX in early‐stage non‐small cell lung cancer. Clin Cancer Res Off J Am Assoc Cancer Res. 2004;10:7925‐7933. [DOI] [PubMed] [Google Scholar]
- 76. Ren W, Mi D, Yang K, et al. The expression of hypoxia‐inducible factor‐1α and its clinical significance in lung cancer: a systematic review and meta‐analysis. Swiss Med Wkly. 2013;143:w13855. [DOI] [PubMed] [Google Scholar]
Associated Data
This section collects any data citations, data availability statements, or supplementary materials included in this article.
Supplementary Materials