

Ecosystems are receiving increased nitrogen (N) from anthropogenic sources, including fertilizers and emissions from factories and automobiles. High levels of N change ecosystem functioning. For example, high inorganic N decreases the microbial decomposition of plant litter, potentially reducing nutrient recycling for plant growth. Understanding how N regulates microbial decomposition can improve the prediction of ecosystem functioning over extended time scales. We found little support for the conventional view that high N supply represses the expression of genes involved in decomposition or alters the expression of bacterial genes for inorganic N cycling. Instead, our study of pine forest soil 3 days after N addition showed changes in microbial gene expression related to cell maintenance and stress response. This highlights the challenge of establishing predictive links between microbial gene expression levels and measures of ecosystem function.
KEYWORDS: metatranscriptomics, nitrogen fertilization, microbial community, carbohydrate-active enzymes
ABSTRACT
Numerous studies have examined the long-term effect of experimental nitrogen (N) deposition in terrestrial ecosystems; however, N-specific mechanistic markers are difficult to disentangle from responses to other environmental changes. The strongest picture of N-responsive mechanistic markers is likely to arise from measurements over a short (hours to days) time scale immediately after inorganic N deposition. Therefore, we assessed the short-term (3-day) transcriptional response of microbial communities in two soil strata from a pine forest to a high dose of N fertilization (ca. 1 mg/g of soil material) in laboratory microcosms. We hypothesized that N fertilization would repress the expression of fungal and bacterial genes linked to N mining from plant litter. However, despite N suppression of microbial respiration, the most pronounced differences in functional gene expression were between strata rather than in response to the N addition. Overall, ∼4% of metabolic genes changed in expression with N addition, while three times as many (∼12%) were significantly different across the different soil strata in the microcosms. In particular, we found little evidence of N changing expression levels of metabolic genes associated with complex carbohydrate degradation (CAZymes) or inorganic N utilization. This suggests that direct N repression of microbial functional gene expression is not the principle mechanism for reduced soil respiration immediately after N deposition. Instead, changes in expression with N addition occurred primarily in general cell maintenance areas, for example, in ribosome-related transcripts. Transcriptional changes in functional gene abundance in response to N addition observed in longer-term field studies likely result from changes in microbial composition.
IMPORTANCE Ecosystems are receiving increased nitrogen (N) from anthropogenic sources, including fertilizers and emissions from factories and automobiles. High levels of N change ecosystem functioning. For example, high inorganic N decreases the microbial decomposition of plant litter, potentially reducing nutrient recycling for plant growth. Understanding how N regulates microbial decomposition can improve the prediction of ecosystem functioning over extended time scales. We found little support for the conventional view that high N supply represses the expression of genes involved in decomposition or alters the expression of bacterial genes for inorganic N cycling. Instead, our study of pine forest soil 3 days after N addition showed changes in microbial gene expression related to cell maintenance and stress response. This highlights the challenge of establishing predictive links between microbial gene expression levels and measures of ecosystem function.
INTRODUCTION
Most nitrogen (N) in microbial cells comes from organic material, and harvesting this N requires breaking down complex polymers (1). Due to a low availability in soils, inorganic forms of N, such as ammonium (NH4+) or nitrate (NO3−), only account for a small proportion of total N assimilated by microbial cells. Thus, organic N mining plays an important role in the decomposition process and is a key link between the carbon (C) and N cycles. In recent years, terrestrial ecosystems have received more inorganic N from anthropogenic sources, including fertilizers and emissions from factories and automobiles—a phenomenon called N deposition (2, 3). In the past century, N deposition has increased 3- to 5-fold globally and up to 100-fold locally, now exceeding natural N deposition (2–4). Coupled C and N cycles in soils represent a major path for nutrient cycling in terrestrial ecosystems. Additional N should alter this cycle, but it is not yet known how this will happen or whether it will be positive or negative for C or N sequestration. Given the potential impact of N deposition on coupled C and N cycles, quantifying the effects and deciphering the underlying mechanisms of N amendment can improve the predictions of ecosystem behavior as N deposition continues to increase.
Numerous studies have examined the long-term effect of experimental N deposition in terrestrial ecosystems. Over a decadal time frame, N deposition tends to increase ecosystem productivity and reduce soil respiration; however, responses vary across ecosystems (5–9). One mechanism underpinning reduced respiration involves the decreased activity of Basidiomycota fungi. In pine forests, when N supply increases, plants are believed to reduce sugar allocation to basidiomycete symbionts, resulting in lower basidiomycete growth and decomposition of plant litter (5). Another mechanism involves the direct repression of transcription of fungal genes involved in litter catalysis. The repression of fungal gene expression under N fertilization has been demonstrated with pure cultures, including those of Saccharomyces, Phanerochaete, Aspergillus, and Neurospora (10–13). Likewise, lower transcript abundances for some litter decomposition genes and lower C-cycling enzyme activities have been measured in at least two long-term field studies of N fertilization (14–17). In contrast, other long-term field experiments found no evidence of changes in mechanistic gene markers (18, 19). N-specific mechanistic markers in long-term studies are difficult to disentangle from responses to other environmental changes that typically occur under N fertilization, such as changes in soil chemistry and plant activity (20).
The clearest picture of N-responsive mechanistic markers is likely to arise from measurements over a short (hours to days) time scale immediately after the deposition of inorganic N. Inorganic N addition to soils, whether through atmospheric deposition during rain events or through fertilizer application, occurs primarily in sporadic pulse events that are rapidly processed (21–23). Short-term N tracer experiments have shown that microbes absorb ∼50% of inorganic N during the first few days following N addition (24–27), and soil respiration is reduced within days of N application (28), indicating an immediate functional response.
To test the hypothesis that N fertilization represses the initial expression of fungal and bacterial genes linked to N mining from plant litter, we performed a soil metatranscriptome study in laboratory microcosms. We examined the short-term (3-day) transcriptional response of pine forest microbial communities in two soil strata to a high dose of N fertilization (ca. 1 mg/g of soil material). A previous field study of the same pine forest found that long-term N fertilization had a significant effect on fungal community composition and function in these two strata (29–31). In both strata, long-term N fertilization led to altered community composition, reduced extracellular enzyme activity, and altered abundance of some N cycling genes (29–31). Given these findings, we expected that dramatic changes in community gene expression would be apparent immediately after an N deposition event.
RESULTS
Short-term water and N addition alter respiration.
Cumulative respiration at 64 h differed by stratum (t test; P = 0.0003), with higher respiration in the litter layer (LL) than in the O horizon (OH) (Fig. 1). The two strata differed in their soil chemistries (see Table S1 in the supplemental material), as expected from a previous characterization of soil horizons at the Duke experimental forest site (29). Water addition stimulated respiration in both the LL and the OH (t test; P = 0.0005 and P = 0.003, respectively), while N addition suppressed respiration in both the LL and the OH (t test; P = 0.0004 and P = 0.07, respectively). At 64 h, microcosms with added water and N released 27% and 25% less cumulative CO2 in the LL and OH, respectively, than microcosms with added water only (compare circles to respective triangles in Fig. 1).
FIG 1.
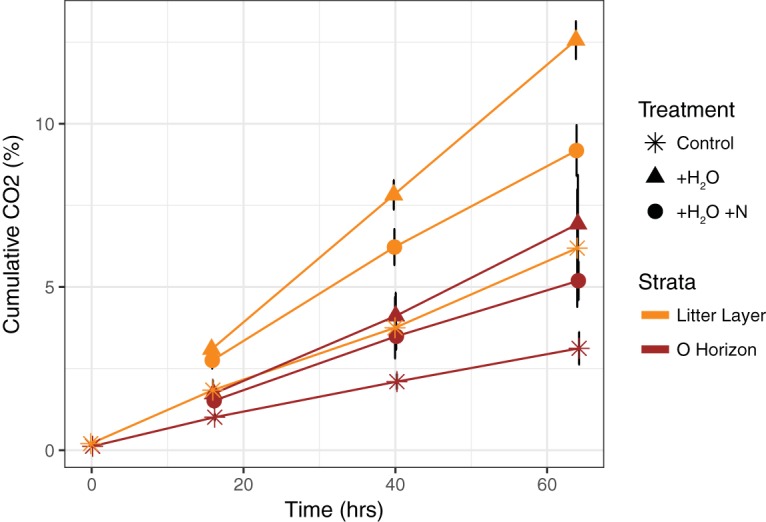
Amount of CO2 produced in microcosms over 64 h. Microcosms are grouped by the two strata, including litter layer and O horizon, and three treatments, including control, water addition, and water and nitrogen addition. Each strata-by-treatment group is represented by four replicates.
Stratum-specific taxonomic composition of microbial communities.
Gene expression levels were higher in the OH stratum (104 ± 96 ng/μl RNA per g of soil) than in the LL (45 ± 28 ng/μl RNA per g of soil) across all treatments. As found with previous field studies at this site (29), the LL samples were dominated by fungal rRNAs (62%), while the O horizon was dominated by bacterial rRNAs (81%) (Fig. 2A). We saw significant differences in family level taxonomic composition for bacteria and fungi between the two strata (permutational multivariate analysis of variance [PERMANOVA]; P = 0.001) (Fig. 3A). Differences in taxonomic compositions between the two strata were driven by many taxa; 30% of the differences could be attributed to changes in the relative abundances of eight families, including both fungi (Helotiaceae [Helotiales], Pluteaceae [Agaricales], Paraglomeraceae [Pezizales], Mortierellaceae [Mucorales], Pyronemataceae [Pezizales]) and bacteria (Solibacteraceae [Solibacterales], Acidobacteriaceae [Acidobacteriales], Bradyrhizobiaceae [Rhizobiales]) (SIMPER analysis).
FIG 2.

Relative abundances of taxonomic groups across the different sample averaged across replicates (n = 4). Compositions are shown for fungi, bacteria, and archaea (A), fungi (order level) (B), and bacteria and archaea (order level) (C). Sample types include metatranscriptome (MT) data from the two strata, litter layer (LL; yellow highlight) and O horizon (OH; peach highlight), initial samples taken at 0 h (initial), and final samples taken at 64 h (control, water addition [+H2O], water and nitrogen addition [+H2O+N]). Composition of metagenomic (MG) samples was also assessed for +H2O and +H2O+N samples in the LL.
FIG 3.

Nonmetric multidimensional scaling (NMDS) ordinations showing transcriptional expression variability in microbial community composition (RefSeq) (A), metabolic genes (Pfam) (B), and carbohydrate-active enzymes (CAZymes) (C). Dissimilarity matrices were calculated using the Bray-Curtis metric.
No significant taxonomic changes in either the fungal or bacterial communities were detected in response to N fertilization. Samples were clustered by a location-by-treatment interaction, but this was not significant, likely due to insufficient statistical power. This is in contrast with field data looking at the effects of long-term N addition on microbial communities at the Duke site, where fungal community richness increased in response to N amendment (29, 32) and the relative abundance of Basidiomycota decreased (29, 32).
We sequenced DNA/RNA coextractions for a number of LL strata samples to compare the “seedbank” (metagenomes) versus “active” (metatranscriptomes) functional and taxonomic compositions. The LL metatranscriptomes were dominated by fungal reads (60%), whereas fungal reads in the LL metagenomes accounted for only 1% (Fig. 2A). This highlights a shortfall of using metagenomic data to assess the performance and activity of soil microbial communities, particularly where fungi play an important role. In metagenomics data, sequenced reads that are assignable to an organism or Pfam are primarily bacterial. Increases in the number and diversity of fungal genomes being sequenced may improve this in the near future. However, the abundant fungi and bacteria were similar between the metagenomes and metatranscriptomes (Fig. 2B and C).
Stratum-specific functional composition of microbial communities.
Functional annotations were performed using several different databases to achieve a broad overview of metabolic functions and to focus on specific functional categories of interest, namely, N and C cycling (carbohydrate-active enzymes [CAZymes]). As with taxonomy, at a broad level (KEGG functional level 2), the most abundant functions were similar across metatranscriptomes (Fig. 4). At higher levels of annotation resolution, as with taxonomic composition, functional compositions differed by stratum, whether annotations were performed through KEGG (function) or Pfam (PERMANOVA; strata, P = 0.005 and P = 0.001, respectively) (Fig. 3B). Focusing on individual genes, across all metabolic genes (annotated using the Pfam database), 1,139 of 9,479 were significantly different by stratum, where 98% were higher in the OH than the LL. Only 354 of 9,479 differed significantly with N addition, where 19% of these were upregulated with N addition. Significant differences were observed in only 8/291 (3%) of KEGG level 3 pathways. Half (n = 4) of these KEGG pathways that differed by treatment were related to carbohydrate metabolism (discussed below). The other four pathways were related to the regulation of gene expression (pathway [path]: ko00270), RNA degradation (path: ko03018), base excision repair (path: ko03410), and phenylpropanoid biosynthesis (path: ko00940) (see Fig. S1). Abundances were highest in the RNA degradation pathway, where N and water addition increased RNA degradation expression levels relative to only water addition.
FIG 4.

Relative abundances of functional groups (KEGG level 2) across the different samples averaged across replicates (n = 4). Sample types include metatranscriptome (MG) data from the two strata, litter layer (LL) and O horizon (OH). Initial samples were taken at 0 h (initial) and final samples at 64 h (control, water addition [+H2O], water and nitrogen addition [+H2O+N]). Compositions of metagenomic (MG) samples were also assessed for +H2O and +H2O+N samples in the LL.
Significant differences in functional compositions between the metatranscriptomes and metagenomes (PERMANOVA; P = 0.001) were identified. The profiles of KEGG level 2 categories were different between the metatranscriptomes (n = 7) and metagenomes (n = 2). For example, amino acid metabolism and membrane transport were higher in the metagenomes than in the metatranscriptomes, and folding, sorting, and degradation categories were lower (SIMPER analysis) (Fig. 4).
Carbohydrate metabolism response to stratum and N addition.
Location had a significant effect on the abundance of genes expressed in carbohydrate metabolism pathways, including glycolysis/gluconeogenesis, citrate cycle, fructose and mannose metabolism, starch and sucrose metabolism, and amino sugar and nucleotide sugar metabolism. In all cases, gene expression was higher in the LL than in the OH and paralleled the fungal biomass (29). A significant treatment effect was found for carbohydrate metabolism, where the expression of three pathways increased and the expression of one pathway decreased under N addition. The upregulated pathways were glycolysis/gluconeogenesis, the citrate cycle, and glyoxylate and dicarboxylate metabolism; the downregulated pathway was C5-branched dibasic acid metabolism (Fig. S1). Finally, there was a significant treatment-by-location interactive effect for propanoate metabolism and C5-branched dibasic acid metabolism.
Stratum-specific carbon cycling (CAZymes).
As with overall function, stratum had a significant effect on the CAZyme composition (PERMANOVA, P = 0.001) (Fig. 3C), but there was no effect of treatment and no location-by-treatment interaction. Twenty-five individual CAZymes (13% of the total detected CAZymes) were more abundant in the OH than in the LL, while only CBM52 (eukaryotic β-1,3-glucanase) was more abundant in the LL (Fig. S1). Furthermore, CBM52 and CE14 (bacterial enzymes) increased while CBM3 (cellulose binding, bacterial) decreased significantly with N addition in both horizons (see Fig. S2). For another subset of CAZymes, we saw a treatment-by-location interactive effect (see Fig. S3). For this subset, N addition decreased the expression in the LL microcosms but increased the expression in the OH microcosms. Lastly, a comparison of metatranscriptomes from the initial sampling time showed significantly higher expression levels in the OH than in the LL for 44% of the CAZymes. This set of CAZymes included those known to be present only in fungi, those known to be present only in bacteria, and those known to be present in both bacteria and fungi (see Fig. S4).
Low abundances of N cycling genes.
Inorganic N metabolism gene expression (e.g., genes nifH, napA, nosZ, and amoB) did not change significantly in response to N addition. Overall, N cycling gene abundances were very low across all metatranscriptomes, averaging 108 raw annotated N metabolism sequences per metatranscriptome across 43 genes, which was only approximately 0.1% of the annotated functional genes (see Table S2). The average number of N metabolism reads was much lower in the LL (28) than in the OH (213).
When comparing our subset of metatranscriptomes across strata and N treatment, in several cases we saw an increased abundance of N cycle genes in the OH relative to that in the LL, which is probably due to increases in bacterial relative to fungal sequences. This was the case whether the data were annotated with KEGG N metabolism pathways within the MG-RAST platform or through the Pfam database. We saw a significant increase in norB, nosZ, and napG in the OH compared to the LL (Fig. S6A). Furthermore, we saw a significant increase in archaeal AmoA and glutamine synthase expression in the OH compared to that in the LL (Pfam) (see Fig. S6B). We also did not observe any location-by-treatment effects with the Pfam or KEGG N cycle gene analysis. Also of note, for N cycling metabolism, the average number of raw reads in the LL metagenomes was 4,770, two orders of magnitude larger than the average number of raw reads in the LL metatranscriptomes (n = 28).
Metatranscriptome assembly.
The OH assembly was more successful than the LL assembly. The number of contigs >1,000 bp was 3,743 for the LL and 32,561 for the OH. As such, in the LL horizon differential analysis did not distinguish any significant differences between water addition (plus H2O) and the water and N addition (plus H2O plus N) treatments. In the OH horizon, 918 contigs were more abundantly expressed in the plus H2O plus N treatment than in the plus H2O treatment. However, 80% (731) of these could not be assigned a functional annotation in SEED. Of the contigs assigned a functional annotation, most were broadly categorized as protein metabolism (33), stress response (34), membrane transport (35), or RNA metabolism (23). Further analysis of assembled data was discontinued due to low assembly and annotation success.
DISCUSSION
A large body of field research suggests that an elevated supply of inorganic N should repress the expression of microbial genes linked to N mining of plant litter (8, 16, 36–38). Here, the goal was to identify N-deposition-linked molecular markers to improve the monitoring of N responses in more complex settings. Despite obvious N suppression of microbial respiration, we found little evidence of N changing the expression levels of metabolic genes and, in particular, of genes associated with carbohydrate degradation or inorganic nitrogen utilization (Fig. 1). The absence of a strong transcriptional N response is striking because it failed to occur under simplified and controlled conditions, a 64-h microcosm soil decomposition time course, where microbial community activity should be near maximal (39), and responses were unobscured by other environmental variables.
Stratum-specific responses.
The most pronounced differences in functional gene expression were between strata rather than in response to N addition. Overall, ∼4% of functional genes changed in expression with N addition, while three times as many (∼12%) were significantly different across the different soil strata in the microcosms. This is congruent with field studies focused on responses to N addition across different soil horizons at the Duke Forest experimental field site (29, 32). As found in previous studies, microbial activity in the LL was dominated by fungi, while the OH was dominated by bacteria. In the field, the LL and OH strata differed in responses to N input, where the response was highest in the LL (29, 32). Furthermore, in both our microcosm study and field studies, interactive effects were observed between N addition and stratum, where gene expression increased in one horizon and decreased in the other horizon in response to N addition. Both horizons are shallow and well within the depth realm of standard sampling assays. Respired CO2 from both these horizons will contribute to atmospheric climate feedbacks.
In microcosms, the gene expression levels were overwhelmingly higher in the OH stratum across all treatments. Twenty-two percent of the CAZymes, including those known to be present in bacteria, fungi, and both domains, were higher in OH, where respiration was consistently lower. Furthermore, when differences in functional genes between the two strata were observed, this was primarily (98% of cases) due to increases in transcript expression in the OH. Differences between strata are likely due to the combined effects of soil chemistry and microbial community composition differences. For example, the OH may have more readily available substrates to metabolize, or the OH subsurface microbial community may be more stable than the surface LL community. In either case, this might provide the OH community with the opportunity for more rapid growth under “ideal” lab conditions.
Weak transcriptional response to N addition.
Although we expected that N fertilization would repress the initial expression of fungal and bacterial genes linked to N mining from plant litter, the observed transcriptional response to N addition was extremely weak. Few CAZyme marker genes displayed a coherent response to N addition. This contrasted with long-term N addition field studies that have documented changes in CAZyme expression in N-amended versus ambient plots (29, 30, 32) and suggests that changes in CAZyme profiles in these field studies are likely indirectly related to N addition. N metabolism is an essential component of cellular metabolism and is intimately associated with C uptake and cycling; thus, it is reasonable to assume that C decomposition enzymes are affected by changes in inorganic N content. These changes in metabolic expression may be linked to long-term changes in community composition through selection processes and/or changes in soil chemistry related to N addition. Thus, the relationship between short-term biogeochemical pulses and microbial community patterns, such as those observed in gene presence and abundance, remains obscure.
While few CAZymes responded directly to N addition, a number of central carbohydrate metabolism pathways were upregulated. This suggests that instead of complex carbohydrates, initial N addition stimulated the more rapid use of simple sugars. Thus, in the short-term, N addition may change the carbon use efficiency (CUE), increasing the fraction of carbon allocated to growth while decreasing the fraction respired as CO2 (40).
No N cycle marker gene expression changed in response to N addition. However, the low abundance of metatranscriptomic reads (for many genes there were zero mapped reads) for common N cycling marker genes in all samples prevented a robust comparison between treatments (see Table S2 in the supplemental material). N cycle marker gene reads were approximately 150-fold lower in metatranscriptomes than in metagenomes. This was contrary to our expectation that we would observe more N cycle genes in metatranscriptomes than in metagenomes, because metatranscriptomes are an enriched subset of all the genes present in metagenomes.
The lack of a response in N cycle marker genes to N addition in the microcosm experiment may be explained a number of different ways. Since N availability varies widely in time and space, most bacteria tightly control N acquisition through the assimilation of ammonia or other sources (41). Furthermore, bacteria constantly monitor intracellular N status. Thus, a response to changes in environmental N may sometimes involve other regulatory phenomena instead of gene expression changes for N cycling enzymes (13, 35, 42). The regulation of N metabolism across bacteria and archaea is incredibly diverse. For example, six genes encoding different transcriptional regulators (GlnR, TnRA, NitR, GlnRII, AmtR, and NtrC) are key in nitrogen regulation across six commonly studied bacterial families (Bacillales, Lactobacillales, Clostridiales, Streptomycetes, Mycobacteria, and Corynebacteria) (43). Single organisms often possess multiple ways to react to changes in N supply (41).
To add to the complexity, regulation in response to N availability might not always occur at the transcriptional level. Molecular and physiological studies with model organisms suggest a complex hierarchical network of intracellular processes contributing to central N metabolism. This network includes a combination of transport, metabolism, and signaling controls (41). Additionally, even in physiology literature, the metabolic N state of cells is often poorly and qualitatively defined. The underlying problem is that the N state of a cell is a multidimensional space which is often oversimplified into a few “key” enzymes (41, 44). While reductionist approaches are common with molecular data within molecular biology (34, 45) and within community ecology, emergent functional properties of a cell or a community may only be visible at higher levels of complexity and lost at the level of isolated components (46, 47). In essence, all of the catabolic enzymes may be abundantly present in a complex community of fungi and bacteria, but the measured abundance of these may not correlate with community activity. It may instead be the regulation of these enzymes that is the critical parameter for correlation with activity. Alternatively, we may have missed the transcriptional response of N cycling genes, as mRNA can be extremely short-lived. However, this is unlikely, as we observed the maximum differences in respiration between 40 to 64 h compared to that between 0 to 16 or 16 to 40 h (Fig. 1).
Relevance of targeted metatranscriptomics.
Short-term environmental perturbations often have large impacts on biogeochemical rate measurements. For example, as seen in this microcosm experiment and in field studies, N pulse deposition decreased respiration, while water addition stimulated respiration (28, 48–50). However, results from this study and other studies (51, 52; B. Steven and C. R. Kuske, submitted for publication) suggest that biogeochemical flux responses to short-term environmental perturbations may be invoked by highly complex responses and/or mechanisms not represented by conventional genomic markers. A recent study of soil biocrust communities found that wetting soils primarily induced changes in the abundance of ribosome-related transcripts rather than specific biogeochemical cycling genes (Steven and Kuske, submitted). In this study, in addition to a few central metabolism pathways, RNA degradation had a significantly higher relative abundance in microcosms with N addition treatment (Fig. S1). RNA decay plays an important role in enabling cells to quickly react to changing growing conditions, and RNA degradation pathways are invoked as a stress response (33). Thus, changes in gene expression immediately following a perturbation may reveal common microbial community regulatory responses to deal with general stress and environmental fluctuations (nutrient availability, temperature, and precipitation).
Conclusion.
Results from this study contradict the conventional views of the response of soil microbial communities to N deposition and demonstrate the challenge of linking biogeochemical fluxes to community gene expression levels. While correlations between the abundance of biogeochemical marker genes or transcripts with environmental gradients are common (53–57), both determining the mechanisms driving changes in marker abundance and demonstrating consistent links between genes and process rates have been less successful (58, 59). If mechanistic links between marker genes and biogeochemical fluxes are not apparent in controlled short-term perturbation experiments, what type of studies are needed? How can changes in marker abundance over environmental gradients be interpreted? A large area of research is currently focused on the goal to use trait-based genomics to model biogeochemistry (60–63). Ultimately, relating gene presence or abundance to ecosystem processes will require understanding what is driving changes in gene abundances across gradients.
MATERIALS AND METHODS
Field site.
Soil was collected from the Duke Forest pine FACE site (35°58′41.430″N, 79°05′39.087″W, NC, USA) in November 2016, immediately placed on ice, shipped on ice overnight to Los Alamos National Laboratory (Los Alamos, NM, USA), and stored at 4°C for 2 weeks until use. The Duke site soil is characterized as a low-fertility acidic clay-loam, and the dominant overstory vegetation is loblolly pine (Pinus taeda L.). The mean annual temperature is 15.5°C and the mean annual precipitation is 1,145 mm, with periodic rainfall throughout the year (64). Relevant to this study, previous research at this site found differences in microbial compositions and functions across multiple soil strata in response to N addition (29–31). Soil cores were collected from three locations from a “control” plot that did not have a history of N fertilization. Cores were divided into two strata, litter layer (LL) and organic horizon (OH), also commonly referred to as the Oe and Oa horizons, respectively. Cores were then pooled by strata (29). Soil chemistry was assessed on a subsample of the LL and OH strata (Colorado State University Soil, Water and Plant Testing Laboratory) using standard procedures.
Microcosm experiment.
Replicate microcosms were constructed with 250-ml serum bottles, each containing 6 g of soil material. Three experimental treatments included a control, water addition (1 ml/g soil material), and water and N addition (1 ml/g soil material, with NH4NO3 at 1 mg/ml), with four replicates per treatment and two soil strata. Microcosms were destructively sampled at four time points (0, 16, 40, and 64 h); thus, altogether, the experiment included 80 microcosms. We expected that the water addition would change global gene expression and that water plus N addition would cause additional changes due to the increased N.
Carbon dioxide (CO2) measurements were collected on a random set of four control microcosms for each stratum at time zero, immediately prior to water and N additions. Subsequently, every microcosm (all treatments and strata) was measured at 16, 40, and 64 h. At each time point, four replicates of each treatment were destructively sampled by placing the entire microcosm in storage at −80°C. For each of the remaining microcosms that were not measured at that time point, the air was evacuated with a vacuum pump and replaced with sterile-filtered ambient air to prevent oxygen depletion. CO2 measurements were performed with a micro-gas chromatograph (Agilent Technologies).
Metatranscriptomic and metagenomic sequencing.
Four replicate microcosms per treatment were destructively sampled at 0 h (before treatments) and 64 h. Soil was stored at −80°C. RNA was extracted using an RNA/DNA coextraction protocol detailed in reference 30. Briefly, following extraction, RNA was isolated (Ambio Turbo DNase kit) and purified (Qiagen RNeasy Mini kit). rRNA was removed from the samples using a combination of Illumina RiboZero H/M/R and Bacteria kits. Libraries were prepared using a ScriptSeq v2 library preparation kit (Illumina) and validated using a Qubit dsDNA HS assay (Thermo Fisher), BioAnalyzer DNA high-sensitivity assay (Agilent), and library quantification kit (KAPA; Illumina/Universal). The libraries were diluted, pooled, and denatured before being run on a NextSeq 500 system (high-output v2 kit for 300-cycle sequencing).
Metatranscriptomic and metagenomic unassembled annotation.
Metatranscriptomes and metagenomes were processed and annotated using multiple methods and databases. Each annotation process is subject to biases, so using multiple approaches enabled a more confident search for changes in C and N cycling genes in response to experimental treatments. Sequences were uploaded to the metagenomics analysis server (MG-RAST) for annotation and are publically available (mgp82200, https://metagenomics.anl.gov/) (65). For the metatranscriptomes, an average of 3.96 million sequences per sample passed quality control. Of these sequences, 20.2% ± 8.5% were known predicted proteins, 55.5% ± 3.3% unknown predicted proteins, and 24.3% ± 8.2% ribosomal genes. From the MG-RAST server, RefSeq (66) and KEGG (67) data were downloaded for analysis of taxonomy and function assignments, respectively (default parameters, E value < 10−5, identity > 60%). Once downloaded, reads annotated as nonfungal eukaryotes and viruses were manually removed from the data set being used for taxonomic comparisons. For each library and data type, data were then standardized using the proportion of reads of each taxon compared to the total. KEGG-annotated functional data were visualized at a broad level, and further analyses were performed with genes classified under N metabolism (path: ko00910) and carbohydrate metabolism (path: ko00650, ko00660, ko00640, ko00630, ko00620, ko00562, ko00520, ko00500, ko00053, ko00052, ko00051, ko00040, ko00030, ko00020, and ko00010).
In addition to automated analysis through MG-RAST, metatranscriptomes were processed in a separate pipeline to focus on metabolic genes, in particular, carbohydrate-binding modules of enzymes that degrade, modify, or create glycosidic bonds. Paired-end library reads were joined using PEAR (68). Joined reads and the remaining unmerged forward reads were combined and filtered using fastq-mcf in the EA-UTILS software package (69). Coding regions of the filtered reads were generated with FragGeneScan-Plus (70). A functional profile for each library was generated by searching translated reads using HMMER v3.1b2 (71, 72) against the Pfam database (73), where top sequence matches with an E value <−05 were retained. An additional carbohydrate-active enzyme (CAZyme) functional profile for each library was generated by searching the translated reads, again using HMMER v3.1b2 against the dbCAN database (74). For each metatranscriptome, Pfam and CAZyme reads were standardized by the total number of translated reads.
Statistical analyses.
To test for changes in the taxonomic and functional compositions of genes expressed in response to N addition, we used a subset of the metatranscriptomic data. This included the libraries from the 64-h (final) sampling time point that received the water addition (plus H2O) and the water and N addition (plus H2O plus N) in the litter layer (LL) and O horizon (OH) strata, with four replicates for each sample type. Using these samples for taxonomic and functional compositions, we performed a permutational multivariate analysis of variance (PERMANOVA; vegan package, R) (75). The model included strata (LL and OH) and treatment (plus H2O and plus H2O plus N) as the main fixed factors and a strata-by-treatment interaction. The model was run using the Bray-Curtis method with 999 permutations. Our PERMANOVA analysis identified significant differences in taxonomic composition by stratum; thus, we used a similarity percentage (SIMPER) analysis (vegan package) to test for which taxa accounted for the majority of differences between the strata.
In addition to looking for differences in the overall metabolic (Pfam) and carbohydrate-active enzyme (CAZyme) compositions, we also tested for differences in the relative abundances of individual metabolic genes between the two strata and the N treatment. Here, we used a two-way analysis of variance (ANOVA) design (type III), again with strata and N treatment as fixed effects. The ANOVA analysis was conducted in the R software environment (76).
Lastly, we tested for differences in metabolic compositions between the metagenomes and metatranscriptomes with our subset of paired LL samples, again using a PERMANOVA. Here, the model compared data type (metagenome versus metatranscriptome). Again, we ran a post hoc SIMPER analysis to identify which functions contributed most to differences in the abundances of potential versus expressed functional genes.
Metatranscriptome assembly and annotation.
Metatranscriptomes were assembled as described by Steven and Kuske (submitted). First, the BBDuk tool in the BBmap package (http://sourceforge.net/projects/bbmap) was used to quality-trim sequences to only include bases with a Phred quality score of at least 10, and adaptor sequences were removed with the included reference file. Next, any remaining 16S rRNA sequences were removed using BBDuk and Kmers derived from the SILVA 16S rRNA database (ribokmers.fa). Finally, any potential human contaminants were also removed with the BBDuk tool using the hg19_main_mask_ribo_animal_allplant_allfungus.fa reference file.
The remaining sequences were assembled with MEGAHIT (version 1.1.2 [77]) in paired-end mode. Because we had a priori knowledge of differences in microbial communities between the soil strata (LL and OH), microbial communities were assembled independently by horizon. The resulting assembly quality was assessed using the MetaQuast package with the de novo evaluation of sequence statistics (78). All contigs less than 500 bp were removed prior to pseudoalignment and statistical analyses.
To quantify contig abundance in the transcriptomes, raw sequence reads were pseudoaligned with the contigs to generate estimated counts of each contig using the kallisto software package v.0.43.1 (79). Significant differences in estimated counts between water addition (plus H2O) and the water and N addition (plus H2O plus N) for each horizon were identified by using the sleuth package v.0.29.0 in R (80). P values were adjusted for multiple testing using the Benjamini-Hochberg procedure, and contigs with an adjusted P value of ≤0.05 and at least a 2-fold change in abundance were considered significant. The resulting contigs were aligned with the NCBI nonredundant (NR) protein database (downloaded 9 July 2017) using DIAMOND (81). The alignments were uploaded to the community version of MEGAN 6 (82), and contigs were matched to SEED subsystems (83) within MEGAN using the long-read-enabled sequence assignment and the May 2015 accession to SEED mapping file.
Data availability.
The metatranscriptomic and metagenomic sequence data generated that support the findings of this study are available through the MG-RAST server (mgp82200; http://metagenomics.anl.gov/mgmain.html?mgpage=project&project=mgp82200). All other relevant data are available from the corresponding author on request.
Supplementary Material
ACKNOWLEDGMENTS
This work was supported by the U.S. Department of Energy, Office of Science, Biological and Environmental Research Division, under award number F260LANL2018, and by an Office of Science Graduate Student Research (SCGSR) Fellowship to M.B.N.A.
J.D. and C.R.K. designed the study. R.J., D.L., and L.V.G.-G. carried out the experiments and lab work. M.B.N.A. and B.S. carried out the data analyses. M.B.N.A. wrote the manuscript, and C.R.K. and J.D. contributed to manuscript revisions.
The authors declare no conflict of interest.
Footnotes
Supplemental material for this article may be found at https://doi.org/10.1128/AEM.00598-18.
REFERENCES
- 1.Schimel JP, Bennett J. 2004. Nitrogen mineralization: challenges of a changing paradigm. Ecology 85:591–602. doi: 10.1890/03-8002. [DOI] [Google Scholar]
- 2.Galloway JN, Dentener FJ, Capone DG, Boyer EW, Howarth RW, Seitzinger SP, Asner GP, Cleveland CC, Green PA, Holland EA, Karl DM, Michaels AF, Porter JH, Townsend AR, Vorosmarty CJ. 2004. Nitrogen cycles: past, present, and future. Biogeochemistry 70:153–226. doi: 10.1007/s10533-004-0370-0. [DOI] [Google Scholar]
- 3.Vitousek PM, Aber JD, Howarth RW, Likens GE, Matson PA, Schindler DW, Schlesinger WH, Tilman D. 1997. Human alteration of the global nitrogen cycle: sources and consequences. Ecol Appl 7:737–750. doi: 10.2307/2269431. [DOI] [Google Scholar]
- 4.Denman KL, Brasseur G, Chidthaisong A, Ciais P, Cox PM, Dickinson RE, Hauglustaine D, Heinze C, Holland E, Jacob D, Lohmann U, Ramachandran S, da Silva Dias PL, Wofsy SC, Zhang X. 2007. Chapter 7. Couplings between changes in the climate system and biogeochemistry. In Solomon S, Qin D, Manning M, Chen Z, Marquis M, Averyt KB, Tignor M, Miller HL (ed), Climate change 2007: the physical science basis. Contribution of Working Group I to the fourth assessment report of the Intergovernmental Panel on Climate Change. Cambridge University Press, Cambridge, United Kingdom. [Google Scholar]
- 5.Janssens IA, Dieleman W, Luyssaert S, Subke JA, Reichstein M, Ceulemans R, Ciais P, Dolman AJ, Grace J, Matteucci G, Papale D, Piao SL, Schulze ED, Tang J, Law BE. 2010. Reduction of forest soil respiration in response to nitrogen deposition. Nat Geosci 3:315–322. doi: 10.1038/ngeo844. [DOI] [Google Scholar]
- 6.Liu XJ, Song L, He CE, Zhang FS. 2010. Nitrogen deposition as an important nutrient from the environment and its impact on ecosystems in China. J Arid Land 2:137–143. doi: 10.3724/SP.J.1227.2010.00137. [DOI] [Google Scholar]
- 7.Stursova M, Crenshaw CL, Sinsabaugh RL. 2006. Microbial responses to long-term N deposition in a semiarid grassland. Microb Ecol 51:90–98. doi: 10.1007/s00248-005-5156-y. [DOI] [PubMed] [Google Scholar]
- 8.Waldrop MP, Zak DR, Sinsabaugh RL. 2004. Microbial community response to nitrogen deposition in northern forest ecosystems. Soil Biol Biochem 36:1443–1451. doi: 10.1016/j.soilbio.2004.04.023. [DOI] [Google Scholar]
- 9.Treseder KK. 2008. Nitrogen additions and microbial biomass: a meta-analysis of ecosystem studies. Ecol Lett 11:1111–1120. doi: 10.1111/j.1461-0248.2008.01230.x. [DOI] [PubMed] [Google Scholar]
- 10.Godard P, Urrestarazu A, Vissers S, Kontos K, Bontempi G, van Helden J, Andre B. 2007. Effect of 21 different nitrogen sources on global gene expression in the yeast Saccharomyces cerevisiae. Mol Cell Biol 27:3065–3086. doi: 10.1128/MCB.01084-06. [DOI] [PMC free article] [PubMed] [Google Scholar]
- 11.Keyser P, Kirk TK, Zeikus JG. 1978. Ligninolytic enzyme system of Phanerochaete chrysosporium: synthesized in absence of lignin in response to nitrogen starvation. J Bacteriol 135:790–797. [DOI] [PMC free article] [PubMed] [Google Scholar]
- 12.Li D, Alic M, Gold MH. 1994. Nitrogen regulation of lignin peroxidase gene transcription. Appl Environ Microbiol 60:3447–3449. [DOI] [PMC free article] [PubMed] [Google Scholar]
- 13.Marzluf GA. 1997. Genetic regulation of nitrogen metabolism in the fungi. Microbiol Mol Biol Rev 61:17–32. [DOI] [PMC free article] [PubMed] [Google Scholar]
- 14.Eisenlord SD, Freedman Z, Zak DR, Xue K, He ZL, Zhou JZ. 2013. Microbial mechanisms mediating increased soil C storage under elevated atmospheric N deposition. Appl Environ Microbiol 79:1191–1199. doi: 10.1128/AEM.03156-12. [DOI] [PMC free article] [PubMed] [Google Scholar]
- 15.Freedman Z, Zak DR. 2014. Atmospheric N deposition increases bacterial laccase-like multicopper oxidases: implications for organic matter decay. Appl Environ Microbiol 80:4460–4468. doi: 10.1128/AEM.01224-14. [DOI] [PMC free article] [PubMed] [Google Scholar]
- 16.Edwards IP, Zak DR, Kellner H, Eisenlord SD, Pregitzer KS. 2011. Simulated atmospheric N deposition alters fungal community composition and suppresses ligninolytic gene expression in a northern hardwood forest. PLoS One 6:e20421. doi: 10.1371/journal.pone.0020421. [DOI] [PMC free article] [PubMed] [Google Scholar]
- 17.Sinsabaugh RL, Carreiro MM, Repert DA. 2002. Allocation of extracellular enzymatic activity in relation to litter composition, N deposition, and mass loss. Biogeochemistry 60:1–24. doi: 10.1023/A:1016541114786. [DOI] [Google Scholar]
- 18.Weber CF, Balasch MM, Gossage Z, Porras-Alfaro A, Kuske CR. 2012. Soil fungal cellobiohydrolase I gene (cbhI) composition and expression in a loblolly pine plantation under conditions of elevated atmospheric CO2 and nitrogen fertilization. Appl Environ Microbiol 78:3950–3957. doi: 10.1128/AEM.08018-11. [DOI] [PMC free article] [PubMed] [Google Scholar]
- 19.Blackwood CB, Waldrop MP, Zak DR, Sinsabaugh RL. 2007. Molecular analysis of fungal communities and laccase genes in decomposing litter reveals differences among forest types but no impact of nitrogen deposition. Environ Microbiol 9:1306–1316. doi: 10.1111/j.1462-2920.2007.01250.x. [DOI] [PubMed] [Google Scholar]
- 20.van der Wal A, Geydan TD, Kuyper TW, de Boer W. 2013. A thready affair: linking fungal diversity and community dynamics to terrestrial decomposition processes. FEMS Microbiol Rev 37:477–494. doi: 10.1111/1574-6976.12001. [DOI] [PubMed] [Google Scholar]
- 21.Belnap J, Welter JR, Grimm NB, Barger N, Ludwig JA. 2005. Linkages between microbial and hydrologic processes in arid and semiarid watersheds. Ecology 86:298–307. doi: 10.1890/03-0567. [DOI] [Google Scholar]
- 22.Collins SL, Sinsabaugh RL, Crenshaw C, Green L, Porras-Alfaro A, Stursova M, Zeglin LH. 2008. Pulse dynamics and microbial processes in aridland ecosystems. J Ecol 96:413–420. doi: 10.1111/j.1365-2745.2008.01362.x. [DOI] [Google Scholar]
- 23.Schaeffer SM, Homyak PM, Boot CM, Roux-Michollet D, Schimel JP. 2017. Soil carbon and nitrogen dynamics throughout the summer drought in a California annual grassland. Soil Biol Biochem 115:54–62. doi: 10.1016/j.soilbio.2017.08.009. [DOI] [Google Scholar]
- 24.Jackson LE, Schimel JP, Firestone MK. 1989. Short-term partitioning of ammonium and nitrate between plants and microbes in an annual grassland. Soil Biol Biochem 21:409–415. doi: 10.1016/0038-0717(89)90152-1. [DOI] [Google Scholar]
- 25.Schimel JP, Jackson LE, Firestone MK. 1989. Spatial and temporal effects on plant microbial competition for inorganic nitrogen in a California annual grassland. Soil Biol Biochem 21:1059–1066. doi: 10.1016/0038-0717(89)90044-8. [DOI] [Google Scholar]
- 26.Kaye JP, Hart SC. 1997. Competition for nitrogen between plants and soil microorganisms. Trends Ecol Evol 12:139–143. doi: 10.1016/S0169-5347(97)01001-X. [DOI] [PubMed] [Google Scholar]
- 27.Norton JM, Firestone MK. 1996. N dynamics in the rhizosphere of Pinus ponderosa seedlings. Soil Biol Biochem 28:351–362. doi: 10.1016/0038-0717(95)00155-7. [DOI] [Google Scholar]
- 28.Ramirez KS, Craine JM, Fierer N. 2010. Nitrogen fertilization inhibits soil microbial respiration regardless of the form of nitrogen applied. Soil Biol Biochem 42:2336–2338. doi: 10.1016/j.soilbio.2010.08.032. [DOI] [Google Scholar]
- 29.Weber CF, Vilgalys R, Kuske CR. 2013. Changes in fungal community composition in response to elevated atmospheric CO2 and nitrogen fertilization varies with soil horizon. Front Microbiol 4:78. doi: 10.3389/fmicb.2013.00078. [DOI] [PMC free article] [PubMed] [Google Scholar]
- 30.Hesse CN, Mueller RC, Vuyisich M, Gallegos-Graves L, Gleasner CD, Zak DR, Kuskel CR. 2015. Forest floor community metatranscriptomes identify fungal and bacterial responses to N deposition in two maple forests. Front Microbiol 6:337. doi: 10.3389/fmicb.2015.00337. [DOI] [PMC free article] [PubMed] [Google Scholar]
- 31.Hesse CN, Torres-Cruz TJ, Tobias TB, Al-Matruk M, Porras-Alfaro A, Kuske CR. 2016. Ribosomal RNA gene detection and targeted culture of novel nitrogen-responsive fungal taxa from temperate pine forest soil. Mycologia 108:1082–1090. [DOI] [PubMed] [Google Scholar]
- 32.Mueller RC, Balasch MM, Kuske CR. 2014. Contrasting soil fungal community responses to experimental nitrogen addition using the large subunit rRNA taxonomic marker and cellobiohydrolase I functional marker. Mol Ecol 23:4406–4417. doi: 10.1111/mec.12858. [DOI] [PubMed] [Google Scholar]
- 33.Condon C. 2007. Maturation and degradation of RNA in bacteria. Curr Opin Microbiol 10:271–278. doi: 10.1016/j.mib.2007.05.008. [DOI] [PubMed] [Google Scholar]
- 34.Westerhoff HV, Winder C, Messiha H, Simeonidis E, Adamczyk M, Verma M, Bruggeman FJ, Dunn W. 2009. Systems biology: the elements and principles of life. FEBS Lett 583:3882–3890. doi: 10.1016/j.febslet.2009.11.018. [DOI] [PubMed] [Google Scholar]
- 35.Airoldi EM, Miller D, Athanasiadou R, Brandt N, Abdul-Rahman F, Neymotin B, Hashimoto T, Bahmani T, Gresham D. 2016. Steady-state and dynamic gene expression programs in Saccharomyces cerevisiae in response to variation in environmental nitrogen. Mol Biol Cell 27:1383–1396. doi: 10.1091/mbc.e14-05-1013. [DOI] [PMC free article] [PubMed] [Google Scholar]
- 36.Aro N, Pakula T, Penttila M. 2005. Transcriptional regulation of plant cell wall degradation by filamentous fungi. FEMS Microbiol Rev 29:719–739. doi: 10.1016/j.femsre.2004.11.006. [DOI] [PubMed] [Google Scholar]
- 37.Chen DM, Bastias BA, Taylor AFS, Cairney JWG. 2003. Identification of laccase-like genes in ectomycorrhizal basidiomycetes and transcriptional regulation by nitrogen in Piloderma byssinum. New Phytol 157:547–554. doi: 10.1046/j.1469-8137.2003.00687.x. [DOI] [PubMed] [Google Scholar]
- 38.Sinsabaugh RL, Gallo ME, Lauber C, Waldrop MP, Zak DR. 2005. Extracellular enzyme activities and soil organic matter dynamics for northern hardwood forests receiving simulated nitrogen deposition. Biogeochemistry 75:201–215. doi: 10.1007/s10533-004-7112-1. [DOI] [Google Scholar]
- 39.Rinkes ZL, Sinsabaugh RL, Moorhead DL, Grandy AS, Weintraub MN. 2013. Field and lab conditions alter microbial enzyme and biomass dynamics driving decomposition of the same leaf litter. Front Microbiol 4:260. doi: 10.3389/fmicb.2013.00260. [DOI] [PMC free article] [PubMed] [Google Scholar]
- 40.Blagodatskaya E, Blagodatsky S, Anderson TH, Kuzyakov Y. 2014. Microbial growth and carbon use efficiency in the rhizosphere and root-free soil. PLoS One 9:e93282. doi: 10.1371/journal.pone.0093282. [DOI] [PMC free article] [PubMed] [Google Scholar]
- 41.van Heeswijk WC, Westerhoff HV, Boogerd FC. 2013. Nitrogen assimilation in Escherichia coli: putting molecular data into a systems perspective. Microbiol Mol Biol Rev 77:628–695. doi: 10.1128/MMBR.00025-13. [DOI] [PMC free article] [PubMed] [Google Scholar]
- 42.Wang JL, Yan DL, Dixon R, Wang YP. 2016. Deciphering the principles of bacterial nitrogen dietary preferences: a strategy for nutrient containment. mBio 7:e00792-. doi: 10.1128/mBio.00792-16. [DOI] [PMC free article] [PubMed] [Google Scholar]
- 43.Amon J, Titgemeyer F, Burkovski A. 2010. Common patterns - unique features: nitrogen metabolism and regulation in Gram-positive bacteria. FEMS Microbiol Rev 34:588–605. doi: 10.1111/j.1574-6976.2010.00216.x. [DOI] [PubMed] [Google Scholar]
- 44.Westerhoff HV, Plomp PJAM, Groen AK, Wanders RJA. 1987. Thermodynamics of the control of metabolism. Cell Biophys 11:239–267. doi: 10.1007/BF02797123. [DOI] [PubMed] [Google Scholar]
- 45.Cornish-Bowden A, Cardenas ML. 2005. Systems biology may work when we learn to understand the parts in terms of the whole. Biochem Soc Trans 33:516–519. doi: 10.1042/BST0330516. [DOI] [PubMed] [Google Scholar]
- 46.Boogerd FC, Bruggeman FJ, Richardson RC, Stephan A, Westerhoff HV. 2005. Emergence and its place in nature: a case study of biochemical networks. Synthese 145:131–164. doi: 10.1007/s11229-004-4421-9. [DOI] [Google Scholar]
- 47.Abram F. 2015. Systems-based approaches to unravel multi-species microbial community functioning. Comput Struct Biotechnol J 13:24–32. doi: 10.1016/j.csbj.2014.11.009. [DOI] [PMC free article] [PubMed] [Google Scholar]
- 48.Austin AT, Yahdjian L, Stark JM, Belnap J, Porporato A, Norton U, Ravetta DA, Schaeffer SM. 2004. Water pulses and biogeochemical cycles in arid and semiarid ecosystems. Oecologia 141:221–235. doi: 10.1007/s00442-004-1519-1. [DOI] [PubMed] [Google Scholar]
- 49.Unger S, Maguas C, Pereira JS, David TS, Werner C. 2010. The influence of precipitation pulses on soil respiration–assessing the “Birch effect” by stable carbon isotopes. Soil Biol Biochem 42:1800–1810. doi: 10.1016/j.soilbio.2010.06.019. [DOI] [Google Scholar]
- 50.Yan GY, Xing YJ, Xu LJ, Wang JY, Meng W, Wang QG, Yu JH, Zhang Z, Wang ZD, Jiang SL, Liu BQ, Han SJ. 2016. Nitrogen deposition may enhance soil carbon storage via change of soil respiration dynamic during a spring freeze-thaw cycle period. Sci Rep 6:29134. doi: 10.1038/srep29134. [DOI] [PMC free article] [PubMed] [Google Scholar]
- 51.Gilbert JA, Field D, Huang Y, Edwards R, Li WZ, Gilna P, Joint I. 2008. Detection of large numbers of novel sequences in the metatranscriptomes of complex marine microbial communities. PLoS One 3:e3042. doi: 10.1371/journal.pone.0003042. [DOI] [PMC free article] [PubMed] [Google Scholar]
- 52.de Menezes A, Clipson N, Doyle E. 2012. Comparative metatranscriptomics reveals widespread community responses during phenanthrene degradation in soil. Environ Microbiol 14:2577–2588. doi: 10.1111/j.1462-2920.2012.02781.x. [DOI] [PubMed] [Google Scholar]
- 53.Satinsky BM, Smith CB, Sharma S, Landa M, Medeiros PM, Coles VJ, Yager PL, Crump BC, Moran MA. 2017. Expression patterns of elemental cycling genes in the Amazon River Plume. ISME J 11:1852–1864. doi: 10.1038/ismej.2017.46. [DOI] [PMC free article] [PubMed] [Google Scholar]
- 54.Nelson MB, Martiny AC, Martiny JBH. 2016. Global biogeography of microbial nitrogen-cycling traits in soil. Proc Natl Acad Sci U S A 113:8033–8040. doi: 10.1073/pnas.1601070113. [DOI] [PMC free article] [PubMed] [Google Scholar]
- 55.Zhao MX, Xue K, Wang F, Liu SS, Bai SJ, Sun B, Zhou JZ, Yang YF. 2014. Microbial mediation of biogeochemical cycles revealed by simulation of global changes with soil transplant and cropping. ISME J 8:2045–2055. doi: 10.1038/ismej.2014.46. [DOI] [PMC free article] [PubMed] [Google Scholar]
- 56.Tu QC, He ZL, Wu LY, Xue K, Xie G, Chain P, Reich PB, Hobbie SE, Zhou JZ. 2017. Metagenomic reconstruction of nitrogen cycling pathways in a CO2-enriched grassland ecosystem. Soil Biol Biochem 106:99–108. doi: 10.1016/j.soilbio.2016.12.017. [DOI] [Google Scholar]
- 57.Hawley AK, Nobu MK, Wright JJ, Durno WE, Morgan-Lang C, Sage B, Schwientek P, Swan BK, Rinke C, Torres-Beltran M, Mewis K, Liu WT, Stepanauskas R, Woyke T, Hallam SJ. 2017. Diverse Marinimicrobia bacteria may mediate coupled biogeochemical cycles along eco-thermodynamic gradients. Nat Commun 8:1507. doi: 10.1038/s41467-017-01376-9. [DOI] [PMC free article] [PubMed] [Google Scholar]
- 58.Graham EB, Knelman JE, Schindlbacher A, Siciliano S, Breulmann M, Yannarell A, Bemans JM, Abell G, Philippot L, Prosser J, Foulquier A, Yuste JC, Glanville HC, Jones DL, Angel F, Salminen J, Newton RJ, Burgmann H, Ingram LJ, Hamer U, Siljanen HMP, Peltoniemi K, Potthast K, Baneras L, Hartmann M, Banerjee S, Yu RQ, Nogaro G, Richter A, Koranda M, Castle SC, Goberna M, Song B, Chatterjee A, Nunes OC, Lopes AR, Cao YP, Kaisermann A, Hallin S, Strickland MS, Garcia-Pausas J, Barba J, Kang H, Isobe K, Papaspyrou S, Pastorelli R, Lagomarsino A, Lindstrom ES, Basiliko N, Nemergut DR. 2016. Microbes as engines of ecosystem function: when does community structure enhance predictions of ecosystem processes? Front Microbiol 7:214. doi: 10.3389/fmicb.2016.00214. [DOI] [PMC free article] [PubMed] [Google Scholar]
- 59.Prosser JI. 2015. Dispersing misconceptions and identifying opportunities for the use of “omics” in soil microbial ecology. Nat Rev Microbiol 13:439–446. doi: 10.1038/nrmicro3468. [DOI] [PubMed] [Google Scholar]
- 60.Coles VJ, Stukel MR, Brooks MT, Burd A, Crump BC, Moran MA, Paul JH, Satinsky BM, Yager PL, Zielinski BL, Hood RR. 2017. Ocean biogeochemistry modeled with emergent trait-based genomics. Science 358:1149–1154. doi: 10.1126/science.aan5712. [DOI] [PubMed] [Google Scholar]
- 61.Louca S, Hawley AK, Katsev S, Torres-Beltran M, Bhatia MP, Kheirandish S, Michiels CC, Capelle D, Lavik G, Doebeli M, Crowe SA, Hallam SJ. 2016. Integrating biogeochemistry with multiomic sequence information in a model oxygen minimum zone. Proc Natl Acad Sci U S A 113:E5925–E5933. doi: 10.1073/pnas.1602897113. [DOI] [PMC free article] [PubMed] [Google Scholar]
- 62.Mock T, Daines SJ, Geider R, Collins S, Metodiev M, Millar AJ, Moulton V, Lenton TM. 2016. Bridging the gap between omics and earth system science to better understand how environmental change impacts marine microbes. Glob Chang Biol 22:61–75. doi: 10.1111/gcb.12983. [DOI] [PMC free article] [PubMed] [Google Scholar]
- 63.Mackelprang R, Saleska SR, Jacobsen CS, Jansson JK, Tas N. 2016. Permafrost meta-omics and climate change. Annu Rev Earth Planet Sci 44:439–462. doi: 10.1146/annurev-earth-060614-105126. [DOI] [Google Scholar]
- 64.McCarthy HR, Oren R, Johnsen KH, Gallet-Budynek A, Pritchard SG, Cook CW, LaDeau SL, Jackson RB, Finzi AC. 2010. Re-assessment of plant carbon dynamics at the Duke free-air CO2 enrichment site: interactions of atmospheric [CO2] with nitrogen and water availability over stand development. New Phytol 185:514–528. doi: 10.1111/j.1469-8137.2009.03078.x. [DOI] [PubMed] [Google Scholar]
- 65.Meyer F, Paarmann D, D'Souza M, Olson R, Glass EM, Kubal M, Paczian T, Rodriguez A, Stevens R, Wilke A, Wilkening J, Edwards RA. 2008. The metagenomics RAST server - a public resource for the automatic phylogenetic and functional analysis of metagenomes. BMC Bioinformatics 9:386. doi: 10.1186/1471-2105-9-386. [DOI] [PMC free article] [PubMed] [Google Scholar]
- 66.O'Leary NA, Wright MW, Brister JR, Ciufo S, Haddad D, McVeigh R, Rajput B, Robbertse B, Smith-White B, Ako-Adjei D, Astashyn A, Badretdin A, Bao Y, Blinkova O, Brover V, Chetvernin V, Choi J, Cox E, Ermolaeva O, Farrell CM, Goldfarb T, Gupta T, Haft D, Hatcher E, Hlavina W, Joardar VS, Kodali VK, Li W, Maglott D, Masterson P, McGarvey KM, Murphy MR, O'Neill K, Pujar S, Rangwala SH, Rausch D, Riddick LD, Schoch C, Shkeda A, Storz SS, Sun H, Thibaud-Nissen F, Tolstoy I, Tully RE, Vatsan AR, Wallin C, Webb D, Wu W, Landrum MJ, Kimchi A, et al. 2016. Reference sequence (RefSeq) database at NCBI: current status, taxonomic expansion, and functional annotation. Nucleic Acids Res 44:D733–D745. doi: 10.1093/nar/gkv1189. [DOI] [PMC free article] [PubMed] [Google Scholar]
- 67.Kanehisa M, Sato Y, Kawashima M, Furumichi M, Tanabe M. 2016. KEGG as a reference resource for gene and protein annotation. Nucleic Acids Res 44:D457–D462. doi: 10.1093/nar/gkv1070. [DOI] [PMC free article] [PubMed] [Google Scholar]
- 68.Zhang J, Kobert K, Flouri T, Stamatakis A. 2014. PEAR: a fast and accurate Illumina Paired-End reAd mergeR. Bioinformatics 30:614–620. doi: 10.1093/bioinformatics/btt593. [DOI] [PMC free article] [PubMed] [Google Scholar]
- 69.Aronesty E. 2011. ea-utils: command-line tools for processing biological sequencing data. https://github.com/ExpressionAnalysis/ea-utils.
- 70.Kim D, Hahn AS, Wu SJ, Hanson NW, Konwar KM, Hallam SJ. 2015. FragGeneScan-Plus for scalable high-throughput short-read open reading frame prediction. 2015 IEEE Conference on Computational Intelligence in Bioinformatics and Computational Biology, Niagara Falls, ON, Canada, 12 to 15 August 2015. doi: 10.1109/CIBCB.2015.7300341. [DOI] [Google Scholar]
- 71.Eddy SR. 1998. Profile hidden Markov models. Bioinformatics 14:755–763. doi: 10.1093/bioinformatics/14.9.755. [DOI] [PubMed] [Google Scholar]
- 72.Eddy SR. 2011. Accelerated profile HMM searches. PLoS Comput Biol 7:e1002195. doi: 10.1371/journal.pcbi.1002195. [DOI] [PMC free article] [PubMed] [Google Scholar]
- 73.Finn RD, Coggill P, Eberhardt RY, Eddy SR, Mistry J, Mitchell AL, Potter SC, Punta M, Qureshi M, Sangrador-Vegas A, Salazar GA, Tate J, Bateman A. 2016. The Pfam protein families database: towards a more sustainable future. Nucleic Acids Res 44:D279–D285. doi: 10.1093/nar/gkv1344. [DOI] [PMC free article] [PubMed] [Google Scholar]
- 74.Yin YB, Mao XZ, Yang JC, Chen X, Mao FL, Xu Y. 2012. dbCAN: a web resource for automated carbohydrate-active enzyme annotation. Nucleic Acids Res 40:W445–W451. doi: 10.1093/nar/gks479. [DOI] [PMC free article] [PubMed] [Google Scholar]
- 75.Oksanen J, Blanchet FG, Friendly M, Kindt R, Legendre P, McGlinn D, Minchin PR, O'Hara RB, Simpson GL, Solymos P, Henry M, Stevens H, Szoecs E, Wagner H. 2017. vegan: community ecology package. R package version 2.4-4. https://CRAN.R-project.org/package=vegan.
- 76.Team RC. 2013. R: a language and environment for statistical computing. R Foundation for Statistical Computing, Vienna, Austria: http://www.R-project.org/. [Google Scholar]
- 77.Li D, Liu CM, Luo R, Sadakane K, Lam TW. 2015. MEGAHIT: an ultra-fast single-node solution for large and complex metagenomics assembly via succinct de Bruijn graph. Bioinformatics 31:1674–1676. doi: 10.1093/bioinformatics/btv033. [DOI] [PubMed] [Google Scholar]
- 78.Mikheenko A, Saveliev V, Gurevich A. 2016. MetaQUAST: evaluation of metagenome assemblies. Bioinformatics 32:1088–1090. doi: 10.1093/bioinformatics/btv697. [DOI] [PubMed] [Google Scholar]
- 79.Bray NL, Pimentel H, Melsted P, Pachter L. 2016. Near-optimal probabilistic RNA-seq quantification. Nat Biotechnol 34:525–527. doi: 10.1038/nbt.3519. [DOI] [PubMed] [Google Scholar]
- 80.Pimentel H, Bray NL, Puente S, Melsted P, Pachter L. 2017. Differential analysis of RNA-seq incorporating quantification uncertainty. Nat Methods 14:687–690. doi: 10.1038/nmeth.4324. [DOI] [PubMed] [Google Scholar]
- 81.Buchfink B, Xie C, Huson DH. 2015. Fast and sensitive protein alignment using DIAMOND. Nat Methods 12:59–60. doi: 10.1038/nmeth.3176. [DOI] [PubMed] [Google Scholar]
- 82.Huson DH, Beier S, Flade I, Gorska A, El-Hadidi M, Mitra S, Ruscheweyh HJ, Tappu R. 2016. MEGAN community edition - interactive exploration and analysis of large-scale microbiome sequencing data. PLoS Comput Biol 12:e1004957. doi: 10.1371/journal.pcbi.1004957. [DOI] [PMC free article] [PubMed] [Google Scholar]
- 83.Overbeek R, Olson R, Pusch GD, Olsen GJ, Davis JJ, Disz T, Edwards RA, Gerdes S, Parrello B, Shukla M, Vonstein V, Wattam AR, Xia FF, Stevens R. 2014. The SEED and the Rapid Annotation of microbial genomes using Subsystems Technology (RAST). Nucleic Acids Res 42:D206–D214. doi: 10.1093/nar/gkt1226. [DOI] [PMC free article] [PubMed] [Google Scholar]
Associated Data
This section collects any data citations, data availability statements, or supplementary materials included in this article.
Supplementary Materials
Data Availability Statement
The metatranscriptomic and metagenomic sequence data generated that support the findings of this study are available through the MG-RAST server (mgp82200; http://metagenomics.anl.gov/mgmain.html?mgpage=project&project=mgp82200). All other relevant data are available from the corresponding author on request.