SUMMARY
Arteries and veins are specified by antagonistic transcriptional programs. However, during development and regeneration, new arteries can arise from pre-existing veins through a poorly understood cell fate conversion. Using scRNA-Seq and mouse genetics, we discovered that vein cells of the developing heart undergo an early cell fate switch to create a pre-artery population that subsequently builds coronary arteries. Vein cells underwent a gradual and simultaneous switch from venous to arterial fate before a subset of cells crossed a transcriptional threshold into the pre-artery state. Prior to coronary blood flow, pre-artery cells appeared within the immature vessel plexus, expressed mature artery markers, and decreased cell cycling. The vein specifying transcription factor, Coup-tf2, blocked plexus cells from overcoming the pre-artery threshold through inducing cell cycle genes. Thus, vein-derived coronary arteries are built by pre-artery cells that can differentiate independent of blood flow upon the release of COUP-TF2/cell cycle factor-mediated inhibition.
INTRODUCTION
The ability of cells to switch fates and acquire new identities is critical for organogenesis and regeneration, but the mechanisms underlying cell fate conversions are poorly understood. The vasculature is a model for this process because it initially differentiates into arteries and veins whose transcriptional networks antagonize each other (NOTCH maintains arteries while COUP-TF2 maintains veins 1,2). However, during development and regeneration, veins can become the source of new arteries 3–6. The timing and requirements of vein-to-artery conversions are not known, but could inform artery regeneration.
In mice, a portion of the coronary arteries of the heart develop from a vein called the sinus venosus (SV)(Fig. 1a). During embryogenesis, endothelial cell-lined angiogenic sprouts migrate from the SV to fill the heart with an immature coronary vessel plexus 4. This plexus unites with plexus vessels from the endocardium 4,7,8, and, together, they remodel into arteries, capillaries and veins. The plexus lacks blood flow until attaching to the aorta, and arterial morphogenesis requires this event, suggesting that blood flow initiates artery development 8–11. However, delineating cell fate changes during coronary angiogenesis have been challenging due to limited molecular markers and bulk transcriptional analyses of heterogeneous populations.
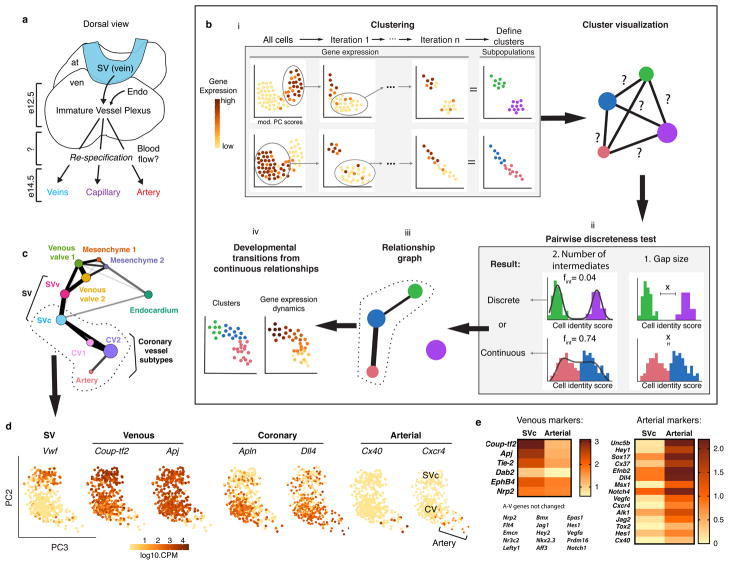
Figure 1. Identifying pre-artery cells using scRNA-Seq.
Schematics of coronary artery development (a) and computational pipeline (b). (c) Relationship graph for ApjCreER-traced endothelial subtypes. (d) Pre-artery cells extend from the plexus in the SVc-coronary vessel (CV) continuum. Gene expression in brown. N=415 cells. (e) Heat map of venous and arterial genes. At, atria; SVv, Endo, endocardium; sinus venosus-valve; SVc, sinus venosus-coronary progenitors; SV, sinus venosus; ven, ventricle.
Single-cell RNA sequencing (scRNA-Seq) can overcome this limitation by producing single cell resolution maps of developmental transitions. Here, we developed a statistical test that categorizes subpopulations within scRNA-Seq datasets as continuous or discrete to identify candidate developmental transitions. Analyzing the SV-to-coronary transition computationally and in vivo revealed that SV cells of the mouse heart undergo a gradual conversion from vein to artery before a subset crosses a threshold to differentiate into pre-artery cells. Pre-artery cells differentiated prior to blood flow from the SV and endocardium and produced a large portion of coronary arteries. COUP-TF2 blocked progression to the pre-artery state through activation of cell cycle genes, which ultimately inhibited artery development. Understanding this and other cell fate switches and inhibitory signals advances our knowledge of tissue development and could improve regenerative medicine.
RESULTS
Finding developmental transitions in scRNA-Seq data
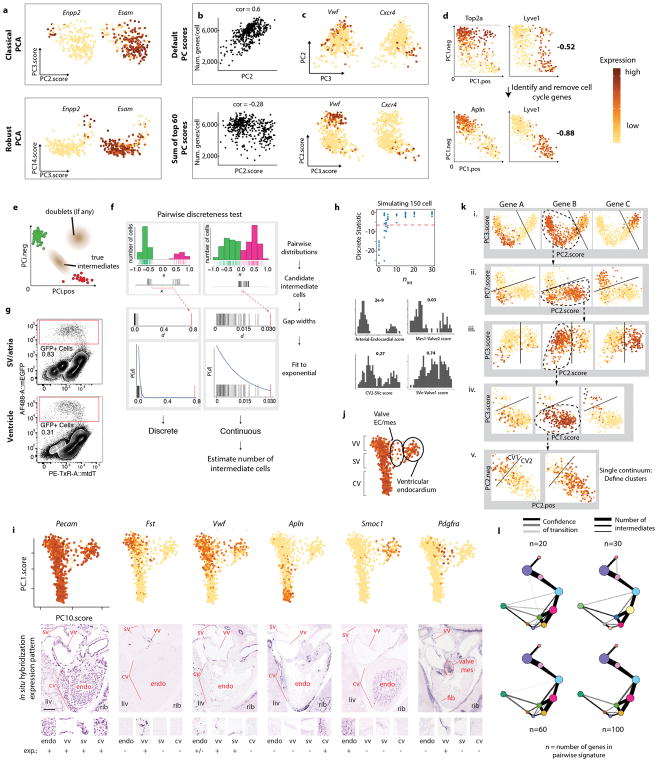
We performed a two-step analysis that identified and clustered cell subtypes by iterative robust PCA (rPCA), and then subjected clusters to a Pairwise Discreteness Test (Fig. 1b). First, cell subtype clusters were manually defined based on unique gene expression patterns and cell separation in multiple iterations of rPCA (Fig. 1bi) 12. rPCA was better than classical PCA at separating small subpopulations of cells (Extended Data Fig. 1a) 13. We also replaced default PC scores with a sum of the top 60 genes score because it is less correlated with technical artifact and better correlated with cluster-specific genes (Extended Data Fig. 1b and c). Cell cycle heterogeneity was also removed (Extended Data Fig. 1d), and plots were inspected to confirm the absence of doublets (Extended Data Fig. 1e). This results in cell clusters that correlate well with genes that define cell identity, and not cell cycle heterogeneity or technical artifact (Extended Data Fig. 1c and d).
Second, we developed the Pairwise Discreteness Test to determine whether clusters are discrete or continuous, i.e. connected by intermediate or transitioning cells. This statistical test projects pairs of subpopulations onto a linear axis of cell identity, measures the size of the gap between the populations, and estimates the number of intermediate cells (Fig 1bii and Extended Data Fig. 1f). It also determines the strength of continuity (Extended Data Fig. 1h), and could be confirmed using simulated data (Extended Data Fig. 1h). Combining the results creates a relationship graph (Fig. 1biii), which can identify candidate developmental transitions. Then, cell fate changes can be analyzed in high resolution by observing gene expression changes across continuous populations (Fig. 1biv).
We used this pipeline to analyze 757 ApjCreER lineage labeled (Cre expressed in SV) cardiac endothelial cells from e12.5 hearts (Extended Data Fig. 1g). Our dataset contained endothelial cells of the SV, SV-derived coronary vessels, venous valves, valve mesenchyme, and some ventricular endocardial cells (Extended Data Fig. 1i and j). Clustering and the Pairwise Discreteness Test revealed a continuum between coronary vessel subtypes, the SV, venous valves, ventricular endocardium, and mesenchyme (Pdgfra+, Pecamlow/−)(Fig 1c and Extended Data Fig. 1i, j, and k). These associations are consistent with anatomical relationships (SV is adjacent to venous valves and endocardium) and previous lineage tracing experiments (SV transitions into coronary vessels and endocardium transitions into mesenchyme) 8,11,14–17. Thus, our pipeline can identify subpopulations and recapitulate known developmental transitions and anatomical relationships.
Pre-artery cells differentiate prior to blood flow
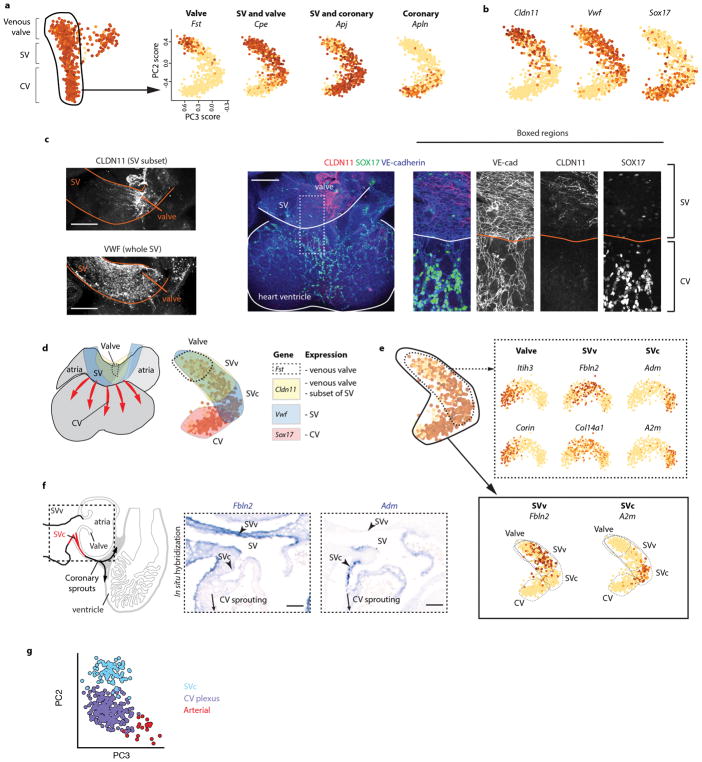
We analyzed the developmental transition linking SV coronary progenitors (SVc) and coronary vessels (Fig. 1c, dotted line). Only the SVc was included because clustering indicated that the SV had two domains (Fig. 1c), which was confirmed using immunofluorescence and in situ hybridization (Extended Data Fig. 2a–f). The SVc was anatomically and transcriptionally continuous with coronary vessels, while the SVv was continuous with venous valves (Fig. 1c, Extended Data Fig. 2d and f). Therefore, rPCA of the SVc and coronary vessels was performed to study the SVc to coronary continuum (Fig. 1d).
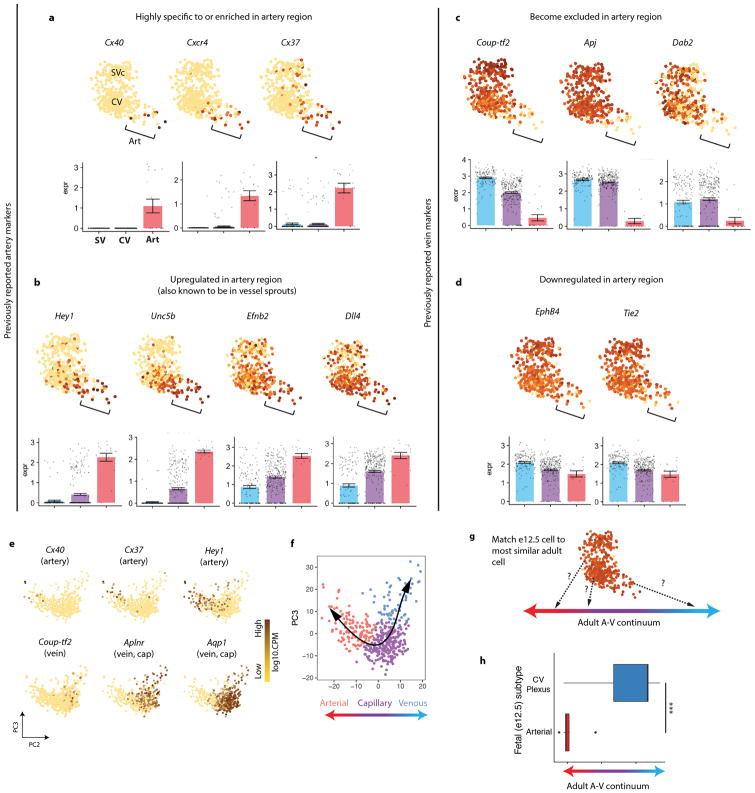
Unexpectedly, the SVc-coronary vessel continuum identified cells that were transcriptionally distinct and expressed mature arterial genes (Fig. 1d). We previously reported that plexus cells turn on arterial genes, such as Dll4 and Efnb2 4, but these are also expressed in angiogenic vessels, and are not artery specific 18,19. The scRNA-Seq analysis revealed that, within the Dll4+ domain, some cells had initiated a distinctive transcriptional program, shifting away in the rPCA plot (Fig. 1d). Cells within this subset specifically expressed mature artery-specific genes, including Cx40 (Fig. 1d). Analyzing multiple arterial and venous genes in single cells or as averages within clusters (defined in Extended Data Fig. 2g) revealed that many artery genes were either specific or significantly increased in the Cx40+ population (Fig. 1d and Extended Data Fig. 3a and b). Multiple venous genes were either completely depleted or significantly down regulated (Fig. 1d and Extended Data Fig. 3c and d). Comparing expression between the SV and arterial populations revealed an extensive switch towards arterial fate (Fig. 1e).
E12.5 arterial cells were then compared to adult coronary vessels. Each embryonic cell was matched to the adult cell to which it was most similar within the artery-capillary-vein continuum formed by adult coronaries (Extended Data Fig. 3e–g) 20. E12.5 artery cells were most similar to adult arterial cells, while CV plexus cells were most similar to adult capillaries and veins (Extended Data Fig. 3h). We also found that e12.5 and adult artery populations were enriched for nearly the same artery markers (Supplementary Table 1). The exception was Notch1 (only enriched in adults), possibly because blood flow upregulates Notch1 21, and e12.5 is prior to coronary perfusion. Thus, a subpopulation of plexus cells undergo a transcriptional shift to resemble mature arteries, prior to the presence of arterial vessels or blood flow, prompting us to term them “pre-artery cells”.
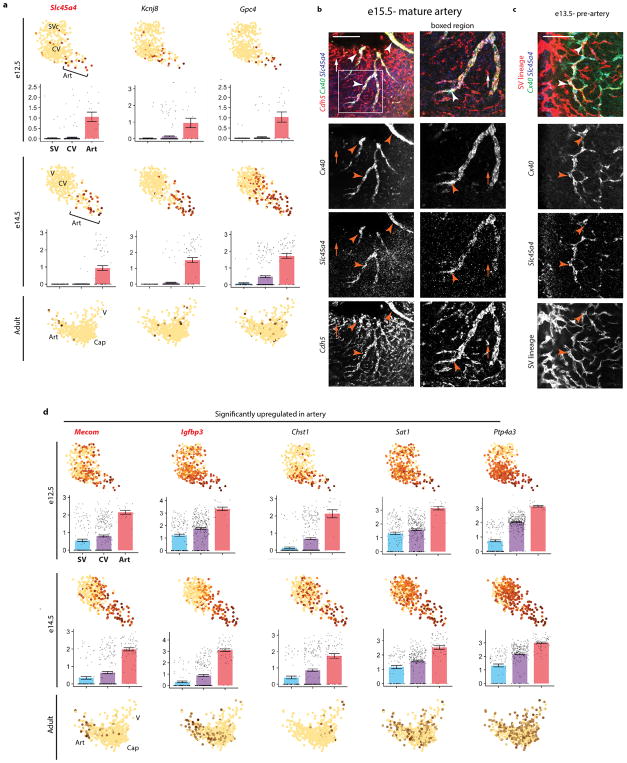
The scRNA-Seq also identified new arterial genes (Extended Fig. 4a). The pre-artery specific gene, Slc45a4, marked mature embryonic arteries (Extended Data Fig. 4b and c) and was enriched in adult coronary artery cells (Extended Data Fig. 4a). We found other genes to be enriched in artery cells (Extended Data Fig. 4d). Of these, Mecom and Igfbp3 marked arteries in adults (Extended Data Fig. 4d).
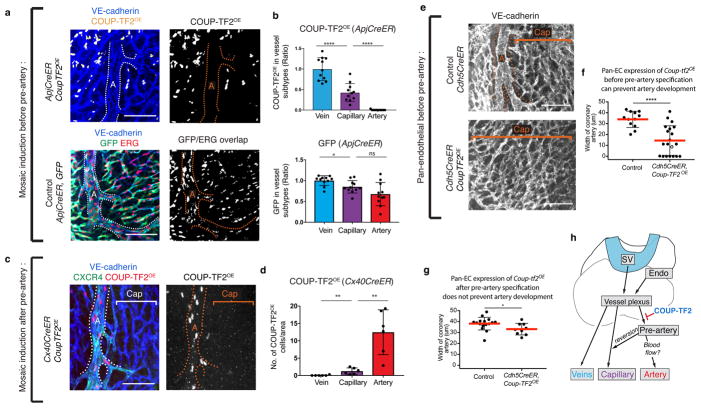
Figure 4. COUP-TF2 specifically blocks pre-artery specification.
(a and b) e15.5 hearts induced to express Coup-tf2OE or Gfp before pre-artery specification. (c and d) e15.5 hearts induced to express Coup-tf2OE after pre-artery specification. b, Coup-tf2OE, n=11 hearts; Gfp, n=11 hearts. d, N=6 hearts. (e and f) Coup-tf2OE induction in all endothelial cells before pre-artery specification. Control, n=12 hearts; Coup-tf2OE, n=20 hearts. (g) Coup-tf2OE induction in all endothelial cells after pre-artery specification. Control, n=16 hearts; Coup-tf2OE, n=9 hearts. (h) Schematic displaying differentiation step blocked by COUP-TF2. A, artery; Cap, capillary; Endo, endocardium. Scale bars: 100 μm. Graphs: centre is mean, error bars are st dev. P value: unpaired two-tailed t test. ns, p>0.05. *, p≤ 0.05. **, p≤0.01. ****, p≤0.0001.
Location, origins, and fate of pre-artery cells
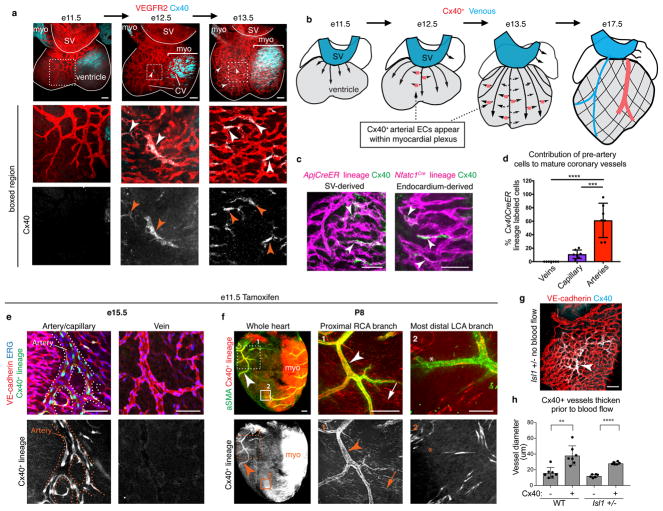
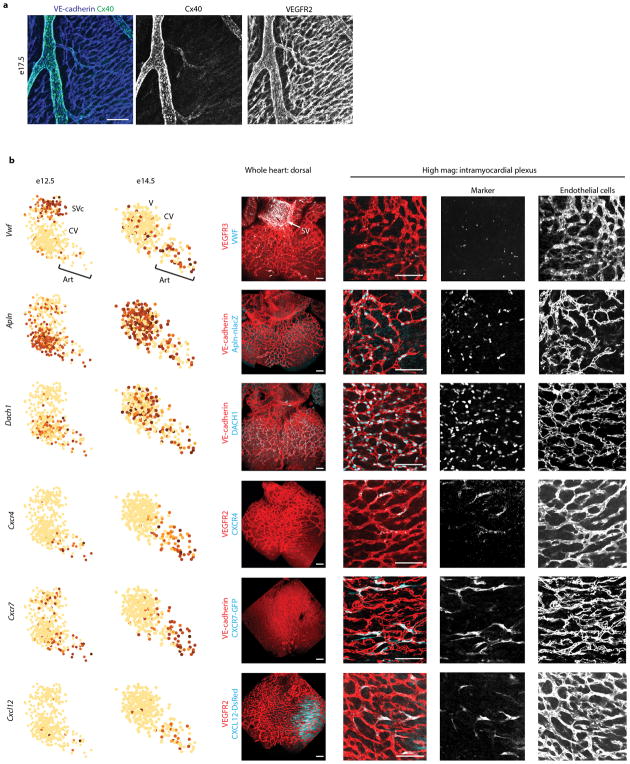
In late embryonic stages (e17.5), Cx40 is specific to mature arteries (Extended Data Fig. 5a). In contrast, whole mount immunostaining at early stages revealed that a small population of Cx40+ cells first appeared at e12.5. They were interspersed within the intramyocardial plexus and expanded by e13.5 (Fig. 2a and b). Localization of additional pre-artery genes confirmed this result (Extended Data Fig. 5b). The absence of Cx40+ cells in the SV and their presence in the CV plexus agreed with clustering and pairwise analysis showing that pre-artery cells were continuous only with the CV plexus (Fig 1c). Defining clusters using Seurat showed similar results (Extended Data Fig. 6a), although clusters were not as precise and were associated with cell cycle genes (Extended Data Fig. 6b and c). Thus, coronary angiogenesis involves specification of single arterial endothelial cells within the intramyocardial plexus (Fig 1b).
Figure 2. Pre-artery cells build coronary arteries.
(a) Cx40 immunofluorescence in hearts to mark pre-artery cells (arrowheads). (b) Schematic of pre-artery cells during coronary development. (c) Cx40+ cells in sinus venosus (SV)- and endocardium-derived plexus. (d) Cx40CreER lineage labeling (e11.5 induction). N=7 hearts. (e and f) Pre-artery lineage labeling in arteries (arrowheads) and a subset of capillaries (arrows) at e15.5 (e) and P8 (f). (g) Cx40+ cells (arrowheads) in hearts that lack coronary blood flow. (h) Cx40+ vessels begin remodeling without blood flow. WT, n=7 hearts. Isl1 +/−, n=6 hearts. In d and h: error bars, st dev. LCA, left coronary artery; myo, myocardium; RCA, right coronary artery. Scale bars: d, 50 μm; a, g, h, and i, 100 μm. Graphs: centre is mean. P value: unpaired two-tailed t test. **, p≤0.01. ***, p≤0.001. ****, p≤0.0001.
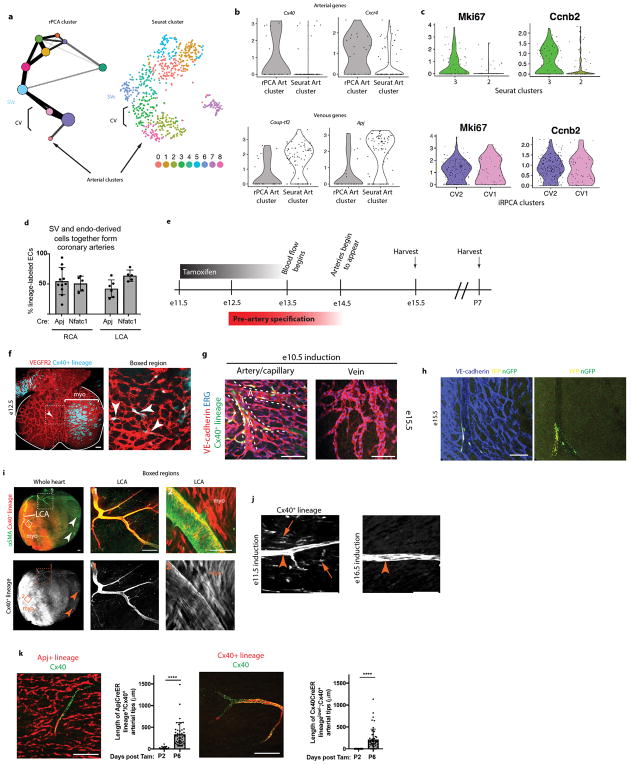
Although our scRNAseq investigated only SV-derived vessels, lineage tracing revealed that coronary arteries are derived from both the SV and endocardium (Extended Data Fig. 6d) 22. Single Cx40+ cells were detected in the plexus from both sources (Fig. 2c), indicating that pre-artery specification occurs during both SV and endocardium angiogenesis.
Cx40CreER, RosatdTomato embryos were used to lineage trace pre-artery cells (Tamoxifen, e11.5)(Extended Data Fig. 6e and f). Cx40+ pre-artery cells were later found in arteries, but not veins (Fig. 2d and e). A few capillaries were lineage traced, indicating that pre-artery cells could revert to a capillary fate (Fig. 2d). E10.5 dosing ensured our result was not due to persistent Tamoxifen (Extended Data Fig. 6g), and clonal level labeling confirmed the lineage data (Extended Data Fig. 6h). Remarkably, at postnatal day (P)8, right and left coronary artery branches were heavily lineage labeled in hearts dosed at e11.5; only the most distal tips were unlabeled (Fig. 2f and Extended Data Fig. 6i). Thus, pre-artery cells build a large portion of mature coronary arteries.
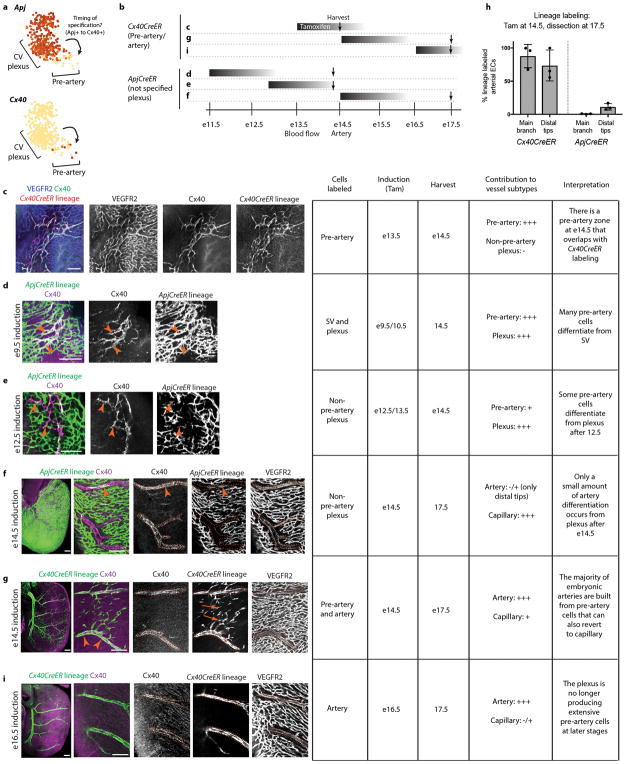
Pre-artery cells first appeared before blood flow, but they were abundant in the plexus through e14.5 (Extended Data Fig. 7c), suggesting that specification could continue after coronary perfusion. To investigate this, we utilized Cre lines that specifically label either CV plexus (ApjCreER) or pre-artery (Cx40CreER)(Extended Data Fig. 7a) and induced labeling at various times (Extended Data Fig. 7b). Labeling CV plexus at e12.5/e13.5 lineage traced a small number of pre-artery cells (Extended Data Fig. 7d and e). However, when CV plexus was labeled at e14.5, there was no tracing into artery main branches and very little in tips (Extended Data Fig.7f and h). Conversely, e14.5 labeling with Cx40CreER lineage traced most left and right coronary artery branches (Extended Data Fig. 7g and h). Finally, dosing Cx40CreER at e16.5 resulted in few capillary cells being labeled at embryonic and postnatal stages (Extended Data Fig. 7i and Extended Data Fig. 6j). These data indicate that pre-artery specification occurs in the coronary plexus between e12.5–14.5, creating a progenitor pool that forms virtually all the embryonic left and right coronary artery branches.
We next investigated whether the artery tips not from pre-artery cells (Fig. 2f) arose from pre-existing arteries or through capillary differentiation. Inducing ApjCreER and Cx40CreER labeling at P2 revealed that artery tips at P6 were composed of ApjCreER lineage cells while depleted of Cx40CreER labeled cells (Extended Data Fig. 6k). Thus, postnatal artery tips grow by capillary arterialization.
The morphogenic changes that accompany coronary artery remodeling are seen after blood flow is established, and are thought to be triggered by shear stress 9,10. In Isl1 mutants that have delayed blood flow 23, pre-artery cells had congregated in the region where the coronary artery will eventually form (Fig. 2g) and began increasing lumen size (Fig. 2h). Therefore, pre-artery cells within the plexus can differentiate and initiate remodeling prior to cues from blood flow.
A gradual cell fate conversion precedes pre-artery
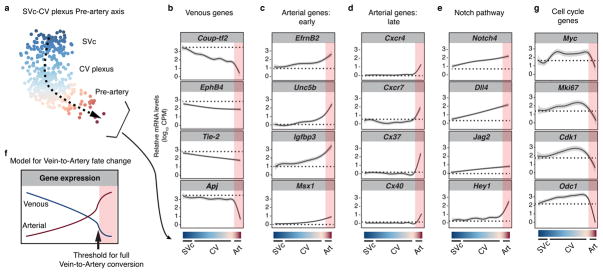
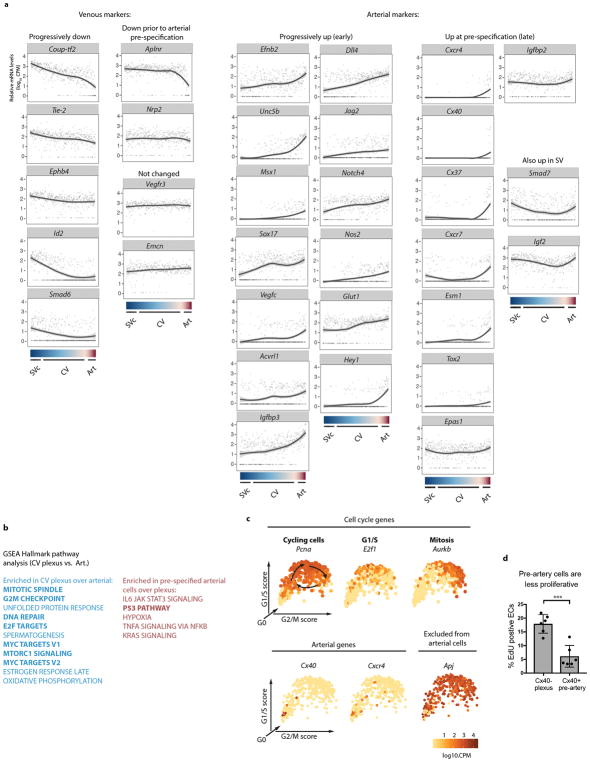
To investigate the vein-to-artery conversion, single cells along the SVc-CV plexus-Pre-artery developmental transition were projected onto a linear continuum (Fig. 3a and b). Gene expression was then visualized by LOESS regression (Fig. 3b–e, g and Extended Data Fig. 8a). There was a progressive decrease in venous identity as cells exited the SV and moved toward pre-artery (see Coup-tf2, EphB4, and Tie-2)(Fig. 3b). A sharp decrease in venous genes was seen in cells that had undergone full pre-artery specification (see Coup-tf2 and Apj)(Fig. 3b). Arterial gene expression was in two patterns: 1. “Early” genes that progressively increased in CV plexus and pre-artery cells (Fig. 3c and Extended Data Fig. 8a), and 2. “Late” genes that were low in CV plexus, but sharply increased in pre-artery cells (Fig. 3d and Extended Data Fig. 8a). NOTCH ligands and receptors were early genes with the exception of Hey1, which sharply increased in pre-artery cells (Fig. 3e and Extended Data Fig. 8a). This suggests that loss of venous identity is initially gradual with a progressive increase in arterial identity, and that pre-artery specification occurs after a threshold of venous loss and arterial gain is achieved (Fig. 3f).
Figure 3. The venous-to-arterial fate change is gradual and culminates in an expression threshold.
(a) Coronary differentiation pathway (dashed arrow). (b–e) Gene expression along the differentiation pathway. Dotted lines, SVc expression levels; red shading, pre-artery cells. (f) Model based on known marker gene patterns. (g) Cell cycle genes decreased in pre-artery cells. CV, coronary vessel; SVc, sinus venosus-coronary progenitors.
To understand the pre-artery threshold, pathway analysis using Gene Set Enrichment Analysis (GSEA) was performed 24. Most pathways enriched in plexus over arterial were associated with cell cycling (Extended Data Fig. 8b). Arterial cells are thought to leave the cell cycle in response to blood flow 25,26,27; however, pre-artery cells collected prior to blood flow displayed a decrease in cell cycle genes (Fig. 3g, Extended Data Fig. 8c, and Supplementary Table 2). In vivo, pre-artery cells were less proliferative than surrounding plexus (Extended Data Fig. 8d). Thus, decreased proliferation in arteries is acquired during pre-artery specification, and not specifically in response to blood flow.
COUP-TF2 blocks artery formation at pre-artery step
To investigate whether pre-artery specification was necessary for artery formation, we required a tool to block this process. We tested COUP-TF2 since it induces venous fate and antagonizes arterial fate 28,1 and was sharply decreased in pre-artery cells (see Fig. 1d and 3b). ApjCreER was crossed to a mouse that constitutively expresses Coup-tf2 after Cre recombination 29 (Extended Data Fig. 9a) and Tamoxifen dosed to induce Coup-tf2OE before pre-artery specification. Cre recombination of the Coup-tf2OE allele was low, making this experiment a mosaic analysis where Coup-tf2 overexpressing cells were followed within wild type tissue (Extended Data Fig. 9b and c).
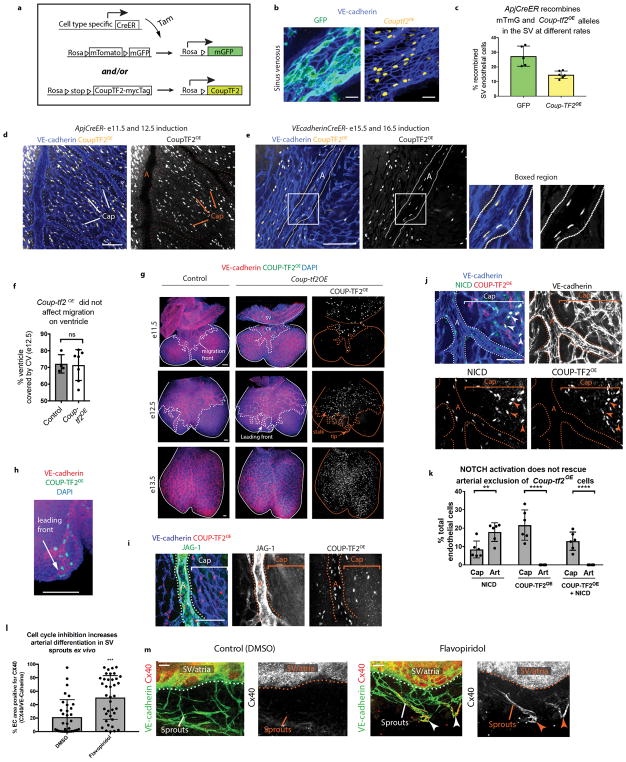
The result was that Coup-tf2OE cells were present in capillaries and veins, but not arteries (Fig. 4a and b, upper panels and Extended Data Fig. 9d). In contrast, control GFP+ cells were found in arteries, capillaries, and veins (Fig. 4a and b, lower panels). Coup-tf2OE cells could survive in arteries when VE-cadherin-CreER induced recombination after arteries had formed (Extended Data Fig. 9e). Coup-tf2OE cells could also migrate normally onto the heart (Extended Data Fig. 9f–h), although they caused a mild increase in vessel density at e13.5 (Extended Data Fig. 9g). Thus, forced COUP-TF2 expression before pre-artery specification blocks cells from contributing to coronary arteries, suggesting a failure to acquire pre-artery fate.
Inducing Coup-tf2OE expression after pre-artery specification with Cx40CreER (Tamoxifen e11.5/12.5) resulted in numerous Coup-tf2OE cells within the artery (Fig. 4c and d, and Extended Data Fig. 9i) that expressed the arterial markers CXCR4 and Jagged-1 (Fig. 4c and Extended Data Fig. 9i). Therefore, Coup-tf2OE inhibits arterial fate only prior to pre-artery specification. Pre-artery specification was then blocked throughout the entire coronary plexus by inducing widespread Coup-tf2OE recombination using Cdh5CreER (Tamoxifen at e11.5/e13.5). This resulted in small or completely absent coronary arteries (Fig. 4e and f). In contrast, inducing Cdh5CreER; Coup-tf2OE after pre-artery specification, but before arterial morphogenesis (Tamoxifen e13.5/e15.5), resulted in relatively normal artery development, confirming that the later steps in artery formation are not dramatically inhibited by COUP-TF2 (Fig. 4g). Thus, pre-artery specification is required for artery development, and this is the specific differentiation step antagonized by COUP-TF2 (Fig. 4h).
COUP-TF2 inhibits pre-artery via cell cycle genes
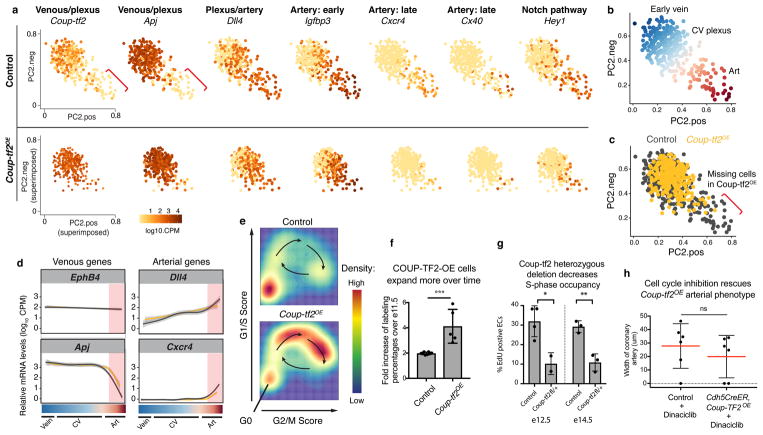
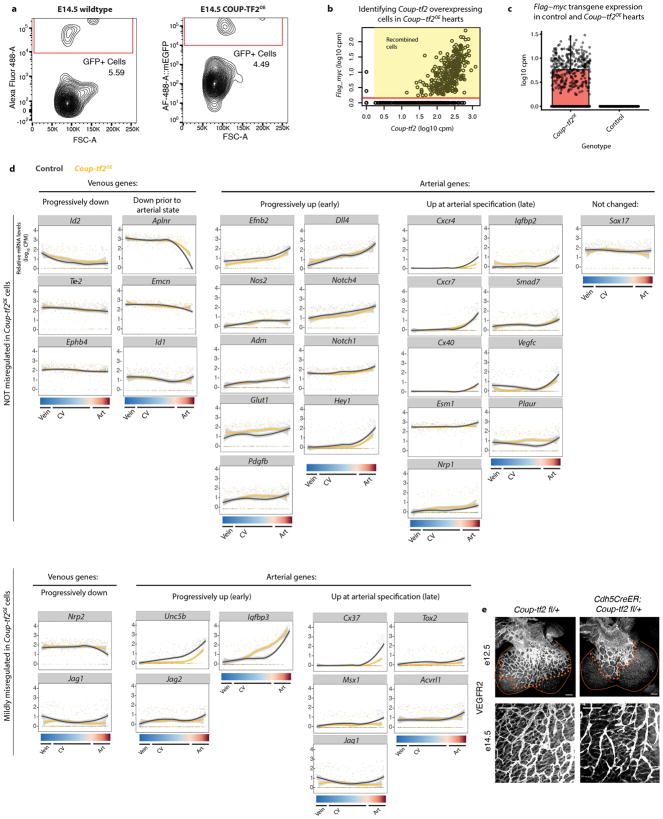
We next used scRNA-Seq to compare control and Coup-tf2OE cells. E14.5 coronary endothelial cells (Extended Data Fig. 10a) were analyzed as described for e12.5. Coup-tf2OE cells were identified by the expression of the transgene’s flag/myc tag (Extended Data Fig. 10b and c). RPCA revealed a transcriptional continuum linking venous, CV plexus, and arterial cells (Fig. 5a and b). Vein cells in this dataset expressed Coup-tf2 and Apj and lacked Dll4 and Notch4, the published pattern for coronary veins 4,30. Superimposing transgenic cells onto the control continuum showed that Coup-tf2OE cells were only excluded from the arterial population (Fig. 5c). Venous and arterial genes along the continuum were not generally inhibited by Coup-tf2OE (Fig. 5a, d, and Extended Data Fig. 10d). The defect instead was in the number of fully pre-artery/arterial cells, as shown with genes such as Cxcr4 and Cx40 (Fig. 5a).
Figure 5. COUP-TF2 inhibits artery specification through cell cycle genes.
(a) rPCA plots from e14.5 hearts (WT, n=347 cells; Coup-tf2OE, n=321 cells). Red brackets, artery cells devoid of Coup-tf2 and Apj. (b) Coronary continuum based on gene expression patterns in a. N=347 cells. (c) Coup-tf2OE cells do not populate the Coup-tf2−Apj− artery population. WT, n=347 cells; Coup-tf2OE, n=321 cells. (d) Progression towards artery is not generally affected by Coup-tf2OE. WT, gray lines; Coup-tf2OE, yellow lines. Red-shaded region: pre-artery cells. (e) Percentage of CV plexus cells in the indicated cell cycle phases. (f) Fold increase of control GFP or COUP-TF2OE cells between e11.5 and e14.5. Control, n=8 hearts; Coup-tf2OE, n=5 hearts. (g) EdU incorporation in coronary endothelial cells from Cdh5CreER; Coup-tf2 fl/+ hearts. E12.5: control, n=4 hearts; Coup-tf2 fl/+, n=2 hearts. E14.5: control, n=3 hearts; Coup-tf2 fl/+, n=3 hearts. (h) Cell cycle inhibition reverses the ability of Coup-tf2OE to block artery formation, compare to Fig. 4f. Control, n=6 hearts; Coup-tf2OE, n=6 hearts. p=0.4167. Graphs: centre is mean, error bars are st dev. P values: unpaired two-tailed t test.*, p≤ 0.05. **, p≤0.01. ***, p≤0.001.
Analyzing differential gene expression did not reveal dramatic changes in NOTCH genes, despite the prevailing thought that COUP-TF2 functions through antagonizing this pathway (Fig. 5a and d, Extended Data Fig. 10d, and Supplementary Table 3). Furthermore, overexpressing NOTCH signaling did not rescue the Coup-tf2OE phenotype (Extended Data Fig. 9j and k). Although, it’s possible that expression levels were not high enough to overcome COUP-TF2. Instead, a prominent feature of Coup-tf2OE cells was increased cell cycle genes (Supplementary Table 3). Plotting CV plexus and vein cells according to G1/S/G2/M cell cycle staging revealed that the Coup-tf2OE population contained more cells with a cycling profile (Fig. 5e).
COUP-TF2 also influenced coronary vessel proliferation. The relative increase in Coup-tf2OE cells over developmental time was more than controls (Fig. 5f). Endothelial deletion of one copy of Coup-tf2 resulted in decreased proliferation and expansion of coronary vessels (Fig. 5g and Extended Data Fig. 10e). Since pre-artery specification was associated with decreased proliferation, these data suggest that COUP-TF2 may block arterial specification through activating cell cycle genes.
Next, we sought evidence that cell cycle exit enhances arterial specification, and that COUP-TF2 antagonizes this activity. First, cultured SV sprouts were treated with a CDK inhibitor, which significantly increased artery differentiation (Extended Data Fig. 9l and m). Second, a CDK inhibitor was administered to Cdh5CreER, Coup-tf2OE mice dosed early to assess whether the phenotype of small and absent coronary arteries could be alleviated (see phenotype in Fig. 4f). CDK inhibition resulted in no significant difference between control and transgenic animals (Fig. 5h), demonstrating rescue of COUP-TF2’s ability to inhibit artery formation.
DISCUSSION
ScRNA-Seq can reveal developmental transitions at a much higher resolution than previously possible 31–33. Combining ScRNA-Seq with in vivo localization and genetic manipulations, we show that a subset of endothelial cells within the immature coronary plexus cross a transcriptional threshold to become pre-artery cells. Pre-artery specification is a critical step since blocking this process inhibited artery formation. Prior to pre-artery specification, SV-derived endothelial cells gradually decreased venous genes while gradually increasing arterial genes. These data suggest that fate switching during angiogenesis occurs in a progressive manner, and that individual plexus cells that reach a threshold towards full arterial differentiation assemble the mature coronary arteries.
Although considered a master regulator of veins, precisely how COUP-TF2 brings about venous fate and suppresses artery fate is still under investigation 2. Single cell analysis revealed that COUP-TF2 did not push cells towards a venous fate or dramatically suppress artery genes. Instead, COUP-TF2 specifically blocked pre-artery specification because Coup-tf2OE induction before pre-artery prevented mature artery development, while induction afterwards had little effect. Our data indicated that COUP-TF2 suppressed pre-artery through activating cell cycle genes. Recently, retinal artery differentiation was shown to depend on cell cycle arrest triggered by blood flow, NOTCH activation, and Cx37 27. Pre-artery specification was independent of flow, but may engage similar mechanisms. Future experiments should examine whether this higher resolution understanding of coronary artery differentiation during cardiac angiogenesis could aid the development of regenerative therapies.
METHODS
Animals
All animals were utilized in compliance with Stanford University IACUC regulations. The following mouse strains were used: wild type (CD1, Charles River Laboratories, Strain Code #022), ApjCreER 34, RosaCoup-tf2OE 35, RosamTmG Cre reporter (The Jackson Laboratory, Gt(ROSA)26Sortm4(ACTB-tdTomato,-EGFP)Luo/J, Stock #007576), RosaNICD (The Jackson Laboratory, Gt(ROSA)26Sortm1(Notch1)Dam/J, Stock #008159), RosatdTomato Cre reporter (The Jackson Laboratory, B6.Cg-Gt(ROSA)26Sortm9(CAG-tdTomato)Hze/J, Stock #007909), Isl1MerCreMer 36, Cdh5CreER 37, Cx40CreER 38, Nfatc1Cre 39, RosaConfetti (The Jackson Laboratory, Gt(ROSA)26Sortm1(CAG-Brainbow2.1)Cle/J, Stock #013731), Coup-tf2 flox (Mutant Mouse Regional Resource Center, B6;129S7-Nr2f2tm2Tsa/Mmmh, Stock #032805-MU). Apln-lacZ 40, CXCR7-GFP (The Jackson Laboratory, C57BL/6-Ackr3tm1Litt/J, Stock #008591), CXCL12-DsRed (The Jackson Laboratory, Cxcl12tm2.1Sjm/J, Stock #022458), VE-Cadherin-CreER 41. All mice were maintained on a mixed background.
Timed pregnancies were determined by defining the day on which a plug was found as e0.5. For Cre inductions, Tamoxifen (Sigma-Aldrich, T5648) was dissolved in corn oil at a concentration of 20 mg/mL and was injected into the peritoneal cavity of pregnant dams. For cell cycle inhibition: 0.4 mg Dinaciclib was dissolved in 2.6% DMSO (in PBS) and was injected into the peritoneal cavity of pregnant dams. Dosing and dissection schedules for individual experiments were: (1) e12.5 single-cell RNA sequencing: Tamoxifen on e9.5 and e10.5, dissection on e12.5. (2) e14.5 single-cell RNA sequencing: Tamoxifen at e11.5 and e12.5. dissection at e14.5. (3) ApjCreER, Coup-tf2OE experiments: Tamoxifen at e9.5 and e10.5, dissected at e14.5 or e15.5 for coronary contribution quantification. Same dosing schedule, but dissected at e11.5 and e14.5 for recombination rate experiment (e11.5 only) and expansion experiment. Same dosing schedule, but dissected at e11.5, e12.5, or e13.5, was used for ventricular coverage visualization; Tamoxifen at e11.5 and e12.5, dissected at e15.5 for capillary visualization in Extended Data Fig. 9. (4) Cx40CreER, Coup-tf2OE experiments: Tamoxifen at e11.5 and e12.5 or 13.5, dissected at e15.5; for Extended Data Fig. 9i: Tamoxifen at e11.5, dissected at e15.5. (5) Cdh5CreER, Coup-tf2OE before pre-artery: Tamoxifen at e11.5 and e13.5, dissected at e15.5. (6) Cdh5CreER, Coup-tf2OE after pre-artery: Tamoxifen at e13.5 and e15.5, dissected at e16.5. (7) Cdh5CreER, Coup-tf2OE Dinaciclib experiment: Tamoxifen at e11.5 and e13.5, Dinaciclib at e12.5, dissected at e15.5. (8) Cx40CreER, Rosaconfetti: Tamoxifen at e12.5, dissected at e15.5. (9) ApjCreER, Coup-tf2OE, NICD experiment: Tamoxifen at e11.5 and e12.5, dissected at e15.5. (10) Cx40CreER, RosatdTomato lineage tracing: Tamoxifen at e11.5, dissected at e12.5, postnatal day 7 or 8; Tamoxifen at e10.5, dissected at e15.5; Tamoxifen at e16.5, dissected at postnatal day 8. (11) Cdh5CreER, Coup-tf2 flox dosage: Tamoxifen at e10.5, dissected at e12.5; Tamoxifen at e11.5, dissected at e13.5 or e14.5. (12) ApjCreER lineage tracing in RCA/LCA: Tamoxifen at e9.5 and e10.5, dissected at e14.5, and e15.5. (13) Pre-artery cells/Slc45a4 in ApjCreER lineage vessels: Tamoxifen at e9.5 and e10.5, dissected at e13.5. (14) Additional Cx40CreER and ApjCreER lineage tracing experiments: see Extended Data Fig. 7. (15) VE-Cadherin-CreER, Coup-tf2OE: Tamoxifen at e15.5 and e16.5, dissected at e17.5.
For additional Cx40CreER, RosatdTomato embryonic lineage tracing experiment, pregnant dams were dosed via oral gavage with 1 mg 4-OH Tamoxifen (Sigma-Aldrich H6278) at e11.5 and dissected at e12.5 (Extended Data Fig. 6f) or e15.5 (Fig. 2).
For postnatal lineage tracing at P2 and P6, tamoxifen was injected into the peritoneal cavity of the mother when the neonates were at P2 so that tamoxifen could be passed from the mother to the neonates through milk.
Cell isolation for scRNA-Seq
E12.5 scRNA-Seq
SV-derived cells were captured by Fluorescence-Activated Cell Sorting (FACS) of ApjCreER lineage labeled cells (Cre expressed in SV). Experiment was performed once where males ApjCreER, RosamTmG were crossed to CD1 females, who were dosed with Tamoxifen at e9.5 and e10.5. Embryos were harvested into cold, sterile PBS at e12.5. The SVs of each of 27 GFP-positive hearts were microdissected away from the ventricles and pooled into a 300 μL mix consisting of 500 U/mL collagenase IV (Worthington #LS004186), 1.2 U/mL dispase (Worthington #LS02100), 32 U/mL DNase I (Worthington #LS002007), and sterile DPBS with Mg2+ and Ca2+. The ventricles of the 27 hearts were minced with forceps and pooled together in another 300 μL of the aforementioned mix. The pooled SVs and ventricles were then incubated at 37°C, and gently resuspended every 7 minutes. After the incubation, 60 μL cold FBS followed by 1200 μL cold sterile PBS were added and mixed into each tube. The samples were then filtered through a 70 μm cell strainer; the filter and the source tube was washed with a total of 1200 μL sterile PBS. Cells were then centrifuged at 400 g at 4°C for 5 minutes. Each cell pellet was then gently resuspended in 600 μL 3% FBS (in sterile PBS). Cells were centrifuged again at 400 g at 4°C for 5 minutes. Each pellet was then gently resuspended in 2000 μL of 3% FBS and 32 u/mL DNase I in sterile PBS. Cells were kept on ice until FACS procedure.
1.1 uM DAPI was added to the cells right before FACS. Single cells that have low DAPI signal, moderate PE-Texas Red signal, and the highest Alexa-Fluor 488 signal were sorted using Aria II SORP (BD Biosciences). Each cell was sorted into a separate well of a 96-well plate containing 4 μL of lysis buffer. Cells were spun down after sorting and stored in −80°C until cDNA synthesis. A total of 480 sinus venosus cells and 480 ventricular cells were sorted out and processed for cDNA synthesis. Cells were analyzed on the AATI 96-capillary fragment analyser, and a total of 915 cells that had sufficient cDNA concentration were barcoded and pooled for sequencing.
E14.5 scRNA-Seq
Experiment was performed once following the same procedure as e12.5 above unless otherwise noted here.
1,152 FACS captured coronary cells lineage labeled with ApjCreER were collected from e14.5 hearts (SV cells were excluded and the later time point used to ensure sufficient numbers of Coup-tf2OE cells). To isolate Coup-tf2OE cells, male ApjCreER, Coup-tf2OE mice were crossed to RosamTmG females who were dosed Tamoxifen at e11.5 and e12.5 and harvested at e14.5. A total of 16 GFP-positive embryos from four litters were dissected for cell isolation and FACS. To isolate wild type cells, male ApjCreER, RosamTmG mice were crossed to CD1 females. Pregnant dams were dosed with Tamoxifen at e11.5 and e12.5 and harvested at e14.5. A total of 12 GFP-positive embryos from three litters were sorted out and further dissected. For both the wild type and the Coup-tf2OE samples, a few GFP- negative embryos were processed for dissection and cell isolation in the exact same manner to serve as a negative control for the GFP signal during FACS.
Cells with the highest Alexa-Fluor 488 signal, low DAPI signal, and low PE-Texas Red signal were sorted into lysis buffer. For Coup-TF2OE, a total of 861 cells were sorted and processed for cDNA synthesis. For wild type, a total of 608 cells were sorted and processed for cDNA synthesis. Of these, 1152 passed cDNA fragment quality control (concentration > 0.05 ng/μL) and were sequenced. Of those, 1126 passed QC threshold (>1000 genes, 105 mm10-aligned reads). 326 cells in the Coup-TF2OE expressed the Flag-Myc transgene and were compared to the 423 control cells that passed QC.
cDNA synthesis and library preparation for scRNA-Seq
We used Smart-seq2 to perform scRN-Seq 42. Poly-A mRNA in the cell lysate was converted to cDNA and amplified as described in Picelli et al., 2014. Amplified cDNA in each well was quantified using a high-throughput Fragment Analyzer (Advanced Analytical). After quantification, cDNA from each well was normalized to the desired concentration range (0.05 ng/μL – 0.16 ng/μL) by dilution, consolidated into a 384-well plate, and subsequently used for library preparation (Nextera XT kit; Illumina) using a semiautomated pipeline as described 43, 44. The distinct libraries resulting from each well were pooled, cleaned-up and size-selected using precisely 0.6x to 0.7x volumes of Agencourt AMPure XP beads (Beckman Coulter), as recommended by the Nextera XT protocol (Illumina). A highsensitivity Bioanalyzer (Agilent) run was used to assess fragment distribution and concentrations of different fragments within the library pool. It is important to note that after pooling the libraries and before sequencing there is no PCR step in our protocol. Pooled libraries were sequenced on NextSeq 500 (Illumina).
Demultiplexing and alignment of scRNA-Seq reads
The resulting reads were 1) demultiplexed using Illumina’s demultiplexing tool bcl2fastq (default settings), and 2) processed using skewer11 for 3′ quality-trimming, 3′ adapter-trimming, and removal of degenerate reads, as described9. The processed reads were mapped to the mouse genome (mm10) using STAR (https://github.com/alexdobin/STAR) and gene expression was quantified with HTSeq (http://htseq.readthedocs.io/en/release_0.9.1/). The expression of the Coup-TFII-OE transgene was quantified by aligning reads to the following sequence, encoding the Flag-Myc tag: TAAGCTTCGTATATACCTTTCTATACGAAGTTGTGGATCTGCGATCTAAGTAAGCCGCGGCCATGGACTACAAGGATGACGATGACAAGGCCGCGGCAACTAGTAAGCTTGCCGCCATGGAGCAGAAACTCATCTCTGAAGAGGATCTGT
Cell subtype discovery with iRPCA
First, low quality cells were filtered out by the following thresholds: > 3500 genes, < 40% rRNA, >105 mm10-aligned reads, from 915 sequenced cells. 757 cells passed quality control.
To identify the broad cell subtypes present, in situ hybridization data on 52 genes from the Euroexpress45 database were compared to expression levels in an rPCA plot of all cell in the dataset, excluding erthrocytes (Extended Data Fig. 1j).
Cell subtypes in the ApjCreER-labeled populations were manually defined using gene expression patterns in manually selected PC plots derived from multiple iterative rounds of rPCA (iRPCA). There were two overall goals of iRPCA. The first was to fully describe the cellular subtypes within an scRNAseq dataset while minimizing: 1. Over-clustering of homogenous populations or continua, 2. Clustering based on cell cycle phase or technical artifacts/cell quality, and 3. Under-clustering of small subpopulations. The second goal was to preserve continuity or discreteness between subpopulations.
Our pipeline differed from standard pipelines in several ways. First, we used rPCA (rrcov::PcaHubert) in lieu of standard PCA. Second, we replaced default PC scores by those calculated by the sum of top 60 genes: PC.score = PC.pos − PC.neg (Extended Data Fig. 1b and c). These two parameters were used because they provided more clearly defined separations among cells with unique gene expression patterns (see Extended Data Fig. 1a and b and additional description in main text). Finally, we made frequent use of PC pos/neg biplots, which we defined by:
Where gi,p are the top 30 genes by positive loading to the PC and gi,n by negative loading. These were used to identify and exclude cell cycle-associated PCs (described below in Identifying cell cycle-regulated genes)(Extended Data Fig. 1d) and inspect for cell doublets (expected to have nearly equal levels, on a log scale, of the top markers for two distinct subpopulations; we did not see any in our dataset, possibly due to strict FACS gating on FSC-W and SSC-W and the large spacing of wells on standard 96-well plates)(Extended Data Fig. 1e).
Cell subtype clusters were assigned through the following process. After removing a small number of erythrocytes, all cells in the dataset were used to calculate 15 PCs where the input was all genes minus those in our cell cycle category (see Identifying cell cycle-regulated genes) and the output was PC plots based on the sum of top 60 genes. Among the resulting 15 PC plots, one was manually chosen for further analysis based on the following criteria: 1. Cells were well separated among the PC axes, 2. Expression patterns of the top 60 genes revealed distinct populations/clusters, and 3. The PC was not highly correlated with cell cycle genes (see Identifying cell cycle-regulated genes) or number of genes detected (i.e. technical artifact). Distinct cell populations within the selected PC were manually identified by their separation from other cells within the plots and strong correlation with distinct gene expression patterns. One (or more) distinct cell population was then removed, and another iteration was performed to calculate another set of PCs containing the decreased number of cells. Each of these subsequent iterations similarly involved, first, a PC calculation (10–15 PCs depending on step), then, a manual selection of one PC plot based on the above-described criteria, and, finally, within that selected PC the manual identification/removal of cell subpopulations based on the above-described criteria. These iterations ended when the calculated PCs revealed a single continuum that was arranged in a linear progression on the PC plots, which indicated the presence of only two groups of cells: one with high expression of one set of markers and the other with high expression of a second set of markers (Extended Data Fig. 1k). These last continua were separated into two groups, which comprised the final clusters. In this way, a single continuum was not over clustered into more than two groups.
Listed below are the exact steps by which we obtained all the reported clusters in the e12.5 data. In the first two rounds, rPCA (rrcov::PcaHubert, k=15) was run using a all genes gene expressed in > 1 cell, filtered by removing ribosomal proteins by grep(Rp[ls]*), as well as Rn45s, Lars2, and Malat1. In all rounds after that, the list of 202 cell cycle genes described below was also removed from the gene list. In total, 20 rounds of iRPCA were performed to cluster cells into the 10 subpopulations in this work.
Pairwise Discreteness Test
To analyze the relationship between pairs of subpopulations of cells, the cells of the two subtypes are first projected onto a single axis of identity. For the purpose of the following description, these populations are referred to as “A” and “B”. To do this, cells are scored by their expression of the top differentially expressed genes between the two populations. Differential expression is calculated as log-foldchange, fractional difference (difference in fraction of “A” cells expressing minus the fraction of “B” cells expressing), and Wilcoxon p-value; genes are filtered by foldchange > 0.2 (natural logarithm), fractional difference > 0.05, and p < 10−3. The top n genes, sorted by foldchange and fractional difference, are referred to as ga (top n genes enriched in A) and gb (top n genes enriched in B). The results do not vary much for n between 20 and 100 (Extended Data Fig. 1l, only low-confidence connections change). In this work, the gene list is pre-filtered by removing ribosomal genes (Rp[ls]*) and cell cycle genes (the list of 202 cell cycle genes described below). Cells are then given a score x by their expression of these genes:
Where g is in log10 cpm units and max is the maximum across all cells in the pair of subtypes. This scores cells along the axis of cell identity along A and B. The resulting distribution of cells along this axis is tested for discreteness, or a lack of intermediate cells, by the width of the largest gap between the two distributions. The statistic is calculated by the following procedure (Extended Data Fig. 1f):
The distribution is fitted to a Gaussian mixture model with two components, giving means μA and μB.
Cells within the range (μA, μB) are identified as candidate intermediates.
The largest gap distance between candidate intermediate cells, dmax, is identified.
The list of candidate intermediate cells is further restricted to the 10 cells on either side of dmax, and their gap distances, excluding dmax, are fit to an exponential with rate k, F(d; k). If there is a uniform distribution of intermediate cells along the continuum from A–B, the gap distances di follow an exponential distribution P(d) ~ e−kd, where the mean gap distance (equivalent to the mean time between events for a Poisson process occurring at rate k).
The discreteness statistic is calculated as D = log10 F(dmax; k).
Two populations are considered discrete if D < −6. In the PlotConnectogram function, distributions with −3 > D > −6 are connected by a semitransparent lines to indicate lower confidence in their continuity. In simulated data, this corresponded to 3–5 intermediate cells. Distributions with med(D) > −3 are connected by 100%-opacity lines to indicate high confidence in their continuity.
Estimating the number of intermediate cells
Second, the number of intermediate cells connecting the two pairs is estimated by maximum-likelihood fitting of a 5-parameter distribution. This distribution was derived by considering two cell types with mean expression values μA, μB and a transitional population sampled evenly from the range of values μA < μ < μB. The exact PDF that describes sampling from this distribution with Gaussian noise is:
| (1) |
where fA is the fraction of cells in cell type A, fB is the fraction of cells in cell type B, and fAB is the fraction of cells along the A–B continuum. The integral in (1) is approximated by
| (2) |
Where C, D, F, G are calculated to make (2) a continuous function. This PDF is then fit to the distribution using Nelder-Mead optimization (stats::optim) with 5 iterations for different initial values for fAB. The initial values for μA, μB, σ are derived by fitting with a 2-component Gaussian mixture model. fAB determines the width of the lines connecting populations in our PlotConnectogram function.
Simulation of population distributions for model validation
We optimized the cutoffs for the discreteness test using simulated data. The data was simulated by drawing from the 5-parameter distribution described above under “Estimating the number of intermediate cells”, where fAB ranged from 0 to 1 (Extended Data Fig. 1h). Using the simulations, we found −6 to be a good cutoff for calling cell types discrete – this cutoff is low so as to be sufficiently sensitive to a small number of intermediates (~3 intermediate cells out of 150).
Identifying cell cycle-regulated genes
When mentioned in the main text, we filtered out a list of 202 cell cycle genes from the input to rPCA to reduce the contribution of cell cycle to heterogeneity. We defined this list by rPCA: cell cycle PCs were identified by high loadings of known cell cycle markers (e.g., cyclins, Mki67, Top2a). Also, cell cycle has a unique pattern on PCi.pos vs. PCi.neg biplots (described above) as well: there is typically a large coordinated increase in genes upon entering cell cycle with little corresponding decrease in genes, and PCi.pos has low correlation to PCi.neg. The positive and negative loadings were therefore inspected separately for cell cycle genes. In this work, rPCA was performed on a highly-cycling, relatively homogeneous subgroup of cells (later identified as SVc and CV) using all genes; we used the union of the top 60 genes by each of the following loadings: PC1-positive, PC2-negative, PC2-negative, PC4-positive, PC5-negative, and PC6-negative, which produced a list of 230 candidate cell cycle genes. We filtered this list for genes that had high loadings to other PCs, marked subpopulations of cells, and had no cell cycle annotation; these included arterial markers like Unc5b. This produced the final list of 202 cell cycle genes. This list was not complete, but was sufficient to remove cell cycle heterogeneity from the top PCs.
Defining the fetal SVc-CV Plexus-Arterial axis
We defined the SVc-CV-Arterial axis (x) using the scores generated by PC2 and PC3 from RPCA on SVc, CV, and arterial cells (Fig. 3a, Extended Data Fig. 4) as below:
Fig. 3a was colored by the value of this axis.
Cell cycle scoring
G1/S and G2/M signatures were discovered in an unbiased manner as follows: CV plexus cells from WT e14.5 animals were analyzed with rPCA using all detected genes. Many of the top 60 genes by loading to PC3.neg and PC2.neg were known G1/S markers, and, thus, cells’ G1/S score was defined by the sum of the scaled expression of these genes. Many of the genes with high loadings to PC4.neg and PC5.neg were known G2/M markers, and the G2/M score was calculated by the sum of the scaled expression of these genes. Cells were scored as “cycling” if they were not in the bottom-left modes (high expression of at least one cell cycle signature).
Seurat clustering for comparison
To compare our clustering to Seurat, we ran Seurat with primarily default options. We filtered our list of 202 cell cycle genes as well as ribosomal proteins from the list of highly variable genes (y.cutoff=0.5) and ran PCA with 20 scores calculated. Based on the PC elbow plot, we selected the first 10 PCs to be used for clustering. We excluded PC6 for high loading of cell cycle genes (since our list of 202 genes was not exhaustive), and clustered using FindClusters with resolution 2. We also calculated t-SNE, and we used the t-SNE mediods of cell clusters to place the vertices for our results from pairwise PCA (Extended Data Fig. 1l).
Comparison to adult artery-vein continuum
We determined the similarity between our E12.5 endothelial cells and the mature artery-vein continuum as follows. We selected cells from the Tabula Muris dataset with the Tissue label “Heart” and annotation label “1”. We ran PCA on the most variable genes (y.cutoff=0.35) with the Seurat package. PC2 and PC3 separated cells into 3 populations along a single continuum, and we projected cells onto a single axis . Known arterial genes like Gja5, Gja4, and Unc5b were negatively correlated, and known capillary/venous markers like Aplnr and Nrp2 were positively correlated to the axis, so we considered it to be the artery-venous continuum (AVc). We then calculated the similarity of each fetal cell to each adult cell. To do this, we used as input the union of the top 300 genes correlated to the adult and fetal A-V continua, smoothed by LOESS regression over the A-V continua defined above. We calculated the Pearson correlation similarity using these features, and mapped each fetal cell to the adult cell to which it was most similar by this metric.
Immunohistochemistry and Imaging
For whole mount embryonic hearts
All embryos were fixed in 4% PFA at 4°C shaking and washed twice (10 minutes each wash) with PBS at room temperature shaking prior to dissection for whole-mount immunostaining.
Intact embryonic hearts were washed in PBT (PBS with 0.5% Triton-X 100) at room temperature for one hour before incubation in primary antibodies. Primary antibodies were dissolved in either 5% goat serum or 5% donkey serum in PBT. Hearts were incubated in the solution with primary antibodies with shaking overnight at 4°C. Hearts were then washed with PBT for six to nine hours with shaking at room temperature, and the wash was changed every hour. Hearts were then stained with secondary antibodies with the same conditions/procedure as for primary antibodies. After washing off the secondary antibodies, hearts were then left in enough PBT to cover them. Two drops of Vectashield (Vector Labs, H1000) were added and mixed with the PBT for each heart, and the hearts were stored at −20°C for long term. Imaging was done with Zeiss LSM-700 (10x or 20x objective lens) with the Zen 2010 software (Zeiss).
For whole mount postnatal hearts
Hearts were fixed in 4% PFA for 1 hour at 4°C shaking and washed twice (15 minutes each wash) with PBS at 4°C shaking prior to dissection for whole-mount immunostaining. In the primary antibodies (diluted in PBT), hearts were shaken at room temperature for six hours and one overnight at 4°C. To wash the primary antibodies, hearts were shaken in PBT at room temperature for ten hours and one overnight at 4°C. Hearts were washed in 50 mL PBT and the wash was changed every two hours while shaking at room temperature. Hearts were then placed in to secondary antibodies (diluted in PBT) for shaking at room temperature for six hours and for one overnight shaking at 4°C. Hearts were then washed in 50 mL PBT for eight hours (wash changed every two hours) and overnight at 4°C. The washing was repeated for six more days. Prior to imaging, Vectashield (Vector Labs, H1000) was added to hearts in clean tubes, and hearts were equilibrated at room temperature for 40 minutes. Imaging was done with Zeiss LSM-700 (10x or 20x objective lens) with the Zen 2010 software (Zeiss).
Primary and secondary antibodies
The following primary antibodies were used at the indicated concentrations: MYC-Tag for COUP-TF2OE (Cell Signaling Technology, Inc., 2278S, 1:300), VE-Cadherin (BD Pharmingen, 550548, 1:125), VEGFR2 (R&D Systems, AF644, 1:125), Cx40 (Alpha Diagnostic International, CX40A, 1:300), ERG (Abcam, ab92513, 1:500), CXCR4 (BD Pharmingen, 551852, 1:125), GFP (Abcam, ab13970, 1:500), VWF (Abcam, ab6994, 1:500), CLDN11 (Abcam, ab53041, 1:1000), SOX17 (R&D Systems, AF1924, 1:500), anti-actin α-smooth muscle- FITC (Sigma, F3777, 1:200), VEGFR3 (R&D Systems, AF743, 1:125), DACH1 (Proteintech, 10914-1-AP, 1:500), JAG1 (R&D Systems, AF599, 1:125).
All secondary antibodies were Alexa Fluor conjugates (488, 555, 633, 635, 594, 647, Life Technologies, 1:125 or 1:250). DAPI (1mg/ml) was used at 1:500.
In situ hybridization
To identify the broad cell subtypes in the e12.5 single cell dataset, expression levels in rPCA plots of 52 genes was compared to in situ hybridization data from the Euroexpress45 and Allen Brain Atlas databases (stages ranged from e11.5–15.5). Expression patterns from e14.5 Eurexpress data are shown in Extended Data Fig. 1i.
For Adm and Fbln2, in situ hybridization on paraffin sections were performed twice as described previously 46. Antisense Adm and Fbln2 probes were labeled with digoxigenin (DIG)-UTP using the Roche DIG RNA labeling System according to the manufacturer’s guidelines.
For Slc45a4, whole hearts were fixed and performed in situ hybridization according to protocol from Additional File 2 of Gross-Thebing et al 2014 47. Probes were Cdh5 (Advanced Cell Diagnostics 312531-C2), Cx40 (Advanced Cell Diagnostics 518041), and Slc45a4 (Advanced Cell Diagnostics 522131-C3). Reagents are RNAscope Protease III & IV Reagents (Advanced Cell Diagnostics 322340) and RNAscope Fluorescent Multiplex Detection Reagents (Advanced Cell Diagnostics 320851). About 12 embryonic hearts were dissected in a sterile and RNase-free environment into a 1.5-mL tube and fixed in 1 mL of 4% PFA for 1 hour at room temperature. Three fixed hearts were processed in the same tube with 100 μL of the probes master mix. Experiment was performed three times, once each for e13.5 (n=3), e14.5 (n=2), and e15.5 (n=3).
SV/atria explant experiment
Experiment was performed three times. In total, 71 embryos were dissected at e12.5. The sinus venosus and the atria of each embryo was dissected off on sterile PBS and gently dropped onto a cell culture insert (EMD Millipore PI8P01250) coated with Matrigel (BD biosciences) inside a well of a 24-well plate. Two to five explants were cultured onto each insert. Right after the explants were dropped onto the insert, 200 μL of EGM2-MV media was added into the space between the insert and the well. The SVs were allowed to attach onto the Matrigel at 37°C for 2–6 hours before another 200 μL of EGM2-MV media was added to the space between the insert and the well. The explants were cultured at 37°C for approximately 72 hours before either Flavopiridol or DMSO was added: 900 μL of 40 nM of Flavopiridol (dissolved in 0.1% DMSO in EGM2-MV) or 0.1% DMSO in EGM2-MV (drug vehicle control) was added to each insert. After addition of either Flavopiridol or DMSO, explants were incubated at 37°C for approximately 48 hours before they were fixed and stained.
Each cell culture insert was fixed in 1000 μL of 4% PFA for two hours at 4°C without shaking. Then, each insert was washed with 1000 μL PBS three times at room temperature. 500 μL of primary antibodies (diluted in 0.5% PBT) were added onto each insert and inserts were incubated at room temperature with shaking for 4–6 hours. The inserts were subsequently washed with PBS at room temperature with shaking for two hours. 500 μL of secondary antibodies (diluted in 0.5% PBT) were added onto each insert and inserts were incubated at 4°C for about 16 hours. The inserts were then washed with PBS three times at room temperature with shaking for two hours. The membrane containing the SVs was then excised from the insert and mounted onto a drop of Vectashield on a slide and stored for long term at −20°C. Imaging was done with Zeiss LSM-700 (10x or 20x objective lens) with the Zen 2010 software (Zeiss).
Acquisition and processing of images
All images were acquired with the Zen 2010 software (Zeiss). Images were prepared using Photoshop CS6 (Adobe). Any changes to brightness and contrast were applied equally across the entire image.
In vivo EdU Assay
For in vivo proliferation rate, 50 μg/g of body weight of EdU was injected into pregnant mice intraperitoneally two to three hours before embryo collection. EdU-positive cells were detected with the Click-iT EdU kit (Invitrogen, C10338) according to manufacturer’s instruction. Briefly, Click-iT reaction cocktails were incubated for 30 min after the secondary antibody incubation of the immunostaining protocol.
Quantification and statistical analysis of confocal images
See Supplementary Methods section for details.
Code availability statement
The custom R scripts used to analyze the scRNA-Seq data is publicly available on GitHub (https://github.com/gmstanle/coronary-progenitor-scRNAseq).
Data availability statement
Raw scRNA-seq data is available on https://github.com/gmstanle/coronary-progenitor-scRNAseq. Figures associated with the raw data are Figures 1, 3, 4, and Extended Data Figures 1, 2, 3, 4, 5, 6, 7, and 8. There is no restriction on data availability. Source data for Figures 2, 4, 5, and Extended Data Figures 6, 7, 8, and 9 are provided with the paper.
Extended Data
Extended Data Fig. 1. Single cell analysis of ApjCreER lineage labeled cells.
(a) Comparison of rPCA and classical PCA at separation of subpopulations. PC scores were selected to best separate the Enpp+/Esam− population. Cells are colored by expression (log10 cpm, scaled to max per gene). N=352 cells. (b) Comparison of default and sum-of-60 modified PC scores. PC2 is the default PC score from rPCA; PC2.score is the modified sum-of-top-60 scores (expression is log10 cpm, scaled to max). Y-axis is the number of genes detected per cell (>1 count). N=426 cells. (c) Comparison of default and sum-of-top-60 scores. Scores were chosen that best separated the Vwf+ and Cxcr4 populations. N=426 cells. (d) Unique cell cycle signature on PC pos/neg biplots. PC1.pos (PC1.neg) is the sum of the top 30 genes by positive (negative) loading to PC1. Cells are colored by expression. Lower panel is same rPCA after removing the list of 202 cell cycle genes. Bolded numbers are the correlations between PC1.pos and PC1.neg. N=674 cells. (e) PC pos/neg biplot showing theoretical location of doublets expressing high levels of both gene sets. (f) Schematic of the pairwise discreteness test on a discrete (left) and continuous (right) pair of subpopulations. (g) FACS plots used to isolate GFP-positive cells (red box) from ApjCreER, RosamTmG hearts at e12.5. (h) Upper panel: discreteness statistic generated by pairwise discreteness test as a function of number of intermediate cells (nint) for simulated distributions. Lower panel: pairwise distributions of cell clusters in the dataset and the fraction of intermediate cells estimated by pairwise discreteness analysis. (i) rPCA plots and their accompanying gene expression patterns in the embryonic heart as reported by Euroexpress. In situ hybridization images show whole hearts in top panels while insets of specific areas are in lower panels with relative expression levels indicated. Expression levels in rPCA plots range from 0 (yellow) to 4 (brown) in log10 cpm. Top panels: N=843 cells. (j) Summary of broadly defined cell populations as indicated by gene expression patterns. N=843 cells. (k) Example of manual clustering process. For i, n=732 cells; ii, n=531 cells; iii, n=415 cells; iv, n=284 cells; v, n=261 cells. (l) Comparison of pairwise discreteness test results for different numbers of genes per cell type signature (n).
Extended Data Fig. 2. Identification of a coronary progenitor niche within the SV.
(a) Gene expression patterns identify cell types in rPCA plots of the venous valve-SV-coronary vessel (CV) continuum. Expression levels are log10 of counts per million reads (CPM) and range from 0 (yellow) to 4 (brown) as indicated. Left panel, n=843 cells, Right panels, n=732 cells. (b and c) Expression patterns in rPCA plots (b) and whole mount confocal immunofluorescence (c) of selected genes. For b, n=732 cells. (d) Overlaying gene expression patterns suggests that the SV has two distinct domains, the SVc (sinus venosus, coronary adjacent) and the SVv (sinus venosus, valve adjacent). (e) rPCA on the valve-SVv-SVc continuum identified specific markers of the SVv and SVc. Solid box, n=732 cells. Dotted box, n=415 cells. (f) In situ hybridization of SVv and SVc markers revealed complementary localization in vivo. (g) Color coding showing subpopulations that were used to calculate average expression levels. CV, coronary vessel; PC, principle component; SVc, sinus venosus-coronary; SVv, sinus venosus-valve. Scale bars: b, 200 μm, e, 30 μm.
Extended Data Fig. 3. Characterization of pre-artery cells.
(a–d) rPCA plots of the e12.5 SVc-coronary vessel continuum. Each dot is an individual cell, and gene expression levels are indicated by the color spectrum as shown in Fig. 1d, which reflects log10 of counts per million. (a) Arterial genes highly enriched in the arterial areas of the plot. (b) Arterial genes significantly upregulated in, but not specific to, the arterial area of the plot. (c) Venous genes highly depleted in the arterial areas of the plot. (d) Venous genes downregulated, but not depleted, in the arterial area of the plot. For a–d, Bonferroni-adjusted p < 0.01; PCA plots, n=415 cells. Center and error bars are mean ± s.e.m. of log cpm expression values. (e) Genes expressed in adult coronary artery cells. Data is from the Tubula Muris consortium. N=445 cells. (f) Assignment of artery, capillary, and vein in adult coronary cells based on gene expression enrichment in e. N=445 cells. (g) Schematic for comparing e12.5 coronary cells to those along the adult artery-capillary-vein continuum. (h) Results of experiment schematized in g. The center line correspond to the median; the upper and lower hinges correspond to the first and third quartile, respectively; the whiskers extend to the largest value or to 1.5*IQR (inter-quartile range, or distance between quartiles), whichever is smaller. Pre-artery cells: n=20 cells. CV: n=277 cells. P = 6.2 x 10⁻¹³. Statistical test is two-tailed. A, artery; Art, arterial; CV, coronary vessel plexus; PC, principle component; SVc, sinus venosus-coronary; V, vein
Extended Data Fig. 4. Novel artery markers identified in scRNA-seq data.
(a) e12.5, e14.5, and adult coronary cell rPCA plots with genes highly enriched or specific to the arterial area during development. Each dot is an individual cell, and gene expression levels are indicated by the color spectrum as shown in Fig. 1d, which reflects log10 of counts per million. Red/bolded genes are also enriched in adult artery cells. (b) Fluorescence in situ hybridization (RNAscope) for Slc45a4, which is expressed (arrowheads) in vessels positive for the arterial marker, Cx40, but not Cx40-negative capillaries (arrows). (c) Slc45a4 expression in pre-artery cells derived from the SV lineage (ApjCreER lineage labeled)(arrowheads). (d) Genes enriched in, but not specific to, arterial cells at e12.5 and 14.5. Genes in bold red are arterial specific in both the developing and adult heart. In both a and d: For PCA plots n=415 cells (upper panel, e12.5); n=347 cells (middle panel, e14.5); n=445 cells (lower panel, adult). For bar graphs E12.5, Art, n=20 cells; CV, n=277 cells; SV, n=118 cells; E14.5, Art, n=70 cells; CV, n=454 cells; SV, n=144 cells. Center and error bars are mean ± s.e.m. of log cpm expression values. Dots represent individual cells.
Art, arterial; CV, coronary vessel plexus; SVc, sinus venosus-coronary; V, vein.
Scale bars: 100 μm.
Extended Data Fig. 5. Additional whole mount immunofluorescence of marker genes.
(a) Cx40 whole mount immunohistochemistry in late gestation hearts (e17.5). Cx40 is only expressed in cells lining large arteries and arterioles (overlapping blue and green signal). Low level, non-arterial signal is in myocardial cells. (b) rPCA plots from e12.5 and e14.5 with accompanying whole mount immunofluorescence in e13.5 hearts. VWF is enriched in the SV while Apln-nlacZ signal and DACH1 are present throughout the coronary plexus. CXCR4, CXCR7-GFP, and CXCL12-DsRed are enriched in the pre-artery and artery areas of rPCA plots and are as interspersed within the intramyocardial coronary plexus. N=415 cells (left panel, e12.5); n=347 cells (right panel, e14.5).
Art, arterial; CV, coronary vessel plexus; SVc, sinus venosus-coronary.
Scale bars: 100 μm.
Extended Data Fig. 6. Clustering and additional lineage analysis of pre-artery cells.
(a) Clusters and relationships generated by rPCA and the pairwise discreteness test (left) and clusters generated by the Seurat pipeline (Louvain/SNN clustering, resolution = 2)(right). N=843 cells. (b) Violin plots show that arterial gene enrichment and venous gene de-enrichment is better with manual, iterative clustering, suggesting that this method leads to more precise populations. (c) Violin plots of cell cycle genes in the two CV plexus clusters generated by the indicated algorithms. Seurat clusters are more defined by cell cycle differences than iterative rPCA (iRPCA) clusters. For b and c, violin plots were made using Seurat VlnPlot. Each violin plot is one subtype and each dot corresponds to a cell. (d) Quantification of the SV and endocardium contributions to coronary arteries. Error bars are st dev. ApjCreER RCA: n=11 hearts. ApjCreER LCA: n=6 hearts. Nfatc1Cre RCA: n=5 hearts. Nfatc1Cre LCA: n=5 hearts. Centre is the mean. (e) Experimental design to lineage trace pre-artery cells. (f) Lineage labeling in e12.5 Cx40CreER, Rosatdtomato hearts induced with Tamoxifen at e11.5. (g) Arterial lineage labeling in hearts induced at e10.5. (h) Example of clones in Cx40CreER, Rosaconfetti heart at e15.5. Tamoxifen was administered at e12.5. Two groups of cells sharing the same fluorescent label (clones) are present, YFP-labeled (yellow circle) and nGFP labeled (green circle). Clone sizes are very small consistent with low proliferation rates in pre-arterial cells. (i) P8 heart lineage from Cx40CreER, Rosatdtomato animals dosed with Tamoxifen at e11.5. Heavy lineage labeling of the left coronary artery is shown (LCA). Arrowheads indicate branches of the right coronary artery. Myocardium (myo) of the left ventricle is also Cx40+ at e11.5, and is also lineage labeled. (j) Images from P8 Cx40CreER, Rosatdtomato hearts dosed with Tamoxifen at e11.5 or e16.5. Only the e11.5 dosage results in capillary labeling (arrows) resulting from reversion of pre-artery cells that differentiate during the burst of pre-artery specification between e12.5–14.5. Arrowheads point to arterial lineage labeling. (k). Postnatal lineage tracing in ApjCreER, Rosatdtomato or Cx40CreER, Rosatdtomato hearts where Tamoxifen was injected at P2. Tips of arteries are lineage labeled with ApjCreER, Rosatdtomato, but are depleted with Cx40CreER, Rosatdtomato label, indicating that artery tips can extend by incorporating capillary cells that differentiate into arterial endothelial cells. Unpaired two-tailed t test was used to calculate P values. For ApjCreER, N=78 artery tips at P2, n=41 artery tips at P6. p=4.4608 x 10⁻¹⁹. For Cx40CreER, N=81 artery tips at P2, n=49 artery tips at P6. p=1.61705 x 10⁻¹⁵. Error bars are st dev. ****, p≤0.0001. Centre is mean. Scale bars: d, e, f, j, k, 100 μm; g, 50 μm.
Extended Data Fig. 7. A burst of pre-artery specification between e12.5–e14.5 specifies cells that build most of the embryonic left and right coronary arteries.
(a) rPCA plots of the SVc-coronary vessel continuum show that Apj and Cx40 mark cells before and after pre-artery specification, respectively. N=415 cells. (b) Schematic of lineage tracing experiments. Black bars indicate Tamoxifen dosing, and arrows point to harvest date. (c–e) Right lateral views of early hearts show zones with heavy pre-artery specification. (f, g, and i) Low magnification of right lateral views (left most panels) at late embryonic stages show labeling in the main right coronary artery while right panels focus in on more distal branches of the right coronary artery. Table summarizes labeling and results. N= >3 hearts for each experiment. (h) Quantification of ApjCreER and Cx40CreER lineage labeling indicates that most of the embryonic coronary artery is formed by cells specified within the e12.5 to 14.5 time window. N=3 for each Cre. Error bars are st dev. Centre is mean. Tam, Tamoxifen. Scale bars, 100 μm.
Extended Data Fig. 8. Gene expression curves in e12.5 cells.
(a) Expression of genes from the indicated categories along the SV-CV plexus-arterial differentiation continuum. The x-axis has individual cells organized as shown in Fig. 3a, and gene expression is plotted as LOESS curves. Raw data points are shown as dots. (b) Gene set enrichment analysis (GSEA) where cell cycle pathways are bolded. (c) Pre-artery cells (Cx40+Cxcr4+Apj−) segregate to the non-cycling quadrant of rPCA plots. Arrows indicate cell cycle progression. (d) Quantification of EdU labeling in pre-artery cells. Error bars are st dev. N=6 hearts. ***, p≤0.001. Unpaired two-tailed t test was used to calculate P value. Centre is the mean.
Extended Data Fig. 9. Effect of COUP-TF2 overexpression during coronary vessel development.
(a) Schematic of transgenes used to study Coup-tf2 overexpression in coronary cells. (b and c) Recombination is not complete in the SV with e9.5 and 10.5 doses of Tamoxifen as show in whole mount confocal images (b) and quantification (c). Control GFP is visualized by direct fluorescence, and COUP-TF2OE through immunostaining for the myc tag. For (c) ApjCreER, RosamTmG, n=5 hearts. ApjCreER, Coup-tf2OE, n=6 hearts. (d) Tamoxifen dosing at e11.5 and 12.5 fills capillaries with recombined cells, but still resulted in Coup-tf2OE cells being excluded from arteries (A). (e) Induction of Coup-tf2OE throughout vasculature shows that overexpressing cells can exist in arteries. (f) Quantification of ventricle coverage at e12.5. N=4 control hearts, n=7 COUP-TF2OE hearts. ns, p>0.05. p=0.8868. (g) Whole mount confocal images of control and Coup-tf2OE hearts at different stages of development. Coronary migration (dotted line) on the dorsal side of the ventricle (outlined with solid line) is similar in both genotypes. (h) High magnification of e12.5 Coup-tf2OE heart shown in (g) highlights the positioning of transgenic cells at both the leading front and trailing cells. (i) COUP-TF2OE cells can become part of the JAG-1-positive artery if induced after pre-artery specification with Cx40CreER. (j) Mosaic experiment where constitutive expression of the NOTCH intracellular domain (NICD) is induced at the same time as Coup-tf2OE. This manipulation creates a vasculature containing three different transgene combinations: 1. NICD, 2. COUP-TF2OE, or 3. NICD + COUP-TF2OE (arrowheads). Those containing just the NICD (category 1) are the only transgenic cells that contribute to arterial vessels. (k) Quantification of the percentage of endothelial cells in capillaries and arteries (Art) with the three transgenic combinations. NICD-expressing cells preferred arteries while COUP-TF2OE cells avoid arteries, the latter of which was not rescued by NICD. N=6 hearts. **, p≤0.01; ****, p≤0.0001. For NICD capillary versus artery, p=0.0070. For COUP-TF2OE capillary versus artery, p=7.49224x10−05. For COUP-TF2OE + NICD capillary versus artery, p=8.07734x10−05. (l) The CDK inhibitor, Flavopiridol, increased arterial specification (Cx40) in an SV sprouting assay. N=33 control explants, n=38 treated explants. ***, p≤0.001. (m) Immunostaining of endothelial sprouts (VE-cadherin+) migrating from SV/atria tissue explants with Cx40 showed the increased in this arterial marker (arrowheads) with Flavopiridol treatment. For all graphs: Error bars are st dev, A two-tailed unpaired t test was performed to determine P value, and centre is mean. A, artery; Cap, capillaries. Scale bars: b, 20 μm; d, e, g, h, i, and j, 100 μm; m, 25 μm
Extended Data Fig. 10. Gene expression curves in e14.5 control and Coup-tf2OE cells.
(a) FACS plots of the GFP-marked cells from control and Coup-tf2OE hearts that were processed for scRNA-seq. (b) Criteria for identifying Coup-tf2OE cells was >1 read of the flag and myc sequences included in the transgene. (c) Comparing the number of flag and myc reads in control and Coup-tf2OE hearts confirms the specificity of this parameter for transgenic cells. Control: n=409 cells. COUP-TF2OE: n=714 cells. The center line corresponds to the median; the upper and lower hinges correspond to the first and third quartile, respectively; the whiskers extend to the largest value or to 1.5*IQR (inter-quartile range, or distance between quartiles), whichever is smaller. (d) Expression of genes from the indicated categories along the vein-CV plexus-arterial axis. The x-axis has individual cells organized as shown in Fig. 5b. Lines are LOESS curves of gene expression and raw data points are shown as dots. Shaded region represents the 95% confidence interval of the LOESS curve. (e) Hypoplastic coronary vasculature with heterozygous deletion of Coup-tf2 in endothelial cells. Scale bars: 100 μm.
Supplementary Material
Acknowledgments
We thank Drs. Sophia Tsai, Ming-Jer Tsai, Sylvia Evans, Bin Zhou, Thomas Quertermous, and Luisa Iruela-Arispe for mice. Masanori Miyanishi for FACS assistance. Rachel Morganti and Gunsagar Gulati for scRNA-Seq assistance. Drs. Lucy O’Brien, Dominique Bergmann, and Valentina Greco for manuscript comments. Jiyeon Ban for technical assistance. T.S. supported by NIGMS of the National Institutes of Health (T32GM007276). K.R. supported by NIH/NHLBL (R01-HL128503) and New York Stem Cell Foundation (NYSCF-Robertson Investigator). T.T.D. supported by NIH/NHLBL T32 (HL098049) and AHA Postdoctoral Fellowship. E.C.B. supported by NIH (R01-GM037734, R01-AI130471) and Dept of Veterans Affairs.
Footnotes
AUTHOR CONTRIBUTIONS
T.S., R.S., G.S., and K.R. conceived the study. T.S. and R.S., captured cells/performed scRNA-seq. G.S., scRNA-seq computation. T.S., G.S., and K.R., scRNA-seq analysis. G.D., CXCR7-GFP and Fbln2/Adm ISH. S.D., P2/P6 postnatal analysis. S.R., EdU experiments. A.H.C., e14.5/e17.5 lineage quantifications. A.P., Isl1 experiment. B.R., GSEA. T.T.D. and W.A.R. provided Coup-tf2 flox animals. K.E.Q. and K.M.C. provided CXCR7-GFP. L.M. provided Cx40CreER. S.W. and G.L. provided adult scRNA-seq. T.S., G.S., and K.R. prepared manuscript. T.S. performed most wet lab experiments. R.S., E.C.B., I.W., S.Q., and K.R. provided resources.
COMPETING FINANCIAL INTERESTS
The authors are not aware of any competing financial interests.
References
- 1.Chen X, Qin J, Cheng CM, Tsai MJ, Tsai SY. COUP-TFII is a major regulator of cell cycle and Notch signaling pathways. Mol Endocrinol. 2012;26:1268–1277. doi: 10.1210/me.2011-1305. [DOI] [PMC free article] [PubMed] [Google Scholar]
- 2.Fish JE, Wythe JD. The molecular regulation of arteriovenous specification and maintenance. Dev Dyn. 2015;244:391–409. doi: 10.1002/dvdy.24252. [DOI] [PubMed] [Google Scholar]
- 3.Isogai S, Lawson ND, Torrealday S, Horiguchi M, Weinstein BM. Angiogenic network formation in the developing vertebrate trunk. Development. 2003;130:5281–5290. doi: 10.1242/dev.00733. [DOI] [PubMed] [Google Scholar]
- 4.Red-Horse K, Ueno H, Weissman IL, Krasnow MA. Coronary arteries form by developmental reprogramming of venous cells. Nature. 2010;464:549–553. doi: 10.1038/nature08873. [DOI] [PMC free article] [PubMed] [Google Scholar]
- 5.Xu C, et al. Arteries are formed by vein-derived endothelial tip cells. Nat Commun. 2014;5:5758. doi: 10.1038/ncomms6758. [DOI] [PMC free article] [PubMed] [Google Scholar]
- 6.Kametani Y, Chi NC, Stainier DYR, Takada S. Notch signaling regulates venous arterialization during zebrafish fin regeneration. Genes Cells. 2015;20:427–438. doi: 10.1111/gtc.12234. [DOI] [PMC free article] [PubMed] [Google Scholar]
- 7.Wu B, et al. Endocardial cells form the coronary arteries by angiogenesis through myocardial-endocardial VEGF signaling. Cell. 2012;151:1083–1096. doi: 10.1016/j.cell.2012.10.023. [DOI] [PMC free article] [PubMed] [Google Scholar]
- 8.Chen HI, et al. The sinus venosus contributes to coronary vasculature through VEGFC-stimulated angiogenesis. Development. 2014;141:4500–4512. doi: 10.1242/dev.113639. [DOI] [PMC free article] [PubMed] [Google Scholar]
- 9.Volz KS, et al. Pericytes are progenitors for coronary artery smooth muscle. Elife. 2015;4:e10036. doi: 10.7554/eLife.10036. [DOI] [PMC free article] [PubMed] [Google Scholar]
- 10.Ivins S, et al. The CXCL12/CXCR4 Axis Plays a Critical Role in Coronary Artery Development. Dev Cell. 2015;33:455–468. doi: 10.1016/j.devcel.2015.03.026. [DOI] [PMC free article] [PubMed] [Google Scholar]
- 11.Sharma B, Chang A, Red-Horse K. Coronary Artery Development: Progenitor Cells and Differentiation Pathways. Annu Rev Physiol. 2017;79:1–19. doi: 10.1146/annurev-physiol-022516-033953. [DOI] [PMC free article] [PubMed] [Google Scholar]
- 12.Todorov V, Filzmoser P. An Object-Oriented Framework for Robust Multivariate Analysis. Journal of Statistical Software. 2009;32:1–47. [Google Scholar]
- 13.Gokce O, et al. Cellular Taxonomy of the Mouse Striatum as Revealed by Single-Cell RNA-Seq. Cell Reports. 2016;16:1126–1137. doi: 10.1016/j.celrep.2016.06.059. [DOI] [PMC free article] [PubMed] [Google Scholar]
- 14.Rivera-Feliciano J, et al. Development of heart valves requires Gata4 expression in endothelial-derived cells. Development. 2006;133:3607–3618. doi: 10.1242/dev.02519. [DOI] [PMC free article] [PubMed] [Google Scholar]
- 15.Zhang H, et al. Endocardium Minimally Contributes to Coronary Endothelium in the Embryonic Ventricular Free Walls. Circ Res. 2016 doi: 10.1161/CIRCRESAHA.116.308749. CIRCRESAHA.116.308749. [DOI] [PubMed] [Google Scholar]
- 16.Chen Q, et al. Endothelial cells are progenitors of cardiac pericytes and vascular smooth muscle cells. Nat Commun. 2016;7:12422. doi: 10.1038/ncomms12422. [DOI] [PMC free article] [PubMed] [Google Scholar]
- 17.Lin CJ, Lin CY, Chen CH, Zhou B, Chang CP. Partitioning the heart: mechanisms of cardiac septation and valve development. Development. 2012;139:3277–3299. doi: 10.1242/dev.063495. [DOI] [PMC free article] [PubMed] [Google Scholar]
- 18.Adams RH, et al. Roles of ephrinB ligands and EphB receptors in cardiovascular development: demarcation of arterial/venous domains, vascular morphogenesis, and sprouting angiogenesis. Genes Dev. 1999;13:295–306. doi: 10.1101/gad.13.3.295. [DOI] [PMC free article] [PubMed] [Google Scholar]
- 19.Sacilotto N, et al. MEF2 transcription factors are key regulators of sprouting angiogenesis. Genes Dev. 2016;30:2297–2309. doi: 10.1101/gad.290619.116. [DOI] [PMC free article] [PubMed] [Google Scholar]
- 20.The Tabula Muris Consortium. Quake SR, Wyss-Coray T, Darmanis S. Transcriptomic characterization of 20 organs and tissues from mouse at single cell resolution creates a Tabula Muris. bioRxiv. 2017:1–21. doi: 10.1101/237446. [DOI] [Google Scholar]
- 21.Mack JJ, et al. NOTCH1 is a mechanosensor in adult arteries. Nat Commun. 2017;8:1620. doi: 10.1038/s41467-017-01741-8. [DOI] [PMC free article] [PubMed] [Google Scholar]
- 22.Tian X, et al. Vessel formation. De novo formation of a distinct coronary vascular population in neonatal heart. Science. 2014;345:90–94. doi: 10.1126/science.1251487. [DOI] [PMC free article] [PubMed] [Google Scholar]
- 23.Chen HI, et al. VEGF-C and aortic cardiomyocytes guide coronary artery stem development. J Clin Invest. 2014;124:4899–4914. doi: 10.1172/JCI77483. [DOI] [PMC free article] [PubMed] [Google Scholar]
- 24.Subramanian A, et al. Gene set enrichment analysis: a knowledge-based approach for interpreting genome-wide expression profiles. Proc Natl Acad Sci USA. 2005;102:15545–15550. doi: 10.1073/pnas.0506580102. [DOI] [PMC free article] [PubMed] [Google Scholar]
- 25.Akimoto S, Mitsumata M, Sasaguri T, Yoshida Y. Laminar shear stress inhibits vascular endothelial cell proliferation by inducing cyclin-dependent kinase inhibitor p21(Sdi1/Cip1/Waf1) Circ Res. 2000;86:185–190. doi: 10.1161/01.res.86.2.185. [DOI] [PubMed] [Google Scholar]
- 26.Lin K, et al. Molecular mechanism of endothelial growth arrest by laminar shear stress. Proc Natl Acad Sci USA. 2000;97:9385–9389. doi: 10.1073/pnas.170282597. [DOI] [PMC free article] [PubMed] [Google Scholar]
- 27.Fang JS, et al. Shear-induced Notch-Cx37-p27 axis arrests endothelial cell cycle to enable arterial specification. Nat Commun. 2017;8:2149. doi: 10.1038/s41467-017-01742-7. [DOI] [PMC free article] [PubMed] [Google Scholar]
- 28.You LR, et al. Suppression of Notch signalling by the COUP-TFII transcription factor regulates vein identity. Nature. 2005;435:98–104. doi: 10.1038/nature03511. [DOI] [PubMed] [Google Scholar]
- 29.Qin J, et al. COUP-TFII inhibits TGF-β-induced growth barrier to promote prostate tumorigenesis. Nature. 2013;493:236–240. doi: 10.1038/nature11674. [DOI] [PMC free article] [PubMed] [Google Scholar]
- 30.Grieskamp T, Rudat C, Lüdtke THW, Norden J, Kispert A. Notch signaling regulates smooth muscle differentiation of epicardium-derived cells. Circ Res. 2011;108:813–823. doi: 10.1161/CIRCRESAHA.110.228809. [DOI] [PubMed] [Google Scholar]
- 31.Gawad C, Koh W, Quake SR. Single-cell genome sequencing: current state of the science. Nature Reviews Genetics. 2016;17:175–188. doi: 10.1038/nrg.2015.16. [DOI] [PubMed] [Google Scholar]
- 32.Treutlein B, et al. Reconstructing lineage hierarchies of the distal lung epithelium using single-cell RNA-seq. Nature. 2014;509:371–375. doi: 10.1038/nature13173. [DOI] [PMC free article] [PubMed] [Google Scholar]
- 33.Velten L, et al. Human haematopoietic stem cell lineage commitment is a continuous process. Nature. 2017;19:271–281. doi: 10.1038/ncb3493. [DOI] [PMC free article] [PubMed] [Google Scholar]
- 34.Chen HI, et al. The sinus venosus contributes to coronary vasculature through VEGFC-stimulated angiogenesis. Development. 2014;141:4500–4512. doi: 10.1242/dev.113639. [DOI] [PMC free article] [PubMed] [Google Scholar]
- 35.Qin J, et al. COUP-TFII inhibits TGF-β-induced growth barrier to promote prostate tumorigenesis. Nature. 2013;493:236–240. doi: 10.1038/nature11674. [DOI] [PMC free article] [PubMed] [Google Scholar]
- 36.Sun Y, et al. Islet 1 is expressed in distinct cardiovascular lineages, including pacemaker and coronary vascular cells. Dev Biol. 2007;304:286–296. doi: 10.1016/j.ydbio.2006.12.048. [DOI] [PMC free article] [PubMed] [Google Scholar]
- 37.Wang Y, et al. Ephrin-B2 controls VEGF-induced angiogenesis and lymphangiogenesis. Nature. 2010;465:483–486. doi: 10.1038/nature09002. [DOI] [PubMed] [Google Scholar]
- 38.Miquerol L, et al. Endothelial plasticity drives arterial remodeling within the endocardium after myocardial infarction. Circ Res. 2015;116:1765–1771. doi: 10.1161/CIRCRESAHA.116.306476. [DOI] [PubMed] [Google Scholar]
- 39.Wu B, et al. Endocardial cells form the coronary arteries by angiogenesis through myocardial-endocardial VEGF signaling. Cell. 2012;151:1083–1096. doi: 10.1016/j.cell.2012.10.023. [DOI] [PMC free article] [PubMed] [Google Scholar]
- 40.Sheikh AY, et al. In vivo genetic profiling and cellular localization of apelin reveals a hypoxia-sensitive, endothelial-centered pathway activated in ischemic heart failure. Am J Physiol Heart Circ Physiol. 2008;294:H88–98. doi: 10.1152/ajpheart.00935.2007. [DOI] [PMC free article] [PubMed] [Google Scholar]
- 41.Alva JA, et al. VE-Cadherin-Cre-recombinase transgenic mouse: a tool for lineage analysis and gene deletion in endothelial cells. Dev Dyn. 2006;235:759–767. doi: 10.1002/dvdy.20643. [DOI] [PubMed] [Google Scholar]
- 42.Picelli S, et al. Full-length RNA-seq from single cells using Smart-seq2. Nat Protoc. 2014;9:171–181. doi: 10.1038/nprot.2014.006. [DOI] [PubMed] [Google Scholar]
- 43.Koh PW, et al. An atlas of transcriptional, chromatin accessibility, and surface marker changes in human mesoderm development. Sci Data. 2016;3:160109. doi: 10.1038/sdata.2016.109. [DOI] [PMC free article] [PubMed] [Google Scholar]
- 44.Loh KM, et al. Mapping the Pairwise Choices Leading from Pluripotency to Human Bone, Heart, and Other Mesoderm Cell Types. Cell. 2016;166:451–467. doi: 10.1016/j.cell.2016.06.011. [DOI] [PMC free article] [PubMed] [Google Scholar]
- 45.Diez-Roux G, et al. A high-resolution anatomical atlas of the transcriptome in the mouse embryo. PLoS Biol. 2011;9:e1000582. doi: 10.1371/journal.pbio.1000582. [DOI] [PMC free article] [PubMed] [Google Scholar]
- 46.D’Amato G, et al. Sequential Notch activation regulates ventricular chamber development. Nature Publishing Group. 2015;18:7–20. doi: 10.1038/ncb3280. [DOI] [PMC free article] [PubMed] [Google Scholar]
- 47.Gross-Thebing T, Paksa A, Raz E. Simultaneous high-resolution detection of multiple transcripts combined with localization of proteins in whole-mount embryos. BMC Biology. 2014;12:55. doi: 10.1186/s12915-014-0055-7. [DOI] [PMC free article] [PubMed] [Google Scholar]
Associated Data
This section collects any data citations, data availability statements, or supplementary materials included in this article.
Supplementary Materials
Data Availability Statement
Raw scRNA-seq data is available on https://github.com/gmstanle/coronary-progenitor-scRNAseq. Figures associated with the raw data are Figures 1, 3, 4, and Extended Data Figures 1, 2, 3, 4, 5, 6, 7, and 8. There is no restriction on data availability. Source data for Figures 2, 4, 5, and Extended Data Figures 6, 7, 8, and 9 are provided with the paper.


