

Abstract
MLL3 (also named KMT2C) is a COMPASS subunit that implements H3K4 mono-methylation at gene enhancers. KMT2C frequently incurs point-mutations across a range of human tumors, nevertheless precisely how these lesions alter MLL3 function and contribute to oncogenesis is unclear. Here we report a cancer mutational hotspot in MLL3 within its Plant Homeo Domain (PHD) repeats and demonstrate that this domain mediates association with the histone H2A deubiquitinase and tumor suppressor BAP1. Cancer-associated MLL3 PHD mutations disrupt the interaction between MLL3 and BAP1 and correlate with poor patient survival. Cancer cells bearing MLL3 PHD mutations or lacking BAP1, exhibit reduced enhancer recruitment of MLL3 and the H3K27 demethylase UTX (KDM6A). As the result, inhibiting the H3K27 methyltransferase activity of polycomb repressor complex 2 (PRC2) in tumor cells harboring BAP1 or MLL3 mutations, restores normal gene expression patterns and impairs cell proliferation in vivo. This study provides mechanistic insight for the role of MLL3 PHD mutations in cancer and points to restoration of the balanced state of polycomb-COMPASS for the treatment of cancers resulting from mutations in these epigenetic factors.
Introduction
Mutations and translocations of epigenetic factors such as histone lysine methyltransferases (KMTs) and lysine demethylases (KDMs) are a common mechanism driving tumorigenesis1–6. Thus, both KMTs and KDMs are potential therapeutic targets in human cancers7–10. Based on primary amino acid sequence and substrate specificity, KMTs are divided into six subfamilies11. SET1A, SET1B and MLL1–4 belong to the KMT2 family, which catalyze mono-, di- and trimethylation of histone H3 at the lysine 4 position (H3K4me1–3), and are proposed to be involved in the positive regulation of gene transcription12,13. This family of enzymes was initially biochemically isolated from yeast in a macromolecular complex named COMPASS (Complex Proteins Associated with Set1)13,14. Genome-wide sequencing of cancer has identified frequent mutations within COMPASS subunits, suggesting that misregulation of their activities plays an important role in pathogenesis1,15. For instance, chromosomal translocations generate MLL fusion proteins that constitutively activate the posterior HOXA cluster, resulting in aberrant self-renewal of hematopoietic progenitors and leukemia development16,17. In diffuse large B cell lymphoma and follicular lymphoma, MLL4 (KMT2D) acts as a tumor suppressor, and mutations within its catalytic domain promote lymphomagenesis18,19.
Unlike other COMPASS family members, which trimethylate H3K413, MLL3 and MLL4 catalyze histone H3K4 mono-methylation at enhancers20,21 and are among the most frequent mutated histone modifiers in human cancers22. MLL3 mutations are detected in a broad spectrum of tumors including hepatocellular carcinoma23, breast cancer24, colon cancer25 bladder cancer26, myelodysplastic syndromes and acute myeloid leukemia (AML)27. Subunits within MLL3 COMPASS such as PTIP28 and UTX29 are also involved in human cancer pathogenesis. Although a large number of MLL3 mutations have been identified, the molecular consequence of these mutations with respect to MLL3’s functional domains remains unexplored. Here we identify an MLL3 mutational hotspot located within the first Plant Homeo Domain (PHD) repeats and establish a functional link between these mutations and the BAP1 histone deubiquitination signaling pathway and provide a targeted therapeutic approach by resetting the balanced state of polycomb and COMPASS families in the regulation of gene expression.
Results
MLL3 COMPASS uniquely associates with the BAP1 complex.
Genome-wide studies of diverse human cancers have identified frequent mutations in the histone H3 lysine 4 mono-methyltransferase, MLL3 (KMT2C) gene15. To understand the global mutation status of MLL3 in human cancer, we retrieved data from the The Cancer Genome Atlas (TCGA) database and identified two mutational hotspots within the MLL3 amino-terminal PHD finger repeats (Fig. 1a, Supplementary Fig. 1a-h). By comparison, there are no obvious mutational hotspots within the closely related COMPASS family member, MLL4 (KMT2D) (Fig. 1b).
Figure 1. MLL3 COMPASS associates with the BAP1 complex.
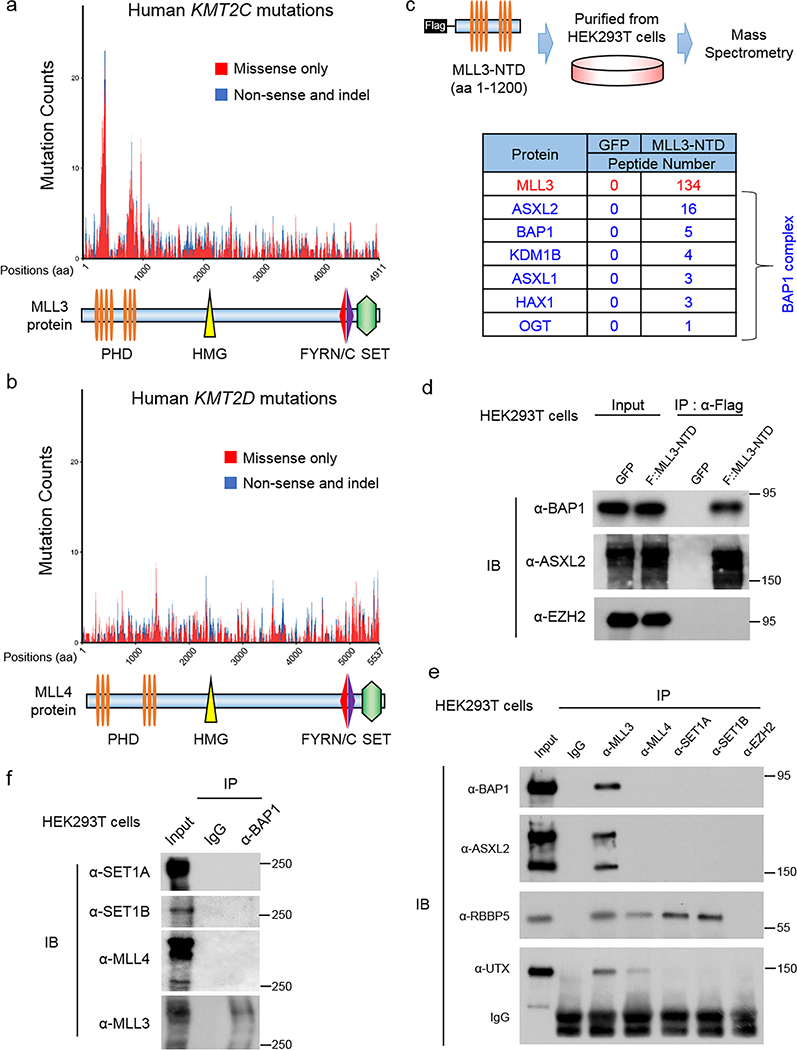
a, b) Mutation counts in MLL3 (KMT2C, a) and MLL4 (KMT2D, b) were obtained from TCGA mutation data retrieved from cBioPortal using the ‘TCGAretriever’ package in R. Mutations occurring in the KMT2C or KMT2D genes were binned based on the position of the affected amino acid and then plotted according to the type of mutation (missense or nonsense/indel). Mutations from 32 provisional TCGA datasets were aggregated and used for the analysis. The mutation counts for each amino acid within MLL3 or MLL4 protein in human cancers were shown. c) Top, schematic of the experimental strategy. An N-terminal 1200 amino acid portion of human KMT2C gene was expressed as a Flag-tagged fusion protein (MLL3-NTD) in HEK293T cells and subjected to Flag-purification from nuclear extracts and used for mass spectrometry analysis. Peptide numbers of each subunit of BAP1 complex purified by MLL3-NTD were shown. d) BAP1 and ASXL2 levels in HEK293T cells 24 hours after transfection with plasmids expressing GFP or Flag-MLL3-NTD. Immunoprecipitation (IP) from whole cell lysates was performed with antibodies directed against the Flag epitope, followed by immunoblotting (IB) with antibodies directed against BAP1 or ASXL2. EZH2 was used as negative control. n=3. e) Immunoprecipitation of endogenous MLL3, MLL4, SET1A and SET1B in HEK293T cells followed by immunoblotting for BAP1 and ASXL2. The core COMPASS subunit RBBP5, and a subunit specific to the MLL3 and MLL4 COMPASS branches, UTX, were used as positive controls. EZH2 immunoprecipitation served as a negative control, n=3. f) Immunoprecipitation of endogenous BAP1 in HEK293T cells followed by immunoblotting for SET1A, SET1B, MLL3 and MLL4, n=3. Image representative of at least two independent experiments. Uncropped images in Supplementary Figure 11.
Given the prevalence of MLL3 PHD mutations in cancer, we hypothesized that the PHD repeats could mediate important protein-protein interactions that might provide insight toward targeted therapeutic approaches for MLL3 mutation-induced cancers. To test this hypothesis, we expressed and purified the first 1,200 amino acids of the MLL3 N-terminal domain (MLL3-NTD) containing these mutational hotspots from HEK293T cells (Fig. 1c, upper panel). Mass spectrometry of MLL3-NTD pulldowns demonstrated that the BAP1 complex (Supplementary Table 1), which contains ASXL1–3, KDM1B, HAX1, and OGT, co-purifies with this portion of MLL3 (Fig. 1c, lower panel) and the stoichiometry of these MLL3-NTD interactors was calculated30 (Supplementary Fig. 1i). Western blotting analysis confirmed an interaction between the BAP1 complex and the MLL3-NTD (Fig. 1d).
To investigate if the endogenous MLL3 also interacts with BAP1, we immunoprecipitated MLL3, MLL4, SET1A, and SET1B components of the COMPASS family from HEK293T cells using antibodies specific to each methyltransferase (Fig 1e; Supplementary Fig. 1j). BAP1 is exclusively detected in MLL3 immunoprecipitations, whereas UTX, a component of MLL3 and MLL4 COMPASS13, is detected in both MLL3 and MLL4 immunoprecipitations (Fig 1e). By contrast, RBBP5, a common subunit of all COMPASS family, is detected in all immunoprecipitations. We performed reciprocal immunoprecipitation using a BAP1 antibody and found that of the COMPASS family members, only MLL3 is enriched (Fig. 1f). The interaction between BAP1 and MLL3 was also confirmed in other two additional cell lines (Supplementary Fig. 1k). Thus, the BAP1 complex is a unique interacting partner of MLL3 COMPASS and this interaction is mediated through the N-terminal domain of MLL3 containing the PHD repeats.
Cancer associated MLL3-PHD mutations disrupt BAP1 binding.
The discovery of two mutational hotspots within the MLL3-PHD repeats prompted us to hypothesize that MLL3-PHD mutations might correlate with cancer survival. To test this hypothesis, we separated MLL3 mutations into mutations that occur either inside or outside of the PHD repeats (Supplementary Fig. 2a) and performed Kaplan-Meier (KM) curves with five TCGA datasets including breast cancer (Supplementary Fig. 2b), and a combined pool of the five top cancers including liver cancer, lung cancer, non-small cell lung carcinoma, and bladder cancer (Supplementary Fig. 2c). Breast cancer patients with MLL3-PHD mutations have shorter disease-free survival than patients with wild-type MLL3 or patients with mutations outside of the PHD domain (Supplementary Fig. 2b). In a KM analysis using the pool of five tumor types, we observed the same correlation between the MLL3-PHD mutation and patient survival (Supplementary Fig. 2c). Collectively, our analysis suggests that MLL3-PHD mutations disrupt a crucial function of this tumor suppressor protein and predict decreased survival. Our biochemical studies demonstrated that the MLL3-PHD repeats interact with the BAP1 complex (Figure 1), therefore we investigated genetic alterations of BAP1 in MLL3-WT and MLL3-mutated patient samples. To this end, we used the TCGA datasets for human breast cancer (n=2051) and pan lung cancer (n=985). MLL3 is mutated in 11.847% of breast cancer and 15.736% of lung cancer (Supplementary Fig. 2d), whereas BAP1 is mutated at respective frequencies of 1.804% and 1.523% in these cancers (Supplementary Fig. 2e).
To map the precise BAP1 binding peptide sequences within MLL3, we generated multiple Flag-tagged constructs expressing truncations of the MLL3-NTD (Fig. 2a). By co-immunoprecipitation, we found that the BAP1 complex binds to PHD repeats 2–4 of the first PHD repeat cluster (Fig. 2b). Conversely, truncation of PHD fingers 2–4 completely blocks BAP1 binding (Fig 2C). We identified all reported mutations within MLL3 PHD2–4 in pooled human cancers (Fig. 2d). This region is highly mutated with 56% (28 out of 50 amino acids) of the MLL3 amino acids mutated across human cancers (Supplementary Table 2). Notably, numerous mutations disrupt highly conserved cysteine and histidine residues required for zinc binding31.
Figure 2. Cancer associated MLL3-PHD mutations disrupt BAP1 binding and correlate with decreased patient survival.
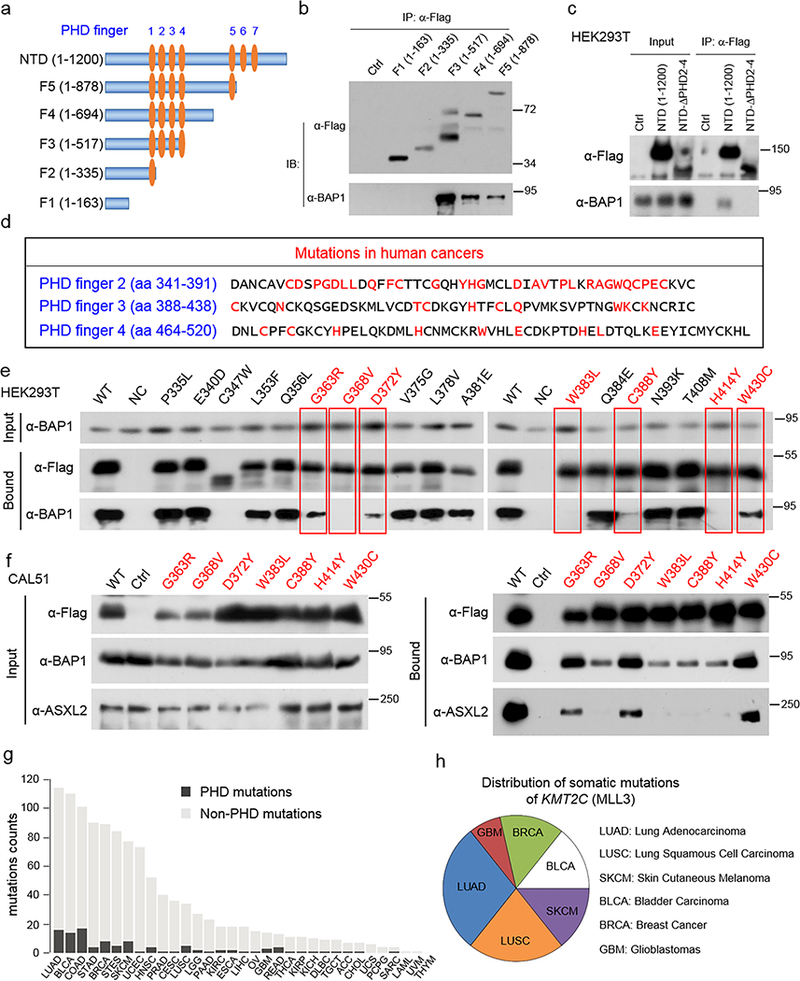
a) Schematic diagram depicting the domain organization of the N-terminus of MLL3. The indicated fragments were sub-cloned as a Flag-tag fusion into pcDNA3.1+ plasmid. b) Whole-cell lysates were used for immunoprecipitation with Flag antibodies followed by immunoblotting for Flag and BAP1 in cells transfected with empty vector (Ctrl) or MLL3-NTD truncations in (a), n=3. c) Whole-cell lysates were used for immunoprecipitation with Flag antibodies followed by immunoblotting for Flag and BAP1 in cells transfected with empty vector (Ctrl), MLL3-NTD or MLL3-NTD-ΔPHD finger 2–4, n=3. d) The protein sequence of PHD fingers 2–4 of human MLL3 protein. Amino acids within the PHD domain that are affected by KMT2C mutation in human cancers are highlighted in red. e) Site-directed mutagenesis of wild-type KMT2C was performed to generate 18 cancer mutations in the second PHD finger. The interaction of wild-type MLL3-NTD-F3 as well as 18 mutated versions of the MLL3-NTD-F3 were assayed for interaction with BAP1 in HEK293T cells as in (b). n=3. The red letters and boxes indicated the mutations that remarkably affect BAP1 and MLL3-NTD binding. f) The interaction of wild-type and MLL3-NTD-F3 mutants in the human breast cancer cell line CAL51. 7 MLL-NTD-F3 mutants exhibiting reduced interaction with BAP1 in HEK293T cells were chosen for validation in CAL51 cells, n=3. g) Counts of somatic mutations within KMT2C, either within or not within the PHD domain, across 32 cancer types in TCGA data. h) The distribution of the seven MLL3 mutations (G363R, G368V, D372Y, W383L, C388Y, H414Y and W430C) in LUAD, BLCA, COAD and BRCA cancer types. Image representative of at least two independent experiments. Uncropped images in Supplementary Figure 12.
Based on these observations, we hypothesized that mutations within MLL3-PHD fingers might abrogate its interactions with the BAP1 tumor suppressor complex. To test this hypothesis, we introduced human cancer associated point mutations into the MLL3-NTD-F3 and purified these constructs from HEK293T cells (Fig 2e). Many cancer-associated MLL3 PHD mutations affect BAP1 complex binding, in particular G368V, W383L, C388Y, and H414Y strongly disrupt such interactions. Using a human breast cancer cell line, CAL51, we confirmed that these point mutations strongly diminish the interaction between BAP1 and MLL3-NTD (Fig. 2f).
To investigate whether PHD-domain mutations are enriched in specific cancer types, we analyzed the distribution of somatic mutations in MLL3 using a combined cohort of TCGA dataset across 32 cancer types. MLL3 PHD mutations and overall MLL3 mutations are enriched in lung adenocarcinoma (LUAD), bladder carcinoma (BLCA), colon adenocarcinoma (COAD) and breast cancer (BRCA) cancer types (Fig. 2g). Mutations that inhibit MLL3-BAP1 interaction are most enriched in lung cancer, accounting for 50% cases (7 out of 14; LUSC n=3, LUAD n=4) (Fig. 2h). Loss of BAP1 protein is observed in various human cancers32, and moreover, BAP1 knockout mice display myeloid transformation33. Our data suggest that MLL3 PHD-BAP1 interactions have a crucial function that is disrupted in cancer and implicate BAP1 as a previously uncharacterized regulator of MLL3 COMPASS function.
BAP1 regulates MLL3 recruitment to enhancer chromatin.
To investigate the functional connection between MLL3 and BAP1 on chromatin, we generated polyclonal antibodies against both proteins (Supplementary Fig. 3a, b). To confirm the specificity of our antibodies, we constructed BAP1-KO cells by using CRISPR-CAS9 to delete BAP1 exons 4 and 5, resulting in a reading-frame-shift (Supplementary Fig. 3c). After confirming BAP1 deletion by mRNA and protein analysis (Supplementary Fig. 3d, e), we tested the specificity of these antibodies in ChIP-seq on wild-type, BAP1 null and MLL3 shRNA depleted cells and observed specific reduction of signals for MLL3 and BAP1 in the respective KO or KD lines (Supplementary Fig. 3e - h).
Analysis of ChIP-seq data using our MLL3 and BAP1 antibodies in human breast cancer cells revealed a total of 21,527 significant MLL3 peaks and 8,952 significant BAP1 peaks (Fig. 3a). About 60% of MLL3 binding sites were localized to enhancers, consistent with our observations for the Drosophila MLL3 homologue, Trr20 (Fig. 3a). Intriguingly, 50% of BAP1 peaks are similarly located at intergenic regions and introns (Fig. 3b), and 7,491 (83%) of BAP1 occupied regions are co-occupied by MLL3 (Fig. 3c, d). Motif enrichment analysis of MLL3 and BAP1 peaks both demonstrated an enrichment of ETS-like transcription factor binding motifs (Supplementary Fig. 4a).
Figure 3. BAP1-dependent recruitment of MLL3 COMPASS to enhancers.
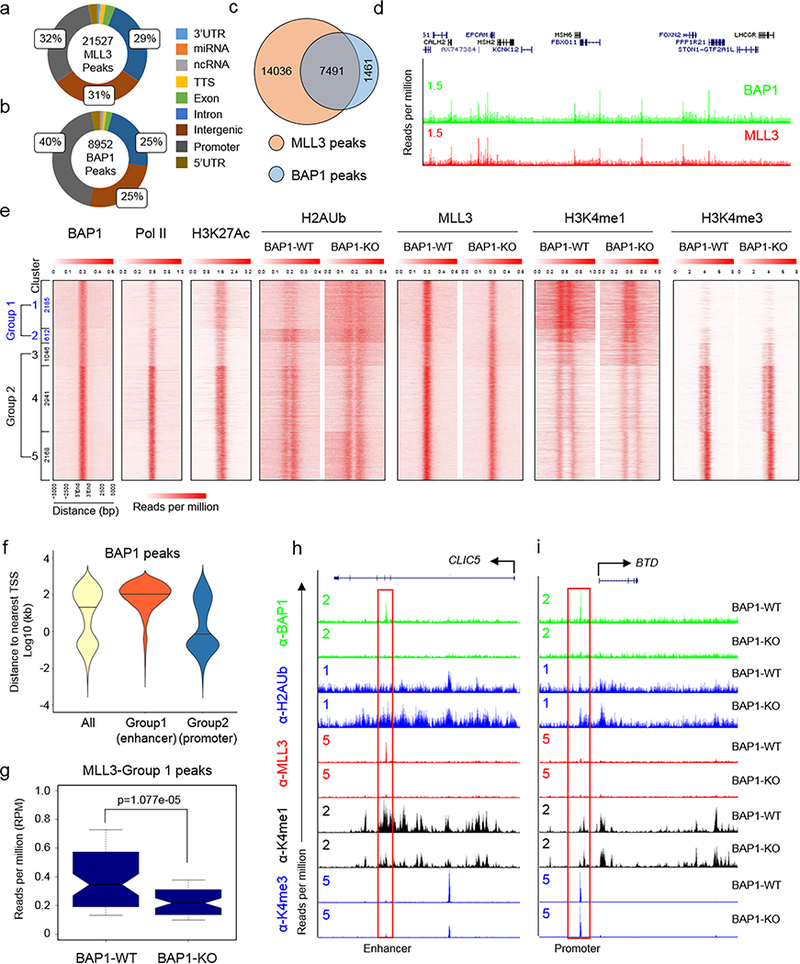
a, b) Distribution of MLL3 and BAP1 binding to gene regions in the human breast cancer cell line CAL51, as assessed by chromatin immunoprecipitation sequencing (ChIP-seq) using MLL3 and BAP1 specific antibodies. Annotation summaries for MLL3 (a) and BAP1 (b) peaks are presented in the pie chart. c) A Venn diagram presentation of the overlap of MLL3 and BAP1 peaks. d) Representative tracks showing chromatin occupancy by BAP1 and MLL3, n=2. e) Heat maps generated from ChIP-seq data show the occupancy of BAP1, Pol II and H3K27ac as well as H2Aub, MLL3, H3K4me1 and H3K4me3 in BAP1-WT and BAP1-KO CAL51 cells. All rows are centered on BAP1 peaks, and further divided into five clusters based on K-means clustering. Group1 peaks which contain Cluster 1–2 are enriched with enhancer marks, and Group2 peaks which contain Cluster 3–5 are enriched with promoter marks. (See methods for details on the clustering procedure). f) Distances to the nearest TSS are shown for Group 1 and Group 2 peaks, median distances are represented by black lines, n=2. g) Box plot quantifying the changes of MLL3 peaks at Group 1 loci in BAP1-WT and BAP1-KO cells, n=2, P-value from an unpaired Mann-Whitney U test. h) Representative tracks of BAP1, H2Aub, MLL3, H3K4me1 and H3K4me3 at enhancer (h) and promoter (i) BAP1 peaks, n=2.
Co-localization of MLL3 and BAP1 on chromatin suggests that MLL3 recruitment to enhancers may involve interactions with BAP1. To test this possibility, we performed ChIP-seq in BAP1-WT and –KO cells with BAP1, MLL3, H2AK119ub, H3K4me1, and H3K4me3 antibodies. Occupancy levels for each protein or histone modification were aligned to BAP1 peaks and divided into 5 clusters (Fig. 3e). Loss of the histone H2AK119 deubiquitinase BAP1 results in increased monoubiquitination of H2AK119 (H2AK119ub or H2Aub) levels specifically at clusters 1 and 2 (Group1 peaks) (Fig. 3e), which exhibit an active enhancer signature defined as a relatively high H3K4me1 to H3K4me3 ratio compared to active promoters, and the presence of acetylated H3K27 (H3K27ac). These results suggest that the BAP1 complex functions at enhancers and may modulate the activity of MLL3 COMPASS. In support of this hypothesis, violin plot analysis indicated that most of the Group1 BAP1 peaks are located at potential enhancers (Fig. 3f). Strikingly, MLL3 occupancy and H3K4me1 are reduced in BAP1-KO cells, particularly at Group1 peaks (Fig. 3g, e; Supplementary Fig. 4b, c), by contrast H3K4me3 levels were not detectably altered (Fig. 3e). BAP1 depletion from enhancers that are normally highly occupied by MLL3 results in elevated H2Aub, while MLL3 occupancy and H3K4me1 levels are reduced (Fig. 3h). However, at promoter regions where there is minimal MLL3 binding, loss of BAP1 leads to increased H2Aub signal but does not affect H3K4me1 levels (Fig. 3i). ChIP-QPCR was performed to quantify these occupancy changes for BAP1, H2Aub, MLL3, H3K4me1 and H3K4me3 at BAP1 target sites at the CLIC5 enhancer and BTD promoter (Supplementary Fig. 4d, e). Our results suggest that BAP1 functions in a context dependent manner at promoters and enhancers. GO pathway analysis demonstrated that genes near Group 1 peaks are involved in a range of developmental processes (Supplementary Fig. 4f). Taken together, these results demonstrate that BAP1 is required for efficient recruitment of MLL3 COMPASS histone H3K4 mono-methyltransferase activity to enhancers.
MLL3 COMPASS regulates tumor suppressor gene expression through BAP1-dependent enhancers.
To investigate if MLL3 loss at enhancers alters expression of nearby genes, using CRISPR-Cas9 gene editing, we generated cells lacking MLL3. To control for off target effects, we used two independent sets of sgRNAs to eliminate either exon 2 or exon 8, which in both cases causes a reading frame shift (Fig 4a, Supplementary Fig. 5a, b). MLL3 protein is absent in our KO clones by western blotting (Fig. 4b, Supplementary Fig. 5c), and MLL3 antibodies do not co-immunoprecipitate BAP1 or RBBP5 (a core subunit of the COMPASS family) in these cells (Fig. 4c). We performed ChIP-seq and RNA-seq in parental CAL51 cells, BAP1-KO, and MLL3-KO cells. Loss of BAP1 results in reduced levels of MLL3 and H3K4me1 occupancy at Group 1 loci, which correlates with changes in nearby gene expression (Fig 4d, Supplementary Fig. 5d-f). By RNA-seq analysis, 333 protein coding genes are consistently down-regulated (p < 0.01) and 120 protein coding genes are up-regulated in MLL3 deficient cells (Fig. 4e, Supplementary Table 3). Notably, 140 protein-coding genes are down-regulated (p < 0.01, Fold change > 2) in all 3 MLL3 deficient cells (Supplementary Table 4), whereas only 7 genes are consistently up-regulated. This suggests that BAP1-dependent MLL3 recruitment to enhancers predominantly positively regulates gene expression.
Figure 4. MLL3 regulates tumor suppressor expression from BAP1-depdendent enhancers.
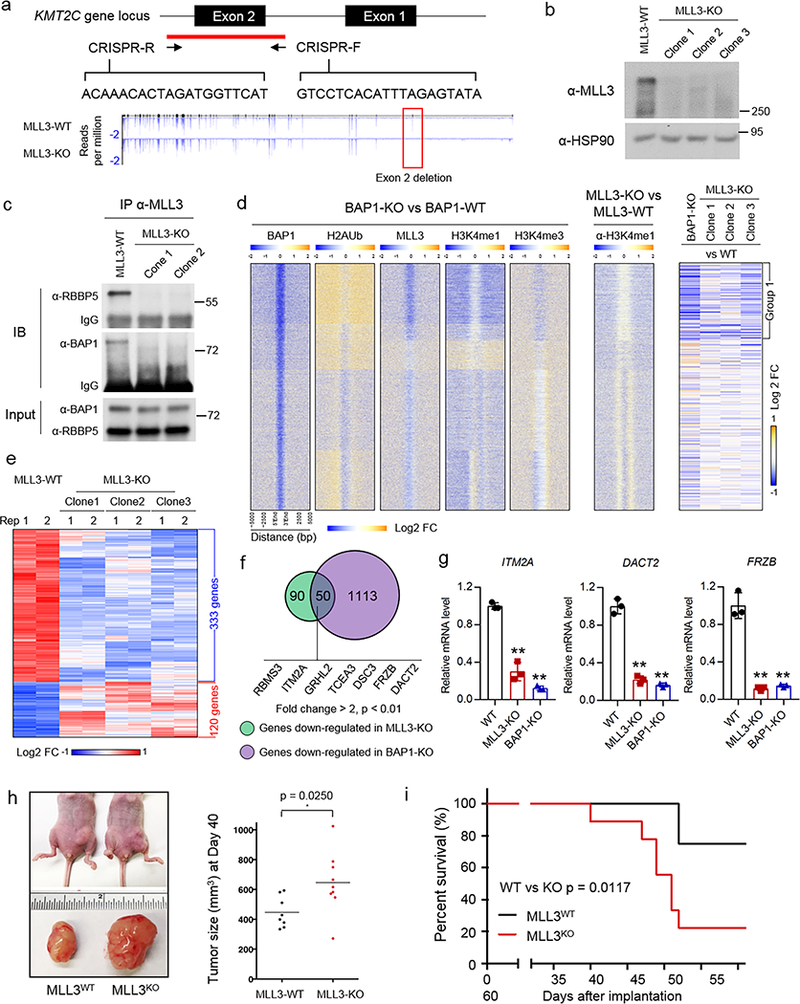
a) Top, schematic of the human KMT2C gene locus and the CRISPR gRNA designed to target exon 2 of the KMT2C gene. Bottom, RNA-seq was performed in MLL3-WT and MLL3-KO cells, and the representative tracks show the depletion of exon 2 (red box) in MLL3-KO cells, n=2. b) MLL3 levels in whole-cell lysates of MLL3-WT and three independent MLL3-KO cells, as assessed by immunoblotting. HSP90 was used as a loading control, n=3. c) The interaction between MLL3 and BAP1 in cell lysates form MLL3-WT and two MLL3-KO cells, as assessed by immunoprecipitation followed by immunoblotting. The core COMPASS subunit RBBP5 was used as a control, n=3. d) The heat map shows log2 fold changes of the occupancy levels of BAP1, H2Aub, MLL3, H3K4me1 and H3K4me3 between BAP-1 KO and BAP-1 WT cells (left) and between MLL3 KO and MLL3 WT cells (middle). Rows are ordered as in Figure 4c. Right, the log2 fold change of nearby gene expression in BAP1-KO cells or MLL3-KO cells as compared to WT cells. e) Heat map showing the common downstream genes in three different MLL3-KO clones. f) Venn diagram showing genes that are down-regulated by both MLL3 and BAP1 loss (p < 0.01, fold change > 2), n=2, P-value from a two-tailed unpaired t-test is shown. Examples of tumor suppressors are shown. g) Expression levels of ITM2A, DACT2 and FRZB as assessed by real-time PCR in wild-type, MLL3-KO and BAP1-KO cells. Data are presented as mean ± sd.; n = 3 independent experiments; two-tailed unpaired Student’s t-test. h) Left, photographs of nude mice (top) and fat pads taken from these mice (bottom) in which 4×10⁶ of MLL3-WT or MLL3-KO breast cancer cells were inoculated into the fat pad. Right, tumor growth in animals at 40 days after inoculation (n=10), P-value from log-rank (Mentel-Cox) test is shown. i) Animal survival at the indicated days after inoculation. Two-tailed unpaired Student’s t test was used for statistical analysis. Image representative of at least two independent experiments. Uncropped images in Supplementary Figure 13.
We also evaluated whether MLL3 regulates BAP1 chromatin binding. BAP1 occupancy is not altered in MLL3-KO cells suggesting that it can bind chromatin independently of the MLL3 complex (Supplementary. Figure 5g). Pathway analysis by Metascape34 demonstrated that genes downregulated upon MLL3 loss are enriched for the epithelial cell differentiation pathway function (Supplementary Fig. 6a, Supplementary Table 5). This suggests MLL3 deficiency may disrupt normal epithelial differentiation and lead to malignant migratory phenotypes through increased epithelial mesenchymal transition (EMT). For instance, the transcription factor GRHL2, which suppresses oncogenic EMT in breast cancer, is almost completely silenced in MLL3-KO cells. GSEA pathway analysis also indicated similar pathway enrichment for MLL3 downstream genes (Supplementary Table 6). We then asked whether MLL3 and BAP1 regulate a common set of genes and found that MLL3 and BAP1 positively co-regulate the expression of 50 genes (p < 0.01, Fold change > 2) (Fig. 4f, Supplementary Table 7).
Interestingly, many of the down-regulated genes in both MLL3 and BAP1 knockout cells are known tumor suppressors, such as RBMS335, ITM2A36, GRHL237, TCEA338, DSC339, FRZB40, and DACT241 (Fig 4f and Supplementary Fig. 6b, c). We confirmed mRNA down-regulation for ITM2A, DACT2 and FRZB using real time PCR analysis (Fig. 4g). According to Metascape analysis, epithelial cell differentiation is the most enriched pathway down-regulated upon loss of MLL3 and BAP1 (Supplementary Fig. 6d). Consistent with this observation, depletion of MLL3 promotes cell growth and colony formation ability in vitro (Supplementary Fig. 6e-f). Moreover, loss of MLL3 significantly accelerates tumor growth in vivo and shortens animal survival (Fig. 4h, i)
The histone H3K27 demethylase, UTX, a component of MLL3-COMPASS is bound to enhancers in a BAP1-dependent manner.
Recent studies have addressed the relationship between BAP1 and PRC2 expression in cancer42–44. Deletion of BAP1 in mouse bone marrow results in increased EZH2 expression and elevated H3K27me3. However, in human uveal melanoma (UM), EZH2 levels are not affected by BAP1 loss. Therefore, the context and mechanism through which BAP1 affects PRC2 complex expression and H3K27me3 levels are likely cell-type specific. The H3K27me3 demethylase UTX, KDM6A, is a core subunit of MLL3 COMPASS11,13, therefore we hypothesized that BAP1 might also be involved in controlling UTX’s H3K27me3 demethylase activity at enhancers.
To explore the potential connection between BAP1 and UTX, we assayed H3K27me3 levels in our BAP1-WT and KO cells. Histone H3K27me3 levels are increased in BAP1-KO cells (Fig. 5a), consistent with previous studies. However, we were surprised to find that the levels of the PRC2 subunits EZH2 and SUZ12 were not significantly increased as the result of BAP1 loss (Fig. 5a). By contrast, UTX protein levels are reduced in BAP1 KO cells (Fig. 5a). This effect was reproducible in another breast cancer line (MCF7) using shRNAs against BAP1 (Fig. 5b). RNA-seq analysis demonstrated that EZH2 and UTX mRNA levels are not altered by BAP1 depletion (Supplementary Fig. 7a, b). Therefore, the increased H3K27me3 observed in BAP1-KO cells is not the result of increased expression of PRC2 but rather due to diminished UTX occupancy as the result of loss of MLL3 COMPASS interaction with chromatin.
Figure 5. BAP1 depletion leads to increased H3K27me3 due to loss of MLL3 COMPASS containing UTX from chromatin.
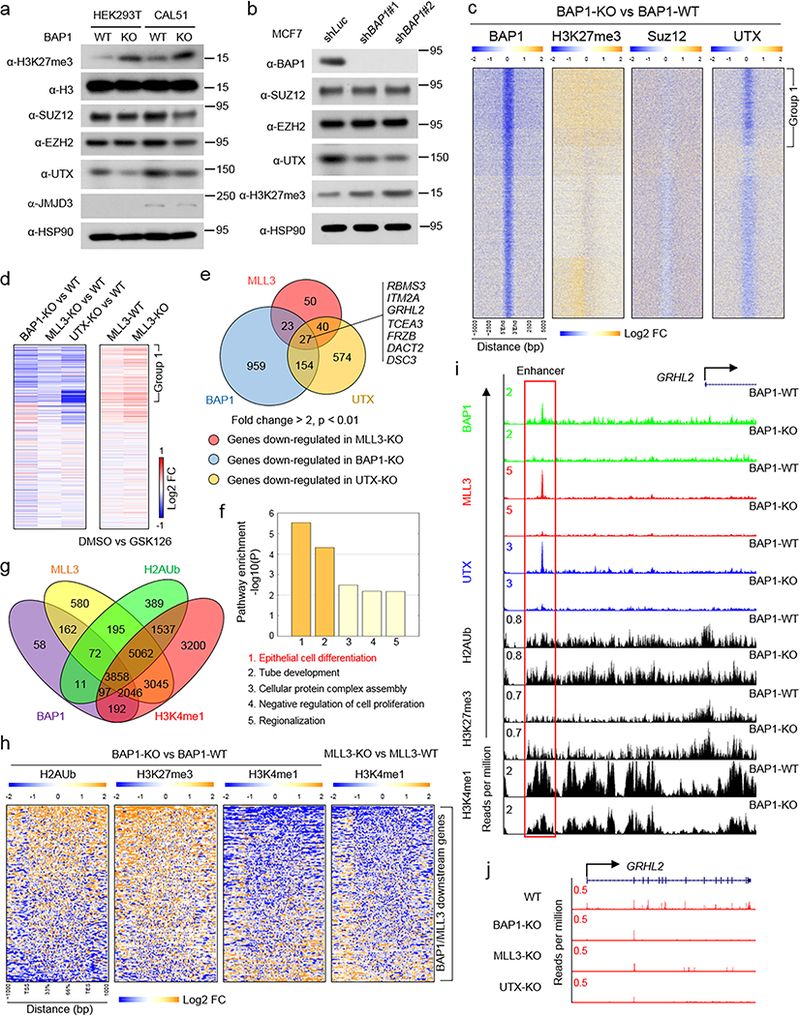
a) Levels of H3K27me3, SUZ12, EZH2, JMJD3 and UTX in whole-cell lysates from HEK293T-BAP1-WT, HEK293T-BAP1-KO, CAL51-BAP1-WT and CAL51-BAP1-KO cells, as assessed by immunoblotting. Histone H3 and HSP90 were used as loading controls, n=3. b) Levels of BAP1, SUZ12, EZH2, H3K27me3 and UTX in whole cell lysates of MCF7-shNONT and MCF7-shBAP1 cells, as assessed by immunoblotting, n=3. c) ChIP-seq analysis of H3K27me3, SUZ12 and UTX binding in BAP1-WT and BAP1-KO cells. Rows in the heat maps are centered on BAP1 peaks and show the log2 fold change of occupancy of H3K27me3, SUZ12 and UTX at BAP1 binding regions. d) RNA-seq was performed for wild-type cells, BAP1-KO cells, UTX-KO cells and MLL3-KO cells (left panel), and for MLL3-WT and MLL3-KO cells treated with DMSO or GSK126 (right panel). Left panel, the heat maps show the log2 fold change in expression for the nearest gene of the indicated peaks comparing BAP1-KO, MLL3-KO or UTX-KO cells with wild-type cells. Right panel, the heat maps show the log2 fold change in expression for the nearest gene of the indicated peaks comparing MLL3-WT and MLL3-KO cells treated with DMSO or GSK126. e) Comparison of gene expression between MLL3-KO, BAP1-KO and UTX-KO cells (fold change > 2, p < 0.01). Each circle refers to down-regulated genes in BAP1-KO, MLL3-KO or UTX-KO. Examples of common target genes of BAP1, MLL3 and UTX are shown, n=2. f) Pathway enrichment analysis showing down-regulated genes in common among MLL3, UTX and BAP1 KO cells, n=2. g) Venn diagram showing common genes nearest MLL3, BAP1, H3K4me1 and H2Aub peaks in wild-type CAL51 cells. h) Heat map showing fold-changes of H2Aub, H3K27me3 H3K4me1 occupancy at gene loci that are co-regulated by BAP1 and MLL3 in BAP1-WT and BAP1–KO cells (left three panels). Right, H3K4me1 occupancy at gene loci that are co-regulated by BAP1 and MLL3 in MLL3-WT and MLL3–KO cells. i) Representative tracks showing occupation of the enhancer region within the GRHL2 gene by BAP1, MLL3 and UTX, n=2. j) GRHL2 gene expression levels in wild-type, MLL3-KO, BAP1-KO and UTX-KO cells, as assessed by RNA-seq, n=2. Image representative of at least two independent experiments. Uncropped images in Supplementary Figure 14.
To determine the effect of BAP1 loss on UTX chromatin occupancy, we generated antibodies towards UTX (Supplementary Fig. 7c-h). We analyzed chromatin occupancy for UTX, SUZ12 and H3K27me3 in BAP1-WT and KO cells (Fig. 5c, Supplementary Fig. 7i). Loss of BAP1 resulted in increased H3K27me3 levels as detected by ChIP-seq at Group 1 loci where MLL3 occupancy is most strongly diminished (Fig. 3g). Notably, increased H3K27me3 levels correlate with loss of UTX binding, whereas SUZ12 subunit of PRC2 occupancy is unchanged at these sites (Fig 5c, Supplementary Fig. 7j and Supplementary Fig. 8a).
RNA-seq analysis revealed that UTX-KO cells display similar changes in gene expression to MLL3-KO and BAP1-KO cells with down-regulation of genes in Group 1 (Fig. 5d, left panel). In total, there are 27 protein-coding genes co-regulated by MLL3, UTX and BAP1 that exhibit more than a two-fold change in knockout cells (Supplementary Table 8). To test if H3K27me3 is directly involved in controlling these co-regulated genes, we treated cells with the EZH2 inhibitor GSK126. Remarkably, EZH2 catalytic inhibition largely rescues the gene expression defects in the mutant cells (Fig 5d, right panel). We identified many tumor suppressor genes controlled by MLL3, BAP1 and UTX (Fig. 5e, f). There are 3,858 genes associated with common MLL3, BAP1, H3K4me1 and H2Aub peaks, and all MLL3-BAP1 target genes are occupied by MLL3, BAP1 and the indicated histone marks (Fig. 5g). The majority of MLL3 and BAP1 downstream genes are directly controlled by MLL3 and BAP1, and loss of BAP1 or MLL3 dramatically affected the histone modifications at those loci (Fig. 5h). For instance, BAP1 loss leads to decreased MLL3 and UTX occupancy at the enhancers of the GRHL2 gene coincident with increased H3K27me3 (Fig 5i, Supplementary Fig. 8b-d), and decreased gene expression (Fig. 5j). ChIP-seq analysis confirmed that UTX depletion increases H3K27me3 levels at the enhancers of these tumor suppressor genes (Supplementary Fig. 8e-h). These results are further validated by ChIP-QPCR (Supplementary Fig. 8i, j). These results suggest that BAP1 influences UTX stability through an interaction mediated via the MLL3 PHD repeats.
To investigate the relationship between MLL3, BAP1 and UTX, we performed size-exclusion chromatography analyses45 with nuclear extracts isolated from MLL3-WT and MLL3-KO cells. As predicted by our purifications, BAP1 co-elutes with UTX protein in fractions 20–23, peaking at fraction 21 (Supplementary Figure 9a). However, MLL3 deficiency results in an altered pattern of BAP1 elution profile (towards smaller size fractions) from the size exclusion column in fractions 21–25 and peaking in fraction 23 (Supplementary Fig. 9a). Furthermore, the BAP1 complex is also observed as a top interactor with Flag-tagged UTX purifications from HEK293T cells (Supplementary Fig. 9b). Lastly, depletion of MLL3 but not MLL4 affects the interactions between UTX and BAP1 (Supplementary Fig.9c-f).
MLL3-PHD mutations sensitize cancer cells to PRC2 inhibition:Resetting the epigenetic balance of Polycomb and COMPASS for cancer therapy.
We observed that EZH2 catalytic inhibition restores the expression of many genes that are down-regulated by depletion of MLL3, UTX and BAP1 depletion (Fig. 5d right panel). Indeed, approximately 80% of MLL3-KO down-regulated genes are rescued by GSK126 treatment (Fig. 6a), suggesting they are direct PRC2 target genes. Two tumor suppressor genes, FRZB and GRHL2, silenced in MLL3-KO cells are fully rescued by GSK126 treatment (Fig. 6b). Furthermore, H3K27me3 levels were increased at the vast majority of MLL3 target genes after MLL3-KO (Fig. 6c) and were reduced again upon GSK126 treatment (Fig. 6d, Supplementary Fig. 10a).
Figure 6. Mutations within MLL3-PHD domain sensitize cells to PRC2 inhibition.
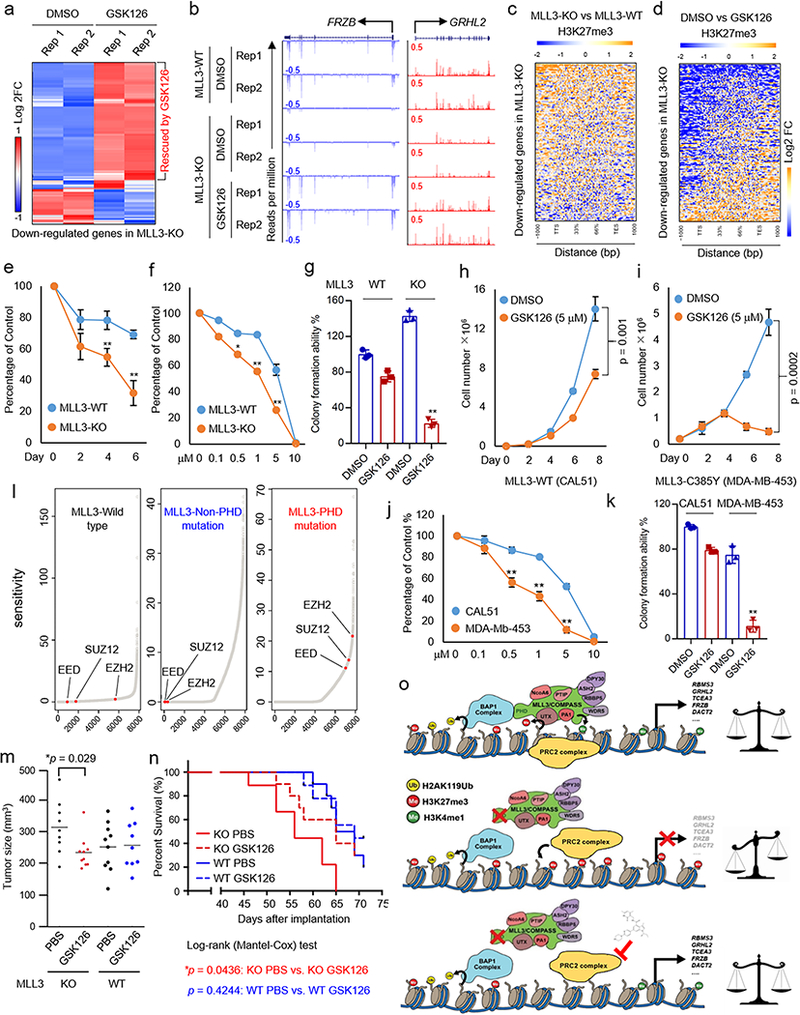
a) RNA-Seq analysis in MLL3-WT and KO cells treated with or without the EZH2 inhibitor GSK126 (5 μM) for four days. The heat map shows the log2 fold change induced by GSK126 of all the genes down-regulated in MLL3-KO cells. b) Representative RNA-seq tracks showing the expression of genes for which the effects of MLL3 loss are rescued by GSK126, n=2. c) Heat map showing the fold-change of H3K27me3 occupancy at genes in (a) between MLL3-KO and MLL3-WT cells. d) Heat map showing the fold-change of H3K27me3 occupancy at genes in (a) between GSK126 and DMSO treatment in MLL3-KO cells. e) Cell viability of MLL3-WT and KO cells treated with 5 μM of GSK126 for the indicated number of days, as determined by cell counting. Data are presented as mean ± sd.; n = 3 independent experiments; two-tailed unpaired Student’s t-test. **P < 0.01; *P < 0.05. f) Cell viability of MLL3-WT and KO cells treated with the indicated concentrations of GSK126 for eight days, as determined by cell counting. The culture medium and drug were replaced every two days. Data are presented as mean ± sd.; n = 3 independent experiments; two-tailed unpaired Student’s t-test. **P < 0.01; *P < 0.05. g) 104 of MLL3-WT and KO cells were seeded in a 6-well plate and cultured for two weeks in the presence of DMSO or GSK126. Colony forming ability of the cells was determined by crystal violet staining. Data are presented as mean ± sd.; n = 3 independent experiments; two-tailed unpaired Student’s t-test. **P < 0.01. (h, i) Cell numbers of CAL51 cells (MLL3-WT) (h) and MDA-MB-453 cells (MLL3-C385Y) (i), as determined by cell counting. 105 cells were seeded in 6-well plates and cultured for the indicated times in the presence of DMSO or GSK126, n=3. Data are presented as mean ± sd.; n = 3 independent experiments; P-value from a two-tailed unpaired t-test is shown. j) Cell viability of CAL51 and MDA-MB-453 cells treated with the indicated concentrations of GSK126 for eight days, as determined by cell counting. The culture medium and drug were replaced every two days. Data are presented as mean ± sd.; n = 3 independent experiments; two-tailed unpaired Student’s t-test. **P < 0.01; *P < 0.05. k) 104 of CAL51 cells (MLL3-WT) and MDA-MB-453 (MLL3-C385Y) cells were seeded in a 6-well plate and cultured for two weeks in the presence of DMSO or GSK126. Colony forming ability of the cells was determined by crystal violet staining, n=3. Data are presented as mean ± sd.; n = 3 independent experiments; two-tailed unpaired Student’s t-test. **P < 0.01. l) The ranked dependency (or sensitivity) reflects the impairment of growth and survival of cancer cells due to the inactivation of EZH2, SUZ12 and EED in three different breast cancer cell lines, MDA-MB-453 (MLL3-PHD domain mutation), MDA-MB-463 (MLL3-WT) and T47D (MLL3-Non-PHD domain mutation). The sensitivity score was calculated based on the data downloaded from the Project Drive (see Methods). (m, n) Tumor size after inoculation of 4×10⁶ of MLL3-WT of MLL3-KO breast cancer cells into the fat pad of nude mice. Two weeks after transplantation, the animals were treated with either PBS or GSK126 (50 mg/kg) for ten days. m) Tumor size at Day 40 after transplantation, n=10. P-value from log-rank (Mentel-Cox) test is shown. n) Animal survival at the indicated days after inoculation. Two-tailed unpaired Student’s t test was used for statistical analysis. o) Model. BAP1 controls tumor suppressor gene expression by binding to enhancer chromatin and removing H2Aub to facilitate transcription. The BAP1 complex recruits MLL3 COMPASS to enhancers and catalyzes the formation of H3K4me1. Moreover, the UTX subunit within MLL3 COMPASS is stabilized by BAP1 and removes H3K27me3 at enhancers of the indicated genes. In cancers bearing mutations in the MLL3-PHD domain, the MLL3 COMPASS complex, including the H3K27me3 demethylase UTX, is not recruited to BAP1-dependent enhancers, leading to increased H3K27me3 and resulting in the silencing of tumor suppressors such as FRZB, GRHL2 and DACT2. In MLL3 mutant cancer cells, EZH2 inhibition reduces the H3K27me3 levels and resets tumor suppressor expression. This approach is a promising therapeutic tool for regulating the balanced state of gene expression in cancer.
We therefore hypothesized that PRC2 inhibition might be a useful therapeutic tool to reset the loss in the Polycomb and COMPASS balanced state of gene expression at these loci in MLL3 mutant cancer cells. Indeed, MLL3 loss significantly sensitizes tumor cells to EZH2 inhibition (Fig. 6e-g, Supplementary Fig. 10b). To investigate the drug sensitivity of other tumor cells containing MLL3 mutations, we used a breast cancer cell line MDA-MB-453, which contains a heterozygous MLL3-PHD mutation (C385Y) that disrupts interaction with BAP1 (Supplementary Fig. 10c, d). Interestingly, we found that even in the heterozygous cells the interaction between MLL3 and BAP1 is largely reduced (Supplementary Fig. 10e). GSK126 treatment of MLL3-WT (CAL51) and mutant (MDA-MB-453) cells revealed that mutational status correlates with increased GSK126 sensitivity (Fig. 6h-k, Supplementary Fig. 10f).
To establish a direct link between MLL3 PHD mutations and EZH2 inhibitor sensitivity, we used CRIPSR-Cas9 to generate HEK293T cell lines carrying glycine-368-to-valine (G368V) or tryptophan-383-to-leucine (W383L) mutations (Supplementary Fig. 10g). The interaction between BAP1 and MLL3 is largely reduced in these cells (Supplementary Fig. 10h), which is consistent with our observations in MDA-MB-453 cells. To investigate whether mutations within the MLL3-PHD domain also contribute to gene expression silencing, we performed RNA-seq in MLL3-WT, MLL3-G368V and MLL3-W383L cells. As shown in Supplementary Fig. 10i-j, we found that there are 484 genes significantly down-regulated and only 41 genes up-regulated common to both KI cell lines, which is consistent with our previous finding that MLL3 acts primarily as an activating factor (Fig. 4e). Consistent with these decreases in gene expression, point mutations within the MLL3-PHD domain lead to a global increase of H3K27me3 at non-TSS regions (Supplementary Fig. 10k). We also compared the gene expression profile between MLL3-KO and MLL3-KI cells, and found that the gene expression profile is similar (Supplementary Fig. 10l). These results suggested that the PHD-domain mutations may lead to loss of function of MLL3.Moreover, the G368V and W383L HEK293T cells are more sensitive to EZH2 inhibitor treatment than wild-type counterparts (Supplementary Fig. 10m).
We retrieved cancer dependency and synthetic lethal relationship data from Project Drive 46 and calculated the dependency of EZH2, SUZ12 and EED in three different breast cancer cell lines, MDA-MB-453 (MLL3-PHD domain mutation), MDA-MB-463 (MLL3-WT) and T47D (MLL3-Non-PHD domain mutation). Cells with MLL3-PHD domain mutation are more sensitive to the depletion of all the three PRC2 components compared to MLL3-WT and –non PHD domain mutation cell lines (Fig. 6l).
We next tested whether MLL3-WT cancer cells, which are resistant to EZH2 inhibitor treatment in vitro but become drug-sensitive after MLL3 depletion (Fig. 6e), exhibit similar properties in an animal model. We injected MLL3-WT and MLL3-depleted cells in nude mice and treated the animals with GSK126 in vivo. Treatment of MLL3 deficient cells with EZH2 inhibitor significantly reduced tumor size and extended overall survival (Fig. 6m, n). Taken together, our result suggests that in mammals, BAP1 controls the expression of tumor suppressor genes by binding to enhancer chromatin and removing H2Aub to facilitate transcription (Fig. 6o, upper panel). The BAP1 complex recruits MLL3 COMPASS through interactions with its PHD domain to enhancers to catalyze H3K4me1. Moreover, the UTX subunit within MLL3 COMPASS is stabilized by BAP1 and further removes H3K27me3 at the indicated enhancers (Fig. 6o, upper panel). Under this wild-type situation, the activities of PRC2, MLL3 COMPASS and the BAP1 complex at enhancer chromatin can be considered balanced (Fig. 6o, upper panel). In cancers with mutations in the MLL3-PHD domain (Fig. 6o, middle panel), the complex is not recruited to BAP1-dependent enhancers and the absence of UTX on chromatin result in an unbalanced epigenetic state of enhancer chromatin via an increased H3K27me3 levels on these loci and silencing of tumor suppressors such as RBMS3, GRHL2 and DACT2 (Fig. 6o, middle panel). To balance the epigenetic state of gene expression in the MLL3 mutant cancer cells, EZH2 inhibition reduces the H3K27me3 levels and resets tumor suppressor expression (Fig. 6o, lower panel). We propose that this approach is a promising therapeutic tool for regulating the balanced state of gene expression in cancer caused as the result of COMPASS or PRC2 mutations.
Discussion
In this study, we define a previously uncharacterized chromatin-based tumor suppressor pathway linking MLL3 and UTX-containing COMPASS with the BAP1 and ASXL complex and provide a therapeutic approach for the treatment of cancers caused as the result of mutations in the subunits of these complexes. We found that cancer hotspot mutations in the MLL3 amino terminal PHD repeats disrupt its association with the BAP1 complex and result in reduced MLL3 and UTX recruitment to enhancers misregulating the epigenetic chromatin state at these loci. Thus, MLL3 PHD mutations expose a vulnerability to EZH2 inhibitor therapy through de-repression of tumor suppressors.
Our study reveals a number of intriguing aspects regarding the role of the MLL3 and MLL4 branches of the COMPASS family in human cancer. For instance, MLL4’s SET-domain is highly mutated in human cancer, however, not all of these mutations significantly reduce MLL4 catalytic activity18,19. This situation parallels the MLL3 mutations examined in this study, where not all of the mutations abrogate binding between MLL3 and the BAP1 complex (Fig. 2). In fact, the crystal structure (PDB: 2YSM) of MLL3-PHD2–3 reveals that those mutations that are important for MLL3-BAP1 complex binding, are closely associated with the zinc atoms, which help maintain the structure of PHD fingers (Supplementary Fig. 10n).
Notably, BAP1 selectively associates with MLL3 but not with MLL4 indicating a bifurcation in the function of these complexes. Future experiments will address whether these differences reflect tissue-specific functions or if perhaps MLL4 recruits as yet uncharacterized co-factors to mediate BAP1-like activities. Interestingly, a very recent study reported that AKT1 binds to the MLL4-PHD domain and phosphorylates Serine 1331 of MLL47. Phosphorylation of the PHD domain affects MLL4 catalytic activity but not MLL4 occupancy at chromatin, indicating that the function of the MLL3 and MLL4 PHD domains may be distinct. Nevertheless, our studies suggest that modifications or mutations within the PHD domain of MLL3 or MLL4 COMPASS can affect H3K4me1 levels and enhancer activity through different mechanisms.
Comparison of gene expression changes in MLL3, BAP1 and UTX mutant cancer cells revealed a striking overlap in target genes. In particular, several tumor suppressor genes are all positively co-regulated by these three factors. In our model (Fig. 6o), MLL3 COMPASS is recruited to its targets through interactions with BAP. Therefore, how the BAP1 complex is specifically targeted to these tumor suppressors is an important question. According to our motif analysis, we found both MLL3 and BAP1 enriched motifs are similar to the ETS motif, which is consistent with previous studies33. These findings suggest that ETS family factors play a role in recruiting the complex in the context of multiple cancer types.
Our study identifies an MLL3-UTX-PRC2 regulatory axis as a target for therapeutic treatment through small molecule EZH2 inhibition. Interestingly, both EZH2 and the MLL3 genes reside on chromosome 7q36, a region (7q36) that is frequently gained or amplified in multiple human cancers48. Indeed, according to Cbio49,50 analysis, EZH2 and MLL3 genes are usually co-amplified in numerous human cancers. These observations further support the possibility of EZH2 as a therapeutic target for MLL3 mutant cancers and points to a potential role for EZH2 inhibition therapy in cancers harboring COMPASS mutations by resetting the PcG and COMPASS balanced state of gene expression.
Materials and Methods
Antibodies
BAP1 (For western blot and IP) (#13271S), H3K27me3 (#9733S), SUZ12 (#3737S), EZH2 (#5246S), UTX (#33510), H3K27me3 (#9733), H3K27ac (#8173), H2AK119ub (#8240), H2A (#12349) and JMJD3 (#3457S) antibodies were purchased from Cell Signaling. HSP90 (sc-7947) was purchased from Santa Cruz, M2 Flag (F3165) and HA (H3663) were purchased from Sigma. ASXL2 (A302–037A) and RBBP5 (A300–109A) antibodies were purchased from Bethyl Laboratories. Anti-MLL3 (for western blot and IP) was generated against human MLL3 amino acids, and anti-MLL4 was described previously51. Anti-BAP1 (for ChIP-seq) was generated against recombinant full-length BAP1 (α-BAP1-FL) or the aa 10–360 of BAP1 protein (α-BAP1-NTD) in house. Anti-MLL3 (for ChIP-seq) was generated against the aa 443–590 (α-MLL3-NTD) or aa 2951–3091 (α-MLL3-MR) of MLL3 protein in house.
Cell Lines and RNA Interference
HEK293T, MDA-MB-231, MDA-MB-453 and MCF7 cells were obtained from ATCC, CAL51 cells were obtained from Leibniz Institute DSMZ-German Collection of Microorganisms and Cell Cultures. All these cells are maintained with DMEM (Gibco, Gaithersburg, MD) containing 10% FBS (Sigma). For shBAP1 infection, the cells were infected with lentivirus containing short-hairpin RNAs in the presence of 4 μg/ml Polybrene (Sigma) for 24 hr in DMEM supplemented with 10% FBS. The infected cells were selected with 2 μg/ml puromycin for an extra 48 hours before harvest. The shBAP1 constructs were purchased from GE openbiosystem (RHS4531-EG8314).
CRISPR-mediated Knockouts and Knockins
sgRNAs were designed with CRISPRtool (http://crispr.mit.edu) and then cloned into px330 (Addgene, 42230) or lentiCRISPR v2 (Addgene, 52961) vector. Targeting vector and ssDNA donor were co-transfected in cells for 24 hours and followed by 2 days of puromycin selection. Targeted single cell clones were screened by PCR with primers as follows, forward: 3’- GCTGAGAAGGGGAGTTGTCC-5’, reverse: 3’- GATGAAGGCACTGCAGCCTA-5’ (BAP1); forward: 3’-AGACCTCGAAGTAGGGGGAA-5’, reverse: 3’-ACAAGGCAGATGGGAAACTTA-5’ (MLL3-Exon 2); forward: 3’-GGTCTCAAGTAGATATAGC-5’, reverse: 3’- AGCTCTTTAGACGACCAGAG-5’ (MLL3-Exon 8); forward: 3’-GCCTCTTTGGGTTCGTGAGA-5’, reverse: 3’-ATAGTTTCCGGAAGCCCCTC-5’ (UTX).
ChIP-QPCR
ChIP-QPCR was performed as described before. Primers are as follows, forward: 3’-GCAACAGTGCATTTCTCCCC-5’, reverse: 3’-GTGGGCTAAGTGCAGGAAGT-5’ (CLIC5 enhancer); forward: 3’-AGGGGGATCATGTCCCAGAA-5’, reverse: 3’-AGTCCCTAGACACATGCCCT-5’ (GRHL2 enhancer); forward: 3’-ACAGGACTGGCTAAACGCAA-5’, reverse: 3’-AGGTGCAAATGCTGCCCTAT-5’ (DACT2 enhancer); forward: 3’-CCCTAGCAGGGCAGTTTCAG-5’, reverse: 3’-TGAGAACCACTGCAACCGAG-5’ (RBMS3 enhancer); forward: 3’-GCGGGACTAGCAGGAGATTG-5’, reverse: 3’-CGCCTTCCGCCCTGAATATG-5’ (BTD promoter).
NGS Sample Preparation
ChIP-sequencing libraries were prepared using the KAPA HTP Library Preparation Kit complemented with NEXTflex DNA Barcodes from Bioo Scientific. 10 ng of DNA was used as starting material for input and ip samples. Libraries were amplified using 13 cycles on the thermocycler. Post amplification libraries were size selected at 250–450 bp in length using Agencourt AMPure XP beads from Beckman Coulter. Libraries were validated using the Agilent High Sensitivity DNA Kit. RNA-sequencing libraries were prepared using the Illumina TruSeq Stranded Total RNA Preparation Kit with Ribo-Depletion. Input RNA quality was validated using the Agilent RNA 6000 Nano Kit. 1 μg of total RNA was used as starting material. Libraries were validated using the Agilent DNA 1000 Kit.
RNA-seq Analysis
Gene counts were computed by HTSeq52 and used as input for edgeR 3.0.853. Genes with Benjamini-Hochburg adjusted p-values less than 0.01 were considered to be differentially expressed unless otherwise specified. RNA-seq heatmaps adjacent to ChIP-seq heatmaps display log2 fold change values of genes corresponding to TSSs nearest to ChIP-seq peaks and were displayed using Java Treeview54. GO functional analysis was carried out using Metascape with default parameters34.
ChIP-seq Analysis
The ChIP-seq was performed as previously described before51. For ChIP-seq analysis, BAP1 peaks in both BAP1-wildtype and BAP1-knockout conditions were called with the MACS v1.4.2 software55 using default parameters and corresponding input samples. De novo motif analysis was performed with Homer56. Metaplots and heatmaps were generated using ngsplot57 display ChIPseq signals aligned to peaks. The GREAT online software suite was used to analyze cis-regulatory function for select clusters58.
Crystal Violet Staining
Cells were stained with 0.5% crystal violet staining solution and incubated for 20 min at room temperature on a bench rocker with a frequency of 20 oscillations per minute. Plates were washed four times in a stream of tap water followed by air-drying for 2 hours at room temperature. 200 μL of methanol was added to each well, and plates were incubated with the lid on for 20 min at room temperature on a bench rocker with a frequency of 20 oscillations per minute. Optical density of each well at 570 nm (OD570) was measured with a plate reader.
Mass Spectrometry
For Orbitrap Fusion Tribrid MS analysis, the tryptic peptides were purified with Pierce C18 spin columns (Thermo Scientific). Three micrograms of each fraction was auto-sampler loaded with a Thermo EASY nLC 1000 UPLC pump onto a vented Acclaim Pepmap 100, 75um × 2cm, nanoViper trap column coupled to a nanoViper analytical column (Thermo- 164570, 3μm, 100Å, C18, 0.075mm, 500mm) with stainless steel emitter tip assembled on the Nanospray Flex Ion Source with a spray voltage of 2000V. Buffer A contained 94.785% H2O with 5% ACN and 0.125% FA, and buffer B contained 99.875% ACN with 0.125% FA. The chromatographic run was for 2 hours in total with the following profile: 0–7% for 3 minutes, 10% for 3 minutes, 25% for 80 minutes, 33% for 20 minutes, 50% for 3 minutes, 95% for 3 minutes and again 95% for 8 minutes. Additional MS parameters include: Ion transfer tube temp = 300°C, Easy-IC internal mass calibration, default charge state = 2 and cycle time = 3 seconds. Detector type set to Orbitrap, with 60K resolution, with wide quad isolation, mass range = normal, scan range = 300–1500 (m/z), max injection time = 50ms, AGC target = 200,000, microscans = 1, S-lens RF level = 60, without source fragmentation, and datatype = centroid. MIPS was set as on, included charge states = 2–6 (reject unassigned). Dynamic exclusion enabled with n = 1 for 30 seconds and 45 second exclusion duration at 10 ppm for high and low. Precursor selection decision = most intense, top 20, isolation window = 1.6, scan range = auto normal, first mass = 110, collision energy 30%, CID, Detector type = ion trap, OT resolution = 30K, IT scan rate = rapid, max injection time = 75 ms, AGC target = 10,000, Q=0.25, inject ions for all available parallelizable time.
Animal experiments
All animal work was performed in accordance with protocols approved by The Center for Comparative Medicine (CCM) of Northwestern University. Athymic nude mice at 5–6 weeks old were used for xenograft experiments. For tumor growth assay, 4×10⁶ breast cancer cells were inoculated into the fat pad of nude mice. Tumor growth was monitored every other day two weeks after inoculation. For treatment assay, 4×10⁶ breast cancer cells were inoculated into the fat pad of nude mice. When the tumor reached to 100 mm3, mice were randomly divided into two groups. They were treated with either PBS or GSK126 (50 mg/kg) for 10 times, and the tumor size and animal survival was monitored. Tumor growth was measured two weeks after inoculation
Statistical analyses
For statistical analyses, GraphPad Prism 6, Microsoft Excel and R were used. All the data where a statistical analysis was reported meet the criteria to use the appropriate statistical test (for the normal distribution of data, the empirical rule was used to infer the distribution. For growth curves and time-course, RNA-seq t tests were calculated between the area-under-the-curve (AUC) values. Statistical tests used are reported in the figure legends.
PRC2 Dependency Analysis
The plasmid and sample raw counts of sgRNA for cell lines from Project DRIVE46 were downloaded and analyzed using an in-house script. The plasmid and sample raw counts per shRNA were normalized in pairs using Trimmed Mean of M-values (TMM) normalization. We used the published MAGeCK (model-based analysis of genome-wide CRISPR–Cas9 knockout) scoring algorithm59 to rank the log-transformed sensitivity score of each gene for each cell line.
Code Availability
Custom scripts for analyzing next generation sequencing data will be made available upon request.
Data Availability
Next generation sequencing data generated for this study are available at the Gene Expression Omnibus (GEO) under accession number GSE97326.
Supplementary Material
Acknowledgments
We would like to thank Dr. Feng Zhang for the kind gifts of the Px330 and lentiCRISPR v2 vectors. Dr. Lu Wang is supported by the Training Program in Signal Transduction and Cancer (T32 CA070085). Dr. Zibo Zhao is supported by the Robert H. Lurie Comprehensive Cancer Center – Translational Bridge Program Fellowship in Lymphoma Research. Dr. Edwin Smith is supported by NCI grant R50CA211428. Studies in the laboratory of Dr. Jeffrey Savas are supported by NIDCD grant DC013805. Studies in the Shilatifard laboratory related to COMPASS are supported by NCI’s Outstanding Investigator Award R35CA197569.
Footnotes
AUTHOR CONTRIBUTIONS
L.W. and A.S. designed the study. L.W. and Z.Z. performed the majority of the experiments, part of the analyses and wrote the first draft of the manuscript. R.H., N.L., X.H., L.W. and A.S. designed the in vivo studies. R.H., N. L. and X.H. performed and analyzed the in vivo experiments. S.A.M and E.J.R generated and sequenced the NGS libraries. K.A.C and J.N.S performed the mass spectrometry experiments and analyzed the results. C.K.C performed the initial bioinformatics analyses on the studies related to the role of BAP1 and MLL3 at enhancers. P.A.O performed all the other bioinformatics analyses. J.J.M provided clinical supervision in the interpretation of data. L.Z. and D.F. performed clinical data analysis. P.N. helped with UTX ChIP-seq. Y.T performed size exclusion. L.W., Z.Z., M.A.M., E.R.S. and A.S. revised the manuscript.
References
- 1.Morgan MA & Shilatifard A Chromatin signatures of cancer. Genes & Development 29, 238–249, doi: 10.1101/gad.255182.114 (2015). [DOI] [PMC free article] [PubMed] [Google Scholar]
- 2.Plass C et al. Mutations in regulators of the epigenome and their connections to global chromatin patterns in cancer. Nature Reviews Genetics 14, 765–780, doi: 10.1038/nrg3554 (2013). [DOI] [PubMed] [Google Scholar]
- 3.Hamamoto R et al. SMYD3 encodes a histone methyltransferase involved in the proliferation of cancer cells. Nature Cell Biology 6, 731–740, doi: 10.1038/ncb1151 (2004). [DOI] [PubMed] [Google Scholar]
- 4.Kotake Y et al. pRB family proteins are required for H3K27 trimethylation and Polycomb repression complexes binding to and silencing p16INK4alpha tumor suppressor gene. Genes Dev 21, 49–54, doi: 10.1101/gad.1499407 (2007). [DOI] [PMC free article] [PubMed] [Google Scholar]
- 5.Mazur PK et al. SMYD3 links lysine methylation of MAP3K2 to Ras-driven cancer. Nature 510, 283-+, doi: 10.1038/nature13320 (2014). [DOI] [PMC free article] [PubMed] [Google Scholar]
- 6.Piunti A & Shilatifard A Epigenetic balance of gene expression by Polycomb and COMPASS families. Science 352, aad9780, doi: 10.1126/science.aad9780 (2016). [DOI] [PubMed] [Google Scholar]
- 7.Ferguson AD et al. Structural basis of substrate methylation and inhibition of SMYD2. Structure 19, 1262–1273, doi: 10.1016/j.str.2011.06.011 (2011). [DOI] [PubMed] [Google Scholar]
- 8.Herz HM et al. Histone H3 lysine-to-methionine mutants as a paradigm to study chromatin signaling. Science 345, 1065–1070, doi: 10.1126/science.1255104 (2014). [DOI] [PMC free article] [PubMed] [Google Scholar]
- 9.Klaus CR et al. DOT1L inhibitor EPZ-5676 displays synergistic antiproliferative activity in combination with standard of care drugs and hypomethylating agents in MLL-rearranged leukemia cells. J Pharmacol Exp Ther 350, 646–656, doi: 10.1124/jpet.114.214577 (2014). [DOI] [PubMed] [Google Scholar]
- 10.Kubicek S et al. Reversal of H3K9me2 by a small-molecule inhibitor for the G9a histone methyltransferase. Mol Cell 25, 473–481, doi: 10.1016/j.molcel.2007.01.017 (2007). [DOI] [PubMed] [Google Scholar]
- 11.Mohan M, Herz HM & Shilatifard A SnapShot: Histone lysine methylase complexes. Cell 149, 498–498 e491, doi: 10.1016/j.cell.2012.03.025 (2012). [DOI] [PMC free article] [PubMed] [Google Scholar]
- 12.Kouzarides T Chromatin modifications and their function. Cell 128, 693–705, doi: 10.1016/j.cell.2007.02.005 (2007). [DOI] [PubMed] [Google Scholar]
- 13.Shilatifard A The COMPASS Family of Histone H3K4 Methylases: Mechanisms of Regulation in Development and Disease Pathogenesis. Annual Review of Biochemistry , Vol 81 81, 65–95, doi: 10.1146/annurev-biochem-051710-134100 (2012). [DOI] [PMC free article] [PubMed] [Google Scholar]
- 14.Miller T et al. COMPASS: A complex of proteins associated with a trithorax-related SET domain protein. Proceedings of the National Academy of Sciences of the United States of America 98, 12902–12907, doi:DOI 10.1073/pnas.231473398 (2001). [DOI] [PMC free article] [PubMed] [Google Scholar]
- 15.Morgan MA & Shilatifard A Drosophila SETs Its Sights on Cancer: Trr/MLL3/4 COMPASS-Like Complexes in Development and Disease. Molecular and Cellular Biology 33, 1698–1701, doi: 10.1128/Mcb.00203-13 (2013). [DOI] [PMC free article] [PubMed] [Google Scholar]
- 16.Hu DQ & Shilatifard A Epigenetics of hematopoiesis and hematological malignancies. Genes & Development 30, 2021–2041, doi: 10.1101/gad.284109.116 (2016). [DOI] [PMC free article] [PubMed] [Google Scholar]
- 17.Yu BD, Hanson RD, Hess JL, Horning SE & Korsmeyer SJ MLL, a mammalian trithorax-group gene, functions as a transcriptional maintenance factor in morphogenesis. Proceedings of the National Academy of Sciences of the United States of America 95, 10632–10636, doi:DOI 10.1073/pnas.95.18.10632 (1998). [DOI] [PMC free article] [PubMed] [Google Scholar]
- 18.Ortega-Molina A et al. The histone lysine methyltransferase KMT2D sustains a gene expression program that represses B cell lymphoma development. Nature Medicine 21, 1199-+, doi: 10.1038/nm.3943 (2015). [DOI] [PMC free article] [PubMed] [Google Scholar]
- 19.Zhang JY et al. Disruption of KMT2D perturbs germinal center B cell development and promotes lymphomagenesis. Nature Medicine 21, 1190-+ (2015). [DOI] [PMC free article] [PubMed] [Google Scholar]
- 20.Herz HM et al. Enhancer-associated H3K4 monomethylation by Trithorax-related, the Drosophila homolog of mammalian Mll3/Mll4. Genes & Development 26, 2604–2620, doi: 10.1101/gad.201327.112 (2012). [DOI] [PMC free article] [PubMed] [Google Scholar]
- 21.Hu DQ et al. The MLL3/MLL4 Branches of the COMPASS Family Function as Major Histone H3K4 Monomethylases at Enhancers. Molecular and Cellular Biology 33, 4745–4754, doi: 10.1128/Mcb.01181-13 (2013). [DOI] [PMC free article] [PubMed] [Google Scholar]
- 22.Kandoth C et al. Mutational landscape and significance across 12 major cancer types. Nature 502, 333–339, doi: 10.1038/nature12634 (2013). [DOI] [PMC free article] [PubMed] [Google Scholar]
- 23.Fujimoto A et al. Whole-genome sequencing of liver cancers identifies etiological influences on mutation patterns and recurrent mutations in chromatin regulators. Nature Genetics 44, 760–U182, doi: 10.1038/ng.2291 (2012). [DOI] [PubMed] [Google Scholar]
- 24.Ellis MJ et al. Whole-genome analysis informs breast cancer response to aromatase inhibition. Nature 486, 353–360, doi: 10.1038/nature11143 (2012). [DOI] [PMC free article] [PubMed] [Google Scholar]
- 25.Li WD et al. Exome sequencing identifies an MLL3 gene germ line mutation in a pedigree of colorectal cancer and acute myeloid leukemia. Blood 121, 1478–1479, doi: 10.1182/blood-2012-12-470559 (2013). [DOI] [PubMed] [Google Scholar]
- 26.Gui YT et al. Frequent mutations of chromatin remodeling genes in transitional cell carcinoma of the bladder. Nature Genetics 43, 875–878, doi: 10.1038/ng.907 (2011). [DOI] [PMC free article] [PubMed] [Google Scholar]
- 27.Chen C et al. MLL3 Is a Haploinsufficient 7q Tumor Suppressor in Acute Myeloid Leukemia. Cancer Cell 25, 652–665, doi: 10.1016/j.ccr.2014.03.016 (2014). [DOI] [PMC free article] [PubMed] [Google Scholar]
- 28.Chaudhuri AR et al. Replication fork stability confers chemoresistance in BRCA-deficient cells. Nature 535, 382-+, doi: 10.1038/nature18325 (2016). [DOI] [PMC free article] [PubMed] [Google Scholar]
- 29.Bailey P et al. Genomic analyses identify molecular subtypes of pancreatic cancer. Nature 531, 47-+, doi: 10.1038/nature16965 (2016). [DOI] [PubMed] [Google Scholar]
- 30.Paoletti AC et al. Quantitative proteomic analysis of distinct mammalian Mediator complexes using normalized spectral abundance factors. Proceedings of the National Academy of Sciences of the United States of America 103, 18928–18933, doi: 10.1073/pnas.0606379103 (2006). [DOI] [PMC free article] [PubMed] [Google Scholar]
- 31.Ramon-Maiques S et al. The plant homeodomain finger of RAG2 recognizes histone H3 methylated at both lysine-4 and arginine-2. Proceedings of the National Academy of Sciences of the United States of America 104, 18993–18998, doi: 10.1073/pnas.0709170104 (2007). [DOI] [PMC free article] [PubMed] [Google Scholar]
- 32.Carbone M et al. BAP1 and cancer. Nature Reviews Cancer 13, 153–159, doi: 10.1038/nrc3459 (2013). [DOI] [PMC free article] [PubMed] [Google Scholar]
- 33.Dey A et al. Loss of the Tumor Suppressor BAP1 Causes Myeloid Transformation. Science 337, 1541–1546, doi: 10.1126/science.1221711 (2012). [DOI] [PMC free article] [PubMed] [Google Scholar]
- 34.Tripathi S et al. Meta- and Orthogonal Integration of Influenza “OMICs” Data Defines a Role for UBR4 in Virus Budding. Cell Host Microbe 18, 723–735, doi: 10.1016/j.chom.2015.11.002 (2015). [DOI] [PMC free article] [PubMed] [Google Scholar]
- 35.Li Y et al. Downregulation of RBMS3 Is Associated with Poor Prognosis in Esophageal Squamous Cell Carcinoma. Cancer Research 71, 6106–6115, doi: 10.1158/0008-5472.Can-10-4291 (2011). [DOI] [PubMed] [Google Scholar]
- 36.Nguyen TMH et al. Loss of ITM2A, a novel tumor suppressor of ovarian cancer through G2/M cell cycle arrest, is a poor prognostic factor of epithelial ovarian cancer. Gynecologic Oncology 140, 545–553, doi: 10.1016/j.ygyno.2015.12.006 (2016). [DOI] [PubMed] [Google Scholar]
- 37.Cieply B, Farris J, Denvir J, Ford HL & Frisch SM Epithelial-Mesenchymal Transition and Tumor Suppression Are Controlled by a Reciprocal Feedback Loop between ZEB1 and Grainyhead-like-2. Cancer Research 73, 6299–6309, doi: 10.1158/0008-5472.Can-12-4082 (2013). [DOI] [PMC free article] [PubMed] [Google Scholar]
- 38.Cha Y, Kim DK, Hyun J, Kim SJ & Park KS TCEA3 binds to TGF-beta receptor I and induces Smad-independent, JNK-dependent apoptosis in ovarian cancer cells. Cellular Signalling 25, 1245–1251, doi: 10.1016/j.cellsig.2013.01.016 (2013). [DOI] [PubMed] [Google Scholar]
- 39.Cui TT et al. The p53 target gene desmocollin 3 acts as a novel tumor suppressor through inhibiting EGFR/ERK pathway in human lung cancer. Carcinogenesis 33, 2326–2333, doi: 10.1093/carcin/bgs273 (2012). [DOI] [PubMed] [Google Scholar]
- 40.Qin S, Zhang Z, Li JF & Zang L FRZB knockdown upregulates beta-catenin activity and enhances cell aggressiveness in gastric cancer. Oncology Reports 31, 2351–2357, doi: 10.3892/or.2014.3109 (2014). [DOI] [PubMed] [Google Scholar]
- 41.Wang SY et al. DACT2 Is a Functional Tumor Suppressor Through Inhibiting Wnt/beta-Catenin Pathway and Associated With Poor Survival in Colon Cancer. Gastroenterology 146, S809–S809 (2014). [DOI] [PMC free article] [PubMed] [Google Scholar]
- 42.LaFave LM et al. Uveal melanoma cells are resistant to EZH2 inhibition regardless of BAP1 status Reply. Nature Medicine 22, 578–579, doi: 10.1038/nm.4094 (2016). [DOI] [PubMed] [Google Scholar]
- 43.LaFave LM et al. Loss of BAP1 function leads to EZH2-dependent transformation. Nature Medicine 21, 1344–1349, doi: 10.1038/nm.3947 (2015). [DOI] [PMC free article] [PubMed] [Google Scholar]
- 44.Schoumacher M et al. Uveal melanoma cells are resistant to EZH2 inhibition regardless of BAP1 status. Nature Medicine 22, 577–578, doi: 10.1038/nm.4098 (2016). [DOI] [PubMed] [Google Scholar]
- 45.Takahashi YH et al. Structural analysis of the core COMPASS family of histone H3K4 methylases from yeast to human. Proc Natl Acad Sci U S A 108, 20526–20531, doi: 10.1073/pnas.1109360108 (2011). [DOI] [PMC free article] [PubMed] [Google Scholar]
- 46.McDonald ER et al. Project DRIVE: A Compendium of Cancer Dependencies and Synthetic Lethal Relationships Uncovered by Large-Scale, Deep RNAi Screening. Cell 170, 577-+, doi: 10.1016/j.cell.2017.07.005 (2017). [DOI] [PubMed] [Google Scholar]
- 47.Toska E et al. CANCER THERAPY PI3K pathway regulates ER-dependent transcription in breast cancer through the epigenetic regulator KMT2D. Science 355, 1324–1329, doi: 10.1126/science.aah6893 (2017). [DOI] [PMC free article] [PubMed] [Google Scholar]
- 48.Lu ZH et al. Mammalian Target of Rapamycin Activator RHEB Is Frequently Overexpressed in Human Carcinomas and Is Critical and Sufficient for Skin Epithelial Carcinogenesis. Cancer Research 70, 3287–3298, doi: 10.1158/0008-5472.Can-09-3467 (2010). [DOI] [PMC free article] [PubMed] [Google Scholar]
- 49.Cerami E et al. The cBio cancer genomics portal: an open platform for exploring multidimensional cancer genomics data. Cancer Discov 2, 401–404, doi: 10.1158/2159-8290.CD-12-0095 (2012). [DOI] [PMC free article] [PubMed] [Google Scholar]
- 50.Gao J et al. Integrative analysis of complex cancer genomics and clinical profiles using the cBioPortal. Sci Signal 6, pl1, doi: 10.1126/scisignal.2004088 (2013). [DOI] [PMC free article] [PubMed] [Google Scholar]
- 51.Wang L et al. A cytoplasmic COMPASS is necessary for cell survival and triple-negative breast cancer pathogenesis by regulating metabolism. Genes & Development 31, 2056–2066, doi: 10.1101/gad.306092.117 (2017). [DOI] [PMC free article] [PubMed] [Google Scholar]
- 52.Anders S, Pyl PT & Huber W HTSeq--a Python framework to work with high-throughput sequencing data. Bioinformatics 31, 166–169, doi: 10.1093/bioinformatics/btu638 (2015). [DOI] [PMC free article] [PubMed] [Google Scholar]
- 53.Robinson MD, McCarthy DJ & Smyth GK edgeR: a Bioconductor package for differential expression analysis of digital gene expression data. Bioinformatics 26, 139–140, doi: 10.1093/bioinformatics/btp616 (2010). [DOI] [PMC free article] [PubMed] [Google Scholar]
- 54.Saldanha AJ Java Treeview--extensible visualization of microarray data. Bioinformatics 20, 3246–3248, doi: 10.1093/bioinformatics/bth349 (2004). [DOI] [PubMed] [Google Scholar]
- 55.Zhang Y et al. Model-based analysis of ChIP-Seq (MACS). Genome Biol 9, R137, doi: 10.1186/gb-2008-9-9-r137 (2008). [DOI] [PMC free article] [PubMed] [Google Scholar]
- 56.Heinz S et al. Simple combinations of lineage-determining transcription factors prime cis-regulatory elements required for macrophage and B cell identities. Mol Cell 38, 576–589, doi: 10.1016/j.molcel.2010.05.004 (2010). [DOI] [PMC free article] [PubMed] [Google Scholar]
- 57.Shen L, Shao N, Liu X & Nestler E ngs.plot: Quick mining and visualization of next-generation sequencing data by integrating genomic databases. BMC Genomics 15, 284, doi: 10.1186/1471-2164-15-284 (2014). [DOI] [PMC free article] [PubMed] [Google Scholar]
- 58.McLean CY et al. GREAT improves functional interpretation of cis-regulatory regions. Nat Biotechnol 28, 495–501, doi: 10.1038/nbt.1630 (2010). [DOI] [PMC free article] [PubMed] [Google Scholar]
- 59.Li W et al. MAGeCK enables robust identification of essential genes from genome-scale CRISPR/Cas9 knockout screens. Genome Biol 15, 554, doi: 10.1186/s13059-014-0554-4 (2014). [DOI] [PMC free article] [PubMed] [Google Scholar]
Associated Data
This section collects any data citations, data availability statements, or supplementary materials included in this article.
Supplementary Materials
Data Availability Statement
Next generation sequencing data generated for this study are available at the Gene Expression Omnibus (GEO) under accession number GSE97326.