

Abstract
Chemical ionization plays an important role in many aspects of pharmacokinetic (PK) processes such as protein binding, tissue partitioning, and apparent volume of distribution at steady state (Vdss). Here, estimates of ionization equilibrium constants (i.e., pKa) were analyzed for 8,132 pharmaceuticals and 24,281 other compounds to which humans might be exposed in the environment. Results revealed broad differences in the ionization of pharmaceutical chemicals and chemicals with either near-field (in the home) or far-field sources. The utility of these high-throughput ionization predictions was evaluated via a case-study of predicted PK Vdss for 22 compounds monitored in the blood and serum of the U.S. population by the U.S. Centers for Disease Control and Prevention National Health and Nutrition Examination Survey (NHANES). The chemical distribution ratio between water and tissue was estimated using predicted ionization states characterized by pKa. Probability distributions corresponding to ionizable atom types (IATs) were then used to analyze the sensitivity of predicted Vdss on predicted pKa using Monte Carlo methods. 8 of the 22 compounds were predicted to be ionizable. For 5 of the 8 the predictions based upon ionization are significantly different from what would be predicted for a neutral compound. For all but one (foramsulfuron), the probability distribution of predicted Vdss generated by IAT sensitivity analysis spans both the neutral prediction and the prediction using ionization. As new data sets of chemical-specific information on metabolism and excretion for hundreds of chemicals are being made available (e.g., Wetmore et al., 2015), high-throughput methods for calculating Vdss and tissue-specific PK distribution coefficients will allow the rapid construction of PK models to provide context for both biomonitoring data and high-throughput toxicity screening studies such as Tox21 and ToxCast.
Keywords: pKa, high throughput, ionization, volume of distribution, PBPK
1. Introduction
Regulatory agencies worldwide are tasked with characterizing the safety of tens of thousands of commercial chemicals, yet only a small subset have been fully characterized with respect to hazard and exposure (Egeghy et al., 2012; Judson et al., 2009; USGAO, 2009; USGAO, 2013). As thousands of new chemicals are introduced into commerce each year (Judson et al., 2009; USGAO, 2009; USGAO, 2013; Wilson and Schwarzman, 2009), it becomes much more challenging to set research priorities for determining what risk, if any, these chemicals in our environment pose to human and ecological populations (Thomas et al., 2013).
High throughput, in vitro testing programs such as Tox21 (Tice et al., 2013) and ToxCast (Kavlock et al., 2012) have been screening thousands of chemicals for potential bioactivity. However, interpretation of these data relies on nominal tested concentration unless the results can be extrapolated to in vivo conditions (e.g., Wetmore et al., 2015). The Centers for Disease Control and Prevention (CDC) National Health and Nutrition Examination Survey (NHANES) includes measurements of hundreds of xenobiotic chemical concentrations in blood and serum in the U.S. population (CDC, 2012). But, without knowing how these chemicals distribute within the body, blood concentrations cannot be related to potential concentrations in tissues that might be targets of toxic effects. Further, without knowing tissue distribution, neither the total body burden of the chemical nor the rate of exposure can be estimated.
Tissue distribution of chemicals remains an important aspect of pharmacokinetics (PK) that is not rapidly measured using in vitro or in vivo techniques. Tissue PK methodologies exist in the PK literature for the prediction of chemical distribution into specific tissues or the whole body (e.g., volume of distribution at steady-state or Vdss) but require specific information on physico-chemical behavior. In silico prediction of such chemical tissue distribution is heavily influenced by three key parameters: binding to tissue and plasma, hydrophobicity, and ionization (Peyret et al., 2010; Schmitt). Hydrophobicity (quantified by the octanol-water partition coefficient, logP) drives distribution of neutral compounds; however, a neutral compound at one pH can become ionized, for example, at a physiological pH. Thus, chemical ionization is key in estimating distribution (illustrated in Fig. 1). For predicting tissue distribution, tissues can be broadly described as consisting of components with differing affinities for chemicals depending on the charged state of the organic chemical molecule, as shown in Fig. 1 (Peyret et al., 2010; Schmitt). The resulting ratio between the total concentration (ionized and un-ionized) of chemical in the tissue and the plasma is the distribution coefficient (logD) (Manners et al., 1988). In PK, logD is described through tissue-specific partition coefficients (PC) (Peyret et al., 2010; Schmitt).
Fig. 1.

Neutral and ionized species of the same molecule can partition differently into environmental and biological media (C = cation, N = neutral, and A = anion). Ecologically only neutral species partition into air, while only ions partition onto water droplets (Franco and Trapp, 2008); all species can partition into dust, sediment, and soil (Doucette, 2003; Franco et al., 2009). Biologically both neutral and ionized forms can bind to proteins, while cations can partition into acidic phospholipids and neutral species can partition into neutral lipids (Peyret et al., 2010).
At a given pH, some atoms of a compound can donate (dissociation) to or receive (association) protons from one or more atoms or sites within the compound (Fig. 2). Chemical association/dissociation changes the overall molecular charge, with the potential for coexistence of multiple microspecies (i.e., different charge states of the same parent molecule). The chemical association/dissociation equilibrium constant (pKa) characterizes the pH at which concentrations of protonated or deprotonated chemical microspecies associated with an ionizable atom or site are in equilibrium. The aim of the present work was to generate ionization profiles of chemicals at an atomic level using a rapid approach suitable for thousands of chemicals.
Fig. 2.
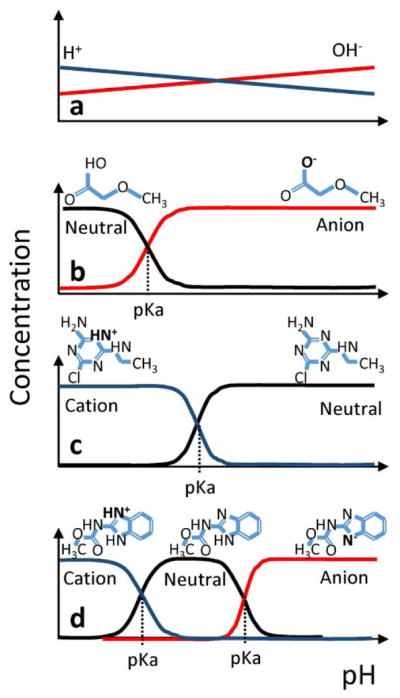
The scalar pKa characterizes the pH at which two chemical microspecies are in equilibrium, as a function of the concentration of hydrogen cations and hydroxide anions (panel a). The relative concentrations of ionized and neutral species depend not only on the pKa, but on the number of hydrogen donor groups (panel b), hydrogen acceptor groups (panel c), or a combination of both groups (panel d). Since multiple donor/acceptor groups can occur in a single molecule, the group(s) on the molecule becoming ionized must be identified.
pKa is often reported in scientific literature as a single numerical value, sometimes categorized as “acid” or “base”. This is sufficient for a compound that undergoes a single ionization, but in many cases there are multiple ionizations, and each pKa needs to be characterized in the range of 0 < pH < 14, as shown in Fig. 2. This information is vital for PK because the overall charge and the fraction extant at a certain pH follows the Henderson-Hasselbalch equation (Hasselbalch, 1916; Henderson, 1908), which has a different behavior for acidic (negative to neutral) and basic (neutral to positive) events as pH is increased. Therefore, ionization cannot be characterized by a scalar pKa value only, nor is it possible to compare predictions of quantitative structure–activity relationship models without further characterizing the ionization kinetics.
Understanding chemical-specific ionization properties is critical for predicting tissue distribution. As new data sets of chemical-specific information on metabolism and excretion for hundreds of chemicals are being made available (e.g., Wetmore et al., 2015), high-throughput methods for calculating Vdss and tissue-specific PK distribution coefficients will allow the rapid construction of compartmental and physiologically-based PK models. PK distribution describes how chemicals can accumulate preferentially in certain tissues, producing higher concentrations in that tissue, as characterized by tissue-specific PC. Much PK literature has been devoted to prediction of tissue PCs (Haddad et al., 2000; Peyret et al., 2010; Poulin and Krishnan, 1996a; Poulin and Krishnan, 1996b; Poulin and Theil, 2000; Rodgers et al., 2005; Rodgers and Rowland, 2006; Schmitt, 2008). These models provide the context for use and interpretation of both biomonitoring data (e.g., NHANES) and high-throughput toxicity screening studies (e.g., Tox21 and ToxCast). When appropriate PC and metabolism/physiological information are used, dynamic simulation of physiologically based pharmacokinetic (PBPK) models allows prediction of chemical concentrations in specific tissues at different times (Caldwell et al., 2012; Mumtaz et al., 2012; Pearce et al., 2017; Yoon et al., 2012)..
In this study, estimates of pKa were generated for 32413 compounds to which humans might be exposed. This included 8132 pharmaceuticals and 24281 pesticidal, industrial and consumer use compounds. A high-throughput method for assessing the effects of ionization on compound PK, the ionizable atom type (IAT), was used. IATs are specific configurations of atoms within a chemical that has the propensity to protonate or deprotonate. Using IATs, a probability distribution of pKa values and therefore the probability of an atom to become ionized were estimated for 13 IATs based on predictions for all 32413 chemicals. Broad differences were identified in the ionization of chemicals intended for pharmaceutical use and chemicals with both near-field (in the home) and far-field sources. The utility of these high-throughput ionization predictions was evaluated by assessing the impact of chemical ionization on predicted Vdss for 22 NHANES chemicals using Monte Carlo sampling to explore the impact of uncertainty in the predictions for each IAT in each compound.
2. Materials and methods
This study uses existing ionization prediction tools (ChemAxon, SPARC, and ADMET Predictor) for a library of 32413 chemicals. The predictions are organized by IAT to characterize probability distributions for certain types of ionization events in order to perform sensitivity analysis of the predicted Vdss.
For clarification in this manuscript, the word “distribution” is used in three ways: 1) with respect to PK, the concentration of chemical in different tissues of the body (e.g., a lipophilic compound accumulating in adipose tissue); 2) in a related, but more chemistry-focused sense, it is “the overall ratio of organic and aqueous phases of a compound, ionized and un-ionized at equilibrium” (Kwon, 2001); and 3) as statistical probability distribution, i.e., a mathematical function describing the relative likelihood of a given value. To disambiguate throughout this paper, the three distributions are designated as “PK” or “tissue”, “chemical”, and “probability” distributions, respectively.
2.1 Chemical Library
The U.S. Environmental Protection Agency (U.S. EPA) has identified more than 50,000 chemicals, including many synthetic chemicals, to which humans might be significantly exposed (Richard and Williams, 2002). These chemicals cover a variety of use classes such as consumer products, food additives, and human and veterinary drugs and were collected from the following sources, with significant overlap:
43,596 chemicals with documented use, and therefore exposure potential, stored in the Chemical and Product Categories (CPCat) database (Dionisio et al., 2015), which is part of the Aggregate Computational Toxicology Repository (ACToR) system (Judson et al., 2008; Judson et al., 2012).
A list of approximately 15,000 curated chemical structures for multiple inventories of environmental interest in the DSSTox collection of structures from the public DSSTox (Richard and Williams, 2002). In particular, structures for all of the ToxCast (Dix et al., 2007) and Tox21 (Collins et al., 2008) chemicals were included.
The Canadian domestic substances list (DSL) (Environment and Climate Change Canada, 2016) and a list of all substances (~ 24,000 chemicals) thought to be in commerce in Canada, including chemicals with potential for human or ecological exposure (Health Canada, 2009).
Approximately 10,000 chemicals from the Endocrine Disruptor Screening Program (EDSP) Universe of Chemicals. U.S. EPA’s EDSP is required to test certain chemicals for endocrine-disrupting potential, in particular, through the estrogen receptor (Fenner-Crisp et al., 2000).
A list of approximately 15,000 chemicals from PHYSPROP data sets with valid structures and after removal of duplicates (Mansouri et al., 2016; USEPA, 2015).
A KNIME structure-standardization workflow was used to process these lists of chemicals (Mansouri et al., 2016). To characterize any potential differences in the lists, the ACToR Use Categories (Dionisio et al., 2015) were used to assign chemicals to pharmaceutical, near- and far-field environmental chemical classes. The ACToR Use Categories were developed using data from federal, state, and international regulatory listings of chemicals in specific classes. Chemicals were assigned to specific use categories by tabulating the number of times a chemical fell into a category in all of the regulatory listings. A chemical was assigned to a category if it fell into that category three or more times. If it passed the “three-hit” threshold for more than one category, the chemical was assigned to multiple categories.
In this study, pharmaceutical compounds were considered pharmacologically active substances intended for internal or external use for the treatment and prevention of disease. Whether the pharmaceuticals failed or succeeded to be introduced commercially was not a consideration. Environmental compounds were separated into those with near- and far-field sources (e.g., in the home vs. industrial release) (Arnot et al., 2006). Table 1 gives a general overview of the classification scheme for each chemical type.
Table 1.
General framework of chemical classification determined by chemical exposure potential and expectation of biological activity.
| Chemical Type | Human Exposure Scenario |
|---|---|
| Pharmaceutical | Compounds intended to be taken as a dose to cause bioactivity. |
| Near-field environmental | Compounds with proximate sources of exposure that might lead to higher doses, but are not intended to cause bioactivity. |
| Far-field environmental | Compounds with distal sources of exposure that should lead to lower doses, but bioactivity restrictions are less constrained. |
2.2 pKa predictions
The Marvin pKa plug-in from ChemAxon (Cambridge, MA, USA) was selected for predicting pKa in this research (Szegezdi and Csizmadia, 2007; Szegezdi and Czismadia, 2004). ChemAxon’s Marvin pKa plug-in uses only three atomic descriptors (partial charge, atomic polarizability, and structure-specific increments) with nonlinear relationships to predict the pKa microconstants, which are subsequently used to obtain the macroconstants (Szegezdi and Csizmadia, 2007; Szegezdi and Czismadia, 2004). The plug-in also reports the position in the chemical simplified molecular-input line-entry system (SMILES) string (or visualization interface showing the molecule itself), specifying the atom that becomes ionized for each pKa. Functional groups identified with ADMET Predictor (Simulations Plus, Buffalo, NY, USA) were used to organize types of ionizations, allowing sensitivity analysis (Simulations Plus, 2017).
In addition to predictions made using the ChemAxon pKa plug-in, pKa predictions from SPARC Performs Automated Reasoning in Chemistry (SPARC; ARChem, Danielsville, GA, USA) and ADMET Predictor were also compared (Supplemental Figure S1). For compounds that both accept and donate protons due to microconstant transitions between chemical microspecies, SPARC and ADMET Predictor report the ionization as a “mixed” pKa. This “mixed” category adds ambiguity to the predictions because it requires an inference mechanism to relabel the mixed pKa predictions and thus makes the calculation of the Henderson-Hasselbalch equation unclear. Hence, only the ChemAxon Marvin pKa plug-in results were used in our analysis. See the appendix for a discussion of pKa prediction paradigms.
2.3 Ionizable Atom Types
A two-dimensional representation of a chemical was generated using SMILES (Helson, 2007; Weininger, 1988) to identify the specific atoms associated with the pKa value and the atoms’ protonation/deprotonation action. ADMET Predictor identified 82 functional groups, each one containing a fingerprint of the atomic configurations for which a specific atom will become ionized. These configurations are referred to as putative IATs. Note that IATs are atom-centric, where only the ionizable atom of a chemical and that atom’s local neighborhood were considered, not the molecule as a whole. This allowed clear labeling of each pKa as proton donating (acidic pKa; apKa) or accepting (basic pKa; bpKa). The ionizable atom and its atomic neighborhood formed a fingerprint of a specific type of ionization event, which will be referred to as the IAT signature.
A library of SMILES substrings was developed using the SMILES strings for compounds with an IAT predicted using ADMET Predictor (Simulations Plus, 2017). These SMILES substrings were then used to create a library of signatures for 13 commonly predicted IATs. These signatures identify putative ionizable sites in SMILES strings of unknown chemicals and further specify the maximal putative IAT the SMILES signature represented, e.g., the IAT routine will not identify a hydroxyl group (-OH) that is part of the larger carboxyl group (-COOH). The putative IATs are confirmed to be a true IAT if and only if the atom has a covalent bond available to accept or donate a hydrogen atom. If so, then the atom is added to its corresponding IAT library.
After building IAT libraries, two parameters were derived: (i) the frequency that an IAT is ionized in the [0, 14] pH range and (ii) the probability distribution of predicted pKa values associated with the IAT. IATs were assumed, by inspecting the resulting distributions, to be normally distributed.
2.4 Prediction of Tissue Distribution
PCs of chemical-specific tissue to free fraction in plasma (PCT:p) were predicted using the method of Peyret et al. (2010). Tissue specificity was based on the cellular fraction of total volume; the water, lipid, and protein fraction of cellular volume; and the fractions of types of lipid (Peyret et al., 2010). Chemical specificity was based on (i) the octanol-water PC (Pow = elogp) obtained from the ChemAxon pKa Plug-in and (ii) ionization scheme: neutral chemical model, the IAT- and ChemAxon pKa Plugin-based association/dissociation constants.
The tissue:plasma PCs (PCT:p) were determined from
| (1) |
where the subscripts denote the matrices (m) cellular tissue (ct), interstitial fluid (it), erythrocytes (e) and plasma (p); Fm is the percent of the tissue comprised by each matrix; PCmw is the PC for each matrix (Peyret et al., 2010), and T is the set of tissues parameterized in Schmitt (2008).
The PC for each matrix m was predicted as (Peyret et al., 2010):
| (2) |
where each matrix m is comprised of the following constituents (c): water (w), neutral lipids (nl), acidic phospholipids (apl), and protein (pr); Fcm is the fraction of each matrix m comprised of each constituent c; Pow is the octanol:water partition coefficient; PCaplw is set to zero for interstitial fluids and plasma where it is assumed no acidic phospholipids exist, and otherwise is predicted as the blood:plasma ratio scaled by the erythrocyte content, since erythrocytes provide binding pockets that are similar to acidic phospholipids to bind basic compounds; and PCprw is binding by albumin and lipoproteins as characterized by unbound fraction in plasma (Fu). w is water, m is the matrix, nl is neutral lipids, apl is acidic phospholipids, and pr is protein (Peyret et al., 2010). Each variable in Eq. (2) also had an indicator function (not shown) to ensure that biologically implausible partitioning did not occur. In Figure 1, the presence of an arrow from C, N, and A to a matrix represents the indicator function equal to 1, lack of an arrow represents the indicator function set to 0. Im is the variable influenced by pKa and represents the ratio of the concentration of the chemical in the ionized state to the concentration in the neutral form for a given pKa –pH pair. The Henderson-Hasselbalch equation is utilized to calculate the Im, where
| (3) |
and pH varies according to tissue as in Schmitt (2008). Note that Eq. (2) is an extension of the calculation of logD, which is equal to logP for neutral compounds, but incorporates ionization through taking the log of the sum of the concentrations of ionized and non-ionized compounds in octanol divided by the sum of the concentrations of ionized and non-ionized compounds in water.
A special case of equations were used for highly lipophilic organic compounds (HLOC). In these cases, the logP and tissue lipid content dominated the partition coefficient calculations. Equations can be found in (Haddad et al., 2000; Poulin and Haddad, 2012).
With the partition coefficients in hand, the Vdss can be calculated. The Vdss (in L/kg bodyweight) for serum or blood reflects the aggregate tissue distribution of a chemical for the whole body. The calculation of the Vdss is the predicted PCs scaled by physiological tissue volumes:
| (4) |
where VT is the percentage volume of a tissue (in kg, obtained from Schmitt (2008)]), and PCT:p is the PC for the tissue.
2.5 Sensitivity Analysis Using IAT Probability Distributions
The utility of high-throughput ionization predictions is evaluated by examining the importance of correctly determining the effect of chemical ionization on predicted Vdss for environmentally relevant chemicals. IAT probability distributions, the assumption of chemical neutrality, and the point estimates obtained by ChemAxon pKa Plugin are compared in a sensitivity analysis of ionization effects using the Vdss derived from the predicted PCs as the reporter parameter.
A Monte Carlo sampling with replacement strategy (bootstrapping), implemented in R (version 3.3.2), used the developed pKa probability distributions associated with IATs, to perform a sensitivity analysis of the effects of pKa values on the apparent Vdss using the tissue-based PC calculations of Peyret et al. (2010). Although many modern tools for predicting pKa attempt to characterize the uncertainty in their predictions, these characterizations are by necessity based on performance using the available training set, and most training sets are focused on pharmaceutical chemicals (Liao and Nicklaus, 2009). For this reason, an alternative approach was used in this study that focused on the probability distribution for chemicals predicted to have specific IATs.
The sensitivity analysis was performed on a set of chemicals from the NHANES (CDC, 2012), which include 109 compounds in the blood and serum of the U.S. population tracked by NHANES. Of the 109 chemicals, 22 have the necessary parameters needed for PC calculation, particularly Fu in plasma, shown in Table 2 (Wetmore et al., 2015; Wetmore et al., 2012)].
Table 2.
NHANES chemicals with corresponding IAT, Fu reported in (Wetmore et al., 2015; Wetmore et al., 2012), and Vdss calculated using pKas predicted by pKa Plugin Neutral chemicals are included at the bottom.
| Compound | logP | Ionizable Atom Type | pKa | Fu | Vdss |
|---|---|---|---|---|---|
| Oxasulfuron | 1.13 | ArNitrog_=N- | 2.33 | 0.061 | 6.498 |
| Amide___C(=O)N< | 3.5 | ||||
| Foramsulfuron | 0.59 | SecAmine_>NH | 3.46 | 0.065 | 0.108 |
| Carbaryl | 2.46 | Amide___C(=O)N< | 14.77 | 0.692 | 6.708 |
| Bisphenol A (BPA) | 4.04 | ArHdrxl_-OH | 9.78 | 0.257 | 74.228 |
| ArHdrxl_-OH | 10.39 | ||||
| Atrazine | 2.20 | SecAmine_>NH | 14.62 | 0.112 | 25.899 |
| ArNitrog_=N- | 3.2 | ||||
| Acephate | −0.33 | SecAmine_>NH | 6.54 | 0.868 | 0.283 |
| 2-Phenylphenol | 3.32 | ArHdrxl_-OH | 9.69 | 0.041 | 3.137 |
| 2,4-Dichlorophenoxyacetic acid | 2.5 | AlCbxyl_-COOH | 2.81 | 0.040 | 0.104 |
|
| |||||
| Neutral Chemicals | |||||
|
| |||||
| Azinphos-methyl | 3.24 | 0.214 | 13.286 | ||
| Chlorpyrifos | 4.78 | 0.018 | 39.176 | ||
| Dimethoate | 0.34 | 0.965 | 0.528 | ||
| Methidathion | 2.29 | 0.268 | 1.834 | ||
| Methyl parathion | 2.60 | 0.014 | 0.292 | ||
| Diethyl phthalate | 2.69 | 0.190 | 3.221 | ||
| Dibutyl phthalate | 4.63 | 0.028 | 41.594 | ||
| Dimethyl phthalate | 1.98 | 0.656 | 2.264 | ||
| N,N-Diethyl-3-methylbenzamide | 2.50 | 0.356 | 3.855 | ||
| Dicrotophos | −0.24 | 0.823 | 0.429 | ||
| Alachlor | 3.59 | 0.141 | 19.740 | ||
| Metolachlor | 3.45 | 0.133 | 13.756 | ||
| Formaldehyde | −0.47 | 1 | 0.107 | ||
| Acetochlor | 3.50 | 0.135 | 15.735 | ||
With this data, the focus of this sensitivity analysis was the body burden of each compound, derived through the prediction of PK distribution of a chemical within the body.
3. Results
pKa predictions were generated for the 32413 chemicals. Fig. 3 illustrates the number of association and dissociation actions of these chemicals using the predicted pKa values derived from ChemAxon versus the pH at which the ionization occurs. This also shows the acidic/basic pKa predictions as a function of chemical class. The ionization profiles of pharmaceutical compounds versus compounds with potential near- and far-field environmental sources were distinct: Far-field chemicals had the broadest range of pKa values, while pharmaceuticals had the narrowest (Table S1). Pharmaceutical compounds have a distinct bpKa (potential to become positively charged) mode with the peak just above the physiologically relevant pH at or near 7.4, whereas the far-field chemicals have modes that peak on either side of pH 7.4. This difference is interesting in the context of PCs because the mode of the bpKa ionization for pharmaceutical compounds is very close to the plasma pH of the tissue-based PC prediction method used in this analysis (Peyret et al., 2010); this peak indicates that partitioning into acidic phospholipids could play a large role in pharmaceutical compound tissue distribution.
Fig. 3.

Profile of the number of association and dissociation actions of predicted ionization sites with pKa values from ChemAxon versus the pH at which the ionization occurs. Note that pKa predictions are calculated at 25°C; at physiological temperatures, 37°C, will generally shift predictions slightly to the left (towards pH 0) (Perrin et al., 1981).
Of the three classes, pharmaceutical compounds have the highest propensity to be ionized (87% [6,751 of 7,766] of all pharmaceuticals are ionizable; Table S1). The near-field environmental chemicals have the fewest compounds that are ionized, with well over half of the chemicals being non-ionizable (Table S1). Note also that of the predicted ionizable sites, the pKa values show relatively few ionized sites at the physiological pH, i.e., a strong dip between the modes at 6 < pH < 8.
Chemicals that were predicted to be charged, with pKa outside the 0–14 pH range (i.e., very strong/weak acids or bases), are designated as “terminally ionized.” As shown in Fig. 3, the probability distribution of non-terminally ionized pKa values that are predicted in far-field chemicals closely resembles the pharmaceutical compound probability distribution, with modes around 4, 10, and 14. Far-field environmental chemicals, however, have a stronger tendency toward low pKa values compared to the pharmaceuticals, likely due to, e.g., sulfur compounds such as surfactants.
Chemicals predicted to be terminally ionized, particularly those with pKa much less than zero, were predominantly far-field environmental chemicals. Further investigation is needed to determine whether the pKa values for these compounds were truly extreme values, or whether the structures of the compounds were so different from the training sets used in the models that they produced erroneous values (i.e., outside the models’ domain of applicability).
3.1 IAT identification and parameterization
Fig. 4 shows the average number of occurrences for a subset of IATs for all chemicals, normalized by the total number of chemicals in each class. These are then sorted from low to high by the average number of IATs identified per chemical in the pharmaceutical class. These values are the expected number of each IAT per compound in each chemical class. Chemical classes tend to have differing IAT compositions and IAT loads (Fig. S2). This is true particularly for highly represented groups such as aliphatic hydroxyls, ethers, amides, and aromatic nitrogens. Pharmaceuticals also tend to be enriched in aliphatic IATs (aliphatic hydroxyl, aliphatic primary amines, and aliphatic carboxyl), potentially reflecting the propensity for anabolic pathways in these compounds. Far-field compounds tend to be enriched in aromatic IATs found in several environmental compounds (aromatic hydroxyl, aromatic primary amines, and aromatic carboxyl), possibly reflecting the properties of the compounds in which they occur. Lipophilicity, for example, is desirable for solvents, but is less desirable in pharmaceuticals. Other IATs of note in environmental compounds are sulfonates, ethers, and NO2 nitrogens commonly found in surfactants. Near-field environmental chemicals tend to have the lowest concentration of IATs, although these chemicals are enriched in sulfur-containing IATs.
Fig. 4.

Average number of occurrences per chemical for a subset of IATs, normalized by the total number of chemicals in each class. IATs considered in this work are the non-terminally charged subset of IATs with more than 0.1 IAT per chemical.
Fig. 5 shows the density of predictions from the ChemAxon pKa Plugin for the selected IATs in Fig. 4. Table 3 shows the fraction of times each IAT pattern is ionized versus the total number identified in the SMILES string. This illustrates the number of each IAT predicted to be ionized versus the total IAT predicted by the ChemAxon pKa Plugin and the resulting percentage of the IAT that is associated with an ionization. The probability distribution of IAT pKa values in Figure 5 captures the variability in pKa prediction given the surrounding neighborhood of the IAT.
Fig. 5.

Probability density of pKa for IATs predicted from the 32413 chemicals using ChemAxon pKa Plugin for selected IATs from Fig. 4.
Table 3.
Fraction of times each IAT pattern is ionized in pKa plug-in predictions versus the total number identified in the SMILES string.
|
|
|
|
||||||
|---|---|---|---|---|---|---|---|---|
| IAT | Ionized/Total | % | IAT | Ionized/Total | % | IAT | Ionized/Total | % |
|
|
|
|
||||||
| AlCbxyl_-COOH | 3336/3427 | 97% | AlHdrxl_-OH | 4267/9971 | 43% | Amide___C(=O)N< | 2262/5992 | 38% |
| ArHdrxl_-OH | 3110/4287 | 73% | ArNitrog_=N- | 2845/6884 | 41% | Carbonyl_C=O | 507/7518 | 7% |
| Ether____-O- | 1352/13394 | 10% | PriAmAli_-NH2 | 1230/1341 | 92% | PriAmAro_-NH2 | 1240/2308 | 54% |
| PriAmine_-NH2 | 2469/3649 | 68% | SecAmine_>NH | 1031/2898 | 36% | TerAmine_>N- | 3144/4539 | 69% |
|
|
|
|
||||||
In general, the IAT functional groups with well-defined probability distributions have a high percentage of pKa values predicted for the IAT. Examples include, the carboxyls (97.3%; AlCbxyl_-COOH), aromatic hydroxyls (72.5%; ArHdrxl_-OH), tertiary amines (81.6%; TerAmine_>N-), and primary aliphatic amines (91.7%; PriAmAli_-NH2). Other IATs, however, are rarely protonated/deprotonated, such as aliphatic hydroxyls (42.8%; AlHdrxl_-OH), primary aromatic amines (53.7%; PriAmAro_-NH2), and especially ethers (10.1%; Ether____-O-). It is interesting to note that the percentage ionized tends to correspond with how close the IAT probability distribution tends to the middle of the pKa range.
Several of the IATs in Fig. 5 show tight probability distributions for predicted pKa values, and this suggests that there is little variability in their atomic neighborhoods. Chief among these tight distributions are the aliphatic carboxyls (AlCbxyl_-COOH) and primary aliphatic amines (PriAmAli_-NH2), both of which are terminal atom groups with lognormal distributed predictions. Ethers (Ether_-O-) and aliphatic hydroxyls (AlHdrxl_-OH) also share this behavior, but most of these IATs do not become ionized (10.1% and 42.8%, respectively) compared to the terminal groups above (97.3% and 91.7%, respectively), possibly because all instances of the relatively noncomplex atomic fingerprints were captured. The aromatic hydroxyl (ArHdrxl_-OH) probability distribution also displayed a well-defined peak, yet with greater variance than other compounds, likely due to the variable aromatic ring structure neighborhoods in which they occur.
Most IAT probability distributions in Fig. 5 show subtle differences between the chemical classes. Pharmaceutical compound IATs tend to prevent the compounds from distributing into some tissues, such as fat, that would result in longer half-lives. Pharmaceuticals have: (1) a higher proportion of negatively charged IATs, such as the carbonyls (Carbonyl_C=O) and aliphatic carboxyls (AlCbxyl_-COOH); and (2) a lower proportion of positively charged aliphatic IATs (i.e., primary aliphatic amines (PriAmAli_-NH2), secondary amines (SecAmine_>NH), and tertiary amines (TerAmine_>N-); do not get partitioned in to acidic phospholipids). Note also that pharmaceuticals have a higher proportion of positively charged primary aromatic amines. This is likely due to the fact that there are relatively few primary aromatic amine (PrimAmAro_-NH2) IATs, and small sample size causes the average number of these positively charged IATs in pharmaceutical compounds to appear higher (as shown in Fig. 3, Fig. S2). Additionally, as seen in the primary Amine (PriAmine_-NH2) panel, less than half of these are charged (pKa < ~5) rather than uncharged (pKa > ~9). Finally, several IATs have wide probability distributions. In particular, aromatic nitrogens (ArNitrog_=N-) follow no apparent parametric distribution, and secondary amines (SecAmine_>NH) have one mode around pH 10 but also have uniformly distributed predictions along the remainder of the pH spectrum suggesting that there these IATs are more complex than the simple local neighborhood approach taken in this analysis.
3.2 Sensitivity Analysis of Ionization and Volume of Distribution
Fig. 6 shows the results of the Monte Carlo analysis to assess how the uncertainty in the pKa value affects the Vdss for the NHANES chemicals for which we have sufficient information to make predictions (namely, fraction unbound in plasma, Fu). Fig. 6 compares the apparent Vdss for probability distributions of the chemicals in Fig 5 that result from sampling pKa values with replacement from the IAT probability distribution associated with a given IAT on a molecule.
Fig. 6.

Apparent Vdss calculated for each chemical based on 2000 samples with replacement from the IAT probability distributions shown in Fig 5. Non-ionizable chemicals are denoted with (N). Box and whiskers plot shows the predicted pKa values, with black dots indicating outliers beyond 1.5 x interquartile range. The assumption that no IATs are ionized is shown in blue, and the chemical apparent Vdss values using pKa plugin predictions are shown in red.
The red dots in Fig. 6 indicate the Vdss for that chemical based on its exact ChemAxon predictions, while the box-and-whisker plots (with black dots indicating outliers beyond 1.5 * interquartile range (Tukey, 1977)]) indicate the range of Vdss from the sensitivity analysis. The blue dots in Fig. 6 indicate the Vdss if ionization had been ignored altogether. For example, the median, canonical, and neutral Vdss values of BPA tend to cluster around approximately 80 L/kg.
The neutral chemical assumptions and the predictions from ChemAxon are often overlapping (Fig. 6) and this is clearly seen for neutral chemicals. However, for five of the eight ionizable compouds, the neutral assumptions and the ChemAxon predictions are significantly different (e.g., atrazine). For all but one of the chemicals in Fig. 6, the probability distribution of predicted Vdss generated by IAT sensitivity analysis spans both the neutral prediction and the prediction based on the ChemAxon prediction. When there is a significant difference (e.g., foramsulfuron), our pKa sensitivity analysis method overestimates Vdss, which might be health-protective since low volumes of distribution increase the probability of metabolic clearance (Smith et al., 2015).
The predicted Vdss of BPA in this analysis is overpredicted when compared to literature estimates which range from 4.6 to approximately 27.0 L/kg, depending on the route that the dose was administered (Kurebayashi et al., 2003; Yoo et al., 2000). This overprediction is more likely due to the PC estimation than to ionization. The prediction of PCs assumes that tissue distribution is by diffusion only and does not consider transporters, which can alter the partitioning of BPA and its primary metabolite BPA glucuronide (Mazur et al., 2012; Moscovitz et al., 2016; Teeguarden et al., 2005), potentially lowering its Vdss.
For the non-ionizing chemicals in Fig. 6, denoted by (N), the red dot and box-and-whisker plots overlap. Some neutral chemicals such as alachlor, acetochlor, and metalochlor have outlying points that are likely due to mispredicted carbonyl (Carbonyl_C=O) groups. These groups can make the chemical acidic, which can in turn prevent partitioning into adipose tissue. The median value is unaffected since only 6.7% of the carbonyls are predicted to be ionized despite the predicted carbonyl groups.
Among the ionized compounds, the range for Vdss was wider or narrower depending on compound. In Fig. 6, compounds varied due to the interplay between various ionizable sites, i.e., chemicals with multiple pKas, in general, have wide distributions. Most notably, Bisphenol A has identical sites that can become charged. The neutral chemicals that have wide ranges have IATs with a low likelihood of ionization. For example, Ethers and Carbonyls become negatively charged, which essentially removes the lipid compartment from the equation.
4. Discussion
A major challenge in assessing any risk posed by thousands of untested and unmeasured chemicals is cost-efficient predictive models (National Academies of Sciences and Medicine, 2017). PK methods are needed to keep pace with expanded biomonitoring data (i.e., exposure) and high-throughput screening (i.e., hazard). High-throughput methods allow for prediction of key PK properties such as Vdss and tissue-specific PK distribution coefficients (Haddad et al., 2000; Peyret et al., 2010; Poulin and Krishnan, 1996a; Poulin and Krishnan, 1996b; Rodgers et al., 2005; Rodgers and Rowland, 2006; Schmitt, 2008). However, these models require measurement or prediction of chemical ionization, as characterized by pKa. Here we have examined the predicted ionization properties for 32413 compounds. These data revealed broad differences between pharmaceuticals and those chemicals with either near-field (in the home) or far-field sources. The introduction of distributions for specific ionizable atom types (IATs) allowed sensitivity analysis via Monte Carlo sampling. As an example, we evaluated the sensitivity of predicted Vdss to chemical ionization predictions on Vdss for NHANES compounds.
The Vdss values in Table 2 allow inference of body burden from measured concentrations in blood or serum. Further, if rates of metabolism and excretion can be determined, as done by Wetmore et al. (2015), then sufficient information is available for parameterizing a “one compartment” PK model. If the PCs are handled separately rather than as an aggregate Vdss, a PBPK model can be constructed. This high-throughput method for calculating Vdss and tissue-specific distribution coefficients allows the rapid construction of PK models to provide context for both biomonitoring data and toxicity screening study data such as Tox21 and ToxCast.
In the current study we assumed that text mining using regular expression libraries captured all patterns that determine IAT in SMILES strings. We further assumed that the application of ADMET Predictor IAT predictions is consistent with the algorithmically different ChemAxon pKa plug-in. Neither of these assumptions, however, affected a significant portion of the compounds in our chemical list (≅ 0.8%). Nevertheless, it should be noted that for high-throughput and data-poor analyses, such assumptions are inevitable in order to make useful inferences. If an assumption is wrong, the prediction are likely to be inaccurate.
Another assumption is that the CAS Registry numbers (CASRN) are correct and associated with the appropriate chemical structures. In fact, CASRN might be associated with incorrect chemical SMILES strings; often, a single chemical can have several CASRN, or one CASRN is associated with several different chemicals. This work resolves this issue by developing and applying a set of rules to make unique CASRN-to-chemical assignments, which has the potential to make erroneous assignments of ACToR UseDB category terms to chemicals. This, in turn, affected the chemical class portion of this analysis. However, such changes potentially occurred to fewer than 300 chemicals, or approximately 1% of the data set, and therefore are unlikely to change the analysis significantly.
Previous analyses of pKa method sensitivity (Liao and Nicklaus, 2009) that are based on small subsets of only pharmaceutical compounds. Here we have used our large library of primarily environmental compound predictions to develop probability distributions for specific IATs. These IAT distributions allow for sensitivity analysis via Monte Carlo simulation to quantify the potential uncertainty that can be attributed to each predicted pKa. Wide distributions for predicted values (e.g., Vdss) are indicative of greater uncertainty, compared to chemicals with tight distributions. Such considerations can inform in chemical prioritization.
A strength of the IAT method is that the data is not restricted to a specific set of chemicals. Though we chose to use a large dataset of environmental compounds, any large dataset of chemicals could be substituted to derive the IAT distributions. Hence, this method could be extended to pharmaceutical pKa predictions or derived from regulatory datasets).
Sensitivity analysis by sampling substitute pKa values from an IAT probability distribution has potential positive and negative consequences. One positive outcome is that a large range of most likely volumes of distribution will be represented by our predictions, which is demonstrated by: (1) the span of predictions containing both the neutral and the ChemAxon pKa plug-in predictions (e.g., atrazine, BPA, oxasulfuron, carbaryl); and, (2) cases where both our method and the ChemAxon pKa plug-in have the same prediction for the ionized form of the chemical (e.g., 2,4-dichlorophenoxyacetic acid). On the other hand, it is possible that predictions made by our method will fall outside the neutral and pKa plug-in ionization predictions.
For example, our method overpredicts acephate vs pKa plug-in, but the prediction is much closer than for foramsulfuron. Foramsulfuron is an extreme case: For the neutral prediction, in Equation 2, PowFnlm is the only non-zero term in the numerator and, due to the low logP, is a small value (no ionization, hence denominator = 1). For the ionized term, the pKa Plugin value for the secondary amine group, 3.46, is several orders of magnitude lower than the peak of the secondary amine (SecAmine_>NH) probability distribution (~ 9.5; Fig. 5) peak. In this case, the term for the neutral partitioning is set to zero, and the numerator is only acidic phospholipid partitioning, scaled by the value of Im = 10pka–pH = 103.46–7.4 = 1.1 × 10⁻⁴. Hence, the ionized Vdss is lower than the neutral Vdss. Our prediction has three possible secondary amine groups in the foramsulfuron molecule. For any predicted ionizations, the value chosen will likely be orders of magnitude higher than the pKa predicted by pKa Plugin, and hence will have much larger values of Im in the numerator, which explains the overpredictions. Acephate is overpredicted for the same reasons. The pKa predicted by pKa Plugin is 6.54, still two orders of magnitude lower than the SecAmine (SecAmine_>NH) peak but close enough to the physiological pH of 7.4 to cause approximately 10 % of the IATs to be ionized.
A limitation in sensitivity analysis based upon sampling IAT probability distributions are the tails of the probability distributions. For example, the amide (Amide_C(=O)N<) IAT of oxasulfuron. In this instance, the amide in oxasulfuron is in a configuration such that the pKa for the ionizable atom is predicted at the extreme of the amide IAT probability distribution, approximately a full 10 units of the pH scale away from the mean of the probability distribution. Hence, a pKa value > 7.5 sampled from the amide IAT probability distribution, which causes the amide to be negatively charged at the physiological range, will negate any partitioning into acidic phospholipids and thus lower the Vdss. As was shown, the probability distribution of mis-predictions still showed signatures of certain IAT configurations, particularly with compounds that should be neutral (e.g., phthalates). In such cases, computational post-hoc classification could be used to modify the predicted Vdss based on a set of rules for a given IAT configuration.
Sensitivity analyses also rest upon the ability to parameterize the models used the analyses. The method presented here relies on pharmacokinetic parameters. Most such parameters can be either predicted in silico (e.g., logP) or found in literature. However, current in silico predictiors for parameters such as Fu either have been developed exclusively using pharmaceutical chemicals or currently rely on proprietary descriptors that are not available for all chemicals of interest (Ingle et al., 2016).
Further improvements to the IAT distributions themselves could be obtained by using more of the chemical neighborhood and 3D structures of the chemicals to get finer granularity (e.g., Geidl et al. (2015), Bochevarov et al. (2016)). This could potentially make tighter IAT pKa probability distributions by, e.g., splitting pKa probability distributions such as the aromatic nitrogens (ArNitrogen_=N-) and secondary amines (SecAmine_>N) on such higher order chemistries.
Future work to parameterize simple PBPK models through prediction of PK distribution into specific tissues (i.e., tissue partitioning) can proceed by considering the relationship between logP and pKa (expressed through the logD parameter), absorption, metabolic clearance, and the plasma binding (Fu). The plasma binding has a large effect in tissue-composition-based PC prediction methods that rely on Fu to determine the partitioning (Schmitt (2008). When plasma protein binding data are available or are predicted (Ingle et al., 2016), the techniques presented here for profiling pKa, allow high-throughput, computationally inexpensive prediction of the apparent Vdss.
This study has identified differences between broad classes of chemicals through consideration of predicted ionization as characterized by pKa. These ionization predictions have been understood in terms of the occurrence of specific IATs. By characterizing the probability distribution of predictions for key IATs across an extensive chemical library, we are now able to perform sensitivity analysis for chemical properties that depend upon pKa predictions. As an example, we have predicted Vdss for chemicals monitored in the blood and serum of the U.S. population by NHANES. These predictions inform the chemical body burden indicated by biomonitoring data. Importantly, sensitivity analysis based upon IAT probability distributions informs confidence in a manner that is suitable for application to thousands of chemicals that may be in the environment.
Supplementary Material
Acknowledgments
The Oak Ridge Institute for Science and Education provided funding for K. Mansouri and initially for C. Strope (EPA-ORD/NCCT-2012-05) before continuing at the Hamner Institutes for Health Sciences. The U.S. Environmental Protection Agency through its Office of Research and Development funded and managed a portion of the research described here, with support for J.F. Wambaugh, J.R. Rabinowitz, and C. Stevens.
We would like to thank Thomas Peyret for sharing the Excel spreadsheets with the code needed to correctly predict the PC predictions using his method. We would like to thank Eric Watt for several helpful discussions that focused our work. We appreciate feedback from Antony Williams and Brandall Ingle in preparation of this manuscript. We appreciate technical editing from Stacy Henkle as well as American Journal Experts.
Appendix
Several pKa prediction programs exist (Liao and Nicklaus, 2009). Commercial predictors span a range of mechanisms to predict the protonation state of particular atoms, including linear free energy relationships (LFER) that use a dictionary of chemical substructures (Lee et al., 2007), quantitative structure-property relationships (QSPR) (Jover et al., 2008; Palaz et al., 2012), and quantum chemical and ab initio methods (Bochevarov et al., 2013; Eckert and Klamt, 2006; Eckert et al., 2009; Klamt et al., 2010; Klamt et al., 2003; Vareková et al., 2011). Semi-empirical models calculate descriptors for each ionizable chemical functional group, after which pKa values are predicted using machine learning or tree-based models (Jelfs et al., 2007; Xing et al., 2003). These semi-empirical models are limited by the number of chemicals used (Xing et al., 2003) and the usage of a proprietary, non-releasable training set (Jelfs et al., 2007).
Empirical methods employ substructure databases and use LFER to predict pKa values based on the prior assignments for the atomic groups stored in a database. As such, their prediction accuracy is limited to the substructures contained in their database. If additional training data are available, many of these tools can be recalibrated to apply to new chemical structures. Unfortunately, such data are not available for many environmental chemicals. The data limitations of these methods will improve with the addition of more pKa data and could be aided by efforts to contribute pKa data that are currently underway (https://gist.github.com/egonw/5aa53abe480a8625fe81). Such is also the case with predictors using QSPR. These prediction methods have been developed using machine learning algorithms along with structural and chemical descriptors to make predictions of pKa values (Fraczkiewicz et al., 2014; Szegezdi and Csizmadia, 2007; Szegezdi and Czismadia, 2004).
Quantum chemical methods and ab initio methods offer great promise, but currently both are computationally intensive and generally do not perform as well as LFER and QSPR methods (Elyashberg et al., 2010). Due to their computational inefficiency, these methods are incompatible with high-throughput methodologies.
The majority of pKa prediction programs inspect a particular chemical, including the interplay between ionizable sites, to predict the pKa value. Calculating the interactions between sites, however, exponentially increases the computation time. In SPARC (Lee et al., 2007), chemicals with complex atomic interactions can result in calculations that last weeks to months for a single chemical, for which SPARC will return an incomplete calculation error (Lee et al., 2007).
Footnotes
Disclaimer
The U.S. Environmental Protection Agency (U.S. EPA) through its Office of Research and Development funded and conducted the research described here. It has been reviewed by the U.S. EPA and approved for publication. The views expressed in this publication are those of the authors and do not necessarily represent the views or policies of the Agency. Mention of trade names or commercial products does not constitute endorsement or recommendation for use.
References
- Arnot JA, MacKay D, Webster E, Southwood JM. Screening level risk assessment model for chemical fate and effects in the environment. Environmental science & technology. 2006;40:2316–2323. doi: 10.1021/es0514085. [DOI] [PubMed] [Google Scholar]
- Bochevarov AD, Harder E, Hughes TF, Greenwood JR, Braden DA, Philipp DM, et al. Jaguar: A high-performance quantum chemistry software program with strengths in life and materials sciences. International Journal of Quantum Chemistry. 2013;113:2110–2142. [Google Scholar]
- Bochevarov AD, Watson MA, Greenwood JR, Philipp DM. Multiconformation, Density Functional Theory-Based p K a Prediction in Application to Large, Flexible Organic Molecules with Diverse Functional Groups. Journal of Chemical Theory and Computation. 2016;12:6001–6019. doi: 10.1021/acs.jctc.6b00805. [DOI] [PubMed] [Google Scholar]
- Caldwell JC, Evans MV, Krishnan K. Cutting edge PBPK models and analyses: providing the basis for future modeling efforts and bridges to emerging toxicology paradigms. Journal of toxicology. 2012 doi: 10.1155/2012/852384. [DOI] [PMC free article] [PubMed] [Google Scholar]
- CDC. National Health and Nutrition Examination Survey. 2012. [Google Scholar]
- Collins FS, Gray GM, Bucher JR. Transforming environmental health protection. Science (New York, NY) 2008;319:906. doi: 10.1126/science.1154619. [DOI] [PMC free article] [PubMed] [Google Scholar]
- Dionisio KL, Frame AM, Goldsmith M-R, Wambaugh JF, Liddell A, Cathey T, et al. Exploring consumer exposure pathways and patterns of use for chemicals in the environment. Toxicology Reports. 2015;2:228–237. doi: 10.1016/j.toxrep.2014.12.009. [DOI] [PMC free article] [PubMed] [Google Scholar]
- Dix DJ, Houck KA, Martin MT, Richard AM, Setzer RW, Kavlock RJ. The ToxCast program for prioritizing toxicity testing of environmental chemicals. Toxicological Sciences. 2007;95:5–12. doi: 10.1093/toxsci/kfl103. [DOI] [PubMed] [Google Scholar]
- Doucette WJ. Quantitative structure-activity relationships for predicting soil-sediment sorption coefficients for organic chemicals. Environmental Toxicology and Chemistry. 2003;22:1771–1788. doi: 10.1897/01-362. [DOI] [PubMed] [Google Scholar]
- Eckert F, Klamt A. Accurate prediction of basicity in aqueous solution with COSMO-RS. Journal of computational chemistry. 2006;27:11–19. doi: 10.1002/jcc.20309. [DOI] [PubMed] [Google Scholar]
- Eckert F, Leito I, Kaljurand I, Kütt A, Klamt A, Diedenhofen M. Prediction of acidity in acetonitrile solution with COSMO-RS. Journal of computational chemistry. 2009;30:799–810. doi: 10.1002/jcc.21103. [DOI] [PubMed] [Google Scholar]
- Egeghy PP, Judson R, Gangwal S, Mosher S, Smith D, Vail J, et al. The exposure data landscape for manufactured chemicals. Sci Total Environ. 2012;414:159–66. doi: 10.1016/j.scitotenv.2011.10.046. [DOI] [PubMed] [Google Scholar]
- Elyashberg M, Blinov K, Smurnyy Y, Churanova T, Williams A. Empirical and DFT GIAO quantum-mechanical methods of 13C chemical shifts prediction: competitors or collaborators? Magnetic Resonance in Chemistry. 2010;48:219–229. doi: 10.1002/mrc.2571. [DOI] [PubMed] [Google Scholar]
- Environment and Climate Change Canada. Domestic Substances List. 2016. [Google Scholar]
- Fenner-Crisp PA, Maciorowski AF, Timm GE. The endocrine disruptor screening program developed by the US Environmental Protection Agency. Ecotoxicology. 2000;9:85–91. [Google Scholar]
- Fraczkiewicz R, Lobell M, Göller AH, Krenz U, Schoenneis R, Clark RD, et al. Best of Both Worlds: Combining Pharma Data and State of the Art Modeling Technology To Improve in Silico p K a Prediction. Journal of chemical information and modeling. 2014;55:389–397. doi: 10.1021/ci500585w. [DOI] [PubMed] [Google Scholar]
- Franco A, Fu W, Trapp S. Influence of soil pH on the sorption of ionizable chemicals: modeling advances. Environmental Toxicology and Chemistry. 2009;28:458–464. doi: 10.1897/08-178.1. [DOI] [PubMed] [Google Scholar]
- Franco A, Trapp S. Estimation of the soil–water partition coefficient normalized to organic carbon for ionizable organic chemicals. Environmental Toxicology and Chemistry. 2008;27:1995–2004. doi: 10.1897/07-583.1. [DOI] [PubMed] [Google Scholar]
- Geidl S, Svobodová Vařeková R, Bendová V, Petrusek Ls, Ionescu C-M, Jurka Z, et al. How does the methodology of 3D structure preparation influence the quality of p K a prediction? Journal of chemical information and modeling. 2015;55:1088–1097. doi: 10.1021/ci500758w. [DOI] [PMC free article] [PubMed] [Google Scholar]
- Haddad S, Poulin P, Krishnan K. Relative lipid content as the sole mechanistic determinant of the adipose tissue: blood partition coefficients of highly lipophilic organic chemicals. Chemosphere. 2000;40:839–843. doi: 10.1016/s0045-6535(99)00279-9. [DOI] [PubMed] [Google Scholar]
- Hasselbalch KA. Die Berechnung der Wasserstoffzahl des Blutes aus der freien und gebundenen Kohlensäure desselben, und die Sauerstoffbindung des Blutes als Funktion der. Wasserstoffzahl: Julius Springer; 1916. [Google Scholar]
- Health Canada. Final Integrated Framework for the Health-Related Components of Categorization of the Domestic Substances List Under CEPA 1999. 2009. [Google Scholar]
- Helson HE. Structure diagram generation. Reviews in Computational Chemistry. 2007;13:313–398. [Google Scholar]
- Henderson LJ. Concerning the relationship between the strength of acids and their capacity to preserve neutrality. American Journal of Physiology--Legacy Content. 1908;21:173–179. [Google Scholar]
- Ingle BL, Veber BC, Nichols JW, Tornero-Velez R. Informing the Human Plasma Protein Binding of Environmental Chemicals by Machine Learning in the Pharmaceutical Space: Applicability Domain and Limits of Predictability. Journal of Chemical Information and Modeling. 2016;56:2243–2252. doi: 10.1021/acs.jcim.6b00291. [DOI] [PubMed] [Google Scholar]
- Jelfs S, Ertl P, Selzer P. Estimation of p K a for druglike compounds using semiempirical and information-based descriptors. Journal of chemical information and modeling. 2007;47:450–459. doi: 10.1021/ci600285n. [DOI] [PubMed] [Google Scholar]
- Jover J, Bosque R, Sales J. QSPR prediction of pKa for benzoic acids in different solvents. QSAR & Combinatorial Science. 2008;27:563–581. [Google Scholar]
- Judson R, Richard A, Dix D, Houck K, Elloumi F, Martin M, et al. ACToR—aggregated computational toxicology resource. Toxicology and applied pharmacology. 2008;233:7–13. doi: 10.1016/j.taap.2007.12.037. [DOI] [PubMed] [Google Scholar]
- Judson R, Richard A, Dix DJ, Houck K, Martin M, Kavlock R, et al. The toxicity data landscape for environmental chemicals. Environmental health perspectives. 2009;117:685. doi: 10.1289/ehp.0800168. [DOI] [PMC free article] [PubMed] [Google Scholar]
- Judson RS, Martin MT, Egeghy P, Gangwal S, Reif DM, Kothiya P, et al. Aggregating data for computational toxicology applications: the US Environmental Protection Agency (EPA) aggregated computational toxicology resource (ACToR) system. International journal of molecular sciences. 2012;13:1805–1831. doi: 10.3390/ijms13021805. [DOI] [PMC free article] [PubMed] [Google Scholar]
- Kavlock R, Chandler K, Houck K, Hunter S, Judson R, Kleinstreuer N, et al. Update on EPA’s ToxCast program: providing high throughput decision support tools for chemical risk management. Chemical Research in Toxicology. 2012;25:1287–1302. doi: 10.1021/tx3000939. [DOI] [PubMed] [Google Scholar]
- Klamt A, Eckert F, Arlt W. COSMO-RS: an alternative to simulation for calculating thermodynamic properties of liquid mixtures. Annual review of chemical and biomolecular engineering. 2010;1:101–122. doi: 10.1146/annurev-chembioeng-073009-100903. [DOI] [PubMed] [Google Scholar]
- Klamt A, Eckert F, Diedenhofen M, Beck ME. First Principles Calculations of Aqueous p K a Values for Organic and Inorganic Acids Using COSMO– RS Reveal an Inconsistency in the Slope of the p K a Scale. The Journal of Physical Chemistry A. 2003;107:9380–9386. doi: 10.1021/jp034688o. [DOI] [PubMed] [Google Scholar]
- Kurebayashi H, Betsui H, Ohno Y. Disposition of a low dose of 14C-bisphenol A in male rats and its main biliary excretion as BPA glucuronide. Toxicological Sciences. 2003;73:17–25. doi: 10.1093/toxsci/kfg040. [DOI] [PubMed] [Google Scholar]
- Kwon Y. Handbook of essential pharmacokinetics, pharmacodynamics and drug metabolism for industrial scientists. Springer Science & Business Media; 2001. [Google Scholar]
- Lee PH, Ayyampalayam SN, Carreira LA, Shalaeva M, Bhattachar S, Coselmon R, et al. In silico prediction of ionization constants of drugs. Molecular pharmaceutics. 2007;4:498–512. doi: 10.1021/mp070019+. [DOI] [PubMed] [Google Scholar]
- Liao C, Nicklaus MC. Comparison of nine programs predicting p K a values of pharmaceutical substances. Journal of chemical information and modeling. 2009;49:2801–2812. doi: 10.1021/ci900289x. [DOI] [PMC free article] [PubMed] [Google Scholar]
- Manners CN, Payling DW, Smith DA. Distribution coefficient, a convenient term for the relation of predictable physico-chemical properties to metabolic processes. Xenobiotica. 1988;18:331–350. doi: 10.3109/00498258809041669. [DOI] [PubMed] [Google Scholar]
- Mansouri K, Abdelaziz A, Rybacka A, Roncaglioni A, Tropsha A, Varnek A, et al. CERAPP: Collaborative Estrogen Receptor Activity Prediction Project. Environ Health Perspect. 2016 doi: 10.1289/ehp.1510267. [DOI] [PMC free article] [PubMed] [Google Scholar]
- Mazur CS, Marchitti SA, Dimova M, Kenneke JF, Lumen A, Fisher J. Human and rat ABC transporter efflux of bisphenol a and bisphenol a glucuronide: interspecies comparison and implications for pharmacokinetic assessment. Toxicological Sciences. 2012;128:317–325. doi: 10.1093/toxsci/kfs167. [DOI] [PubMed] [Google Scholar]
- Moscovitz JE, Nahar MS, Shalat SL, Slitt AL, Dolinoy DC, Aleksunes LM. Correlation between Conjugated Bisphenol A Concentrations and Efflux Transporter Expression in Human Fetal Livers. Drug Metabolism and Disposition. 2016 doi: 10.1124/dmd.115.068668. dmd. 115.068668. [DOI] [PMC free article] [PubMed] [Google Scholar]
- Mumtaz M, Fisher J, Blount B, Ruiz P. Application of physiologically based pharmacokinetic models in chemical risk assessment. Journal of toxicology. 2012 doi: 10.1155/2012/904603. [DOI] [PMC free article] [PubMed] [Google Scholar]
- National Academies of Sciences E, Medicine. Using 21st Century Science to Improve Risk-Related Evaluations. Washington, DC: The National Academies Press; 2017. [PubMed] [Google Scholar]
- Palaz S, Türkkan B, Eroğlu E. A QSPR Study for the Prediction of the pKa of N-Base Ligands and Formation Constant Kc of Bis (2, 2′-bipyridine) Platinum (II)-N-Base Adducts Using Quantum Mechanically Derived Descriptors. ISRN Physical Chemistry. 2012;2012 [Google Scholar]
- Pearce RG, Setzer RW, Strope CL, Sipes NS, Wambaugh JF. Httk: R package for high-throughput toxicokinetics. Journal of Statistical Software. 2017;79:1–26. doi: 10.18637/jss.v079.i04. [DOI] [PMC free article] [PubMed] [Google Scholar]
- Perrin DD, Dempsey B, Serjeant EP. pKa prediction for organic acids and bases. Vol. 1. Springer; 1981. [Google Scholar]
- Peyret T, Poulin P, Krishnan K. A unified algorithm for predicting partition coefficients for PBPK modeling of drugs and environmental chemicals. Toxicology and applied pharmacology. 2010;249:197–207. doi: 10.1016/j.taap.2010.09.010. [DOI] [PubMed] [Google Scholar]
- Poulin P, Haddad S. Advancing prediction of tissue distribution and volume of distribution of highly lipophilic compounds from a simplified tissue-composition-based model as a mechanistic animal alternative method. Journal of pharmaceutical sciences. 2012;101:2250–2261. doi: 10.1002/jps.23090. [DOI] [PubMed] [Google Scholar]
- Poulin P, Krishnan K. A mechanistic algorithm for predicting blood: air partition coefficients of organic chemicals with the consideration of reversible binding in hemoglobin. Toxicology and applied pharmacology. 1996a;136:131–137. doi: 10.1006/taap.1996.0016. [DOI] [PubMed] [Google Scholar]
- Poulin P, Krishnan K. A tissue composition-based algorithm for predicting tissue: air partition coefficients of organic chemicals. Toxicology and applied pharmacology. 1996b;136:126–130. doi: 10.1006/taap.1996.0015. [DOI] [PubMed] [Google Scholar]
- Poulin P, Theil FP. A priori prediction of tissue: plasma partition coefficients of drugs to facilitate the use of physiologically-based pharmacokinetic models in drug discovery. Journal of pharmaceutical sciences. 2000;89:16–35. doi: 10.1002/(SICI)1520-6017(200001)89:1<16::AID-JPS3>3.0.CO;2-E. [DOI] [PubMed] [Google Scholar]
- Richard AM, Williams CR. Distributed structure-searchable toxicity (DSSTox) public database network: a proposal. Mutation Research/Fundamental and Molecular Mechanisms of Mutagenesis. 2002;499:27–52. doi: 10.1016/s0027-5107(01)00289-5. [DOI] [PubMed] [Google Scholar]
- Rodgers T, Leahy D, Rowland M. Physiologically based pharmacokinetic modeling 1: predicting the tissue distribution of moderate-to-strong bases. Journal of pharmaceutical sciences. 2005;94:1259–1276. doi: 10.1002/jps.20322. [DOI] [PubMed] [Google Scholar]
- Rodgers T, Rowland M. Physiologically based pharmacokinetic modelling 2: predicting the tissue distribution of acids, very weak bases, neutrals and zwitterions. Journal of pharmaceutical sciences. 2006;95:1238–1257. doi: 10.1002/jps.20502. [DOI] [PubMed] [Google Scholar]
- Schmitt W. General approach for the calculation of tissue to plasma partition coefficients. Toxicology in Vitro. 2008;22:457–467. doi: 10.1016/j.tiv.2007.09.010. [DOI] [PubMed] [Google Scholar]
- ADMET Predictor. 2017. Simulations Plus. [Google Scholar]
- Smith DA, Beaumont K, Maurer TS, Di L. Volume of Distribution in Drug Design: Miniperspective. Journal of medicinal chemistry. 2015;58:5691–5698. doi: 10.1021/acs.jmedchem.5b00201. [DOI] [PubMed] [Google Scholar]
- Szegezdi J, Csizmadia F. Calculating pKa values of small and large molecules. 233rd ACS National Meeting; Chicago, IL. 2007. [Google Scholar]
- Szegezdi J, Czismadia F. Prediction of dissociation constant using microconstants. 227th ACS National Meeting; Anaheim, California. 2004. [Google Scholar]
- Teeguarden JG, Waechter JM, Clewell HJ, Covington TR, Barton HA. Evaluation of oral and intravenous route pharmacokinetics, plasma protein binding, and uterine tissue dose metrics of bisphenol A: a physiologically based pharmacokinetic approach. Toxicological Sciences. 2005;85:823–838. doi: 10.1093/toxsci/kfi135. [DOI] [PubMed] [Google Scholar]
- Thomas RS, Philbert MA, Auerbach SS, Wetmore BA, Devito MJ, Cote I, et al. Incorporating new technologies into toxicity testing and risk assessment: moving from 21st century vision to a data-driven framework. Toxicol Sci. 2013;136:4–18. doi: 10.1093/toxsci/kft178. [DOI] [PMC free article] [PubMed] [Google Scholar]
- Tice RR, Austin CP, Kavlock RJ, Bucher JR. Improving the human hazard characterization of chemicals: a Tox21 update. Environmental Health Perspectives. 2013;121:756. doi: 10.1289/ehp.1205784. [DOI] [PMC free article] [PubMed] [Google Scholar]
- Tukey JW. Exploratory data analysis. 1977. [Google Scholar]
- USEPA. EPI (Estimation Programs Interface) Suite. 2015. [Google Scholar]
- USGAO; Office GA, editor. Chemical Regulation: Options for Enhancing the Effectiveness of the Toxic Substances Control Act. 2009. [Google Scholar]
- USGAO; Office USGA, editor. Toxic Substances: EPA Has Increased Efforts to Assess and Control Chemicals but Could Strengthen Its Approach. 2013. [Google Scholar]
- Vareková RS, Geidl S, Ionescu C-M, Skrehota O, Kudera M, Sehnal D, et al. Predicting pKa Values of Substituted Phenols from Atomic Charges: Comparison of Different Quantum Mechanical Methods and Charge Distribution Schemes. Journal of chemical information and modeling. 2011;51:1795–1806. doi: 10.1021/ci200133w. [DOI] [PubMed] [Google Scholar]
- Weininger D. SMILES, a chemical language and information system. 1. Introduction to methodology and encoding rules. Journal of chemical information and computer sciences. 1988;28:31–36. [Google Scholar]
- Wetmore BA, Wambaugh JF, Allen B, Ferguson SS, Sochaski MA, Setzer RW, et al. Incorporating High-Throughput Exposure Predictions With Dosimetry-Adjusted In Vitro Bioactivity to Inform Chemical Toxicity Testing. Toxicological Sciences. 2015;148:121–36. doi: 10.1093/toxsci/kfv171. [DOI] [PMC free article] [PubMed] [Google Scholar]
- Wetmore BA, Wambaugh JF, Ferguson SS, Sochaski MA, Rotroff DM, Freeman K, et al. Integration of dosimetry, exposure, and high-throughput screening data in chemical toxicity assessment. Toxicological Sciences. 2012;125:157–74. doi: 10.1093/toxsci/kfr254. [DOI] [PubMed] [Google Scholar]
- Wilson MP, Schwarzman MR. Toward a new U.S. chemicals policy: rebuilding the foundation to advance new science, green chemistry, and environmental health. Environ Health Perspect. 2009;117:1202–9. doi: 10.1289/ehp.0800404. [DOI] [PMC free article] [PubMed] [Google Scholar]
- Xing L, Glen RC, Clark RD. Predicting p K a by molecular tree structured fingerprints and PLS. Journal of chemical information and computer sciences. 2003;43:870–879. doi: 10.1021/ci020386s. [DOI] [PubMed] [Google Scholar]
- Yoo SD, Shin BS, Kwack SJ, Lee BM, Park KL, Han S-Y, et al. Pharmacokinetic disposition and tissue distribution of bisphenol A in rats after intravenous administration. Journal of toxicology and environmental health Part A. 2000;61:131–139. doi: 10.1080/00984100050120415. [DOI] [PubMed] [Google Scholar]
- Yoon M, Campbell JL, Andersen ME, Clewell HJ. Quantitative in vitro to in vivo extrapolation of cell-based toxicity assay results. Critical reviews in toxicology. 2012;42:633–652. doi: 10.3109/10408444.2012.692115. [DOI] [PubMed] [Google Scholar]
Associated Data
This section collects any data citations, data availability statements, or supplementary materials included in this article.