

Abstract
Human T cells that recognize lipid antigens presented by highly conserved CD1 proteins often express semi-invariant T cell receptors (TCRs), but the true diversity of lipid antigen-specific TCRs remains unknown. We use CD1b tetramers and high-throughput immunosequencing to analyze thousands of TCRs from ex vivo sorted or in vitro expanded T cells specific for the mycobacterial lipid antigen, glucose monomycolate (GMM). Our results reveal a surprisingly diverse repertoire resulting from editing of germline encoded gene rearrangements analogous to MHC-restricted TCRs. We used a distance-based metric (TCRdist) to show how this diverse TCR repertoire builds upon previously reported conserved motifs by including subject-specific TCRs. In a South African cohort, we show that TCRdist can identify clonal expansion of diverse GMM-specific TCRs and accurately distinguish patients with active tuberculosis from control subjects. These data suggest that the similar mechanisms govern the selection and expansion of peptide and lipid antigen-specific T cells despite the non-polymorphic nature of CD1.
Introduction
T cells express an antigen-specific T cell receptor (TCR), which enables recognition of foreign peptide antigens only when bound to major histocompatibility (MHC) molecules (1). A consequence of MHC allelic diversity is that each host must develop a personalized set of T cells in order to recognize peptide-based antigens produced by a pathogen. Thus, the collection of all T cells (repertoire) between two genetically unrelated individuals rarely overlaps, even if antigen exposures are shared. The TCR is a heterodimer consisting of α and β chains that are generated by somatic recombination of germline-encoded segments. The addition and deletion of nucleotides at recombination sites increases the potential diversity to nearly one trillion unique sequences (2, 3). However, the actual number of unique T cells (clonotypes) in peripheral blood is estimated at 3-4 million—a substantially lower number because of biases in the recombination process and positive and negative selection in the thymus (4). Among genetically unrelated individuals that share a dominant MHC allele, a minority of T cells recognizing a common viral peptide share a common TCR-β sequence (5). Thus, generalizing information derived from TCR sequences is often limited to the dominant MHC type, rarely present in more than 40% of a given population (6).
Notably, human T cells have evolved mechanisms independent of MHC to facilitate the recognition of non-peptide antigens. Such antigens include bacterial lipids, which are bound by the CD1 family of antigen-presenting molecules (7). There are five CD1 proteins in humans (CD1A, CD1B, CD1C, CD1D, and CD1E) capable of processing and presenting lipid antigens to T cells. CD1 genes do not display the level of polymorphism inherent to MHC, though the actual levels of human genetic variation have not been quantitatively determined (8). Previous studies have focused mostly on allelic variants from a few individuals of limited ethnic diversity (8, 9). The lack of information on other genetic variations, such as single nucleotide polymorphisms in gene regulatory regions, that cover a broad range of ethnicities reduces the ability to make population level inferences about lipid-specific TCR sequences.
Because CD1 genes are relatively conserved, it is generally assumed that CD1-restricted T cells express conserved TCRs. A number of studies have documented the presence of invariant NK T (iNKT) cells in the blood of unrelated subjects from different populations (10–12). These cells are activated by glycolipid antigens bound to CD1D and canonically express an invariant TCR-α consisting of a germline rearrangement of TRAV10-1 and TRAJ18-1 gene segments in humans (13, 14). Similarly, germline-encoded mycolyl lipid-reactive (GEM) T cells are activated by mycobacterial glycolipids bound to CD1B and express a TCR-α consisting of TRAV1-2 and TRAJ9-1 gene segments (15). Both iNKT and GEM cells express TCR-β with biased gene segment usage, thus permitting the recognition of multiple antigens. However, it is not known whether these conserved motifs are typical of a restricted TCR repertoire or whether diverse TCRs can recognize a single lipid antigen.
Recent advances in high-throughput sequencing have enabled the rapid and accurate assessment of TCR sequence diversity (3, 16). The application of these data at the population level have been limited by computational tools that would facilitate grouping of sequences on the basis of antigen-specificity rather than sequence identity. TCRdist is a recently developed distance measure that is guided by structural information on peptide-MHC binding and directly addresses this challenge (17). It was developed and tested in a study of CD8+ T cell repertoires specific for viral epitopes but has not yet been applied to MHC-independent T cells or in human cohort studies.
We performed a genetic analysis of CD1B in all human continental ancestry groups and found evidence of purifying selection during human evolution resulting in a single allele. We hypothesized that this extreme structural constraint would enable a lipid-antigen specific T cell response to be shared across genetically unrelated members of a population. Surprisingly, we find that conserved TCRs are expressed by the minority of TCR repertoires specific for a mycobacterial glycolipid antigen, glucose monomycolate (GMM). Instead, the response is dominated by subject-specific diverse TCRs. We used TCRdist to group these TCRs on the basis of GMM-specificity and developed a diagnostic signature that could be applied to genetically unrelated individuals to identify clonal expansion of GMM-specific T cells. Finally, we show that this signature is able to identify South African patients with active tuberculosis using bulk immunosequencing data derived from peripheral blood. Our approach could be generalized to develop diagnostic signatures for other diseases in which lipid antigens are targeted by T cells, such as atopic dermatitis, psoriasis, or leukemia.
Materials and Methods
Generation of GMM-loaded CD1B tetramers
Soluble biotinylated CD1B monomers were provided by the National Institutes of Health Tetramer Core Facility (Emory University, Atlanta, GA). Glucose monomycolate (GMM)-loaded tetramers were generated as previously described (18). In brief, C32-GMM was dried down in a glass tube using a nitrogen evaporator and sonicated into 0.25% CHAPS/sodium citrate at pH 4 (preparation of CHAPS in sodium citrate; CHAPS Hydrate, Sigma; Sodium Citrate Dihydrate, Fisher) for two minutes at 37°C. The lipid solution was transferred to a microfuge tube, and 9 μL of CD1B monomer was added. The CD1B-GMM preparation was then incubated in a 37°C water bath for 2 hours with vortexing every 30 minutes. At the end of the incubation, the solution was neutralized to pH 7.4 with 6 μL of 1M Tris pH 9. Finally, 10 μL of Streptavidin conjugated to allophycocyanin (APC) or phycoerythrin (PE) (Life Technologies) was added in ten aliquots of 1 μL every 10 minutes to facilitate tetramerization. The final product was filtered through a SpinX column (Sigma) to remove aggregates and stored at 4°C until use.
Antigens and media
C32-GMM purified from Rhodococcus equi was generously provided by the laboratory of D. Branch Moody (19). Mycolic acid purified from M. tuberculosis was generously provided by the laboratory of Martine Gilleron. Our base T cell media consists of RPMI 1640 supplemented with 100 U/mL Penicillin and 100 μg/mL Streptomycin, 55 μM 2-mercaptoethanol, 0.3X Essential Amino Acids, 60 μM Non-essential Amino Acids, 11 mM HEPES, and 800 μM L-Glutamine (Gibco). We additionally supplemented this media with either fetal calf serum (HyClone) or human serum that was derived from healthy donors.
Generation of T cell lines using GMM-loaded CD1B tetramers
Peripheral blood mononuclear cells (PBMC) were isolated from healthy South African adults. PBMC were depleted of CD14-expressing monocytes for a separate study and cryopreserved. At the time of this study, PBMC were thawed and washed in warm RPMI 1640 (Gibco) supplemented with 10% fetal calf serum (Hyclone) and 2 μL/mL Benzonase (Millipore) and enumerated using trypan blue exclusion. PBMC were then plated in a 24-well plate at a density of three million cells per well in T cell media and allowed to rest overnight at 37°C in humidified incubators supplemented with 5% CO2. The following day, PBMC were washed and blocked with human serum (Valley Biomedical) in FACS buffer (1x phosphate-buffered saline (PBS) (Gibco) supplemented with 0.2% bovine serum albumin (BSA) (Sigma) sterile-filtered) mixed 1:1 for 10 minutes at 4°C. Samples were washed twice in FACS buffer with centrifugation performed at 1800 rpm for 3 minutes. The cells were resuspended in 50 μL FACS buffer, and 1 μL of either unloaded CD1B tetramer or GMM-loaded CD1B tetramer was added. The PBMC were incubated at room temperature for 40 minutes in the dark. At the end of the incubation period, the cells were washed twice with PBS and stained with Aqua Live/Dead stain (Life Technologies) according to the manufacturer’s instructions. Following two additional PBS washes, cells were stained with anti-CD3 ECD (Beckman Coulter) for 30 minutes at 4°C in the dark. Two washes were performed in T cell media, and the cells were then strained through a cell strainer tube (Falcon) prior to sorting. Tetramer-positive T cells were sorted at the UW Department of Immunology Flow Cytometry Core using a FACS Aria II (BD Biosciences) cell sorter equipped with blue (488 nm), red (641 nm), and violet (407 nm) lasers.
Sorted T cells were washed and resuspended in T cell media supplemented with 10% human serum. T cells were then divided among eight wells of a 96-well U-bottom tissue culture plate into which irradiated PBMC (150,000 cells per well) were added as feeder cells along with phytohaemagglutinin (Remel) at a final concentration of 1.6 μg/ml. After two days in culture at 37°C/5% CO2, 10 μL natural IL-2 (nIL-2) (Hemagen) was added to each well. Half the media was replaced every two days with T cell media supplemented with 10% human serum and nIL-2. When the cell clusters were large and round (approximately after eight days of growth), they were pooled into a 24-well plate. After 10 days in culture, cell lines were screened by tetramer staining or functional response to GMM. We then further expanded T cell lines by modifying a previously published rapid expansion protocol (20). Briefly, 200,000 T cells were mixed with 5 million irradiated EBV-transformed B cells and 25 million irradiated PBMC as feeder cells in T cell media. Anti-CD3 (clone OKT3) was added at a final concentration of 30 ng/mL, and the mixture was incubated overnight at 37°C/5% CO2. The following day, recombinant IL-2 (rIL-2) (UWMC Clinical Pharmacy) was added to a final concentration of 50 U/mL. On day 4, the cells were washed twice in T cell media to remove OKT3, and fresh media supplemented with rIL-2 at 50 U/mL was added. Half the media was replaced every three days or split into new T25 tissue culture flasks (Costar) as determined by cell confluency. After 13 days in culture, the lines were screened by tetramer staining and then cryopreserved on day 14.
Clinical cohorts
As recently published, 6363 adolescents were enrolled into a study that aimed to determine the incidence and prevalence of tuberculosis infection and disease (21). 12- to 18-year-old adolescents were enrolled at eleven high schools in the Worcester region of the Western Cape of South Africa. Subjects were screened for the presence of latent tuberculosis by a tuberculin skin test and IFN-γ release assay (IGRA) QuantiFERON-TB GOLD In-Tube (Cellestis Inc.) at study entry. PBMC were isolated from freshly collected heparinized blood via density centrifugation and cryopreserved. For this work, a subset of samples from 10 M.tb-infected and 10 M.tb-uninfected adolescents were selected based on matching for age and sex and availability of cryopreserved specimens after completion of the primary objectives of the parent study. We also accessed a recently published cohort of South African adults with a new diagnosis of active tuberculosis (22). Only participants that were ≥18 years of age and seronegative for HIV were included. All included patients had either positive sputum smear microscopy and/or positive culture for M.tb. Blood was obtained and PBMC archived prior to or within 7 days of starting standard course anti-TB treatment, which was provided according to South African national health guidelines. For this work, a sample from 10 adults with active tuberculosis was selected based on availability of cryopreserved specimens after completion of the primary study. For T cell cloning studies, we used cryopreserved PBMC from a cohort of healthy South African adults (Supplemental Table 1).
Flow cytometry
PBMC from South African adolescents and adults were thawed and rested overnight as described above. The following day, one million PBMC per subject were plated into each of two wells of a 96-well U-bottom plate. The cells were blocked in human serum/FACS buffer and stained with tetramer (unloaded CD1B tetramer PE, GMM-loaded CD1B tetramer APC), Live/Dead, and anti-CD3 as described above. Cells were then washed twice in FACS buffer, and all samples were resuspended in 200 μL of 1% paraformaldehyde (Electron Microscopy Sciences) prior to acquisition on a LSRII (BD Biosciences) equipped with blue (488 nm), green (532 nm), red (628 nm), violet (405 nm), and ultraviolet (355 nm) lasers.
Functional assays
We used IFN-γ ELISPOT to examine antigen-specificity of T cell lines. Briefly, K562 cells stably transfected with empty vector (K562-EV) or CD1B (K562-CD1B) were maintained in RPMI 1640 (Gibco) supplemented with 10% fetal calf serum and G418 (Sigma) at a concentration of 200 μg/mL and periodically assessed for CD1B expression by flow cytometry and mycoplasma contamination (23). Multiscreen-IP filter plates (Millipore) were coated with 1-D1K antibody (Mabtech) overnight at 4°C. Lipids were evaporated to dryness from chloroform-based solvents under a sterile nitrogen stream and then sonicated into media. This lipid suspension was added to co-cultures of 50,000 mock-transfected or CD1B-transfected K562 antigen-presenting cells and 2,000 T cells with a final concentration of 1 μg/mL for mycolic acid (MA) and GMM (7, 24). The co-cultures were incubated for 16 hours at 37°C. The following day, the cells were lysed with water and then incubated with 7-B6-1 biotin conjugate (Mabtech) for two hours at room temperature. The plate was washed with PBS and then incubated with ExtraAvidin-Alkaline Phosphatase (Sigma) for 1 hour at room temperature. Lastly, the wells were washed and then developed using BCIP/NBT substrate (Sigma) for 5 min at room temperature in the dark. The wells were imaged, and the IFN-γ spots were counted using an ImmunoSpot S6 Core Analyzer (Cellular Technology Limited).
To observe intracellular cytokine staining following GMM antigen stimulation, 3.3 million K562 cells/mL were incubated with 5 μg/mL GMM at a final volume of 100 μL for 18 hours at 37°C/5% CO2 to facilitate lipid loading. The following day, T cell lines were plated at 1 million cells/mL, and 80 μL of pre-loaded K562 cells was added to the T cells. The cell mixture was allowed to incubate for six hours in the presence of anti-CD28/49d antibodies (BD Biosciences), Brefeldin A at a final concentration of 10 μg/mL (Sigma), and GolgiStop containing Monensin (BD Biosciences), after which EDTA, at a final concentration of 2 mM, was added to disaggregate cells. Plates were stored at 4°C until the following day when they were stained and acquired by FACS. We used a previously published optimized and validated 12-color panel (25, 26). Briefly, cells were first stained with Aqua Live/Dead viability dye. After washing, the cells were lysed with FACS Lyse (BD Biosciences) for 10 minutes at room temperature, washed, and then permeabilized with FACS Perm II (BD Biosciences) for 10 minutes at room temperature. Following two washes, cells were stained for the remaining markers (CD3 ECD, CD4 APC Alexa Fluor 750 (Beckman Coulter), CD8 PerCP Cy5.5, IFN-γ V450, TNF-α FITC, IL-2 PE, CD40L PE Cy5 (BD Biosciences), and IL-17a Alexa Fluor 700 (BioLegend). Fully stained cells were washed and resuspended in 1% paraformaldehyde. Data were acquired on a LSRII using a high-throughput sampler.
Ethics
The study was approved by the IRB of the University of Washington and the University of Cape Town. Written informed consent was obtained from all adult participants as well as from the parents and/or legal guardians of the adolescents who participated. In addition, written informed assent was obtained from the adolescents.
Comparative genomics
Data for CD1B (Chr1:158,327,951-158,331,531) and HLA-A (Chr6:29,941,260-29,945,884) were extracted from the 1000 Genomes Project (Phase 3; aligned to GRCh38), and measures of divergence calculated using VCFtools. Nucleotide diversity (π) (http://www.pnas.org/content/76/10/5269.abstract) was estimated with sliding windows of 50 base pair with two base pair steps, and Tajima’s D was estimated over static 50 base pair windows (27). Coding SNP variation with >1% minor allele frequency was extracted, and manually mapped onto the corresponding protein structures (CD1B: PDB #1UQS, HLA-A: PDB #3MRG) according to variant type (synonymous or nonsynonymous) (28, 29).
Immunosequencing and TCRdist
High-throughput sequencing of TCRs was performed using the ImmunoSEQ assay (Adaptive Biotechnologies) with TCR-β and/or TCR-α/δ assays for each sample using a multiplex PCR approach followed by Illumina high-throughput sequencing (30). The full details of TCRdist have been published elsewhere (17). Briefly, the distance between two TCRs is defined to be the similarity-weighted mismatch distance between the potential pMHC-contacting loops of the two receptors. We first computed a distance matrix between all GMM-specific receptors in ex vivo sorted or in vitro expanded T cells. This distance matrix was used for clustering and dimensionality reduction. To detect sequence motifs that were enriched in tetramer positive populations, a space of TCR sequence motifs was defined in terms of gene usage, and CDR3 amino acid and nucleotide content, then each motif was queried in both the tetramer-positive and tetramer-negative populations to assess statistical significance of enrichment.
The sampling density nearby each receptor (NN-distance) was estimated by taking the weighted average distance to the nearest-neighbor receptors in the repertoire exactly as described in reference (17). A small NN-distance indicates that there are many other nearby receptors and hence greater local sampling density. When assessing classification accuracy in the South African cohort, NN-distance scores were calculated by comparing the similarity of each sequence in each clinical subject’s repertoire to the ex vivo and in vitro GMM-specific cell populations. Taking the mean NN-distance for each locus and each cell population gives four coordinates associated with each subject in the clinical cohort. Smaller values of a given coordinate indicate more similarity of that subject to the GMM-specific cell population. To compute area under the receiver operator curve (AUROC) scores, adults with active tuberculosis (positives) and IGRA-positive or IGRA-negative adolescents (negatives) were classified using linear discriminant analysis (LDA) and either GEM-TCR motif frequencies or the four NN-distance coordinates as input. A receiver operator curve was constructed by plotting the true positive rate (fractional recovery of GMM-specific receptors) versus false positive rate (fractional recovery of negative receptors) using leave-one-out cross validation, and the area under this receiver operator curve was measured. Similarly, the probability of ‘active TB’ assignment was computed using the LDA trained with a leave-one-out cross validation approach.
Manifold embedding with t-SNE and disease classification with linear discriminant analysis were implemented using the scikit-learn package in Python with default parameters (31). We chose linear discriminant analysis as a classification framework since this methodology does not involve model tuning that may lead to overfitting, and the parametric assumptions facilitate robustness to small sample sizes. Pairwise TCRdist values among sequences were used as input for t-SNE.
Data and code availability
Immunosequencing data is available for download from Adaptive Biotechnologies at the following
Analysis code can be accessed at https://github.com/seshadrilab/CD1bGMM
Results
CD1B underwent purifying selection during human evolution
CD1 was originally described as structurally non-polymorphic on the basis of Southern blot cross-hybridization between human and mouse genes (32). Most of the genetic work that followed this original description focused on the frequencies of a few allelic variants in case-control studies involving small numbers of subjects and in populations of limited ethnic diversity (8). Because our work involves African populations that are not well represented in this body of work, we sought to quantitatively examine evolution of CD1B across diverse populations. We examined DNA sequence diversity in a representative MHC Class I gene (HLA-A) and CD1B using data from Phase 3 of the 1000 Genomes Project (33). This resource includes whole genome sequences from 2,504 individuals covering all five major continental ancestry groups, thus serving as a comprehensive resource for studying human genetic diversity and evolution. For each of these two loci, we quantified nucleotide diversity (π) and evidence of selection (Tajima’s D) at each position along the gene (27, 34). HLA-A had a median π of 0.015 with hotspots noted in exons 2 and 3, which code for the peptide antigen-binding domains. A median Tajima’s D of 0.92 suggested balancing selection of multiple alleles at high and low frequencies (Figure 1A). We mapped nucleotide diversity onto the crystal structure of HLA-A and noted enrichment of missense, nonsense, and frameshift mutations among residues lining the peptide-binding groove (Figure 1B) (28). These data are consistent with published studies of population diversity within MHC genes and with our current understanding of how sequence diversity leads to diversity in ligand binding (35, 36). By contrast, CD1B was nearly invariant with a median π of 0.00014. A median Tajima’s D value of −1.14 indicated weak purifying selection in which deleterious alleles have been selectively removed over time (Figure 1C). The tertiary structure of the lipid-binding domain of CD1B was completely conserved with only two synonymous polymorphisms outside of the antigen-binding groove (Figure 1D) (29). Remarkably, these data reveal that the evolutionary pressures that led to diverse MHC Class I alleles may have had the opposite effect on CD1B so that all humans express nearly identical CD1B proteins.
Figure 1. Human genetic variation in HLA-A and CD1B.
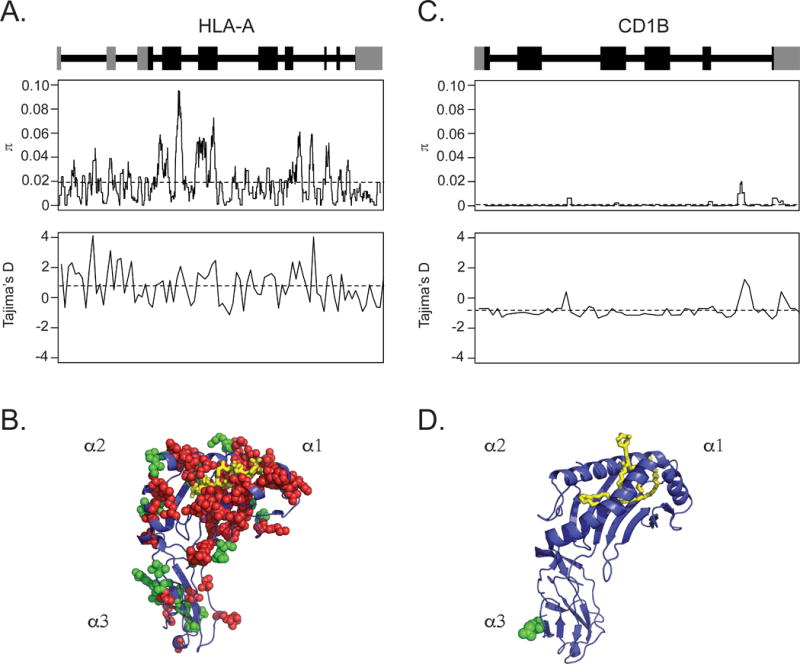
The schematic of each gene structure, including introns (as lines) and exons (as blocks), with coding sequence indicated in black and untranslated regions in grey. (A) Nucleotide diversity (π) and Tajima’s D are reported for HLA-A2 with the average value across each gene denoted by a horizontal dashed line. (B) Variation in protein coding sequence for HLA-A2 is represented for SNPs with >1% minor allele frequency. (C) CD1B nucleotide diversity (π) and Tajima’s D as well as (D) variation in CD1B protein coding sequence are shown for comparison. Invariant residues are denoted in blue as a ribbon structure. Spheres denote polymorphic residues, with green representing synonymous substitutions and red representing non-synonymous substitutions. The ligand, either peptide or lipid, is shown in yellow.
The diversity of T cells that bind CD1B-GMM tetramer
Next, we sought to determine the diversity of TCRs expressed by T cells restricted to a single mycobacterial lipid antigen, glucose monomycolate (GMM). We hypothesized that the structural constraint imposed by CD1B would result in a restricted TCR repertoire. We first used CD1B tetramers loaded with GMM to isolate antigen-specific T cells from four healthy South African adults. We comprehensively profiled the TCRs present within hundreds of ex vivo tetramer-positive and thousands of tetramer-negative cell populations using unpaired high-throughput immunosequencing of rearranged TCR-α and TCR-β loci (3) (Figure 2A). Because the number of tetramer-positive cells detected ex vivo was low, we deliberately set a high sort gate to avoid sequencing tetramer-negative cells, keeping in mind that we might miss cells that bind the tetramer with low affinity. As further confirmation, we expanded the sorted cells in vitro for four weeks to derive GMM-specific T cell lines. Although clonal expansion may impact TCR diversity, we reasoned that antigen-specific T cells isolated from T cell lines would be robust against non-specific or low-affinity staining, thus complementing our ex vivo analysis. GMM-specific T cell lines did not cross-react even with closely related antigens, such as mycolic acid (Figure 2B). Further, GMM-specific T cell lines were primarily CD4+ and had a polyfunctional profile including IL-17a production in the presence of GMM and CD1B (Figure 2B and 2C). GMM-specific T cell lines were also analyzed for TCR diversity, providing complementary sets of immunosequencing data that enabled us to comprehensively examine the diversity of GMM-specific TCRs.
Figure 2. Study schema and characterization of T cell lines.
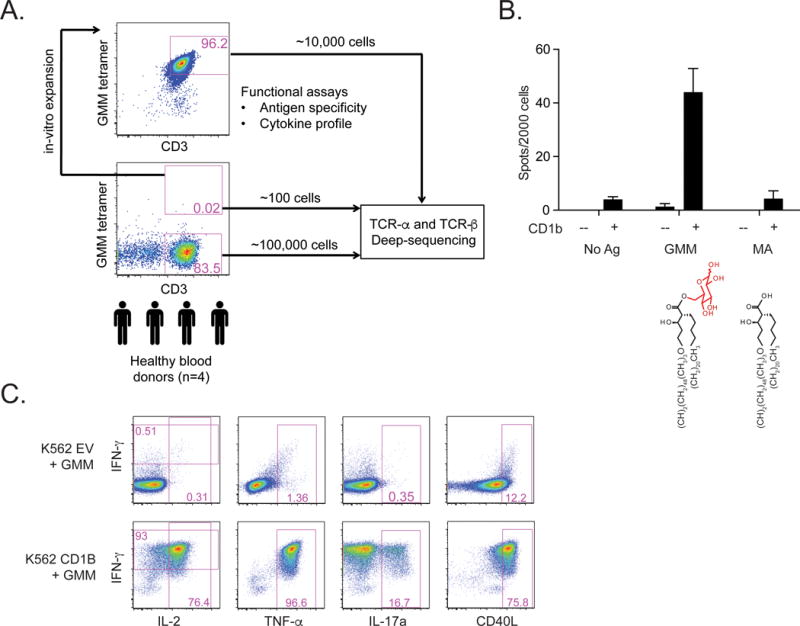
(A) We used GMM-loaded CD1B tetramers to stain and sort T cells from cryopreserved PBMCs derived from four healthy South African blood donors. These cells were either used to generate T cell lines, or submitted directly for TCR immunosequencing. Tetramer-negative T cells as well as tetramer-positive T cells that were re-sorted from T cell lines were also submitted for TCR immunosequencing. (B) T cell lines were incubated with either mock transfected or CD1B-transfected K562 cells as antigen-presenting cells in the presence of no antigen, GMM, or mycolic acid (MA). Partial structures of the two lipid antigens are shown. IFN-γ production by ELISPOT was quantified after overnight incubation. (C) Mock-transfected or CD1B-transfected K562 cells were loaded with GMM overnight and used to activate T cells for six hours prior to intracellular cytokine staining. Data in B and C are representative of three independent experiments.
Contrary to our expectations, we found more than 400 unique TCR-α sequences and 600 unique TCR-β sequences present within the ex vivo tetramer-positive cells. We considered the possibility that some of these sequences might be the result of experimental artifact. However, several aspects of our approach argued against this. First, TCR sequences detected among ex vivo tetramer-positive cells were absent among ~100,000 tetramer-negative cells that were sorted from the same donor and analyzed at the same time, thus justifying our conservative sorting strategy. Second, a number of sequences detected ex vivo were also detected after in vitro expansion, albeit at different frequencies. For example, we found that sequences expressed by GEM and LDN5-like T cells were overrepresented in cells that had undergone in vitro expansion (15, 37).
To explore the relationships between known conserved motifs and newly identified diverse sequences, we used TCRdist to compute distance values between all pairs of TCR-α sequences and between all pairs of TCR-β sequences among the ex vivo and in vitro tetramer-positive samples from all four donors. We used t-SNE to visualize the ex vivo tetramer positive sequences in a two-dimensional space and noted that the conserved GEM and LDN5-like motifs constituted a minority of GMM-specific TCRs detected (Figure 3A and 3B). Also, the majority of unique sequences were detected in only a subset of the donors. However, all four donors were represented within the data and we did not observe any evidence of clustering by donor. Clustering analysis revealed patterns of gene segment usage as well as CDR3 length and composition (Figure 3C and 3D). For example, TRBJ1-2 was present in more than 30 ex vivo clonotypes that nevertheless expressed diverse TRBV genes. The CDR3 length was longer and composition more variable than GEM TCRs containing TRBV6-2. However, TRBJ1-2 encoded a germline ‘KTYGY’ motif that is not present in the GEM TCR. As expected, the overall diversity of rearrangements was higher ex vivo compared to in vitro. However, several TCR-α (TRAV1-2 + TRAJ9, TRAV17 + TRAJ9, TRAV8-2 + TRAJ20, TRAV12-2 + TRAJ48) and TCR-β (TRBV6-2 + TRBJ2-3, TRBV4-1 + TRBJ1-2, TRBV19 + TRBJ1-2) rearrangements were detected by both approaches despite the potential bias introduced by in vitro expansion. Taken together, these data reveal that a surprising diversity of TCRs, many of which are not shared across donors, are capable of binding GMM despite the complete conservation of CD1B.
Figure 3. Diversity of GMM-specific TCRs.
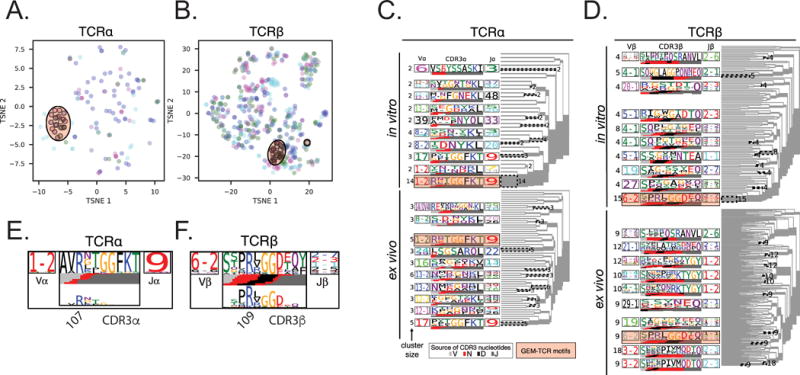
Using the TCRdist values, t-distributed stochastic neighbor embedding (t-SNE) was used to visualize (A) TCR-α and (B) TCR-β sequences from both ex vivo tetramer positive cell populations in two-dimensions. Colors correspond to each of the four donors. Since all colors are dispersed across the embedded space, this suggests that many sequences are detected in only one donor. Sequences matching the GEM-TCR motifs are circled and represent the minority of sequences in our data. TCRdist was used to construct average-linkage dendrograms of (C) TCR-α and (D) TCR-β sequences from the ex vivo and in vitro CD1B-GMM tetramer positive samples from all four donors. Significant sequence motif clusters are identified as patterns that are statistically enriched in the tetramer positive as compared with the tetramer negative populations and presented as sequence logos. Each logo depicts the V and J gene frequencies in the cluster, and the CDR3 amino acid sequences. The inferred rearrangement structure, including deviations from germline, are shown under the logo. Clusters matching the previously reported GMM-specific GEM TCR motifs and LDN5-like sequences are highlighted as orange rectangles. Selection for specific CDR3 amino acid residues was investigated for the canonical GEM (E) TRAV1-2/TRAJ9 rearrangement of length 13 and (F) TRB6-2/TRBJ2 motifs of length 14, which have been shown to pair as a heterodimer. The motif sequence logo is shown at full height (top) and scaled (bottom) by per-column relative entropy to the tetramer-negative population frequencies derived from TCRs with matching gene-segment and CDR3 length.
A notable result from TCRdist is that all the GMM-specific sequences contained N-region additions or deletions, challenging the prevailing view that TCRs in this system are typically the result of germline rearrangements characterized by little or no junctional editing. To determine the extent to which these changes were important for antigen recognition, we used TCRdist to assess selection of specific residues within the CDR3 of approximately 30 clonotypes expressing the GEM TCR because results could be compared against the recently solved crystal structure (38). Within the TCR-α chain, we noted enrichment of arginine at position 107 of TRAV1-2 and TRAJ9 containing sequences in tetramer-positive cells compared to tetramer-negative cells with the same V/J gene usage (Figure 3E). This residue directly contacts the glucose moiety of GMM via a hydrogen bond and was critical for T cell activation in published mutagenesis studies (15, 38). We similarly noted enrichment of an ‘RLGGD’ motif in the CDR3 of TCR-β (Figure 3F). The arginine at position 109 is known to make a hydrogen bond with the lipid tail of GMM while ‘GGD’ residues make hydrogen bonds with the glucose moiety of GMM (38). Thus, TCRdist enabled us to infer molecular interactions important for antigen recognition from immunosequencing data alone and reveals that non-germline encoded residues are ubiquitous, even within the highly conserved GEM TCR.
GMM-specific TCRs are clonally expanded during active tuberculosis
Next, we sought to examine clonal expansion of GMM-specific TCRs in a genetically diverse cohort of South Africans with known M.tb infection status (Supplementary Table 1). This cohort included adolescents without latent tuberculosis infection (IGRA-negative, n=10) or with latent tuberculosis (IGRA-positive, n=10), as well as adults with a new diagnosis of active tuberculosis disease (Active TB, n=10). We comprehensively profiled the TCR-α and TCR-β chains from an average of approximately 100,000 T cells per donor by immunosequencing cryopreserved peripheral blood mononuclear cells (PBMCs). We first computed the fraction of unique TCRs that matched any of the previously described GEM TCR sequences with respect to V/J gene usage and CDR3 length (15, 39). Sequences matching the GEM TCR-α and TCR-β motifs were detected in all thirty donors, consistent with a donor-unrestricted mechanism of antigen recognition by T cells bearing these TCRs (Figure 4A and 4B). We observed moderate expansion of the known GEM TCR-α motif in subjects with active tuberculosis compared to IGRA-negative control subjects (p=0.03) but no difference in the frequency of known GEM TCR-β motif (Figure 4A and 4B). Notably, we did not see expansion of innate-like mucosal associated invariant T (MAIT) cell or iNKT cell TCR-α rearrangements in active tuberculosis (Supplementary Figure 1). Thus, GEM T cells do not resemble innate-like T cells but undergo in vivo clonal expansion in the presence of antigen.
Figure 4. GMM-specific TCRs are clonally expanded during active tuberculosis.
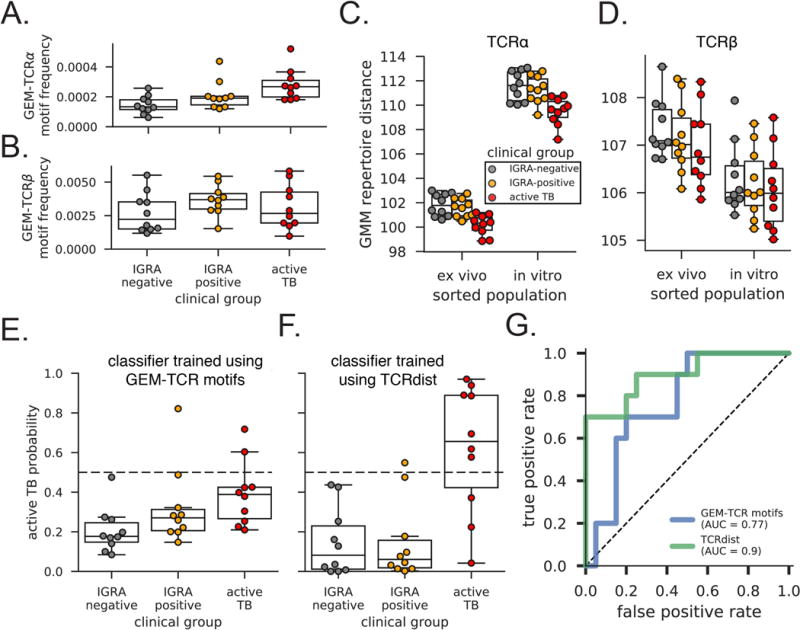
The frequency of unique sequences present within unsorted PBMC that match previously reported (A) GEM TCR-α and (B) GEM TCR-β sequences are shown stratified by clinical group. Within TCR-α, there is an increased motif burden present in PBMC collected from active TB subjects compared to IGRA-negative subjects (Kruskal-Wallace p=0.03, Dunn post-test p=0.0038). There was not a statistically significant difference in subject-specific TCR-β motif burdens in PBMC across the three groups (Kruskal-Wallace p=0.67). Repertoire distances, computed as mean NN-distance values, between PBMC and the ex vivo and in vitro tetramer positive (C) TCR-α and (D) TCR-β populations are shown for each subject. There was a statistically significant difference between PBMC from active TB subjects and IGRA-negative subjects in ex vivo and in vitro expanded TCR-α sequences (p=0.0005 and p=0.001 using Students t-test). Cross-validated predictions of active TB using PBMC data are shown for a linear discriminant classifier trained on (E) GEM-TCR-α and GEM-TCR-β motif frequency features depicted from panels A and B and (F) GMM-specific TCR-α and TCR-β repertoire distance features depicted in panels C and D. (G) Cross-validated receiver operating characteristic curves are shown for each classification approach, where false positive rate is the fraction of IGRA-negative or IGRA-positive subjects predicted as active TB, and true positive rate is the fraction of active TB subjects predicted correctly as having active TB.
We then used TCRdist to define an alternative, and more flexible, quantification of GMM-specific TCRs in each subject. The nearest neighbor distance (NN-distance) between a new TCR sequence and a given set of sequences derived using peptide-loaded MHC tetramers was previously defined as the average TCRdist value between the new sequence and the nearest 10% of tetramer-positive sequences (17). The smaller the NN-distance, the more likely that two non-identical sequences recognize the same epitope. NN-distance therefore allows us to use the full diversity of GMM-specific TCRs, not just the conserved GEM TCR motifs, to analyze subject-specific T cell responses. Whether we used in vitro expanded (p=0.001) or ex vivo sorted (p=0.0005) tetramer-positive T cells as the reference, we observed smaller repertoire distances (as defined by mean NN-distance) between the diverse GMM-specific TCRs and TCR-α sequences from active TB subjects compared to IGRA-negative subjects (Figure 4C). For TCR-β, we noted a similar trend that was not statistically significant (Figure 4D). We noted significantly larger TCR-α distances to the in vitro expanded than to ex vivo T cells for subjects from all three clinical groups. This is likely the result of clonal expansion creating biases among the sampled in vitro sequences. Because the GMM-specific TCR-β sequences are more diverse, we expected this effect to a lesser extent but actually observed a slight decrease in distances across all clinical groups. We also noted a slight but consistent reduction in the mean CDR3-α length among active TB subjects compared with IGRA-negative or IGRA-positive subjects (Supplementary Figure 2). Because the sorted GMM-specific TCR-α sequences tend to be shorter than average, the smaller mean NN-distances of active TB subjects is partially driven by this length difference. These data illustrate the novel application of TCRdist to identify diverse T cell expansions from bulk immunosequencing data that are nevertheless antigen-specific. They also reveal clonal expansion of a diverse GMM-specific TCR repertoire in vivo, which is analogous to what is observed with MHC-restricted T cells after exposure to peptide antigen.
Finally, we tested the capacity of GMM-specific TCRs to accurately diagnose subjects in our cohort. We trained a linear discriminant model using the frequency of GEM TCR motifs and tested the classification accuracy using a leave-one-out cross validation approach. We found only 70% diagnostic accuracy (area under the receiver operating curve – AUROC 0.77) in discriminating the 10 active TB subjects from the 10 IGRA-negative and 10 IGRA-positive subjects (Figure 4E and 4G). We similarly trained and tested a model using the diverse GMM-specific repertoire and found 87% accuracy (AUROC .90) (Figure 4F and 4G). The additional sequence information integrated by TCRdist allowed us to identify more active TB subjects and improve the diagnostic accuracy of the model (Figure 4E and 4F).
Discussion
In summary, we show that T cells specific for a lipid antigen presented by the highly-conserved antigen presenting molecule CD1b share several features with T cells specific for peptide antigens restricted by polymorphic MHC. First, the TCR repertoire is diverse and dominated by subject-specific or ‘private’ responses. Diverse TCRs are composed of genes from different variable and joining families and contain CDR3 lengths that differ as well. Previously discovered conserved TCRs in this system constituted the minority of ex vivo tetramer-positive TCRs, which is analogous to ‘public’ TCRs that are specific for viral peptide antigens (40). For both public and private responses, junctional editing in the CDR3 region is required to generate functional TCRs that are lipid antigen-specific. Since GMM is a bacterial antigen without a mammalian homologue, these data suggest that the rules governing positive and negative thymic selection of naïve GMM-specific T cells are likely very similar to the selection of T cells specific for foreign peptide antigens. Finally, we used a distance-based metric to show that GMM-specific TCRs are clonally expanded during active tuberculosis. From these data, we infer that similar mechanisms govern the selection and expansion of peptide and lipid antigen-specific T cells despite the non-polymorphic nature of CD1.
The discovery of the non-polymorphic CD1 family of antigen-presenting molecules suggested a corresponding family of T cells expressing conserved T cell receptors (14). iNKT and GEM T cells fit this paradigm, but counter examples have also been identified. CD1d-restricted T cells that express diverse TCRs and fail to respond to the canonical glycolipid ligand, α-GalCer, have been termed “Type-II” NKT cells (41, 42). Our data suggest a simple binary classification system of canonical and non-canonical TCR motifs may be insufficient. By employing a comprehensive approach to exploring TCR diversity, we find a spectrum of TCRs that are specific for GMM, proving that the structural constraints imposed by an invariant antigen-presenting molecule do not necessitate an invariant TCR repertoire.
Our findings regarding the evolutionary genetics of CD1B confirm and substantially extend knowledge in this area. We leveraged the size and population diversity inherent to the 1000 Genomes Project to claim purifying selection during human evolution. This is a powerful premise from which to attempt TCR epitope prediction because it allows us to generalize findings from population-level data in a way that is not possible with MHC. We also demonstrate significant conservation within intronic sequences, which suggest that mechanisms regulating CD1 gene expression have been tightly controlled through evolution even though most have not yet been defined (43).
TCRdist was originally validated for paired TCR-α and TCR-β sequences expressed by MHC-restricted T cells, but we show that it can be applied to unpaired data and MHC-independent antigen-presenting systems as well. We identified all previously published GMM-specific TCR sequences while discovering several new ones. Hierarchical distance trees show a dominant group of clustered receptors with sequences similar to the conserved GEM TCR together with a more diverse, outlying population of diverged receptors. Remarkably, this is the same pattern that was observed in a study of MHC Class-I restricted TCRs specific for viral epitopes (17). We also used TCRdist to identify enriched residues within the CDR3 of the GEM TCR and confirmed findings from a recently published crystal structure (38). Thus, the molecular interactions between lipid antigens bound to CD1 molecules and TCRs may be more similar to peptide-MHC than previously appreciated. Finally, we validate the application of TCRdist in the context of CD1B by showing that we could develop a more accurate classifier of active tuberculosis using the additional sequences identified by this approach.
Our approach is now validated in the setting of GMM and tuberculosis, but it could be applied more broadly to lipid antigens outside of infectious diseases. For example, T cells have been described that recognize methyl-lysophosphatidic acid when bound to CD1C expressed by acute myeloid and B cell leukemias (44). T cells recognizing lysophospholipids bound to CD1A contribute to pathogenic inflammation in atopic dermatitis and psoriasis (45, 46). Human CD1A and CD1C tetramers as well as synthetic lipid antigens are available as validated reagents, so that an approach similar to the one described here could potentially be used to define allergic or cancer-specific TCR repertoires and develop molecular diagnostics independent of genetic background.
Supplementary Material
Acknowledgments
The authors would like to thank Branch Moody and Martine Gilleron for providing lipid antigens, and Frederick Matsen, Kevin Urdahl, and Annemieke de Jong for insightful comments during the preparation of this manuscript. We acknowledge the NIH Tetramer Core Facility for provision of biotinylated CD1B monomers.
This work was supported by the National Institutes of Health (K08-AI089938 and R01-AI125189), Doris Duke Charitable Foundation Clinical Scientist Development Award, University of Washington Department of Medicine, and UW Royalty Research Fund (CS). WSD was supported, in part, by a National Institutes of Health National Human Genome Research Institute Genome Training Grant (5T32HG000035-23).
Footnotes
Author Contributions
C.S. and R.O.E. designed the study. W.S.D. and K.K.Q.Y, and P.B. performed the experiments and analyzed the data. D.W. and W.S. contributed human genetic analyses. W.S.D and P.B. performed TCRdist analysis. C.L.D. and T.J.S. established the clinical cohorts. S.C.D facilitated flow cytometry studies. A.S. and H.S.R. facilitated immunosequencing. W.S.D, M.V., R.O.E., and C.S. wrote the manuscript with contributions from all authors.
References
- 1.Garcia KC, Degano M, Stanfield RL, Brunmark A, Jackson MR, Peterson PA, Teyton L, Wilson IA. An alpha beta T Cell Receptor Structure at 2.5 A and Its Orientation in the TCR-MHC Complex. Science (80-) 1996;274:209–219. doi: 10.1126/science.274.5285.209. [DOI] [PubMed] [Google Scholar]
- 2.Davis MM, Bjorkman PJ. T-cell antigen receptor genes and T-cell recognition. Nature. 1988;334:395–402. doi: 10.1038/334395a0. [DOI] [PubMed] [Google Scholar]
- 3.Robins HS, Campregher PV, Srivastava SK, Wacher A, Turtle CJ, Kahsai O, Riddell SR, Warren EH, Carlson CS. Comprehensive assessment of T-cell receptor \beta -chain diversity in \alpha\beta T cells. Blood. 2010;114:4099–4107. doi: 10.1182/blood-2009-04-217604. [DOI] [PMC free article] [PubMed] [Google Scholar]
- 4.Robins HS, Srivastava SK, Campregher PV, Turtle CJ, Andriesen J, Riddell SR, Carlson CS, Warren EH. Overlap and effective size of the human CD8+ T cell receptor repertoire. Sci Transl Med. 2010;2:47ra64. doi: 10.1126/scitranslmed.3001442. [DOI] [PMC free article] [PubMed] [Google Scholar]
- 5.Venturi V, Chin HY, Asher TE, Ladell K, Scheinberg P, Bornstein E, van Bockel D, Kelleher AD, Douek DC, Price DA, Davenport MP. TCR beta-chain sharing in human CD8+ T cell responses to cytomegalovirus and EBV. J Immunol. 2008;181:7853–7862. doi: 10.4049/jimmunol.181.11.7853. [DOI] [PubMed] [Google Scholar]
- 6.dos Santos EJM, McCabe A, Gonzalez-Galarza FF, Jones AR, Middleton D. Allele Frequencies Net Database: Improvements for storage of individual genotypes and analysis of existing data. Hum Immunol. 2016;77:238–248. doi: 10.1016/j.humimm.2015.11.013. [DOI] [PubMed] [Google Scholar]
- 7.Beckman EM, Porcelli SA, Morita CT, Behar SM, Furlong ST, Brenner MB. Recognition of a lipid antigen by CD1-restricted alpha beta+ T cells. 1994:691–694. doi: 10.1038/372691a0. [DOI] [PubMed] [Google Scholar]
- 8.Han M, Hannick LI, DiBrino M, Robinson MA. Polymorphism of human CD1 genes. Tissue Antigens. 1999;54:122–127. doi: 10.1034/j.1399-0039.1999.540202.x. [DOI] [PubMed] [Google Scholar]
- 9.Oteo M, Parra JF, Mirones I, Giménez LI, Setién F, Martínez-Naves E. Single strand conformational polymorphism analysis of human CD1 genes in different ethnic groups. Tissue Antigens. 1999;53:545–50. doi: 10.1034/j.1399-0039.1999.530604.x. [DOI] [PubMed] [Google Scholar]
- 10.Im JS, Kang TJ, Lee SB, Kim CH, Lee SH, Venkataswamy MM, Serfass ER, Chen B, Illarionov PA, Besra GS, Jacobs WR, Chae GT, Porcelli SA. Alteration of the relative levels of iNKT cell subsets is associated with chronic mycobacterial infections. Clin Immunol. 2008;127:214–224. doi: 10.1016/j.clim.2007.12.005. [DOI] [PMC free article] [PubMed] [Google Scholar]
- 11.Chan AC, Leeansyah E, Cochrane A, d’Udekemd’ Acoz Y, Mittag D, Harrison LC, Godfrey DI, Berzins SP. Ex-vivo analysis of human Natural Killer T cells demonstrates heterogeneity between tissues and within established CD4+ and CD4- subsets. Clin Exp Immunol. 2013;172:129–137. doi: 10.1111/cei.12045. [DOI] [PMC free article] [PubMed] [Google Scholar]
- 12.Montoya CJ, Pollard D, Martinson J, Kumari K, Wasserfall C, Mulder CB, Rugeles MT, Atkinson MA, Landay AL, Wilson SB. Characterization of human invariant natural killer T subsets in health and disease using a novel invariant natural killer T cell-clonotypic monoclonal antibody, 6B11. Immunology. 2007;122:1–14. doi: 10.1111/j.1365-2567.2007.02647.x. [DOI] [PMC free article] [PubMed] [Google Scholar]
- 13.Lantz O, Bendelac A. An invariant T cell receptor alpha chain is used by a unique subset of major histocompatibility complex class I-specific CD4+ and CD4-8- T cells in mice and humans. J Exp Med. 1994;180:1097–1106. doi: 10.1084/jem.180.3.1097. [DOI] [PMC free article] [PubMed] [Google Scholar]
- 14.Porcelli S, Yockey CE, Brenner MB, Balk SP. Analysis of T cell antigen receptor (TCR) expression by human peripheral blood CD4-8- alpha/beta T cells demonstrates preferential use of several V beta genes and an invariant TCR alpha chain. J Exp Med. 1993;178:1–16. doi: 10.1084/jem.178.1.1. [DOI] [PMC free article] [PubMed] [Google Scholar]
- 15.Van Rhijn I, Kasmar A, de Jong A, Gras S, Bhati M, Doorenspleet ME, de Vries N, Godfrey DI, Altman JD, de Jager W, Rossjohn J, Moody DB. A conserved human T cell population targets mycobacterial antigens presented by CD1b. Nat Immunol. 2013;14:706–13. doi: 10.1038/ni.2630. [DOI] [PMC free article] [PubMed] [Google Scholar]
- 16.Quigley MF, Almeida JR, Price DA, Douek DC. Unbiased molecular analysis of T cell receptor expression using template-switch anchored RT-PCR. Curr Protoc Immunol. 2011:33. doi: 10.1002/0471142735.im1033s94. Chapter 10: Unit10. [DOI] [PMC free article] [PubMed] [Google Scholar]
- 17.Dash P, Fiore-Gartland AJ, Hertz T, Wang GC, Sharma S, Souquette A, Crawford JC, Clemens EB, Nguyen THO, Kedzierska K, La Gruta NL, Bradley P, Thomas PG. Quantifiable predictive features define epitope-specific T cell receptor repertoires. Nature. 2017;547:89–93. doi: 10.1038/nature22383. [DOI] [PMC free article] [PubMed] [Google Scholar]
- 18.Kasmar AG, van Rhijn I, Cheng T-Y, Turner M, Seshadri C, Schiefner A, Kalathur RC, Annand JW, de Jong A, Shires J, Leon L, Brenner M, Wilson IA, Altman JD, Moody DB. CD1b tetramers bind T cell receptors to identify a mycobacterial glycolipid-reactive T cell repertoire in humans. J Exp Med. 2011;208:1741–1747. doi: 10.1084/jem.20110665. [DOI] [PMC free article] [PubMed] [Google Scholar]
- 19.Moody DB, Briken V, Cheng TY, Roura-Mir C, Guy MR, Geho DH, Tykocinski ML, Besra GS, Porcelli SA. Lipid length controls antigen entry into endosomal and nonendosomal pathways for CD1b presentation. Nat Immunol. 2002;3:435–442. doi: 10.1038/ni780. [DOI] [PubMed] [Google Scholar]
- 20.Riddell SR, Watanabe KS, Goodrich JM, Li CR, Agha ME, Greenberg PD. Restoration of viral immunity in immunodeficient humans by the adoptive transfer of T cell clones. Science. 1992;257:238–41. doi: 10.1126/science.1352912. [DOI] [PubMed] [Google Scholar]
- 21.Mahomed H, Hawkridge T, Verver S, Geiter L, Hatherill M, Abrahams DA, Ehrlich R, Hanekom WA, Hussey GD. Predictive factors for latent tuberculosis infection among adolescents in a high-burden area in South Africa. Int J Tuberc Lung Dis. 2011;15:331–336. [PubMed] [Google Scholar]
- 22.Day CL, Abrahams DA, Lerumo L, Janse van Rensburg E, Stone L, O’rie T, Pienaar B, de Kock M, Kaplan G, Mahomed H, Dheda K, Hanekom WA. Functional capacity of Mycobacterium tuberculosis-specific T cell responses in humans is associated with mycobacterial load. J Immunol. 2011;187:2222–32. doi: 10.4049/jimmunol.1101122. [DOI] [PMC free article] [PubMed] [Google Scholar]
- 23.de Jong A, Pena-Cruz V, Cheng TY, Clark RA, Van Rhijn I, Moody DB. CD1a-autoreactive T cells are a normal component of the human alphabeta T cell repertoire. Nat Immunol. 2010;11:1102–1109. doi: 10.1038/ni.1956. [DOI] [PMC free article] [PubMed] [Google Scholar]
- 24.Moody DB, Reinhold BB, Guy MR, Beckman EM, Frederique DE, Furlong ST, Ye S, Reinhold VN, Sieling PA, Modlin RL, Besra GS, Porcelli SA. Structural Requirements for Glycolipid Antigen Recognition by CD1b-Restricted T Cells. Science (80-) 1997;278:283–286. doi: 10.1126/science.278.5336.283. [DOI] [PubMed] [Google Scholar]
- 25.De Rosa SC, Carter DK, Mcelrath MJ, Rosa SCDe, Carter DK, Mcelrath MJ. OMIP-014 : Validated Multifunctional Characterization of Antigen-Specific Human T Cells by Intracellular Cytokine Staining. Cytom A. 2012;81:1019–1021. doi: 10.1002/cyto.a.22218. [DOI] [PMC free article] [PubMed] [Google Scholar]
- 26.Horton H, Thomas EP, Stucky JA, Frank I, Moodie Z, Huang Y, Chiu YL, McElrath MJ, De Rosa SC. Optimization and validation of an 8-color intracellular cytokine staining (ICS) assay to quantify antigen-specific T cells induced by vaccination. J Immunol Methods. 2007;323:39–54. doi: 10.1016/j.jim.2007.03.002. [DOI] [PMC free article] [PubMed] [Google Scholar]
- 27.Tajima F. Statistical method for testing the neutral mutation hypothesis by DNA polymorphism. Genetics. 1989;123:585–595. doi: 10.1093/genetics/123.3.585. [DOI] [PMC free article] [PubMed] [Google Scholar]
- 28.Reiser JB, Legoux F, Gras S, Trudel E, Chouquet A, Leger A, Le Gorrec M, Machillot P, Bonneville M, Saulquin X, Housset D. Analysis of relationships between peptide/MHC structural features and naive T cell frequency in humans. J Immunol. 2014;193:5816–5826. doi: 10.4049/jimmunol.1303084. [DOI] [PubMed] [Google Scholar]
- 29.Batuwangala T, Shepherd D, Gadola SD, Gibson KJC, Zaccai NR, Fersht AR, Besra GS, Cerundolo V, Jones EY. The crystal structure of human CD1b with a bound bacterial glycolipid. J Immunol. 2004;172:2382–2388. doi: 10.4049/jimmunol.172.4.2382. [DOI] [PubMed] [Google Scholar]
- 30.Carlson CS, Emerson RO, Sherwood AM, Desmarais C, Chung M-W, Parsons JM, Steen MS, LaMadrid-Herrmannsfeldt MA, Williamson DW, Livingston RJ, Wu D, Wood BL, Rieder MJ, Robins H. Using synthetic templates to design an unbiased multiplex PCR assay. Nat Commun. 2013;4:2680. doi: 10.1038/ncomms3680. [DOI] [PubMed] [Google Scholar]
- 31.Pedregosa F, Varoquaux G, Gramfort A, Michel V, Thirion B, Grisel O, Blondel M, Prettenhofer P, Weiss R, Dubourg V, Vanderplas J, Passos A, Cournapeau D, Brucher M, Perrot M, Duchesnay E. Scikit-learn: Machine Learning in Python. J Mach Learn Res. 2011;12:2825–2830. [Google Scholar]
- 32.Calabi F, Milstein C. A novel family of human major histocompatibility complex-related genes not mapping to chromosome 6. Nature. 1986;323:540–543. doi: 10.1038/323540a0. [DOI] [PubMed] [Google Scholar]
- 33.Genomes Project, C. Auton A, Brooks LD, Durbin RM, Garrison EP, Kang HM, Korbel JO, Marchini JL, McCarthy S, McVean GA, Abecasis GR. A global reference for human genetic variation. Nature. 2015;526:68–74. doi: 10.1038/nature15393. [DOI] [PMC free article] [PubMed] [Google Scholar]
- 34.Nei M, Li WH. Mathematical model for studying genetic variation in terms of restriction endonucleases. PNAS. 1979;76:5269–5273. doi: 10.1073/pnas.76.10.5269. [DOI] [PMC free article] [PubMed] [Google Scholar]
- 35.Parham P, Ohta T. Population biology of antigen presentation by MHC class I molecules. Science (80-) 1996;272:67–74. doi: 10.1126/science.272.5258.67. [DOI] [PubMed] [Google Scholar]
- 36.Bjorkman PJ, Parham P. Structure, function, and diversity of class I major histocompatibility complex molecules. Annu Rev Biochem. 1990;59:253–288. doi: 10.1146/annurev.bi.59.070190.001345. [DOI] [PubMed] [Google Scholar]
- 37.Van Rhijn I, Gherardin NA, Kasmar A, de Jager W, Pellicci DG, Kostenko L, Tan LL, Bhati M, Gras S, Godfrey DI, Rossjohn J, Moody DB. TCR bias and affinity define two compartments of the CD1b-glycolipid-specific T Cell repertoire. J Immunol. 2014;192:4054–60. doi: 10.4049/jimmunol.1400158. [DOI] [PMC free article] [PubMed] [Google Scholar]
- 38.Gras S, Van Rhijn I, Shahine A, Cheng T-Y, Bhati M, Tan LL, Halim H, Tuttle KD, Gapin L, Le Nours J, Moody DB, Rossjohn J. T cell receptor recognition of CD1b presenting a mycobacterial glycolipid. Nat Commun. 2016;7:13257. doi: 10.1038/ncomms13257. [DOI] [PMC free article] [PubMed] [Google Scholar]
- 39.Van Rhijn I, Gherardin NA, Kasmar A, de Jager W, Pellicci DG, Kostenko L, Tan LL, Bhati M, Gras S, Godfrey DI, Rossjohn J, Moody DB. TCR Bias and Affinity Define Two Compartments of the CD1b-Glycolipid-Specific T Cell Repertoire. J Immunol. 2014;192:4054–4060. doi: 10.4049/jimmunol.1400158. [DOI] [PMC free article] [PubMed] [Google Scholar]
- 40.Venturi V, Price DA, Douek DC, Davenport MP. The molecular basis for public T-cell responses? Nat Rev Immunol. 2008;8:231–238. doi: 10.1038/nri2260. [DOI] [PubMed] [Google Scholar]
- 41.Tatituri RVV, Watts GFM, Bhowruth V, Barton N, Rothchild A, Hsu FF, Almeida CF, Cox LR, Eggeling L, Cardell S, Rossjohn J, Godfrey DI, Behar SM, Besra GS, Brenner MB, Brigl M. Recognition of microbial and mammalian phospholipid antigens by NKT cells with diverse TCRs. Proc Natl Acad Sci U S A. 2013;110:1827–32. doi: 10.1073/pnas.1220601110. [DOI] [PMC free article] [PubMed] [Google Scholar]
- 42.Wolf BJ, Tatituri RVV, Almeida CF, Le Nours J, Bhowruth V, Johnson D, Uldrich AP, Hsu FF, Brigl M, Besra GS, Rossjohn J, Godfrey DI, Brenner MB. Identification of a Potent Microbial Lipid Antigen for Diverse NKT Cells. J Immunol. 2015;195:2540–51. doi: 10.4049/jimmunol.1501019. [DOI] [PMC free article] [PubMed] [Google Scholar]
- 43.Seshadri C, Shenoy M, Wells RD, Hensley-McBain T, Andersen-Nissen E, McElrath MJ, Cheng TY, Moody DB, Hawn TR. Human CD1a Deficiency Is Common and Genetically Regulated. J Immunol. 2013;191:1586–1593. doi: 10.4049/jimmunol.1300575. [DOI] [PMC free article] [PubMed] [Google Scholar]
- 44.Lepore M, de Lalla C, Gundimeda SR, Gsellinger H, Consonni M, Garavaglia C, Sansano S, Piccolo F, Scelfo A, Häussinger D, Montagna D, Locatelli F, Bonini C, Bondanza A, Forcina A, Li Z, Ni G, Ciceri F, Jenö P, Xia C, Mori L, Dellabona P, Casorati G, De Libero G. A novel self-lipid antigen targets human T cells against CD1c(+) leukemias. J Exp Med. 2014;211:1363–77. doi: 10.1084/jem.20140410. [DOI] [PMC free article] [PubMed] [Google Scholar]
- 45.Jarrett R, Salio M, Lloyd-Lavery A, Subramaniam S, Bourgeois E, Archer C, Cheung KL, Hardman C, Chandler D, Salimi M, Gutowska-Owsiak D, Bernardino De La Serna J, Fallon PG, Jolin H, Mckenzie A, Dziembowski A, Podobas EI, Bal W, Johnson D, Moody DB, Cerundolo V, Ogg G, de la Serna JB, Fallon PG, Jolin H, Mckenzie A, Dziembowski A, Podobas EI, Bal W, Johnson D, Moody DB, Cerundolo V, Ogg G. Filaggrin inhibits generation of CD1a neolipid antigens by house dust mite–derived phospholipase. Sci Transl Med. 2016;8 doi: 10.1126/scitranslmed.aad6833. [DOI] [PMC free article] [PubMed] [Google Scholar]
- 46.Cheung KL, Jarrett R, Subramaniam S, Salimi M, Gutowska-Owsiak D, Chen YL, Hardman C, Xue L, Cerundolo V, Ogg G. Psoriatic T cells recognize neolipid antigens generated by mast cell phospholipase delivered by exosomes and presented by CD1a. J Exp Med. 2016:1–14. doi: 10.1084/jem.20160258. [DOI] [PMC free article] [PubMed] [Google Scholar]
Associated Data
This section collects any data citations, data availability statements, or supplementary materials included in this article.
Supplementary Materials
Data Availability Statement
Immunosequencing data is available for download from Adaptive Biotechnologies at the following
Analysis code can be accessed at https://github.com/seshadrilab/CD1bGMM