

Correction to: GeroScience
10.1007/s11357-018-0014-2
The original version of this article unfortunately contained an error.
Panels in Fig. 3 were not sequentially presented. Panels “E” and “F” were placed in between “A and C” and “B and D”, respectively.
Fig. 3.
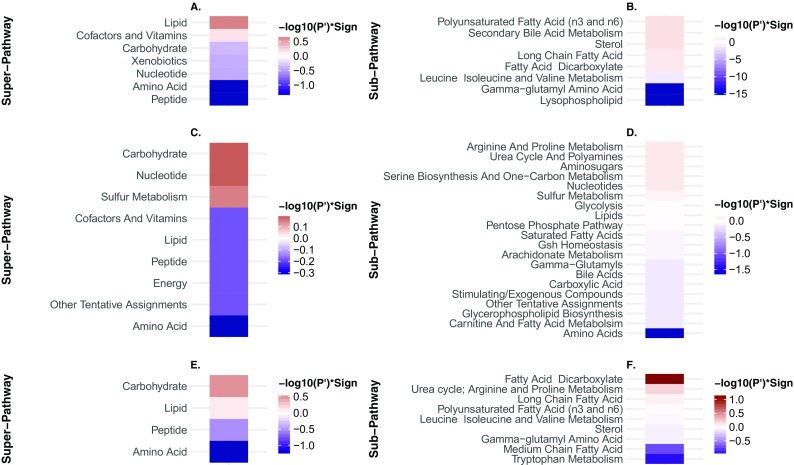
Single-column heatmaps describing the super- and sub-pathway terms that are enriched with metabolites strongly upregulated (red shades) and downregulated (blue shades) in (A-B) naked mole-rats relative to mice, (C-D) late-torpor relative to torpor-entrance in 13-lined ground squirrels, and (E-F) methionine-restricted relative to control-fed rats. Colors correspond to the -log10(FDR adjusted P-value) (termed P’) of the enrichment set analysis statistical test (see Methods) multiplied by the sign of the mean ln(fold-change) of metabolite abundance
The correct image is now presented here.
Footnotes
The online version of the original article can be found at 10.1007/s11357-018-0014-2