 AgNPs cause toxic damage by gradually imposing stress impacts on the target organs in mice.
Abstract
Concerns have arisen about the health and environmental impacts of the increasing commercial use of silver nanoparticles (AgNPs). However, the toxic mechanisms and target tissues of AgNPs have not been fully defined. In this paper, we investigated the tissue toxicity of mice after intravenous administration of AgNPs at a single-dose of 0.2, 2 or 5 mg per kg (body weight), respectively. Biodistribution, endoplasmic reticulum stress, and oxidative stress were examined in mouse organs at eight hours after exposure. Stress markers, e.g. HSP70, BIP, p-IRE1, p-PERK, chop and xbp-1s proteins/genes, were significantly upregulated in a dose-dependent manner. In the liver, spleen, lung and kidney, high stress accompanied by apoptosis occurred. Low stress levels were observed in the heart and brain. Thus, it is proposed that the liver, spleen, lung and kidney are dominant target tissues of AgNP exposure. The lower stress and toxicity in the heart and brain were in agreement with lower AgNP accumulation. The present results demonstrated that AgNP exposure eventually resulted in permanent toxic damage by gradually imposing stress impacts on target organs. These findings highlight the potent applications of stress markers in future risk evaluation of silver nanoparticle toxicity.
Introduction
Silver nanoparticles (AgNPs) are important antimicrobial nanomaterials used in medical products like wound dressings, surgical instruments, medical catheters and bone prostheses. The medical applications of AgNPs will result in uptake in the human body and the particles will be distributed in different organs by blood circulation. It has been shown that AgNPs are captured by the reticuloendothelial system and quickly distributed to associated tissues after entering in the blood.1–3 The single-photon emission computerized tomography (SPECT) imaging evidence shows that the liver and spleen are dominant tissues for capturing AgNPs from the blood.2 The capturing process is usually less than 10 min and a steady state level was achieved as a consequence of systemic blood circulation within 6 h.4 The retained AgNP usually remains at a steady state with a slightly decreasing trend in silver levels at least up to 14 days for single intravenous (i.v.) injection exposure.5 Similarly, other kinetic studies show that AgNPs distributed mostly in the liver, spleen, lungs, and kidneys, but in much lower quantities in the brain, heart, and testes after i.v. exposure.6,7 The concentration in the target tissue is normally an important determinant of its toxicity. However, the mechanisms of toxicity development were not clearly defined.
Previous in vitro studies indicated that a key event in AgNPs is intracellular oxidative stress resulting in apoptosis and/or necrosis.5,7 The endoplasmic reticulum (ER) is an important organelle and has functions in the folding and assembly of cellular proteins, supplements of lipids and sterols. The interruption of these normal functions by oxidative damage will lead to ER stress.5 ER stress is also known as the unfolded protein response (UPR), a conserved cellular self-protection mechanism of the body.8 Three ER proteins, including inositol requiring protein 1 (IRE1), PKR-like endoplasmic reticulum kinase (PERK), and activating transcription factor-6 (ATF-6) act as stress sensing proteins.9,10 Recently, ER-stress related events have been proposed as an early biomarker for nanotoxicological toxicity.11–13 As a hallmark of cytotoxicity, ER stress had been reported in human cell lines and zebrafish of AgNP induced toxicity.14,15 In a previous study, we investigated the toxicity and ER stress responses in mice after intratracheal instillation exposure to AgNPs.13 We observed that most AgNPs were accumulated in the lung, leading to significant apoptosis, but had lower adverse effects in the liver. In this paper, the association between the tissue concentrations of AgNP and ER stress was investigated after the mice were intravenously injected with AgNPs. Thus, this study gives insight into the realistic adverse health effects of AgNPs and the underlying mechanism of the toxicity development.
Materials and methods
Materials
AgNPs (NM-300K) and their stabilizing dispersant (NM-300K-DIS) were provided by the European Commission Joint Research Center (Ispra, Italy). The NPs were maintained in the same stabilizing agent solution, comprising 4% each of polyoxyethylene glycerol trioleate and Tween 20. Its dispersant (NM-300K-DIS) was used in all the following tests as the parallel control sample. The characterization was described in detail previously.13,16
Animal exposure
Balb/c mice (Beijing Vital River Experimental Animal Technology Co. Ltd, bodyweights of 20–22 g) were housed in makrolon cages in an isolated animal room with water and rodent food supplement. Animals were acclimated to the environment for at least one week prior to the experiment. All procedures were approved by the Ethics Committee of Animal Care and Experimentation of the National Institute for Environmental Studies, China. Mice were randomly divided into four groups, a control group, 0.2, 2, and5 mg per kg body weight (bw) AgNP (NM-300K) treatment groups. The tail i.v. injection was executed for the exposure. Animals were sacrificed at 8 hours to assess the stress and toxic responses after AgNP exposure as illustrated in Fig. 1. At necropsy, animals were anesthetized with 40 mg kg–1 intraperitoneal sodium pentobarbital and terminated by exsanguination via the abdominal aorta. The tissues and organs such as the heart, liver, spleen, kidneys and lung were excised and weighed accurately. Blood samples were collected by following the standard operation procedures for routine blood draw.
Fig. 1. Schematic diagram of the experimental design.
Blood assay
Totally 1 ml of blood was drawn by removing the right eyeball of a mouse before necropsy. About 100 μl whole blood was directly put into blood collection tubes containing EDTA for hematological analysis. About 900 μl blood was allowed to clot for serum separation and biochemical analyses. IL-6/TNF-α levels were analyzed by using the mouse IL-6/TNF-α specific ELISA kit (eBioscience, San Diego, CA, USA), following the manufacturer's instructions. The results were expressed in pg mL–1, and three independent experiments were performed.
RNA isolation, reverse-transcription PCR, and quantitative real-time PCR
Total RNA was isolated from mouse livers and spleens by TRIzol (Invitrogen) extraction. After quantification of the extracted RNA pellets, first-strand complementary DNA synthesis was performed by using the Superscript First-Strand Synthesis kit (Invitrogen). All samples were analyzed by quantitative real-time PCR (Eppendorf, Germany) using the SYBR Green containing PCR Master Mix with reaction volumes of 25 μl. The primer sequences are listed in ESI Table 1.†
Western blotting analysis
The frozen tissues were homogenized in lysis buffer (20 mM Tris-HCl, 150 mM NaCl, 1 mM EDTA, 1 mM EGTA, 1% Triton-X100 and protease inhibitor, pH 7.4) and then centrifuged for 15 min at 10 000g to discard the tissue debris at 4 °C. The supernatants were collected and the protein concentrations were determined using the Bio-Rad kit (USA). Proteins were separated on SDS-PAGE gels and subjected to desired antibodies after transfer to nitrocellulose membranes. The antibody against CHOP was purchased from Cell Signaling Technology (USA), and other antibodies including Actin, HSP70, BIP, CHOP, PERK, p-PERK, IRE-1, and p-IRE-1 were from Santa Cruz (USA). The blots were developed using HRP-conjugated secondary antibodies and ECL (enhanced chemiluminescence) solution (Thermo Scientific, USA).
TUNEL assay
The terminal deoxynucleotidyl transferase-mediated dUTP nick end labelling (TUNEL) assay could specifically detect the fragmented genomic DNA usually caused by sequential activation of caspases and endonucleases in apoptosis. The detailed method was described previously.13
Histopathological examination
The histopathological test was performed using routine procedures as previously described.17
ICP-MS
Ag element analysis was performed by the ICP-MS test. Briefly, samples (about 100 mg) were predigested overnight with 5.0 mL concentrated nitric acid (MOS grade), then mixed with 1.0 mL 30% H2O2 (MOS grade) and digested for 2 h in open vessels on a hot plate at 150 °C. Finally, the remaining solution about 0.5 mL was cooled, and then diluted to 3.0 mL with 2% HNO3. Ag107 was used as a standard material to draw the standard curve by measurement of a series of dilution samples. Indium (In) was used as an internal standard throughout the test. Both standard and test solutions were measured three times by ICP-MS (PerkinElmer, Waltham, MA, USA).
Statistics
The data were presented as mean ± standard deviation (mean ± SD). Statistical analyses were performed using Student's t-test for comparison of two groups. P values <0.05 were considered to be statistically significant.
Results
Characterization of AgNPs
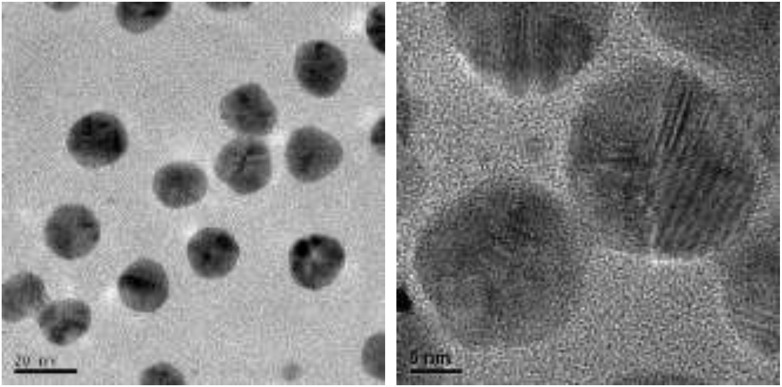
Transmission electron microscopy (TEM) test shows that the primary size of AgNPs was about 20 nm and no obvious agglomerates/aggregates were observed when dispersed in saline solution (Fig. 2). The hydrodynamic size of AgNPs was 38.2 ± 2.1 nm as determined by dynamic light scattering in pure water and the zeta potential was 0.3 ± 0.1 mV.13 Other related characters had been described in detail in our previous reports.13,18
Fig. 2. TEM images of silver nanoparticles.
Tissue distributions of AgNPs after intravenous injection
Silver concentrations were measured in various organs and tissues at 8 hours after one single tail intravenous injection. No significant difference was found in the body weight and organ weight after AgNP exposure (data not shown). Table 1 shows the results of mean silver concentration per gram organ tissue. Silver mostly accumulated in the liver and spleen, followed by the lung, kidney, heart and brain. After treatment with AgNPs, the Ag element distributions were dose dependent in the range of 34.7% to 73.2% in the liver, 5.6% to 23.5% in the spleen of total administrated silver NPs. The quantity of Ag element in other organs was less than 1% of the total administration. The silver levels in these organs could be overestimated due to silver contributions from the blood residue in the heart, kidneys and brain. The realistic organ stress and following damage were judged by the metrics of concentration (per organ tissue weight). By this metrics, the AgNP has an impact on the organ tissues in the following order: spleen > liver > lung ≫ kidneys > heart > brain.
Table 1. The silver concentrations in various tissues (expressed as ng per gram wet weight) at the 8 h time point after a single intravenous injection of AgNPs at 0.2 (low), 2 (middle) or 5 (high) mg kg–1, respectively. Data were expressed as mean ± SD, n = 3.
| Groups | Brain | Heart | Lung | Liver | Spleen | Kidneys |
| Control | 7.1 ± 1.6 | 17.0 ± 7.6 | 9.5 ± 0.7 | 27.1 ± 4.7 | 15.9 ± 1.0 | 6.7 ± 0.4 |
| Low | 8.6 ± 1.0 | 63.5 ± 3.2 | 149.2 ± 1.9 | 1022.0 ± 33.9 | 2254.6 ± 138.2 | 48.8 ± 3.6 |
| Middle | 49.3 ± 3.1 | 192.6 ± 7.1 | 1051.5 ± 50.4 | 17 527.8 ± 4108.1 | 28 419.0 ± 2837.6 | 262.9 ± 23.5 |
| High | 84.6 ± 10.6 | 425.1 ± 1.6 | 4663.2 ± 27.1 | 53 872.8 ± 1217.4 | 234 688.3 ± 32 057.9 | 644.2 ± 18.1 |
Evaluation of the stress levels
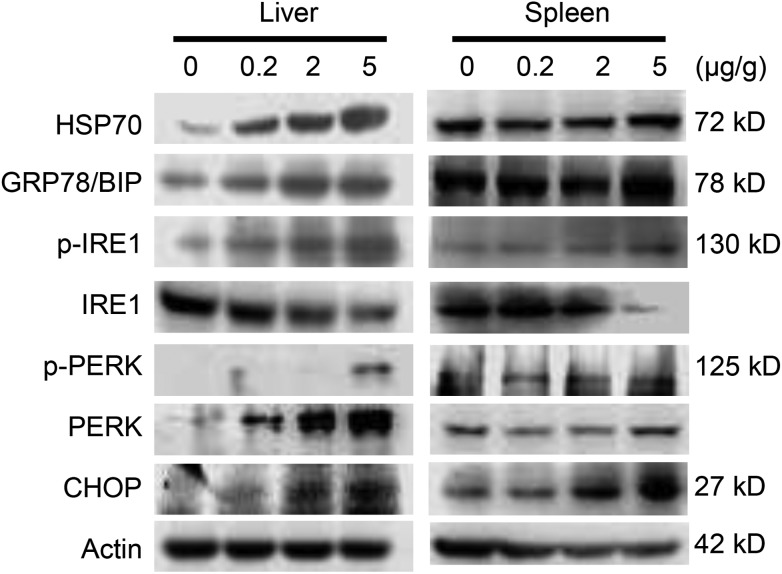
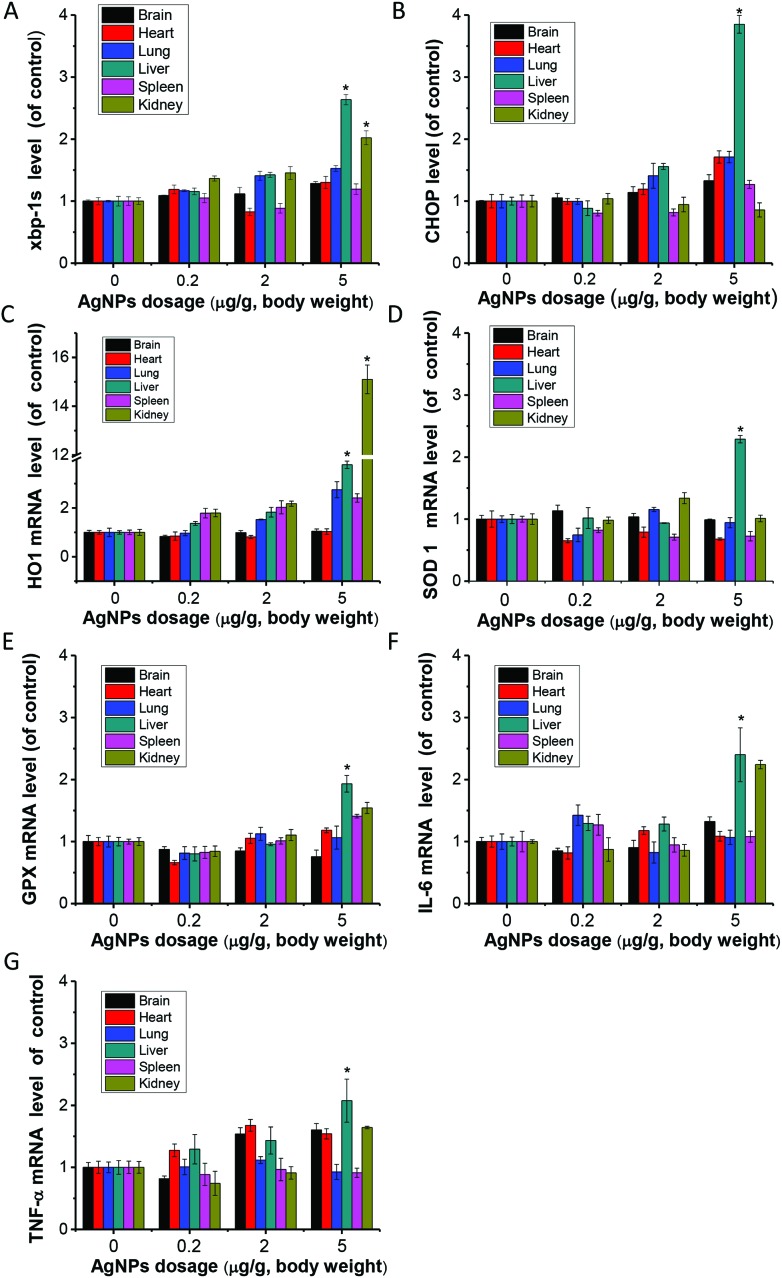
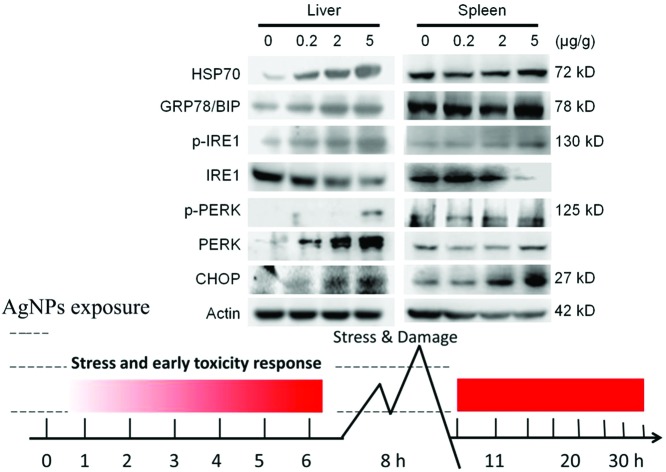
AgNPs were mostly distributed in the liver and spleen. Based on this finding, it was suspected that these organs would be the most sensitive target organs after i.v. exposure. ER stress marker levels were evaluated at the protein levels in the liver and spleen (Fig. 3). HSP70, BIP, p-IRE1, p-PERK and CHOP were significantly up-regulated with the increase of exposure doses of AgNPs. Endoplasmic reticulum stress related genes xbp-1s and chop showed significantly higher expression compared to the control in the liver of the high dose group, but not in the spleen (Fig. 4A and B). With the occurrence of ER stress in the liver, the equilibrium of redox was disturbed as illustrated from the significant increase of oxidative stress related genes of heme oxygenase 1 (HO1), glutathione peroxidase (GPX) and superoxide dismutase 1 (SOD1) (Fig. 4C–E). High expression of cytokine genes like IL-6 and TNF-α indicates that AgNPs induced immune responses in liver tissues (Fig. 4F and G).
Fig. 3. Western blotting results of earlier stress marker proteins in liver and spleen tissues after i.v. injection of AgNPs for 8 h.
Fig. 4. Gene expression levels of mice organ tissues after exposure to one single injection of AgNPs at 0.2 (L, Low), 2 (M, Middle) and 5 (H, High) mg per kg dosages for 8 h. (A) xbp-1s; (B) chop; (C) HO-1; (D) SOD1; (E) GPX; (F) IL-6; (G) TNF-α. Data represent mean ± SD from three independent experiments. *P < 0.05, compared with the control group.
Blood analysis
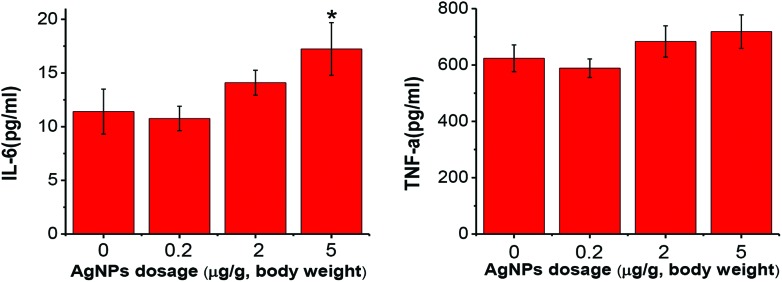
The total white blood cell numbers were unaffected by AgNP exposure for 8 hours. However, the lymphocyte percentage was significantly decreased in the high dosage treatment group (ESI Fig. 1†). Inflammation was evaluated by testing the IL-6 and TNF-α levels in the serum (Fig. 5). A significant increase of IL-6 was observed in the high dose treatment group of AgNP exposure.
Fig. 5. IL-6 (A) and TNF-α (B) production levels in serum after one single dose of AgNPs i.v. exposure. Data were expressed as mean ± SD, n = 6, *P < 0.05, vs. the control group.
Acute toxicity in the high dose exposure group
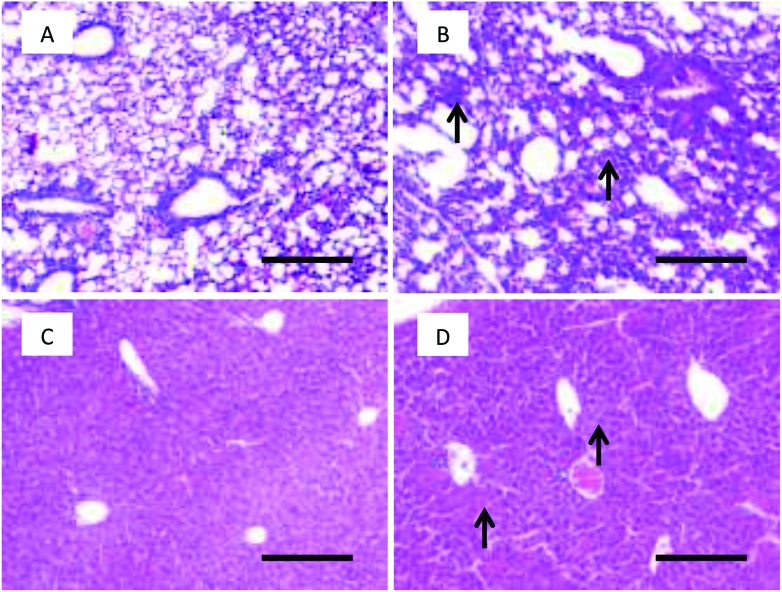
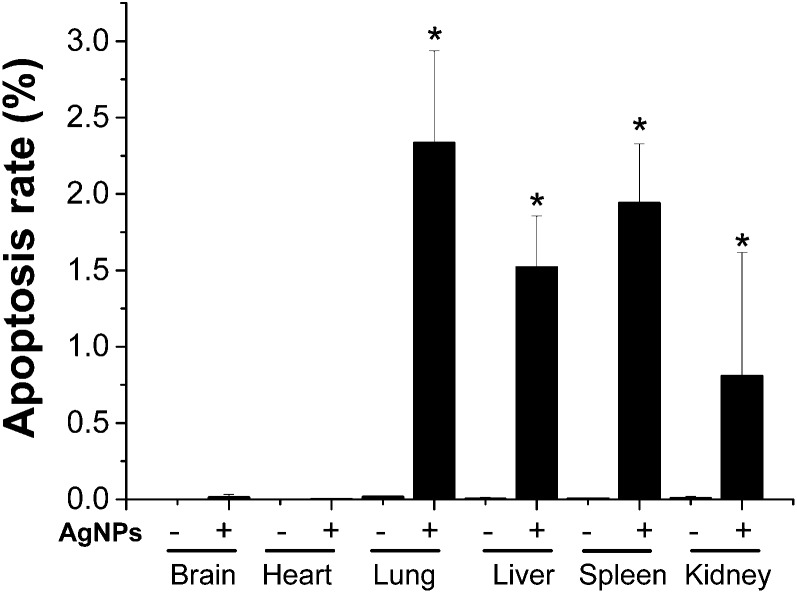
Histopathological observations of mouse tissues from high-dose AgNP exposure were conducted. Liver and lung tissues showed obvious acute toxicity pathology changes post exposure. The lungs demonstrated thickened alveolar walls, multifocal consolidation and infiltration of focal inflammatory cells. The liver showed disorganized hepatic cords, damaged hepatic lobules, edema cytoplasm and ballooning-like tissue changes (Fig. 6). There were no remarkable histopathological changes in the brain, heart, spleen and kidneys (ESI Fig. 2†). Apoptosis was evaluated using the fluorescence-conjugated TUNEL assay. A significantly higher level of apoptotic cells was detected in the lung, liver, spleen, and kidneys of the high dosage AgNP-exposed group compared to the saline-treated control. No significant apoptosis was observed in heart and brain tissues (Fig. 7 and ESI Fig. 3†). It is interesting to note that a high apoptosis rate was mostly found in glomerular tissue parts in the kidney (ESI Fig. 3F†).
Fig. 6. Histopathological images of tissues after intravenous exposure to AgNPs at 5 mg kg–1 for 8 h in mice. (A) Lung of the saline treatment group; (B) lung of the AgNP treatment group; (C) liver of the saline treatment group; (D) liver of the AgNP treatment group. Black arrows show the obvious pathological changes of cell swelling. Scale bar = 200 μm.
Fig. 7. Apoptosis rate of the TUNEL assay after intravenous exposure to AgNPs at 5 mg kg–1 for 8 h in mice. The results are expressed as mean ± SD, *P < 0.05 compared to the control of the same tissue.
Discussion
AgNP is the highest one among the commercialized nanomaterials in biomedical application.18,19 AgNP induces a number of cellular responses in mammalian cells, e.g. immune toxicity, tissue stress, inflammation and apoptosis.1,20–26 Our recent research has shown that AgNP causes different toxic impacts on peripheral organs because of their various toxic sensitivities to this material after intratracheal instillation exposure.13 However, the information on the in vivo toxic mechanisms of AgNP, as an excellent nanomedicine material, is not clearly defined after it enters into the circulation. The in vivo earlier toxicological study is particularly important for the understanding of the development of AgNP toxicity, which also forms the crucial link to the following realistic damage. Nanoparticles in medical products can translocate in the bloodstream and distribute systemically into different organs.
Dosage is important for evaluating the different adverse effects of nanomaterials. A high dosage is known to induce serious acute toxic effects, for example 7.5, 30 or 120 mg kg–1 i.v. exposure have been used to look at acute effects in mice.27 The cytotoxicity and genotoxicity had been found in mouse tissues at the dosages high to 25 mg per kg in a single dose or 25 mg per kg per day for 3 consecutive days of 15–100 nm AgNPs, while the dosage range from 0.5 to 20 mg kg–1 was adopted to disclose the dose–response effect of 5 nm AgNPs.28 Immunotoxicity of silver nanoparticles was evaluated in rats by adopting the 28-day repeated-dose exposure method. It shows that thymus weight decreased with BMDL (benchmark dose, lower 5% confidence limit) around 0.76 mg per kg bw per day, while spleen weight, spleen cell number, and spleen cell subsets increased with BMDLs between 0.36 and 1.11 mg per kg bw per day by this repetitive exposure manner.29 In this study, the adverse effects of intravenously administered AgNPs were investigated in Balb/c mice in the quite low dosage range from 0.2 to 5 mg kg–1. Then the earlier stress conditions and toxic damages were examined at 8 h post exposure for focusing on the toxicity development post exposure.
Consistent with previous reports, the major fractions of the AgNPs were detected in the liver and spleen.8,30 However, it should be noted that there is a quite high concentration of AgNPs maintained in the lung, although the relative level in the lung is much lower than that in the liver and spleen. The organ distribution could reflect the most important potential target organ which is directly exposed to nanoparticles. The deposition of AgNPs in tissue has a direct relationship with the development of organ toxicity.31 Previous studies showed that ER stress is involved in AgNP induced apoptosis in cell models.32,33 This study shows that ER stress was significantly induced in mice organs including the liver and spleen after AgNP i.v. exposure. The levels of stress protein markers HSP70 and BIP were induced in a dose–response dependent manner in the liver, indicating high cellular stress after AgNP exposure. At the same time, it was accompanied by the activation of ER stress sensor proteins like IRE1 and PERK. The CHOP protein, a proapoptotic transcription factor, was significantly induced in a dose-dependent manner in the liver and spleen. Further, the consistent upregulation of the ER stress marker in the mice liver was found in mRNA levels, which indicates that the liver is the dominant target organ for AgNP exposure. Cha et al. reported the significant decrease of liver DNA contents after mice were fed with AgNPs, which suggests the possible induction of apoptosis.34 Using the TUNEL assay, apoptosis was seen in the lung, liver, spleen, kidney and especially the glomerular region. It is assumed that high apoptosis was due to the high accumulation of AgNPs in glomerular regions than other parts of the kidney. Apoptosis was not seen in heart and brain tissues. The histopathological results are in good agreement with the toxic outcomes in the liver and lung. It is proposed that the low damage occurred in the heart and brain is due to the low concentrations of AgNPs in these tissues.
It had been reported that AgNPs induced toxicity in cells or Drosophila melanogaster through generation of ROS.24,35,36 In this study, AgNPs induced high oxidative stress responses demonstrated by upregulations in the mRNA of HO1, GPX and SOD1 in the liver and kidney at high dose treatments. It had been shown that oxidative stress contributed to the progression of inflammation in the liver.34 Inflammation was not quite obvious at the earlier stage after AgNP exposure in this study. IL-6 was slightly increased in the high dose treatment group, while the TNF-α level did not show any change in the serum. In contrast, the AgNPs significantly induced the expression of IL-6 in liver and kidney tissues, while TNF-α was only induced in the liver, of the high dosage group. This suggests that the immune system may require more than 8 hours to implement high immune responses represented by serum cytokines.29
Conclusion
In summary, we investigated the toxicity and ER stress inducing abilities of AgNPs after intravenous injection exposure for 8 h in mice at doses of 0.2, 2, and 5 mg per kg body weight. Our research focused on the organ biodistribution and earlier toxicity forming stage after the exposure. From these results, we concluded that investigating stress markers can be used as a sensitive index of early evaluation of silver nanoparticles in animal experiments. The present results indicate that AgNPs could be quickly distributed in target organs and could pose stress/toxicity over time and dosages, presenting a scenario that should be further explored and addressed. Our research highlights that stress responses caused by in vivo AgNP exposure have the priority to gain more attention in future toxicity studies.
Supplementary Material
Acknowledgments
This work was supported by the Ministry of Science and Technology of China (2012CB934003), the National Natural Science Foundation of China (21477029, 21320102003, 21277037, 21403043 and 21277080), the Chinese Academy of Sciences (XDA09040400), the Beijing Natural Science Foundation (No. 2152037), the Beijing Key Laboratory of Environmental Toxicology (2015HJDL01), the Major Project of the National Social Science Fund (Grant No. 12&ZD117) “Ethical issues of high-tech,” and the National Science Fund for Distinguished Young Scholars (11425520).
Footnotes
†Electronic supplementary information (ESI) available. See DOI: 10.1039/c5tx00464k
References
- Jiang X., Foldbjerg R., Miclaus T., Wang L., Singh R., Hayashi Y. Toxicol. Lett. 2013;222:55–63. doi: 10.1016/j.toxlet.2013.07.011. [DOI] [PubMed] [Google Scholar]
- Wang Z., Qu G., Su L., Wang L., Yang Z., Jiang J. Curr. Pharm. Des. 2013;19(37):6691–6697. doi: 10.2174/1381612811319370012. [DOI] [PubMed] [Google Scholar]
- Zhang Y., Zhang Y., Hong G., He W., Zhou K., Yang K. Biomaterials. 2013;34(14):3639–3646. doi: 10.1016/j.biomaterials.2013.01.089. [DOI] [PubMed] [Google Scholar]
- Lee T. Y., Liu M. S., Huang L. J., Lue S. I., Lin L. C., Kwan A. L. Part. Fibre Toxicol. 2013;10:40. doi: 10.1186/1743-8977-10-40. [DOI] [PMC free article] [PubMed] [Google Scholar]
- Xue Y., Zhang S., Huang Y., Zhang T., Liu X., Hu Y. J. Appl. Toxicol. 2012;32(11):890–899. doi: 10.1002/jat.2742. [DOI] [PubMed] [Google Scholar]
- Chrastina A., Schnitzer J. E. Int. J. Nanomed. 2010;5:653–659. doi: 10.2147/IJN.S11677. [DOI] [PMC free article] [PubMed] [Google Scholar]
- Lankveld D. P., Oomen A. G., Krystek P., Neigh A., Troost-de Jong A., Noorlander C. W. Biomaterials. 2010;31(32):8350–8361. doi: 10.1016/j.biomaterials.2010.07.045. [DOI] [PubMed] [Google Scholar]
- Ali D. Biol. Trace Elem. Res. 2014;162(1–3):333–341. doi: 10.1007/s12011-014-0158-6. [DOI] [PubMed] [Google Scholar]
- Foldbjerg R., Olesen P., Hougaard M., Dang D. A., Hoffmann H. J., Autrup H. Toxicol. Lett. 2009;190(2):156–162. doi: 10.1016/j.toxlet.2009.07.009. [DOI] [PubMed] [Google Scholar]
- Lin J. H., Walter P., Yen T. S. Annu. Rev. Pathol.: Mech. Dis. 2008;3:399–425. doi: 10.1146/annurev.pathmechdis.3.121806.151434. [DOI] [PMC free article] [PubMed] [Google Scholar]
- Chen R., Huo L., Shi X., Bai R., Zhang Z., Zhao Y. ACS Nano. 2014;8(3):2562–2574. doi: 10.1021/nn406184r. [DOI] [PubMed] [Google Scholar]
- Chen R., Ling D., Zhao L., Wang S., Liu Y., Bai R. ACS Nano. 2015;9(12):12425–12435. doi: 10.1021/acsnano.5b05783. [DOI] [PubMed] [Google Scholar]
- Huo L., Chen R., Zhao L., Shi X., Bai R., Long D. Biomaterials. 2015;61:307–315. doi: 10.1016/j.biomaterials.2015.05.029. [DOI] [PubMed] [Google Scholar]
- Lin J. H., Li H., Yasumura D., Cohen H. R., Zhang C., Panning B. Science. 2007;318(5852):944–949. doi: 10.1126/science.1146361. [DOI] [PMC free article] [PubMed] [Google Scholar]
- Yoshida H., Matsui T., Yamamoto A., Okada T., Mori K. Cell. 2001;107(7):881–891. doi: 10.1016/s0092-8674(01)00611-0. [DOI] [PubMed] [Google Scholar]
- Klein C., Stahlmecke B., Romazanov J., Kuhlbusch T., Van Doren E. and De Temmerman P., et al., NM-Series of representative manufactured nanomaterials: NM-300 Silver characterisation, stability, homogeneity, Publications Office, 2011. [Google Scholar]
- Chen R., Zhang L., Ge C., Tseng M. T., Bai R., Qu Y. Chem. Res. Toxicol. 2015;28(3):440–450. doi: 10.1021/tx5004003. [DOI] [PubMed] [Google Scholar]
- Wang L., Zhang T., Li P., Huang W., Tang J., Wang P. ACS Nano. 2015;9(6):6532–6547. doi: 10.1021/acsnano.5b02483. [DOI] [PubMed] [Google Scholar]
- Yang X., Liu X., Lu H., Zhang X., Ma L., Gao R. Chem. Res. Toxicol. 2012;25(2):297–304. doi: 10.1021/tx2004823. [DOI] [PubMed] [Google Scholar]
- Ahamed M., Karns M., Goodson M., Rowe J., Hussain S. M., Schlager J. J. Toxicol. Appl. Pharmacol. 2008;233(3):404–410. doi: 10.1016/j.taap.2008.09.015. [DOI] [PubMed] [Google Scholar]
- Christen V., Capelle M., Fent K. Toxicol. Appl. Pharmacol. 2013;272(2):519–528. doi: 10.1016/j.taap.2013.06.011. [DOI] [PubMed] [Google Scholar]
- El-Sayed Y. S., Shimizu R., Onoda A., Takeda K., Umezawa M. Toxicology. 2015;327(65):53–61. doi: 10.1016/j.tox.2014.11.005. [DOI] [PubMed] [Google Scholar]
- Garcia T. X., Costa G. M., Franca L. R., Hofmann M. C. Reprod. Toxicol. 2014;45:59–70. doi: 10.1016/j.reprotox.2014.01.006. [DOI] [PMC free article] [PubMed] [Google Scholar]
- Simard J. C., Vallieres F., de Liz R., Lavastre V., Girard D. J. Biol. Chem. 2015;290(9):5926–5939. doi: 10.1074/jbc.M114.610899. [DOI] [PMC free article] [PubMed] [Google Scholar]
- Vandebriel R. J., Tonk E. C., de la Fonteyne-Blankestijn L. J., Gremmer E. R., Verharen H. W., van der Ven L. T. Part. Fibre Toxicol. 2014;11:21. doi: 10.1186/1743-8977-11-21. [DOI] [PMC free article] [PubMed] [Google Scholar]
- Foldbjerg R., Jiang X., Miclăuş T., Chen C., Autrup H., Beer C. Toxicol. Res. 2015;4:563–575. [Google Scholar]
- Xue Y., Zhang S., Huang Y., Zhang T., Liu X., Hu Y. J. Appl. Toxicol. 2012;32(11):890–899. doi: 10.1002/jat.2742. [DOI] [PubMed] [Google Scholar]
- Li Y., Bhalli J. A., Ding W., Yan J., Pearce M. G., Sadiq R. Nanotoxicology. 2014;8(Suppl 1):36–45. doi: 10.3109/17435390.2013.855827. [DOI] [PubMed] [Google Scholar]
- Vandebriel R. J., Tonk E. C., de la Fonteyne-Blankestijn L. J., Gremmer E. R., Verharen H. W., van der Ven L. T. Part. Fibre Toxicol. 2014;11:21. doi: 10.1186/1743-8977-11-21. [DOI] [PMC free article] [PubMed] [Google Scholar]
- Arai Y., Miyayama T., Hirano S. Toxicology. 2015;328:84–92. doi: 10.1016/j.tox.2014.12.014. [DOI] [PubMed] [Google Scholar]
- Mitchell L. A., De Iuliis G. N., Aitken R. J. Int. J. Androl. 2011;34(1):2–13. doi: 10.1111/j.1365-2605.2009.01042.x. [DOI] [PubMed] [Google Scholar]
- De Jong W. H., Van Der Ven L. T., Sleijffers A., Park M. V., Jansen E. H., Van Loveren H. Biomaterials. 2013;34(33):8333–8343. doi: 10.1016/j.biomaterials.2013.06.048. [DOI] [PubMed] [Google Scholar]
- Li S. D., Huang L. Mol. Pharm. 2008;5(4):496–504. doi: 10.1021/mp800049w. [DOI] [PubMed] [Google Scholar]
- Cha K., Hong H. W., Choi Y. G., Lee M. J., Park J. H., Chae H. K. Biotechnol. Lett. 2008;30(11):1893–1899. doi: 10.1007/s10529-008-9786-2. [DOI] [PubMed] [Google Scholar]
- Zhang R., Piao M. J., Kim K. C., Kim A. D., Choi J. Y., Choi J. Int. J. Biochem. Cell Biol. 2012;44(1):224–232. doi: 10.1016/j.biocel.2011.10.019. [DOI] [PubMed] [Google Scholar]
- Jiang X., Miclaus T., Wang L., Foldbjerg R., Sutherland D. S., Autrup H. Nanotoxicology. 2015;9(2):181–189. doi: 10.3109/17435390.2014.907457. [DOI] [PubMed] [Google Scholar]
Associated Data
This section collects any data citations, data availability statements, or supplementary materials included in this article.


