 After 270-day consecutive feeding with food containing ZnO nanoparticles, ZnO microparticles and Zn ions, no Zn level increase was found in any organ except digestive tract organs and only ZnO nanoparticles induce minor toxicity.
Abstract
The toxicity and accumulation of zinc oxide nanoparticles (ZnO-NPs), ZnO microparticles (ZnO-MPs) and Zn ions were evaluated after long-term feeding with zinc-replenished food (1600 mg zinc equivalent per kg food) for 270 consecutive days. It was difficult for ZnO-NPs, ZnO-MPs and Zn ions were difficult to pass through the intestine barrier, and most of them were excreted mainly through feces. The distribution results showed that there was no noticeable difference among the distribution profiles of ZnO-NPs, ZnO-MPs and Zn ions in mice. Zn accumulated only in the digestive tract organs after the exposure to all three samples. However, the biomedical parameters and pathological investigations showed liver lesions induced by ZnO-MPs, but fewer by ZnO-NPs or Zn ions. The reason for the remarkably low in vivo toxicity of ZnO-NPs is discussed. Our findings suggest that ZnO-NPs are relatively biocompatible as the nutritional additive at the commonly used dose.
1. Introduction
Zinc oxide (ZnO), one of the most common metal oxides, has been traditionally utilized in diverse industrial fields such as dyes, paints, pigments, metallurgy additives, rubbers, alloys, ceramics, chemical fibers, electronics, catalysts, medical diagnosis, sunscreens, and food additives.1,2 Recently, bulk ZnO particles have been gradually replaced by ZnO nanoparticles (ZnO-NPs). ZnO-NPs possess enhanced chemical reactivity, high transparency, ultraviolet filtering efficiency, and excellent antibacterial properties, which are favourable features for several commercial applications.3,4
As a substitute for bulk ZnO particles, ZnO-NPs show a lot of advantages as food additives. First, ZnO-NPs have a wider range of antibacterial activities towards various microorganisms, which may improve the health status of organisms.5,6 Second, ZnO-NPs may play an important role in the prevention of food allergy. ZnO-NPs were found to be capable of suppressing high affinity IgE receptor (FcεRI)-mediated degranulation and histamine releases in mast cells.7 In addition, nutritional ZnO-NP supplementation is beneficial for the prevention and treatment of human or animal diseases such as diabetes.8 Most notably, Zn is a very important trace element which constitutes hundreds of essential enzymes in the human body for keeping humans healthy, particularly those for their healthy growth. Thus, ZnO-NPs are often engaged as the commonly used Zn nutritional supplement of food.
However, nanomaterials have been reported to induce unexpected risks compared with bulk chemicals because of their unique physicochemical properties.9 The bio-safety of ZnO-NPs is still a controversial question. Generally, nanomaterials are theoretically expected to be more toxic than corresponding bulk ones because of their greater surface reactivity and their capacity to penetrate into and accumulate in cells and organisms.10 ZnO-NPs were considered as a respiratory toxicant which leads to metal fume fever. Animal experiments demonstrate that most organs including the liver, heart, kidneys, pancreas, spleen, and bone were the target of orally exposed ZnO-NPs and ZnO sub-microparticles.11
Given that ZnO-NPs are widely used in fields closely related to the human living environment, the long-term exposure to ZnO-NPs at low dose is inevitable. Also, to be compatible as the long-term Zn nutritional supplement, the study of their long-term exposure is very meaningful and necessary. However, whether the long-term oral exposure to ZnO-NPs would induce adverse effects has not been well addressed. The objective of this study was to mainly focus on the accumulation and toxicity of ZnO-NPs in mice after long-term feeding with food replenished with ZnO-NPs, compared with ZnO microparticles (ZnO-MPs) and Zn ions.
2. Experimental section
2.1. ZnO particles and their characterization
ZnO-NPs and ZnO-MPs were bought from Merck Corp. (Germany) and Sinopharm Chemical Reagent Beijing Co., Ltd (China), respectively. Both ZnO samples were characterized using transmission electron microscopy (TEM), X-ray diffraction (XRD), X-ray fluorescence (XRF) and scanning electron microscopy (SEM). The TEM (FEI Tecnai G2 T20, Japan) investigation was carried out to show the morphology and size of the ZnO-NPs and ZnO-MPs. TEM samples were prepared by dropping the ZnO aqueous suspensions on carbon-coated copper grids. The SEM (Hitachi S-5500, Japan) investigation was carried out to confirm the results of TEM. The SEM samples were prepared by tapping the ZnO particle powder on carbon conductive tape. The purities of ZnO particles were analysed by XRF (S4-Explorer, Bruker AXS, Germany). XRD (D/MAX 2000, Rigaku, Japan) analyses were adopted to reveal the crystallinity and particle size.
The normal mouse pellet food and the mouse pellet food replenished with ZnO-NPs, ZnO-MPs or Zn(CH3COO)2·2H2O (≥99%, Sinopharm Chemical Reagent Co., Ltd, China) were prepared by Beijing Keao Xieli Feed Co., Ltd, Beijing, China. The normal mouse pellet food, which contains 30 mg kg–1 zinc, was prepared according to the National Standards of the People's Republic of China, GB14924.3-2010 (Laboratory Animals-Nutrients for Formula Feeds). The mouse pellet food used in this study includes normal food (denoted as control), food containing 1600 mg kg–1 Zn2+ (denoted as Zn ions), food containing 2000 mg kg–1 ZnO-NPs (denoted as ZnO-NPs), and food containing 2000 mg kg–1 ZnO-MPs (denoted as ZnO-MPs).
The zinc contents in pellet food were determined by inductively coupled plasma-mass spectrometry (ICP-MS, Perkin Elmer Elan DRC-e, USA) after the digestion. The status of ZnO particles in food was checked by the TEM investigation. Briefly, pellet food was ground and mixed with water. Then, the mixtures were filtered with a 0.45 μm filter and the filtrates were centrifuged (12 000 rpm, 20 min). Finally, the sediments were dropped on carbon-coated copper grids for the TEM investigation.
In addition, the bioaccessibilities of Zn in the mouse pellet food, including the control, ZnO-NPs, ZnO-MPs, and Zn ions, were measured with an in vitro gastrointestinal digestive method, the Dutch National Institute for Public Health and the Environment Method (RIVM). The detailed procedure is given in the ESI.†
2.2. Animal administration and sampling
All animal experiments were performed in compliance with the institutional ethics committee's regulations and guidelines on animal welfare (Animal Care and Use Program Guidelines of Peking University). All procedures were approved by the Peking University Institutional Animal Care and Use Committee (IACUC).
Male and female CD-ICR mice (∼25 g) were obtained from Peking University Animal Center, Beijing, China. Food and water were provided ad libitum. After acclimation, male and female mice were randomized into 4 groups as shown in Table 1, respectively.
Table 1. Information on animal groups and dose levels of Zn ions, ZnO-NPs, and ZnO-MPs.
| Group | Chemical | Supplemented content (mg per kg food) | Zinc content (mg per kg food) | No. of animals |
| Control | — | — | 30 | 10 males & 10 females |
| Zn ions | Zn(CH3COO)2·2H2O | 5400 | 1600 | 10 males & 10 females |
| ZnO-NPs | ZnO | 2000 | 1600 | 10 males & 10 females |
| ZnO-MPs | ZnO | 2000 | 1600 | 10 males & 10 females |
Mice were fed with normal food (control) or food replenished with Zn ions, ZnO-NPs, or ZnO-MPs for 270 days. The body weight and behaviours were recorded every other week during 270 days. Dead mice were taken away from the cage, while injured mice were kept separately as soon as they were discovered.
After 270 days consecutive dietary supplementation, mice were sacrificed and blood samples were collected from the eyes for toxicological assays. Blood serum samples were separated from blood by standing at room temperature for 30 min and centrifuging at 3000g for 10 min. The heart, liver, spleen, stomach, kidneys, lungs, brain, large intestine and small intestine were collected and weighed for the organ indices (organ weight/body weight) calculation. A piece of each organ was cut off and fixed in a 4% formaldehyde solution for histological analysis. A cubic millimetre piece of stomach or small intestine jejunum was cut off and fixed in 3% glutaraldehyde. The rest were stored at –80 °C.
2.3. Determination of biochemical parameters in serum
Following the standard procedures, serum biochemical assays were performed using a Hitachi 7170A clinical automatic chemistry analyser (Hitachi Ltd, Tokyo, Japan). Lactate total bilirubin (TBIL), alanine aminotransferase (ALT), aspartate aminotransferase (AST), alkaline phosphates (ALP), uric acid (UA), urea (UREA), creatinine (CRE) and lactate dehydrogenase (LDH) were measured using commercial kits (Bühlmann Laboratories, Switzerland).
2.4. Histological observations
For histological observations, formaldehyde-fixed tissue samples were embedded in paraffin, thin-sectioned and mounted on glass microscope slides for haematoxylin–eosin (H&E) staining and subjected to examination by light microscopy (Leica DMI4000, Germany).
2.5. Oxidative stress assay
For the assay of reduced glutathione (GSH) and malondialdehyde (MDA) in tissues, each organ sample was minced and then homogenized in 4 °C water three times (10 s each, with a 20 s interval) to yield a 10% (w/v) homogenate. The homogenate was centrifuged at 2000 rpm for 10 min and the supernatant was collected. The protein concentration of the supernatant was determined using the Bradford method with bovine serum albumin as the standard. The GSH level of the supernatant was examined by using a reduced glutathione (GSH) assay kit (Nanjing Jiancheng Biotechnology Institute, China) following the manufacturer's instructions.12 Results of GSH are expressed as μmol GSH per g protein. The MDA level was determined using the kit based on the method of thiobarbituric acid reactive species (Nanjing Jiancheng Biotechnology Institute, China)12 and the results are expressed as nmol MDA per g protein using 1,1,3,3-tetraethoxypropane (TEP) as the standard.
2.6. Distribution of zinc in mice
The zinc contents in tissues/organs were quantified using ICP-MS. Briefly, the tissues/organs (less than 0.5 g) were digested in a microwave digestion system (CME MARS, USA) with 7 mL digest solution (6 mL 75% nitric acid plus 1 mL 30% hydrogen peroxide). After digestion, the residues were adjusted to 2% nitric acid solutions and analysed using ICP-MS. We used calibration standards of 1.0, 10.0 and 100.0 ng L–1 standard Zn solutions (NCS Testing Technology Co., Ltd, China) for the method validation. Three replicates per sample were used to obtain the standard deviation (SD) value. All samples were analysed in duplicate to ensure the reproducibility.
2.7. Excretion of Zn from mice
The Zn excretion was estimated by testing the Zn content in urine and feces. Five animals from the female groups were randomly assigned to a metabolic cage after exposure for 270 consecutive days. Urine and feces excreted over the following 24 h were collected. All samples were digested and analysed for zinc as described above.
2.8. Electron microscopy investigation
The stomach and small intestine jejunum samples preserved in 3% glutaraldehyde were fixed with OsO4. After dehydration and resin embedding, the samples were sectioned into 70 nm thick sections, and stained with uranyl acetate and lead citrate. The sectioned tissues were examined with a TEM (JEM-200CX, JEOL, Tokyo, Japan).
2.9. Statistical analysis
All data were presented as the mean for at least three individual observations along with the standard deviation (SD). Significance was calculated using a Student's t-test. Differences were considered to be significant if p < 0.05.
3. Results
3.1. Characterization of ZnO-NPs and ZnO-MPs
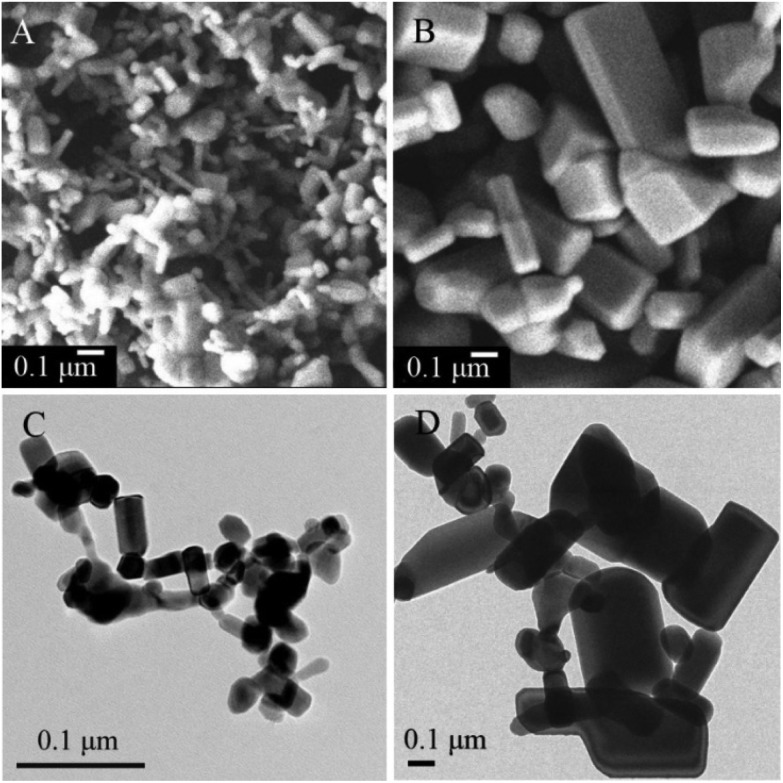
Both ZnO-NPs and ZnO-MPs are mostly of rod shape as shown in the SEM and TEM images (Fig. 1). For ZnO-NPs, the average diameter is 30 ± 20 nm and the average length is 100 ± 40 nm. For ZnO-MPs, the average diameter is 0.15 ± 0.1 μm and the average length is 0.8 ± 0.5 μm. The XRF analysis suggests that the ZnO contents of both ZnO-NP and ZnO-MP samples are higher than 99.9 wt%. The XRD spectra (Fig. S1 in the ESI†) demonstrate that both ZnO samples are zincite crystalline phase, and no extra peak is observed, confirming the high purity of ZnO particles.
Fig. 1. The morphology and size of ZnO-NPs and ZnO-MPs. (A) SEM image of ZnO-NPs; (B) SEM image of ZnO-MPs; (C) TEM image of ZnO-NPs; (D) TEM image of ZnO-MPs.
All mouse food samples were digested to measure the Zn content. The measured Zn content is consistent with the supplemented Zn content in each food sample. After a difficult separating process, the supplemented ZnO particles from mouse food samples could be observed under TEM (Fig. S2 in the ESI†).
In addition, we measured the bioaccessibility of Zn in animal food using the RIVM method (Tables S1 & S2 in the ESI†). The bioaccessibility, more reliable than dissolution, of an agent is usually used to predict its bioavailability (absorption in vivo) of metal ions. In the gastric fluids, soluble Zn of mouse food (0.1 g) containing ZnO-NPs, ZnO-MPs, and Zn ions are 104.0 ± 1.1 μg, 110.5 ± 2.0 μg, and 119.9 ± 5.3 μg, respectively, corresponding to the bioaccessibility of 65.0%, 69.1% and 74.9%. Under the same conditions, the intestinal soluble Zn of mouse food (0.1 g) containing ZnO-NPs, ZnO-MPs, and Zn ions are 15.1 ± 1.8 μg, 15.3 ± 1.2 μg, and 15.9 ± 2.0 μg, respectively. The corresponding bioaccessibilities are 9.4%, 9.5% and 9.9%, respectively. Clearly, the bioaccessibilities of all three samples are much higher in the gastric fluid than in the intestinal fluid. Among the three samples, zinc ions possess the highest bioaccessibility, followed by ZnO-MPs and ZnO-NPs. The differences among the three samples are tiny in the intestinal fluid.
3.2. Clinical symptoms and organ indices
Detailed information about animal groups and doses is given in Table 1.
In female groups, no abnormal clinical signs were observed during the whole experimental period, though one mouse in the Zn ion group died at the 18th week (day 126). All mice were in good condition at the time of sacrifice. Male mice, however, became aggressive during the experimental period, especially in the Zn ion group. Symptoms such as redness and swelling on the back and belly were observed.
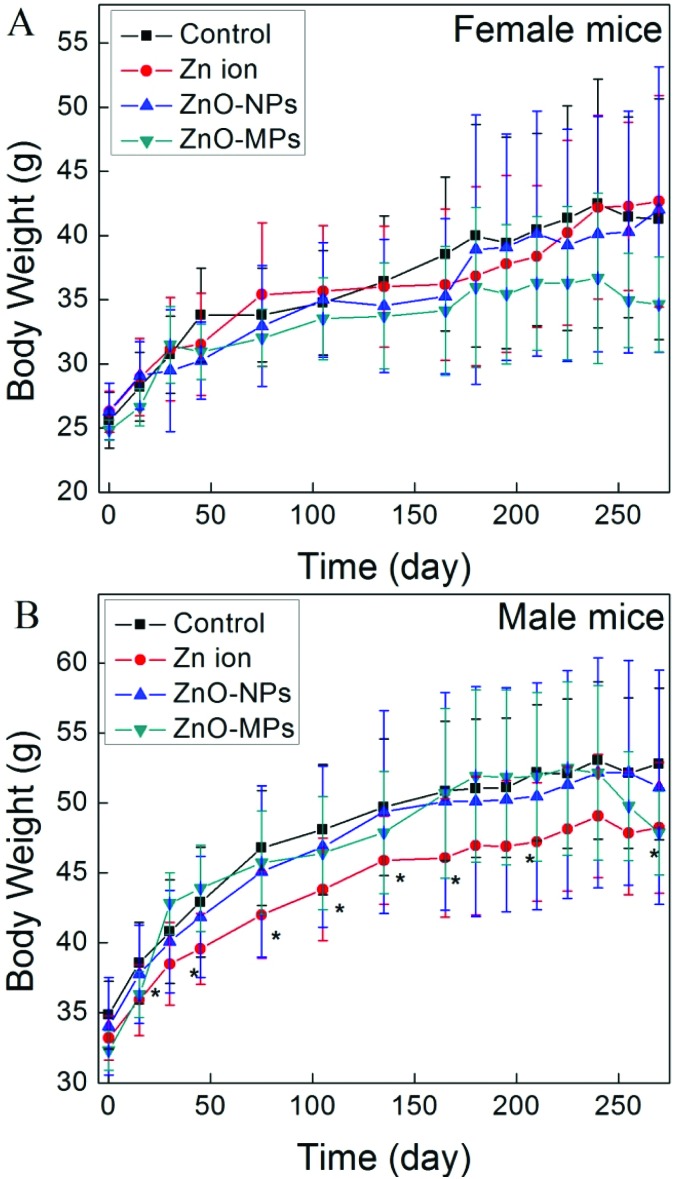
The effect of the ZnO particles and Zn ions on the body weight was monitored during the whole experimental period. As shown in Fig. 2A, the body weights of all Zn ion and ZnO particle treated female mice did not show any statistically significant difference from those of the female control mice at any time point, though the ZnO-MP treated female mice had shown the lowest body weight since day 100. Nevertheless, the body weight of the Zn ion male group was observed to continuously and significantly decrease from day 15 to day 270 (Fig. 2B). Besides, the body weights of the ZnO-MP treated male and female mice dropped from day 240.
Fig. 2. The body weight increase of mice during 270 days exposure: (A) female mice; (B) male mice (*p < 0.05, compared with the control).
The organ index, i.e. the organ-to-body weight ratio, is widely used in toxicological evaluations for providing a general impression of toxicity. A decrease of organ index suggests atrophy or damage of the organ, but an increase of organ index may suggest edema or inflammation of the organ. The data are summarized in Table 2. Decreased organ indices of the spleen, stomach, large intestine and small intestine were observed in the Zn ion female group but not in the Zn ion male group. Increased organ indices of the liver and large intestine were observed in the ZnO-MP female group, but not in the ZnO-MP male group. The organ index of kidneys ascended in the Zn ion male group, and that of the large intestine decreased in the ZnO-NP female group.
Table 2. The organ index of mice after 270 days consecutive exposure.
| Organ | Organ index (mg g–1) |
|||
| Control | Zn ions | ZnO-NPs | ZnO-MPs | |
| Female mice | ||||
| Heart | 3.85 ± 0.80 | 3.76 ± 0.65 | 4.01 ± 0.75 | 4.56 ± 0.27 |
| Liver | 38.92 ± 3.34 | 35.86 ± 5.61 | 39.08 ± 7.55 | 49.86 ± 4.46* |
| Spleen | 3.25 ± 0.88 | 2.34 ± 0.53* | 3.52 ± 1.40 | 3.55 ± 0.60 |
| Stomach | 9.23 ± 1.16 | 7.35 ± 1.17* | 8.66 ± 1.28 | 10.93 ± 1.73 |
| Kidneys | 10.88 ± 1.67 | 10.32 ± 1.65 | 11.20 ± 2.40 | 13.10 ± 1.15 |
| Lungs | 6.39 ± 1.22 | 5.70 ± 1.13 | 5.62 ± 1.04 | 7.06 ± 0.46 |
| Brain | 13.5 ± 3.8 | 11.62 ± 2.59 | 11.94 ± 2.62 | 14.32 ± 1.72 |
| Large intestine | 11.66 ± 2.59 | 8.76 ± 2.03* | 11.01 ± 1.77 | 16.37 ± 2.55* |
| Small intestine | 30.86 ± 8.84 | 21.56 ± 5.81* | 28.15 ± 6.30 | 38.97 ± 10.19 |
| Male mice | ||||
| Heart | 4.68 ± 0.40 | 5.65 ± 0.98* | 5.27 ± 0.62* | 4.87 ± 0.66 |
| Liver | 46.36 ± 5.32 | 49.40 ± 4.75 | 47.32 ± 4.43 | 51.44 ± 5.86 |
| Spleen | 3.03 ± 1.23 | 4.03 ± 1.41 | 3.14 ± 1.00 | 2.52 ± 0.78 |
| Stomach | 7.94 ± 1.17 | 8.17 ± 1.17 | 8.05 ± 1.52 | 10.09 ± 5.31 |
| Kidneys | 14.74 ± 1.45 | 17.11 ± 2.47* | 15.62 ± 2.60 | 15.94 ± 0.68 |
| Lungs | 5.55 ± 1.54 | 6.81 ± 2.27 | 5.55 ± 0.64 | 5.81 ± 0.43 |
| Brain | 9.05 ± 0.91 | 10.24 ± 0.75 | 9.70 ± 1.93 | 10.84 ± 0.92 |
| Large intestine | 11.37 ± 0.65 | 10.42 ± 1.88 | 10.25 ± 1.31* | 10.65 ± 2.68 |
| Small intestine | 31.32 ± 4.04 | 31.50 ± 9.42 | 27.70 ± 4.43 | 29.74 ± 4.03 |
3.3. Serum biochemical parameters
The serum biochemical parameters were measured and the results are summarized in Table 3. After 270 days consecutive feeding with food containing Zn ions, ZnO-NPs or ZnO-MPs, the levels of the biochemical parameters, including TBIL, AST, UA, ALT, and LDH, were similar among all the groups. However, the activity of ALP increased in the ZnO-NP and ZnO-MP female groups, as well as the ZnO-MP male group. Besides, an increase of CRE was also observed in the ZnO-NP female group, but not in the male group.
Table 3. Serum biochemical parameters of mice after 270 consecutive day exposure.
| Parameter | Group |
|||
| Control | Zn ions | ZnO-NPs | ZnO-MPs | |
| Female mice | ||||
| ALT (U l–1) | 25 ± 12 | 17 ± 5 | 19 ± 5 | 11 ± 4 |
| AST (U l–1) | 80 ± 16 | 79 ± 20 | 88 ± 26 | 60± 15 |
| ALP (U l–1) | 41 ± 13 | 47 ± 8 | 74 ± 14* | 82 ± 18* |
| TBIL (μmol L–1) | 6.1 ± 0.5 | 6.4 ± 0.4 | 6.1 ± 0.3 | 6.6 ± 1.4 |
| CRE (μmol L–1) | 27 ± 2 | 26 ± 2 | 31 ± 3* | 24 ± 2 |
| UA (μmol L–1) | 134 ± 47 | 99 ± 18 | 110 ± 23 | 145 ± 30 |
| LDH (U l–1) | 564 ± 162 | 467 ± 153 | 439 ± 31 | 512 ± 91 |
| Male mice | ||||
| ALT (U l–1) | 14 ± 3 | 9 ± 4 | 19 ± 7 | 12 ± 3 |
| AST (U l–1) | 58 ± 16 | 51 ± 8 | 70 ± 10 | 63 ± 12 |
| ALP (U l–1) | 25 ± 10 | 29 ± 4 | 19 ± 5 | 48 ± 5* |
| TBIL (μmol L–1) | 6.0 ± 0.4 | 6.9 ± 1.6 | 6.6 ± 0.8 | 6.7 ± 0.4 |
| CRE (μmol L–1) | 24 ± 2 | 21 ± 5 | 21 ± 3 | 23 ± 4 |
| UA (μmol L–1) | 135 ± 42 | 183 ± 32 | 137 ± 25 | 147 ± 24 |
| LDH (U l–1) | 515 ± 135 | 590 ± 167 | 604 ± 254 | 456 ± 80 |
3.4. Histopathological observations
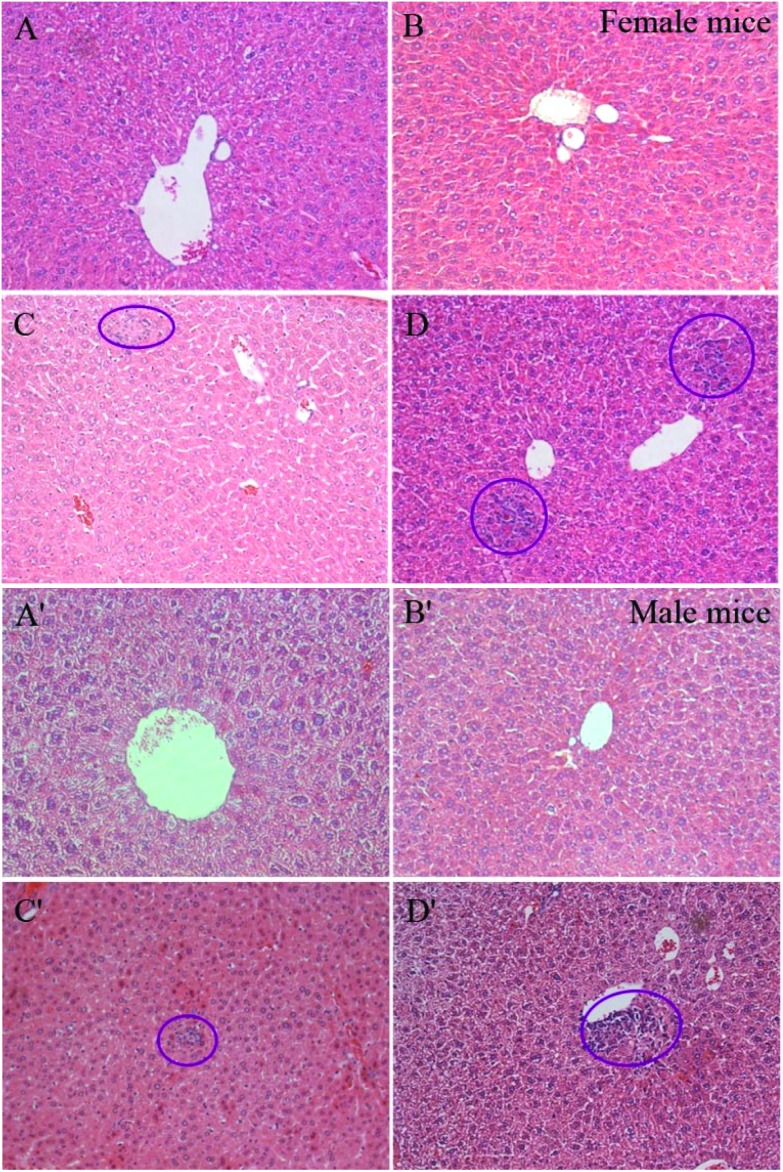
The histological photographs of the livers in mice after 270 days consecutive exposure are shown in Fig. 3. No obvious hepatic damage was found in the Zn ion group. But there were some focal-like inflammatory cells (circled in Fig. 3) that accumulated in the liver parenchyma and around the central veins in both male and female mice exposed to the ZnO-NPs and ZnO-MPs. Generally, the ZnO-MPs induced more serious damage to the liver than the ZnO-NPs. The damage caused by ZnO particles to the females was severer than that to the males, which is in accordance with the data of the organ index. Except for the liver, no obvious histopathological damage was found in other organs, including the heart, spleen, stomach, kidneys, lungs, brain, large intestine, small intestine, and pancreas (data not shown). In addition, no ZnO particle was found in all these samples.
Fig. 3. Representative histological photos of livers after 270 days consecutive zinc dietary supplementation (200× magnification). (A) Female control group; (B) Zn ion female group; (C) ZnO-NP female group; (D) ZnO-MP female group; (A′) male control group; (B′) Zn ion male group; (C′) ZnO-NP male group; (D′) ZnO-MP male group.
3.5. Oxidative stress
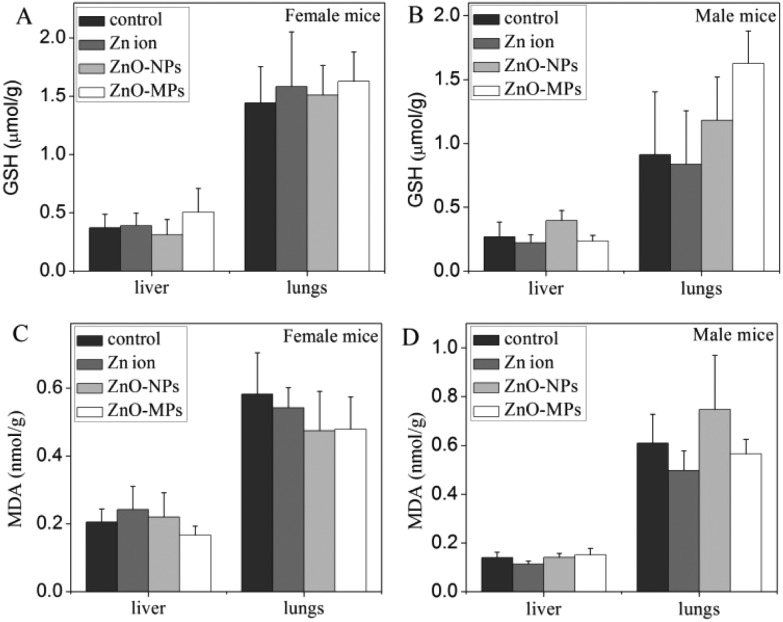
The oxidative stress caused by ZnO particles or the Zn ions to the liver and lungs was measured to reveal the possible toxicological mechanism. However, as shown in Fig. 4, the reduced GSH levels and MDA levels in the liver and lungs remain unchanged in all groups. This suggests that there was no oxidative stress to these organs in mice after 270 days consecutive exposure.
Fig. 4. The oxidative stress caused by ZnO particles or Zn ions in the liver and lungs of mice after 270 days consecutive exposure. (A) The reduced GSH level in female mice; (B) the reduced GSH level in male mice; (C) the MDA level in female mice; (D) the MDA level in male mice.
3.6. Distribution of zinc in mice
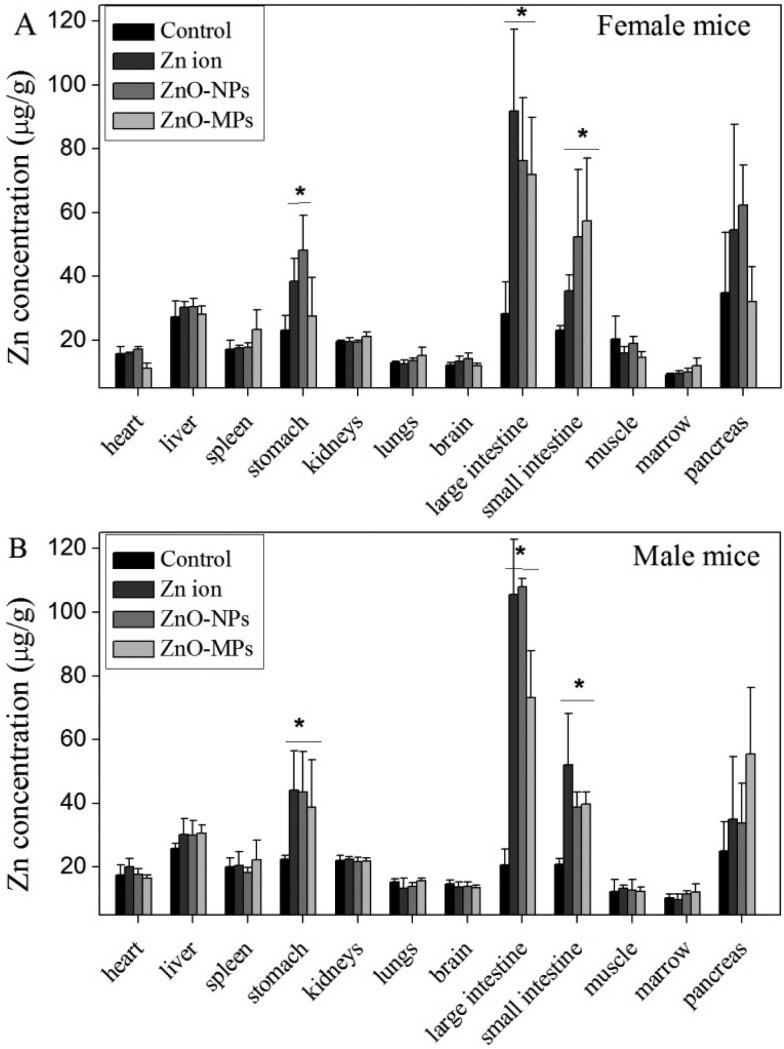
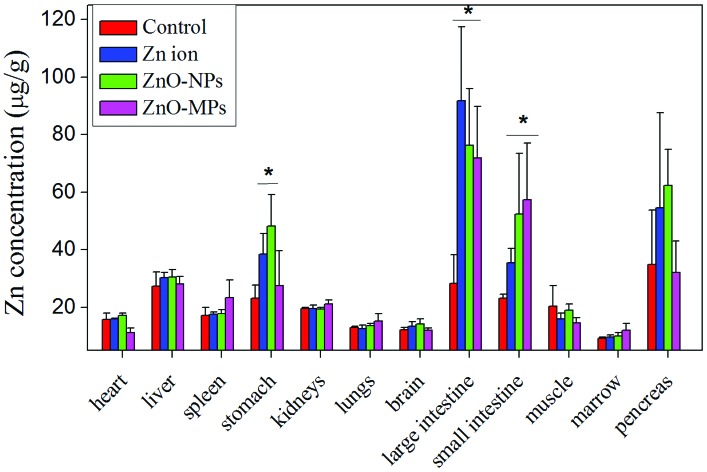
Zinc contents in tissues in the control, the Zn ion, ZnO-NP, and ZnO-MP groups are presented in Fig. 5. No Zn level increase was observed in the heart, liver, spleen, kidneys, lungs, brain, muscle, marrow, and pancreas in all treated mice. But in the digestive tract organs, including stomach, small intestine and large intestine, the zinc contents of the Zn ion, ZnO-NP, and ZnO-MP groups increased, comparing to the control. However, the zinc contents in these organs were not significantly different between the three treated groups. In addition, no remarkable distribution difference was observed between the male and female mice.
Fig. 5. Zinc content of tissues in the control, Zn ion, ZnO-NP, and ZnO-MP mice after 270 days consecutive exposure (n = 5). *p < 0.05, compared to the control. (A) Female mice; (B) male mice.
3.7. Excretion of Zn from mice
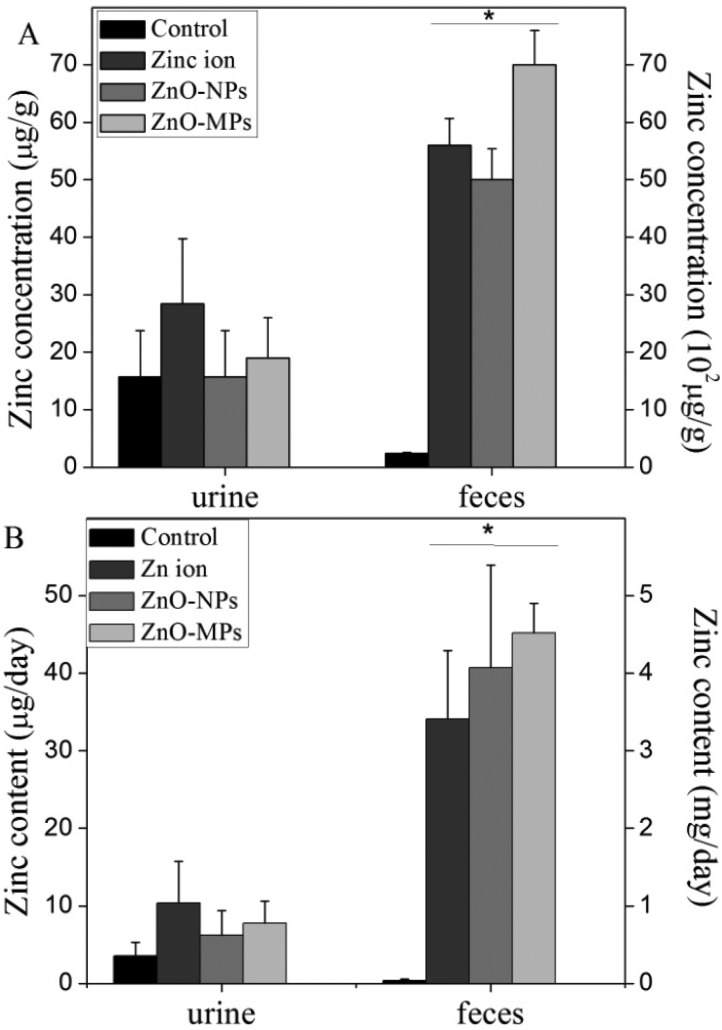
Considering there is the elaborate regulating mechanism to regulate the uptake and excretion of Zn in vivo, zinc reached a balance in the mouse organs and excreta by 270 days continuous feeding. Therefore, we just collected excreta of mice one day after the long-term exposure. The Zn concentrations in urine from the Zn ion and ZnO groups show no significant difference compared with the control group (Fig. 6A). In contrast, the Zn concentrations in feces from the Zn ion and ZnO particle groups are significantly higher than that from the control group. The Zn concentration in the feces (around 5000 mg kg–1) is about 2 times higher than that in food (1600 mg kg–1), while the Zn content in urine is only around 15 mg kg–1. Besides, the Zn concentration in feces from the ZnO-MP group is significantly higher than those of the Zn ion and ZnO-NP groups. Taking into account the collected excreta weight, we calculated the total excreted Zn from mice per day (Fig. 6B). The results are in accordance with the Zn concentration in the excreta, indicating that the supplemented Zn is excreted mainly through feces. But there is no significant difference among the Zn ion, ZnO-NP, and ZnO-MP groups.
Fig. 6. Zinc concentration and content in urine and feces collected from female mice for 24 h after they have been exposed to Zn ions, ZnO-NPs, and ZnO-MPs for 270 consecutive days (n = 5). (A) The concentration of Zn in feces and urine; (B) the excreted Zn from feces and urine per day. The left Y-axis labels are for urine, and the right ones are for feces. *p < 0.05, compared to the control.
3.8. Ultra-thin pathological tests
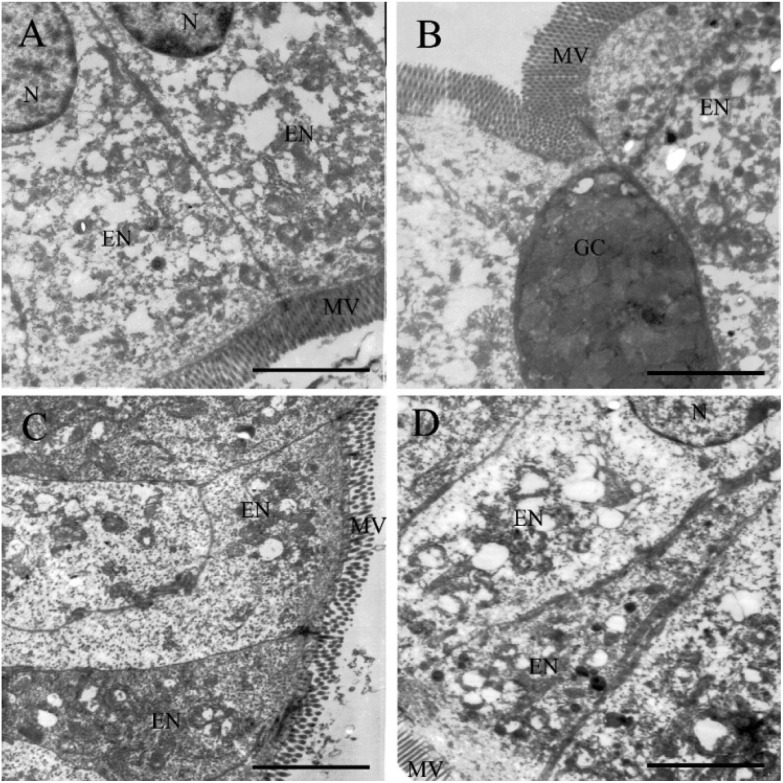
As the zinc distribution results showed that zinc accumulated in the digestive tract organs, ultra-thin pathological tests were used to observe the probable damage and uptake of ZnO particles by the digestive tract membrane cells. By carefully observing under TEM, the ultra-thin pathological result was in accordance with the histopathological test that no ZnO particle was found in cells. As shown in Fig. 7, neither obvious particle uptake and vesicle increase nor pathological damage was found after the ZnO-NP and ZnO-MP exposure. Similar results were found for the stomach ultra-thin slices (Fig. S3 in the ESI†).
Fig. 7. Representative ultra-thin pathological photos of the small intestine of female mice after 270 days consecutive zinc dietary supplementation. (A) Control group; (B) Zn ion group; (C) ZnO-NP group; (D) ZnO-MP group. The scale bar is 2.5 μm. N: nucleus; EN: enterocyte; GC: goblet cell; MV: microvilli.
4. Discussion
In the present study, the chronic toxicity and distribution of ZnO-NPs in mice were investigated after a long-term exposure for 270 consecutive days, compared with ZnO-MPs and Zn ions. The results reveal that both ZnO-NPs and ZnO-MPs are very safe after the long-term oral exposure, though the ZnO-MPs induce slightly severer liver toxicity than ZnO-NPs. The oral route was selected as the exposure pathway because ZnO-NPs have been used as a diet additive and in food packaging, hence they may enter into the body along with food. Currently, there is no guideline for the in vivo toxicity assessment of ZnO-NPs; thus the Zn doses were selected according to the RfD (reference dose) reported by the EPA (Environmental Protection Agency, USA)13 in a summary review on human health associated with Zn and ZnO. The RfD of humans is 8–18.6 mg per kg b.w. per day for zinc (b.w. is short for body weight).14 To convert a human equivalent dose to a mouse dose, the human dose should be multiplied by a coefficient of 12.3.15 So the value for mice is 98.4–228.8 mg per kg b.w. per day for zinc, and a 25 g mouse needs 2.46–5.72 mg zinc per day. As each mouse eats 2.8–7 g food per day, mouse food containing 351–2043 mg Zn per kg would satisfy the zinc intake of mice. We therefore chose the ZnO concentration of 2000 mg per kg food (1600 mg Zn per kg food) for the chronic toxicity study in mice.
Most studies reporting the oral toxicity of ZnO-NPs were performed by the gavage method.16–20 Some of them studied the acute toxicity by gavage at a single high dose,16,17 and a few of them studied the subchronic toxicity by dosing a single or every day for 90 days.18,19 To obtain the real and accurate information on the biosafety assessment of ZnO-NPs, the study of the long-term feeding exposure to ZnO-NPs is indispensable. In addition, to make the study more comprehensive, ZnO-MPs and Zn ions were additionally adopted for comparison. Zinc salts such as zinc sulfate and zinc acetate have metallic, bitter and astringent tastes, while ZnO does not. This might lead to different consumption volumes by mice, especially in the Zn ion group. Probably, this is the reason for the continuously and significantly lower body weight in the Zn ion male group (Fig. 2B).
The liver is usually the most important target organ for nanomaterials. Without exception, the liver was toxicologically sensitive to ZnO particles in this study. Although there is no significant accumulation in liver, liver injury, including increased organ index, serum ALP level elevation, and inflammatory cells infiltration were observed in mice fed with a diet replenished with ZnO-NPs or ZnO-MPs for 270 days. Many studies have reported that ZnO administration can lead to liver damage and liver dysfunction.5,21–23 Sharma et al.21 have observed liver injury after sub-acute oral exposure of ZnO-NPs (300 mg kg–1) for 14 consecutive days. This was evidenced by the elevated serum ALT and ALP levels and pathological lesions in liver. Seok et al. observed that the serum ALP levels increased in rats orally given 536.8 mg kg–1 ZnO-NPs for 13 weeks,22 and Hong et al. observed an increase of ALP levels in mice given 100 mg kg–1 ZnO-NPs by daily gavage administration for 14 days.5 Esmaeillou et al. reported that ZnO-NPs (333.3 mg kg–1 for 5 days) caused hepatic injury, suggested by the increased ALT and AST activity as well as hepatocyte necrosis and other pathological observations by oral gavage in rats.23 In this study, the serum biochemical parameters ALT and AST that sensitively indicate the liver damage were not significantly changed, suggesting that the hepatocytes were not damaged. But the hepatic flow tract might be blocked, which would hinder the ALP metabolism and increase the ALP level in serum. The serum biochemical results are in accordance with histopathological observations that the focal-like inflammatory cells accumulate around the central veins of liver after ZnO exposure. Compared with the results in the literature, the liver damage in our study is much lower and milder. This might be caused by the different detailed procedures of gavage administration and diet replenishment.
One of the widely accepted toxicity mechanisms of ZnO particles is from the dissolved Zn ions.24,25 The rate of dissolution of a particle is usually considered to be proportional to its surface area, which will lead to a faster dissolution for small-size particles when compared with large-size particles or bulk materials, for the same mass. However, according with Lilvia Lopes et al.'s results,26 we found that ZnO-MPs showed a higher dissolution (110.5 μg per 0.1 g) than ZnO-NPs (104.0 μg per 0.1 g) at 2 h in the gastric fluid (Table S2 in the ESI†), though a very similar dissolution was observed between ZnO-NPs and ZnO-MPs in the intestinal fluid. So, the faster dissolution rate of ZnO-MPs than ZnO-NPs may be one reason for the slightly higher toxicity of ZnO-MPs. Both ZnO-NPs and ZnO-MPs in pure powder form can quickly dissolve in buffer solution.24 But as additives mixed in food, Zn should take a longer time to mix with gastric fluid, accompanied by the digestive movement. Another possible reason for the toxicity difference is the long-term exposure, during which mice might adapt to ZnO exposure. This allows Zn to be poorly absorbed or rather thoroughly excreted, averting toxicity to the animal. This is also supported by the unaffected copper distribution in mice after the 270 days consecutive exposure to ZnO particles (Fig. S4 in the ESI†), considering that the consumption of excessive zinc can influence the copper metabolism and cause copper deficiency. Anyway, the authentic reason for the difference should be further investigated.
Although Zn was not enriched in the liver, the inflammatory response was observed in the liver. The inflammatory response does not have to be co-localized with NPs.27 But the inflammatory response in this study is not as severe as that reported for mice after 2 weeks or 3 months gavage of ZnO particles.21–23
In Table 4, the liver toxicity of Zn ions, ZnO-NPs and ZnO-MPs is summarized. It is an interesting finding that ZnO-NPs are more biocompatible than ZnO-MPs, and the liver toxicity of Zn ions is the lowest. This reverses the general conclusion that NPs are more toxic than the counterpart bulk ones both in vitro and in vivo,9 though we are not the first one to claim the ‘unusual’ results on ZnO-NPs’ toxicity. Pasupuleti et al. studied the dose effect of ZnO-NPs on their gavage toxicity and found that the dispersion of particles is a crucial factor for their toxicity.28 The incidences of lesions in liver and other organs were higher at lower doses of ZnO-NPs compared to higher doses of ZnO-MPs, due to the lower agglomeration. In our case, the ZnO-NPs showed fewer lesions in liver than ZnO-MPs. The first possible reason is that the ZnO particles can promote gastrointestinal movement and strengthen digestion.29 This is supported by the excretion result that the concentration of zinc in the feces of the ZnO-MP group is significantly higher than those of the ZnO-NP and Zn ion groups, even though the total Zn contents in feces are the same (Fig. 6). It is suggested that ZnO-MPs may promote gastrointestinal motility, and improve the absorption of the nutrients in food such as carbohydrate, protein, fat and others, though the absorption of zinc was not improved. The concentration of zinc gradually improved following the digestion and absorption of food. As a result, the exposure concentration of zinc to the tract cells is higher for the ZnO-MP group than that for the ZnO-NPs or Zn ion groups. Secondly, ZnO particles can react with the chemicals in food during digestion.10,30 The size of particles may affect the reaction efficiency, and then affect their protection or toxicity effects. Thirdly, as a kind of amphoteric metal oxide, ZnO-NPs and ZnO-MPs can be dissolved in the gastric acid and coagulated in the intestinal juice. The larger particle may keep a higher zinc concentration around the particle during the course of dissolution. But more effort should be paid to addressing this issue in the future.
Table 4. Liver toxicity consequence of the zinc replenished diet.
| Animal groups | Organ index |
Lymphocyte infiltration |
Serum biochemical parameters |
|||
| Female | Male | Female | Male | Female | Male | |
| Control | ||||||
| Zn ions | ||||||
| ZnO-NPs | + | + | + | + | ||
| ZnO-MPs | + | ++ | ++ | ++ | + | |
It is easy to conclude that the tissue distribution and toxicity effects of NPs in animals after oral administration are quite different from those after intravenous injection or inhalation. However, the gavage route and diet replenishment, both of which can be recognized as the oral administration routes, may induce different distribution and toxicity effects. ZnO-NPs at a concentration below 300 mg kg–1 administered to rats by gavage were distributed in organs such as the liver, lungs, and kidneys within 72 h.16 Park et al. reported that the Zn concentration dose-dependently increased in the liver, kidneys and intestine compared with the control group after 90 days gavage exposure to 20 nm ZnO-NPs in rats.18 But we only observed an increase of Zn contents in the digestive tract including the intestine and stomach in mice. The diets replenished with ZnO particles have less chance of directly coming into contact with the inner wall of the digestive tract than the ZnO particles administered by gavage, but the food can stimulate the secretion of digestive juices such as saliva, gastric juice, bile and others, which might increase the dissolution of particles. The in vitro bioaccessibility measurements of three animal food samples support the above conjecture. The ZnO-NPs, ZnO-MPs and Zn ions in animal food show very similar bioaccessibilities. Actually, there is a complex and elaborate regulation system in animals to adjust zinc to suitable levels in different organs to maintain their functions. The mice may adapt to the daily supplement of zinc and adjust the regulation system to keep the zinc balance.
Most of the Zn ions, ZnO-NPs, and ZnO-MPs were excreted through the feces. A small constant excretion of zinc via urine was also observed, but the amounts of excreted Zn of different ZnO particles were not significantly different compared with the control. This also implies that the majority of the Zn particles are unable to be absorbed and retained in body. It has been reported that most orally-administered ZnO-NPs were excreted directly into feces, showing extremely low zinc levels in urine,13,15,31 which was in good agreement with our results.
5. Conclusion
In summary, the present study shows that dietary ZnO-NPs and ZnO-MPs for 270 consecutive days do not induce a significant accumulation of zinc in the main tissues/organs of mice, except for the digestive tract. Generally, ZnO-NPs behave similarly to ZnO-MPs and Zn ions. Most of the ZnO particles and Zn ions are scarcely absorbed through the intestine to blood, considering that zinc is largely excreted through feces, but not through urine. ZnO particles are pretty biocompatible, though some liver injury was observed. ZnO-MPs show a little more toxicity than ZnO-NPs or Zn ions. These results show that long-term exposure to ZnO-NPs in the human body is relatively biocompatible, particularly at a low dose. This implies the satisfactory biocompatibility of Zn NPs when they are applied as a nutritional additive in food or are taken up from various consuming products or the surrounding environment.
Conflict of interest
There are no conflicts of interest to declare.
Supplementary Material
Acknowledgments
The authors thank Prof. Guang Jia from Peking University for her technical advice on the serum biochemical and histology analyses, Mr Yang Gao from Peking University and Mr Xin-Xin Chen from Shanghai University for their contribution to animal experiments. The authors also thank the National Basic Research Program of China (no. 2016YFA0201600), the China Natural Science Foundation (no. 21301015), and the Fundamental Research Funds for the Central Universities (XK1536) for financial support.
Footnotes
†Electronic supplementary information (ESI) available: Bioaccessibility of Zn in animal food by the RIVM method, XRD patterns of ZnO particles, TEM images of ZnO particles separated from the animal food samples, ultra-thin pathological photos of the stomach of female mice, and copper distribution in mice. See DOI: 10.1039/c6tx00370b
References
- Kolodziejczak-Radzimska A., Jesionowski T. Materials. 2014;7:2833. doi: 10.3390/ma7042833. [DOI] [PMC free article] [PubMed] [Google Scholar]
- Moezzi A., McDonagn A. M., Cortie M. B. Chem. Eng. J. 2012;185:1. [Google Scholar]
- Osmond M. J., Mccall M. J. Nanotoxicology. 2010;4:15. doi: 10.3109/17435390903502028. [DOI] [PubMed] [Google Scholar]
- Shi L.-E., Li Z.-H., Zheng W., Zhao Y.-F., Jin Y.-F., Tang Z.-X. Food Addit. Contam., Part A. 2014;31:173. doi: 10.1080/19440049.2013.865147. [DOI] [PubMed] [Google Scholar]
- Hong T.-K., Tripathy N., Son H.-J., Ha K.-T., Jeong H.-S., Hahn Y.-B. J. Mater. Chem. B. 2013;1:2985. doi: 10.1039/c3tb20251h. [DOI] [PubMed] [Google Scholar]
- Patra P., Mitra S., Debnath N., Goswami A. Langmuir. 2012;28:16966. doi: 10.1021/la304120k. [DOI] [PubMed] [Google Scholar]
- Yamaki K., Yoshino S. BioMetals. 2009;22:1031. doi: 10.1007/s10534-009-9254-z. [DOI] [PubMed] [Google Scholar]
- Umrani R. D., Paknikar K. M. Nanomedicine. 2013;9:89. doi: 10.2217/nnm.12.205. [DOI] [PubMed] [Google Scholar]
- Wang H., Du L.-J., Song Z.-M., Chen X.-X. Nanomedicine. 2013;8:2007. doi: 10.2217/nnm.13.176. [DOI] [PubMed] [Google Scholar]
- Yousef J. M., Mohamed A. M. Pak. J. Pharm. Sci. 2015;28:175. [PubMed] [Google Scholar]
- Faddah L. M., Adbel Baky N. A., Mohamed A. M., Al-Rasheed N. M., Al-Rasheed N. M. J. Nanopart. Res. 2013;15:1520. [Google Scholar]
- Yang S.-T., Wang X., Jia G., Gu Y., Wang T., Nie H., Ge C., Wang H., Liu Y. Toxicol. Lett. 2008;181:182. doi: 10.1016/j.toxlet.2008.07.020. [DOI] [PubMed] [Google Scholar]
- EPA (Environmental Protection Agency), Summary review of health effects associated with zinc and zinc oxide: Health issue assessment, Washington, DC, USA, 1987. [Google Scholar]
- FDA (US Food and Drug Administration), Guidance for industry and reviewers: Estimating the safe starting dose in clinical trials for therapeutics in adult health volunteers, 2002. [Google Scholar]
- FDA (US Department of Health and Human Services Food and Drug Administration), CDER (Center for Drug Evaluation and Research), Guidance for industry: Estimation the maximum safe starting dose in initial clinical trials for therapeutics in adult healthy, 2005. [Google Scholar]
- Baek M., Chung H.-E., Yu J., Lee J.-A., Kim T.-H., Oh J.-M., Lee W.-J., Paek S.-M., Lee J. K., Jeong J., Choy J.-H., Choi S.-J. Int. J. Nanomed. 2012;7:3018. doi: 10.2147/IJN.S32593. [DOI] [PMC free article] [PubMed] [Google Scholar]
- Paek H.-J., Lee Y.-J., Chung H.-E., Yoo N.-H., Lee J.-A., Kim M.-K., Lee J. K., Jeong J., Choi S.-J. Nanoscale. 2013;5:11416. doi: 10.1039/c3nr02140h. [DOI] [PubMed] [Google Scholar]
- Park H.-S., Shin S.-S., Meang E. H., Hong J.-s., Park J.-I., Kim S.-H., Koh S.-B., Lee S.-Y., Jang D.-H., Lee J.-Y., Sun Y.-S., Kang J. S., Kim Y.-R., Kim M.-K., Jeong J., Lee J.-K., Son W.-C., Park J.-H. Int. J. Nanomed. 2014;9(suppl. 2):79. doi: 10.2147/IJN.S57926. [DOI] [PMC free article] [PubMed] [Google Scholar]
- Kim Y. R., Park J. I., Lee E. J., Park S. H., Seong N. W., Kim J. H., Kim G. Y., Meang E. H., Hong J. S., Kim S. H., Koh S. B., Kim M. S., Kim C. S., Kim S. K., Son S. W., Seo Y. R., Kang B. H., Han B. S., An S. S. A., Yun H. I., Kim M. K. Int. J. Nanomed. 2014;9:102. [Google Scholar]
- Ko J.-W., Hong E.-T., Lee I.-C., Park S.-H., Park J.-I., Seong N.-W., Hong J.-S., Yun H.-I., Kim J.-C. Lab. Anim. Res. 2015;31:139. doi: 10.5625/lar.2015.31.3.139. [DOI] [PMC free article] [PubMed] [Google Scholar]
- Sharma V., Singh P., Pandey A. K., Dhawan A. Mutat. Res., Genet. Toxicol. Environ. Mutagen. 2012;745:84. [Google Scholar]
- Seok S. H., Cho W.-S., Park J. S., Na Y., Jang A., Kim H., Cho Y., Kim T., You J.-R., Ko S., Kang B.-C., Lee J. K., Jeong J., Che J.-H. J. Appl. Toxicol. 2013;33:1089. doi: 10.1002/jat.2862. [DOI] [PubMed] [Google Scholar]
- Esmaeillou M., Moharamnejad M., Hsankhani R., Tehrani A. A., Maadi H. Environ. Toxicol. Pharmacol. 2013;35:67. doi: 10.1016/j.etap.2012.11.003. [DOI] [PubMed] [Google Scholar]
- Yang S.-T., Liu J.-H., Wang J., Yuan Y., Cao A., Wang H., Liu Y., Zhao Y. J. Nanosci. Nanotechnol. 2010;10:8638. doi: 10.1166/jnn.2010.2491. [DOI] [PubMed] [Google Scholar]
- Wang Y.-W., Tang H., Wu D., Liu D., Liu Y., Cao A., Wang H. Environ. Sci.: Nano. 2016;3:788. [Google Scholar]
- Lopes S., Ribeiro F., Wojnarowicz J., Lojkowski W., Jurkschat K., Crossley A., Soares A. M., Loureiro S. Environ. Toxicol. Chem. 2014;33:190. doi: 10.1002/etc.2413. [DOI] [PubMed] [Google Scholar]
- Liu J.-H., Wang T., Wang H., Gu Y., Xu Y., Tang H., Jia G., Liu Y. Toxicol. Res. 2015;4:83. [Google Scholar]
- Pasupuleti S., Alapati S., Ganapathy S., Anumolu G., Pully N. R., Prakhya B. M. Toxicol. Ind. Health. 2012;218:675. doi: 10.1177/0748233711420473. [DOI] [PubMed] [Google Scholar]
- O'Shea C. J., McAlpine P., Sweeney T., Varley P. F., O'Doherty J. V. Br. J. Nutr. 2014;111:798. doi: 10.1017/S0007114513003280. [DOI] [PubMed] [Google Scholar]
- Yan X., Rong R., Zhu S., Guo M., Gao S., Wang S., Xu X. J. Agric. Food Chem. 2015;63:8292. doi: 10.1021/acs.jafc.5b01979. [DOI] [PubMed] [Google Scholar]
- Lee C.-M., Jeong H.-J., Yun K.-N., Kim D. W., Sohn M.-H., Lee J. K., Jeong J., Lim S. T. Int. J. Nanomed. 2012;7:3203. doi: 10.2147/IJN.S32828. [DOI] [PMC free article] [PubMed] [Google Scholar]
Associated Data
This section collects any data citations, data availability statements, or supplementary materials included in this article.


