

Abstract
Single-cell RNA sequencing (scRNA-seq) is currently transforming our understanding of biology, as it is a powerful tool to resolve cellular heterogeneity and molecular networks. Over 50 protocols have been developed in recent years and also data processing and analyzes tools are evolving fast. Here, we review the basic principles underlying the different experimental protocols and how to benchmark them. We also review and compare the essential methods to process scRNA-seq data from mapping, filtering, normalization and batch corrections to basic differential expression analysis. We hope that this helps to choose appropriate experimental and computational methods for the research question at hand.
Keywords: transcriptomics, single-cell RNA-seq, power analysis, normalization, differential expression analysis
Introduction
Single-cell RNA sequencing (scRNA-seq) allows to measure gene expression levels of single cells and is a transformative technology that is rapidly deepening our understanding of biology [1, 2]. It has been used to estimate stochasticity of transcription within cells [3, 4], between groups of cells [5, 6] and to discover new types and states of cells [7] in various tissues, such as blood [8–10], spleen [11], brain [12–17], intestine [18] or pancreas [19, 20]. Furthermore, scRNA-seq provides a powerful tool to analyze developmental patterns by sampling cells during a differentiation process and reconstruct one or more ‘pseudotime’ trajectories, i.e. order expression profiles along putative differentiation states [21–23]. It also allows to measure covariation of gene expression within cells and hence exploits naturally occurring variation [5] as well as engineered perturbations [24–26] to reconstruct molecular mechanisms and networks. Obviously, the same approaches can also be applied to disease states, and scRNA-seq has especially been used to analyze the evolutionary patterns and resulting heterogeneity generated in cancer [27–30]. These exciting possibilities also led to an international initiative, the Human Cell Atlas, that sets out to provide a comprehensive reference framework for human cells [31, 32] and has the potential to transform cell biology to a similar extent, as the Human Genome Project has transformed genetics in the past decade.
So, while scRNA-seq is becoming an important tool for biology and medicine, it is still a rapidly evolving technology, and many experimental and computational challenges have not been resolved yet. In this review, we will focus on the quantification of gene expression levels, discussing experimental issues of cell isolation, library generation and benchmarking of protocols and computational aspects of barcode assignment, quality control, mapping, normalization and gene level quantification. We will not discuss issues related to allele-specific expression [3], alternative splicing [33] and multi-omic measurements [34, 35] nor cover aspects related to more downstream analyses such as clustering, cell-type identification or pseudotime analyses (for detailed reviews, see [36–39]).
Generating scRNA-seq libraries
Single-cell isolation
The first step for all scRNA-seq methods is the isolation of single cells or single nuclei from a population of cells, i.e. from a whole organism, an organ, a tissue or a marker-defined subpopulation (Figure 1). Often the spatial location of cells within a given tissue is critical for understanding their function and identity. Thus, some protocols use laser capture microdissection [40, 41], patch-clamp pipettes [42, 43] or photoactivatable Tags [44, 45] to isolate cells. While this allows to connect the spatial and cellular context of cells with their transcriptomes, these more specialized methods lack throughput or require genetic manipulation. Other spatial approaches like single-molecule fluorescent in situ hybridization (FISH) and in situ sequencing (see [17] for a recent review) can analyze many cells but are not yet amenable to genome-wide expression quantification. Hence, most scRNA-seq protocols currently start with a suspension of cells. Providing such a suspension is relatively straightforward for cell lines or blood samples but can be the major hurdle for other samples. An idealized isolation protocol starts with an unbiased dissociation of cells, requires few cells as input, is compatible with fixed/frozen cells or tissue, allows imaging of cells and is flexible/cost-efficient in combining different samples. Furthermore, it should have high throughput, generate few ‘doublets’ (units of two or more cells), efficiently lyse cells and inhibit RNAses before reverse transcription starts. Finally, the entire procedure should minimally influence the expression profile of cells. Depending on the cells, the research question and the performance of the downstream library protocol associated with a cell isolation, the choice of a protocol will depend on different factors of which we discuss a few in the following:
Figure 1.

Single-cell isolation. Almost all scRNA-seq methods require to dissociate cells to make a single-cell suspension. To what extend this suspension represents the cellular composition and the expression patterns of the original population is a major challenge for many tissues. In addition, using frozen samples as starting material is often not possible and can be overcome by making a suspension of nuclei instead of cells (not shown). A major difference among scRNA-seq methods is whether single wells are distributed in a controlled fashion among wells, e.g. by FACS, or randomly distributed across containers e.g using microdroplets.
First, every isolation procedure will impact gene expression to some extent as has been shown, e.g., for the impact of enzymatic treatment and fluorescence-activated cell sorting (FACS) sorting [46, 47]. While these factors need to be controlled by the experimental design, they can in some cases be prohibitively large. For example, the isolation of neurons leads to a similar expression pattern of ‘immediate early genes’ as their neuronal activation in vivo, making it difficult to study the expression patterns of this process [48]. A recent study has shown that such a response occurs in many cells and tissues and is a major issue for interpreting cellular subpopulations [47]. Additionally, the dissociation procedure can lead to substantial biases in the isolated cell types, especially for such complex, entangled tissues as the adult brain [12]. We are not aware that this has been used so far, but a possibility to quantify such biases would be to generate also an undissociated bulk RNA-seq profile and use decomposition methods [49] to estimate the frequency of the contained cell types. Another promising solution is to isolate nuclei instead of cells and sequence their RNA content [48, 50–54]. Although such single-nucleus RNA-seq approaches result—as expected—in less complementary DNA (cDNA) and an enrichment of unprocessed RNAs, they carry qualitatively similar information as scRNA-seq data [51, 52, 54]. While more systematic comparisons are needed to quantify the loss of information when sequencing nuclei, the advantage of a less biased isolation that is possible also from frozen or slightly fixed brain samples could be decisive. In general, the compatibility of an isolation protocol and the following scRNA-seq library generation with cryopreservation [55] and/or fixation procedures [56–58] will have a large impact on the practicability and on the experimental design of studies. An exciting new approach is to fix cells and use them as the reaction chamber for in situ reverse transcription and barcoding, also because such ‘split-pool’ protocols could scale well to large cell numbers [59, 60].
Assaying large numbers is also the most remarkable technical scRNA-seq development in recent years (see also [61]): While the first scRNA-seq study used manual dissection of six cells [62], the current record is a data set of 1.3 million brain cells using the droplet-based 10x Genomics platform. This increase in throughput has been achieved by automatization, smaller reaction volumes [63] and by early barcoding, i.e. the labeling of cDNA by a cell-specific DNA sequence that allows multiplexing at an early stage [64, 65]. In this context of cell isolation and throughput, it can be useful to distinguish among well-based methods and droplet-based methods (Figure 1). For well-based methods, single cells are deposited manually, by FACS or within microfluidic chips into single wells that contain oligos with different barcodes. In the latter, a cell suspension is randomly distributed across small reaction chambers such as nanodroplets [66–68], nanowells [69, 70] or microarrays [71] that contain oligos with different barcodes. The ratio of reaction chambers to cells determines the average numbers of cells per barcode and hence the expected number of chambers with two or more cells (‘doublets’). The empirical ‘technical doublet’ rate of a method is often determined by mixing cells of two different species [54, 59, 60, 66–69]. While a helpful quality control, it might not reflect ‘biological doublet’ rates of investigated cells that are, e.g., more prone to stick together. An alternative is to use polymorphisms within a species to distinguish cells from different individuals to determine doublet rates and also to improve the experimental design of high-throughput methods by multiplexing different samples [72].
If the starting material of cells is limited, the capture efficiency and the minimal required cell number are crucial further considerations. While Drop-seq, inDrops and 10x Genomics capture 2–4, 75 and 50% of the input cells, respectively, they require >200 000, 2000–10 000 and >1000 cells as input, respectively [68, 73]. So while these droplet-based methods are clearly advantageous if many cells per sample need to be analyzed, well-based methods have advantages in other circumstances. This includes research questions where only few cells are available [62, 74], laser-microdissected material is processed [40, 41] or cells are patched before isolation [42, 43]. Furthermore, if cells from many samples are required, well-based methods provide more control and flexibility on the number of cells that end up being sequenced. Well-based methods are also more flexible in terms of lysis buffers, full-length cDNA sequencing, addition of spike-ins [External RNA Controls Consortium (ERCC)] and combining scRNA-seq with DNA or chromatin analyses from the same cells [34, 35]. Finally, well-based methods are compatible with bulk RNA-seq providing a helpful comparison with single-cell data, as it allows, e.g., to monitor the bias of the cell isolation procedure, as mentioned above. So more flexible, lower-throughput, well-based methods and efficient, high-throughput, droplet-based methods will likely coexist to accommodate different needs. Moreover, new methods continue to be developed at impressive speeds (Supplementary Table S1) [75]. For example, a recent preprint describes a setup that deposits cells or nuclei by FACS or limiting dilution in thousands of micro-wells and also allows imaging of cells [70], representing a good compromise of flexibility and throughput. It will also be exciting to see how the abovementioned methods that use fixed cells and nuclei as reaction chambers [59, 60] compare with other scRNA-seq methods in practice.
Generating cDNA
After cell isolation and lysis, cDNA is generated by reverse transcription of mRNA and subsequent second-strand synthesis. This cDNA gets amplified by polymerase chain recation (PCR) or in vitro transcription and is then converted into sequencing libraries (Figure 2). So far, >50 protocols and protocol variants, as well as 6 commercial systems have been published (Supplementary Table S1). Many of them have special features like imaging, keeping spatial information, investigating DNA or chromatin in parallel or isolating nuclei instead of cells. These features can of course be of decisive importance for some research questions, but in this review, we will focus on the scRNA-seq part only. For all protocols, the crucial step is efficiently converting RNA into cDNA, which depends on a combination of enzyme properties, buffer conditions, volume and RNA degradation rates. Systematic optimizations have improved the sensitivity for several protocols [75–78]. The most sensitive ones reach conversion efficiencies of almost 50% [75] and can probably still be improved given the complex interaction of many factors [75]. Increasing effective concentrations by low reaction volumes [77, 79, 80] with a lower limit of 1 nl [73] is generally helpful, although efficient cDNA generation can also be achieved in microliter volumes [76, 78, 80, 81], especially in combination with macromolecular crowding that has resulted in one of the most sensitive protocols so far [75]. Most methods use oligo-dT priming, but random priming [82], MALBAC primers [83] and RNA ligation for small RNAs [84] have also been described. To generate the second strand, many methods tail the 3′ end of the first-strand cDNA to anneal a primer. In the frequently used template switching method, the tailing is performed by a reverse transcriptase from the Moloney murine leukemia virus (MMLV), as these have an intrinsic terminal transferase activity, which causes the addition of a few nucleotides, mostly cytosines, at the 3′ end of cDNA [85]. Tailing with a terminal transferase has been used for the first scRNA-seq protocol [62] and increasing its efficiency led recently to the sensitive Quartz-seq2 protocol [78] and multiple annealing and dC-tailing based Quantitative single-cell RNA-seq (MATQ-seq) protocol [83]. After cDNA generation, its amplification is done by almost all protocols either by PCR or by in vitro transcription (Figure 2) leading to substantial noise and bias in the amplified cDNA population [81, 86]. While the linear amplification by in vitro transcription is probably less biased, it comes at the cost of another reverse transcription step. For PCR amplification, the noise increases with each cycle, and hence, more sensitive methods needing less cycles show less noise [81, 86]. Additionally, there are differences in amplification bias among polymerase enzymes [75]. Finally, the amplified cDNA is converted into a sequenceable library, in many cases using the convenient Nextera transposase kit to yield Illumina compatible libraries (Figure 3). To achieve high throughput as discussed above, it is crucial to integrate cell-specific barcodes in the primers that are used for first-strand or second-strand synthesis. Furthermore, incorporating random nucleotides—so-called unique molecular identifiers (UMIs) [87]—in these primers allows to computationally identify unique molecules and remove the bias and noise created in the amplification of cDNA. Obviously, this requires that the barcode and UMI have to be read together with the cDNA. As all protocols—except MATQ-seq [83]—integrate barcode and UMI in the 5′ or the 3′ primer and hence generate 5′ or 3′ tag-counting scRNA-seq libraries, this sacrifices full-length cDNA sequencing (Figure 3).
Figure 2.
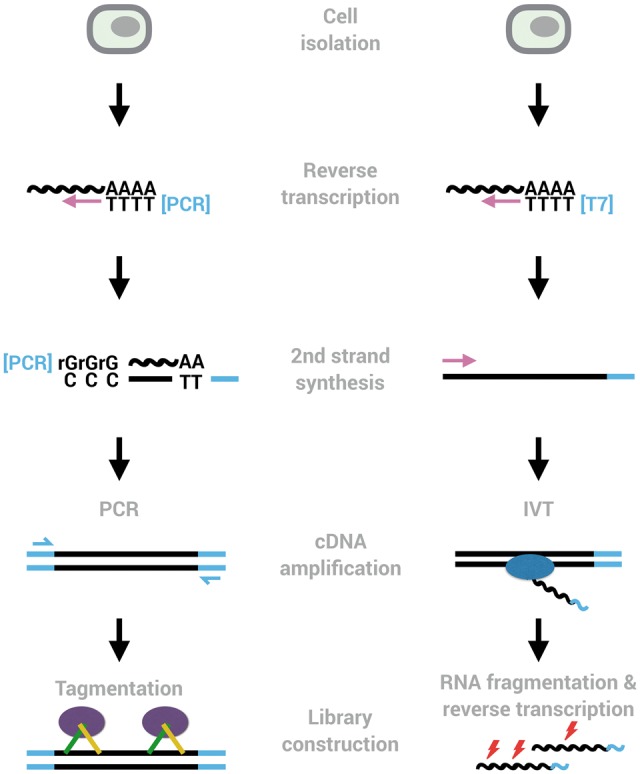
Two common workflows of generating scRNA-seq libraries. Many methods use oligo-dT priming, template switching, pre-amplification by PCR and tagmentation to generate libraries (left). The major other amplification method amplifies cDNA linearly using in vitro transcription (right). Early barcodes and UMIs can be introduced into the primers used for reverse transcription or for second-strand synthesis, allowing to pool reactions from many cells and to identify amplified molecules, respectively.
Figure 3.
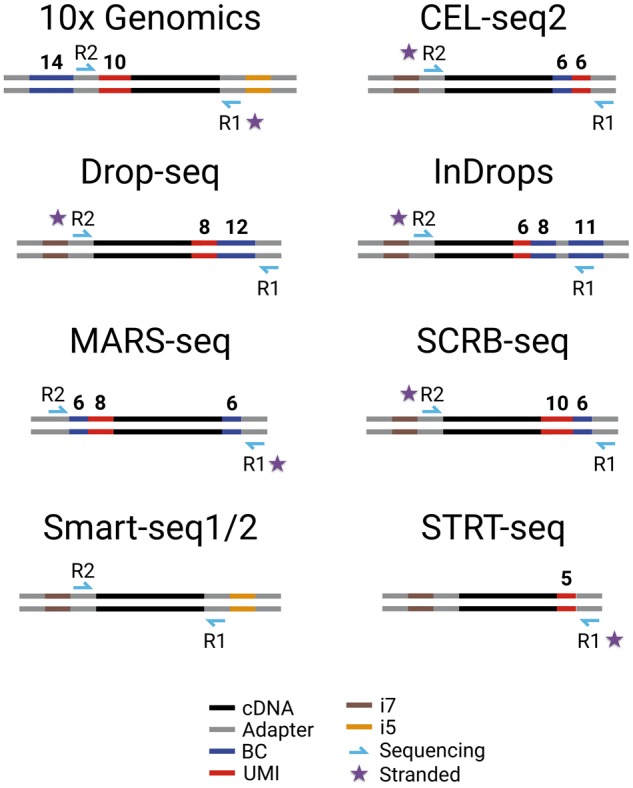
Overview of commonly used scRNA-seq libraries. Shown are the length and position of barcodes that distinguish cells [Barcode (BC)], UMIs, sequencing primers, Illumina indices (i5, i7) and adapter sequences needed for PCR, tagmentation and sequencing. Note that except for Smart-seq1/2, all methods contain BCs and UMIs and preserve the strand information (star). As a consequence, only Smart-seq1/2 among the shown libraries provides full-length information.
Comparing scRNA-seq protocol performance
In addition to the issues related to the isolation of single cells discussed above and the additional features of many protocols (Supplementary Table S1), several aspects determine the technical performance of an scRNA-seq protocol. Ideally, a protocol should (1) be sensitive to detect mRNA transcripts, (2) cover the transcripts full length, (3) reflect expression levels accurately, (4) measure expression levels precisely, (5) be high-throughput compatible, (6) flexible to accommodate balanced experimental designs and (7) be cost-efficient (Figure 4).
Figure 4.

Comparing scRNA-seq protocol performance. Several aspects determine the technical performance of a scRNA-seq protocol: (1) sensitivity of protocols to detect mRNA transcripts can be defined by the number of genes/transcripts (UMIs) per cell detected above stochastic noise. (2) Coverage of transcripts: with Smart-seq1/2, ideally the full length of the transcript is covered. Conversely, early barcoding and UMI-methods enrich for the 3′ and 5′ prime end of the sequences. (3) Accuracy of estimated expression levels reflect the correlation of known transcript concentrations and measured transcript expression. Notably, this correlation also depends on the sensitivity and precision of a method. (4) Precision of estimated expression levels reflects the measurement error of expression in single cells and depends on sensitivity and amplification noise. The latter is essentially abolished by UMIs. (5) The throughput of a method depends on the cell isolation method and on the costs per cell, which are strongly reduced by the depicted early barcoding (6) Batch effects of library generation can be a decisive factor for interpreting results, and methods that allow a balanced experimental design have a decisive advantage in this respect.
As we have argued before, cost-efficiency probably matters most, as the majority of applications compare relative gene expression levels among cells to identify cell types, and regulatory networks and costs are limiting the number of samples and experiments that can be done [81]. Cost-efficiency can be defined as the money needed to generate and sequence scRNA-seq libraries from enough cells to reach a given level of power to detect differentially expressed genes. This power is dependent on a combination of sensitivity and precision across all genes at a particular sequencing depth and—as no gold standard data across all genes is available—needs to be estimated by simulations [81, 88]. In addition to the costs per cell, sequencing costs and hence the relationship of sequencing depth and power is a crucial component of cost-efficiency [75, 81]. Sensitivity depends largely on the efficiency of the reverse transcription and second-strand synthesis reactions. Precision depends additionally on the amount of noise and bias with which this cDNA gets amplified and improves decisively by using UMIs [81]. While the effect of amplification on precision is eliminated by UMIs, its effect on cost-efficiency can still be substantial as more bias, and noise requires more sequencing to obtain the same power [75, 78, 81].
To quantitatively compare cost-efficiencies across protocols, a shared reference is needed that allows to estimate sensitivity and precision (i.e. the mean–dispersion relationship across genes) from the same biological sample. Ideally, this would be standardized cells that are centrally distributed, similar to reference RNAs that have been used to benchmark bulk transcription methods [89]. Unfortunately, such a cellular reference does not exist, but reliable freezing and thawing protocols might make that possible in the future [55]. New methods often compare themselves to existing ones using the same cell lines, but it is not clear how strongly cells differ, e.g., in their RNA-content, across cell lines, laboratories, conditions and passage number [75]. In a recent comparative study, we have used the same batch of cells to compare the cost-efficiency of six prominent scRNA-seq protocols [81]. Using realistic simulations [88], we found that UMIs are crucial to increase the power of scRNA-seq methods, and that droplet-based methods like Drop-seq with a low cost per cell and a low sensitivity can be as cost-efficient as well-based methods with a higher cost per cell and a higher sensitivity. However, given the explosion of scRNA-seq protocols (Supplementary Table S1), this approach is difficult to scale.
An alternative is to use ERCCs as a shared reference, a set of 92 standardized mRNAs with known concentrations [90] that have been used in many scRNA-seq experiments. While ERCCs can be used to efficiently compare RNA-seq protocols across many published data sets [80], they have limitations. First, it is unclear how well ERCCs mimic nascent mRNAs, as they are shorter, have shorter poly-A tails, do not represent the relevant concentration range and are purified [91, 92]. Indeed, some protocols seem more sensitive for ERCCs than for real mRNA and vice versa [81]. In particular, spiking-in ERCCs is costly for droplet-based methods, therefore rarely done, and ERCC-only runs might overestimate the sensitivity of these methods [81]. Based on data from Grün et al. [80] that measured ERCCs, nascent transcripts by scRNA-seq and nine nascent transcripts by single-molecule FISH, it has been calculated that ERCCs underestimate sensitivity 10-fold. However, this lower sensitivity of ERCCs seems specific to this data set and might not be a general phenomenon [81]. Finally, the limited number of ERCCs in the relevant concentration range prevents reliable power and hence cost-efficiency calculations. Hence, creating a larger and more representative set of spike-ins would be a worthwhile community effort, as has been discussed before [93]. Ideally, spike-ins would consist of considerably more transcripts that are less biased toward highly abundant species (the most abundant ERCC transcript makes up ∼29% of all spike-in molecules). Furthermore, spike-in RNAs should represent endogenous mammalian mRNAs better in terms of poly-A length, GC content and average length [93]. This would improve comparisons across data sets, methods and laboratories and—maybe even more important—would improve read normalization across cells as discussed below.
That said, ERCCs are currently still the best possibility to compare a wide range of protocols across many laboratories, as done by Svensson et al. [80] for 19 protocols. One measure to compare protocols is the average correlation coefficient of the known ERCC concentrations to their measured concentration (reads or UMIs per million reads) across cells. Generally, protocols show high correlation coefficients, indicating that read counts reflect real transcript concentrations fairly accurately at least across the wide concentration range represented by ERCCs [80, 81]. However, this correlation coefficient is also affected by the sensitivity and precision of the ERCC measurements and hence difficult to interpret when comparing protocols. A better interpretable measure of ERCCs is the sensitivity measured as the 50% detection probability of an ERCC [80, 81]. Protocols differ >100-fold and the most sensitive protocols have a median of 2.2–2.7 molecules detection probability [75, 80]. However, some protocols are expensive per cell and hence cannot compete in terms of cost-efficiency [81]. Of relevance, molecular crowding Single-Cell RNA-barcoding and sequencing (mcSCRB-seq), a recent protocol based on molecular crowding, is up to five times cheaper and two times more powerful compared with the previous version of single-Cell RNA-barcoding and sequencing [81, 94], making it one of the most cost-efficient protocols currently available [75]. Other protocols might be similarly efficient [59, 60, 69, 70, 78], but this is currently difficult to quantify given the lack of comparable benchmarking data. One major factor that is not integrated in the cost-efficiency laid out above is the cost per sample and hence the flexibility of a method to accommodate different experimental designs. While high-throughput droplet-based methods are likely to beat at some point plate-based methods in terms of cost-efficiency per cell, droplet-based systems are likely to remain relatively expensive per sample. Hence, droplet-based protocols are and even more so will be the method of choice when more than hundreds of cells per sample with relatively shallow sequencing need to be analyzed. However, plate-based methods are and probably will remain for some time the method of choice when one to two plates over many samples need to be analyzed at higher sensitivity. In addition, the flexibility of plate-based methods in terms of cell isolation, combination of RNA and DNA analyses and spike-ins are likely to lead to a long-term coexistence of several droplet-based and plate-based methods. Benchmarking and quality control across methods and laboratories, ideally with better spike-ins and/or shared cellular reference samples, will be crucial to quantitatively make informed choices and compare data from different methods and laboratories. The Human Cell Atlas initiative [31] will be an ideal platform and community to develop and implement such standards for the experimental aspects discussed above and the closely connected computational aspects discussed in the next section.
Processing scRNA-seq data
Mapping reads
To quantify expression levels, a basic step is to map reads to the genome and/or transcriptome to identify the genomic fragment from which the cDNA was derived [95–98]). As single-cell and especially single-nucleus RNA-seq data contain relatively high fractions of intronic and intergenic reads [52, 54, 99], these can be wrongly mapped if the reference is only the transcriptome (Figure 5A). Furthermore, mapping to the transcriptome increases the multimapping problem [97]. Hence, mapping scRNA-seq reads to the genome is preferable. As 10–15% of those reads span splice junctions, the use of splice-aware genomic mappers is necessary. Unfortunately, the default settings of many splice-aware mappers perform worse than when parameters such as the number of allowed mismatches or the spacing of paired reads are optimized [95]. However, if the parameters are tuned correctly, no large performance differences among splice-aware mappers exist [95]. Also other studies found that different mapping strategies have a relatively small impact on detecting differentially expressed genes [100, 101].
Figure 5.

Processing scRNA-seq data. (A) The mapping strategy is a crucial step in scRNA-seq data processing that influences the end results. Reads are mapped to reference genome (left) or transcriptome (right). Short reads generated from introns, exons and intergenic regions are colored gray, blue and orange, respectively. As intronic and intergenic reads can be mapped wrongly (asterisk), mapping only to the transcriptome is not recommended. (B) Correctly assigning cDNA reads (gray) with early barcodes (blue and magenta) and UMIs (other colors) to two genes requires to control for sequencing errors in barcodes and UMIs. (C) Filtering ‘bad’ cells and doublets based on mapping reads and counting UMIs, respectively. Bad cells, such as Cell 3 in this example, have a low percentage of exonic reads (upper panel) and a low correlation to other cells (not shown). Doublets have on average a transcript count that is twice the population average (lower panel).
Given the amount of data produced by some scRNA-seq experiments, speed is another relevant property of mappers. If reads are used only for quantifying expression levels, a proper mapping but no proper base-wise alignment is required. Hence, the faster pseudoalignment methods have become popular [102–105].
Overall, while mapping details might influence the sensitivity for some difficult genes, it is a rather robust processing step as long as correctly tuned splice-aware mappers are used and appears to have only little impact on differential expression (DE) analysis.
What to count?
After mapping, reads need to be associated with genes or transcripts (Figure 5B). For model organisms such as human and mouse, there are several comprehensive resources of gene annotation [106–109]. However, even for well-resolved gene models, reads associated with the respective genes may still fall outside known annotations [110]. In ESAT, Derr et al. implemented an algorithm to extend gene boundaries based on the observed read mappings, thus increasing the sensitivity. Usually, reads that show a minimal overlap with an exon are counted as associated with the respective gene or transcript. Two popular implementations of such alignment to annotation associations are featureCounts [111] and HTSeq [112]. Assigning reads to genes is fairly straightforward, as different genes only rarely overlap. However assigning reads to transcripts is much more difficult, as different transcript isoforms of a gene heavily overlap. Several algorithms have been developed to quantify transcripts [102, 105, 113], but a correct transcript-level quantification is challenging for full-length bulk RNA-seq [95, 114]. It is certainly much more difficult for the much sparser scRNA-seq data that is usually not full length. Hence, quantification at the level of genes is the current standard for scRNA-seq data, and it needs to be seen to which extend transcript-specific quantification is possible and worthwhile for different scRNA-seq methods.
As mentioned above, scRNA-seq data contain a considerable amount of intronic reads, in particular when sequencing nuclei that presumably contain a higher fraction of unspliced RNAs [52, 54]. To our knowledge, zUMIs [115] is the first pipeline that allows counting of intronic reads, and it is compatible with most of the UMI-based RNA-seq protocols. Using this information is probably helpful to increase the sensitivity and precision of scRNA-seq quantification as seen by an increased resolution of clusters when introns are used in addition to exons [115].
Dealing with amplification bias
The low amounts of starting material in scRNA-seq require more amplification, leading to more ‘duplicated’ reads, i.e. reads derived from the same original mRNA molecule. We do not recommend to identify such duplicates based on their mapping position because many reads from different mRNA molecules map to the same position because of high expression of a gene and/or fragmentation bias [86]. Furthermore, pre-amplification, i.e. amplification steps in scRNA-seq methods before the fragmentation of cDNA, does not lead to the same mapping position of reads derived from the same mRNA molecule. Thus, methods that allow removing PCR noise using UMIs are preferable, and while bulk RNA-seq data profit little from their use [86], they increase precision and power considerably for scRNA-seq data [81, 86].
UMIs are 4–10 random nucleotides that are introduced with the primer used for cDNA generation before any amplification occurs (Figure 3, Supplementary Table S1). Hence, if multiple reads with the same UMI sequence map to the same gene, they are counted as one molecule (Figure 5B). However, sequencing errors within UMIs can lead in principle to an overestimation of different UMIs, and hard cutoffs on the distance among UMIs would lead to an underestimation. UMI-tools [116] implements network-based adjacency and directional adjacency methods considering both edit distance and the relative counts of similar UMIs to identify PCR/sequencing errors and group them together [116]. A much simpler and hence faster approach is to apply a sequence quality threshold, keeping only high-quality UMI sequences [66, 115, 117]. Macosko et al. suggest to apply a hard cutoff for filtering, where reads with the barcode containing n (default n = 1) low-quality bases (default < 30 phred). As PCR errors are relatively rare, this simple sequence quality filter should suffice [115].
It is early days for the integration of UMIs into bioinformatic pipelines; however, they are undoubtedly useful in denoising scRNA-seq data and easing distributional fitting [81, 88].
Identifying cells
Early barcoding, i.e. the labeling of cDNA by a cell-specific DNA sequence that allows multiplexing at an early stage, is decisive for increasing the throughput of scRNA-seq (see above). Hence, many scRNA-seq data need to be demultiplexed to identify cells in addition to the multiplexing introduced by i5 and i7 indices (Figure 3). For well-based methods, the number and sequence of barcodes in the library are known and usually designed with a maximal distance to each other to minimize the impact of sequencing errors. Such barcodes are fairly straightforward to demultiplex, and some methods provide a probabilistic assignment considering sequence quality, allowing for an unbiased and rigorous quality assessment [118, 119].
For droplet-based methods, the number and sequence of barcodes are usually not known, making demultiplexing more difficult, as the identification of one cell is no longer independent from the identification of other cells in the library. Removing barcodes with low sequencing quality will reduce spurious associations and is thus a recommended first step [115]. Still, dependent on the method and sample, many barcodes are linked to ‘background’ cDNA reads derived, e.g., from cell-free mRNA. These can often easily be identified when ranking barcodes, as they have a much lower average read count than barcodes derived from intact cells [115, 116, 120].
Filtering cells and genes
The variance in quality among cells of scRNA-seq experiments is much larger than the variance among samples in bulk RNA-seq experiments and downstream analyses profit from removing ‘bad’ cells before normalization [121–125]. One possibility is to identify low-quality ‘cells’ based on mapping statistics (Figure 5C). This includes an overrepresentation of mitochondrial RNAs, ribosomal RNAs (>40%) [121], spike-ins, adapters and/or reads that map outside of exons [121, 126–128]. Apart from these rather ad hoc indicators of cell quality, an alternative method is to calculate the pairwise correlation coefficient among all cells, take the highest correlation coefficient for each cell and remove those cells that fall below a threshold in the distribution of these maximal pairwise correlation coefficients [74]. This will remove real cells that occur only once in the data set and are different to all other cells, but will also remove low-quality ‘cells’, as these are different to real cells and to other low-quality ‘cells’. A possibility to remove doublets—at least if the population is rather homogenous—is to identify ‘cells’ that have two or more times the number of transcripts (UMI counts) than the population mode (Figure 5C).
In addition to filtering cells, filtering genes can facilitate the subsequent normalization. As genes with no or low expression contain little information anyway, they can readily be removed. While some authors suggest to use sensible arbitrary cutoffs [124], criteria for more rigorous filtering are difficult to generalize, as sporadic expression could reflect rare cell types or other biologically meaningful information.
Normalization
Among all data processing steps, normalization has probably the biggest impact on the analyses and interpretations of scRNA-seq data [93, 128, 129]. Normalization is needed to correct for unwanted variation among cells caused, e.g., by technical variation such as differences in sequencing depths, cell lysis or cDNA synthesis.
The most straightforward normalization is dividing counts for each gene in a cell by the total counts of that cell resulting in counts or transcripts (UMIs) per million. However, this assumes that the total amount of mRNA is the same among the analyzed cells, respectively, that all genes are equally affected by the unwanted variation [130]. These assumptions are almost always violated in single-cell data. First, RNA amounts vary considerably from cell to cell [131]. Second, technical variance in combination with biological variation (e.g. transcriptional bursting) contributes to the high frequency of zeroes and strong intercellular variability in scRNA-seq data [129, 131]. Therefore, cell-wise size factors generally used to normalize bulk RNA-seq samples such as TMM [132] or MR [133] are biased when applied to scRNA-seq [93].
These issues have lead to development of normalization methods that are geared toward single cells of which we will discuss scran [129], SCNorm [134], CENSUS [135] and BASiCS [136]. Scran solves the zero inflation issue by using counts from pooled cells for normalization and subsequent deconvolution to obtain cell-wise size factors. SCNorm applies a quantile regression for bins of genes with similar mean expression to estimate gene-wise size factors. Both appear to be able to handle the zero inflation as well as large differences in mean expression between groups. The third method, CENSUS estimates absolute RNA amounts from relative expression measurements (Transcripts per Million, Fragments Per Kilobase Million). The underlying generative model derived its assumptions from previous experiments using ERCC spike-ins (e.g. [74, 137]). It is not clear to what extent this is generalizable, but it is certainly not advised to use CENSUS in combination with UMI-methods [135]. Finally, BASiCS focuses on estimating the ratio of biological signal to technical noise, estimating the technical noise from spike-ins provided with the scRNA-seq data.
Because UMI-methods remove amplification noise, it is possible to normalize by downsampling to the same number of molecules [11, 138], but this makes the rather strong assumption that all genes are affected equally by unwanted technical variation.
In theory, spike-ins such as the widely used ERCCs [139, 140] allow the decomposition of observed cell-to-cell variability into technical noise and actual biological factors [91, 136, 141–144]. Furthermore, spike-ins are the only option to estimate differences in total mRNA content among cells. However, as discussed above, ERCCs have a number of limitations [91, 92] that should be addressed in future generations of spike-in mRNAs and will likely improve normalization [93, 145].
Moreover, to accommodate also heterogeneous cell populations with strong expression differences, normalization can be applied on clusters of cells with similar expression profiles resulting in more reliable size factor estimates [93, 129, 146]. In combination with imputation [147–149], this might help to alleviate the problem of zero inflation and its effects on normalization [146].
Batch and latent variable effects
Batch effects, i.e. unwanted variation that is added to groups of cells, are a common source of confounding variation and can lower the power to detect biological signals as well as result in a loss of type I error control [150, 151]. Thorough experimental design can alleviate this effect, but restrictions, e.g. in cell sorting procedures, can render batch effects inevitable. Furthermore, combining data sets from multiple experiments or labs also introduces batch effects. This is an immediate challenge for concerted effort like the Human Cell Atlas (Rozenblatt-Rosen et al. 2017; Regev et al. 2017) and in general for combining data from the increasing number of single-cell gene expression profiles. A possible approach is canonical correlation analysis to identify shared gene correlation structures across data sets to align cells for integrated comparative anlaysis [152], increasing the sample size and therefore power to detect biological signals in the inherent noisy and sparse scRNAseq data. More crucially, this will enable the comparison of diverging single-cell expression profiles, e.g., across species or conditions.
As already established for bulk RNA-seq, batch effects can be removed before further analysis or explicitly incorporated in downstream models for DE testing if batch labels are known [91, 153]. Recently, a method based on residual neural networks has been developed for scRNA-seq data; this method is able to remove systematic batch effects in an unsupervised label-free manner [154].
Some types of unwanted variation can also originate from biological heterogeneity, e.g. cell cycle stage and apoptosis, and can be accounted for by latent variable models [128, 155, 156]. Latent variable models are also a possible alley for signal extraction from multiple assays [157].
Analysis of cell-to-cell variation
Once the data have been normalized and batch effects are removed, the actual biological questions can be addressed. The most straightforward scenario is DE analysis when cell identity is a priori known, e.g., because of surface markers. In contrast, if the cells originate from a complex mixture or tissue without prior knowledge of cell-type composition, a first goal is to classify the cells into discrete types or sort them along a developmental trajectory, as reviewed elsewhere [36–38]. The peculiarities of scRNA-seq data, namely, dropouts, high variability and outliers require special attention [158]. Still, established methods for the detection of DE in bulk have also been applied to scRNA-seq data [5], as the negative binomial distribution has been found to fit the observed read count distribution for the majority of expressed genes [88, 144]. However, the analysis might be limited by filtering to conform to the tools requirements (e.g. minimum mean expression cutoff) and/or by violating model assumptions with an excess of zero counts. SCDE is one of the first methods for scRNA-seq data addressing the zero count inflation by applying a mixture model of the negative binomial and the Poisson distribution and robust estimation in the presence of strong overdispersion by bootstrapping [158]. beta-poisson model for single-Cell RNA-seq. and discrete distributional differential expression are other examples of mixture modeling approaches where a beta-Poisson mixture is used to capture the bimodality of scRNA-seq expression profiles [159, 160]. Instead of mixing distributions to match the observed expression patterns as closely as possible, there are also other possibilities to cope with the excess of zeroes. For example MAST incorporates a two-part generalized model by applying a hurdle model. The first step is to fit the expression rate, i.e. zeroes versus non-zero counts, as a logistic regression and conditioning on the resulting probability, as a second step the mean expression is modeled as a Gaussian distribution [124].
As with bulk RNA-seq data, nonparametric approaches circumvent the need for distributional specifications by, e.g., bootstrapping, but restrict the analysis to pairwise comparisons [161, 162]. However, more than one variable is often of interest, and additional variables, such as batch effects, need to be taken into account. Hence, generalized linear models have a clear advantage over nonparametric approaches as long as distribution assumptions are reasonable. Besides these modeling approaches focusing on mean expression levels, major effort has been invested in characterizing differences in cell-to-cell expression variability. One possibility is to allow multiple modes in the expression distribution of a given gene across conditions [163]. By that, cell state transitions and oscillatory expression patterns in otherwise homogeneous cell populations can be detected.
As for bulk RNA-seq, other factors such as gene length and GC-content can contribute to differences in gene expression across samples. Nevertheless, these are assumed to be consistent and constant across conditions in the methods presented here or could have been specifically accounted for during normalization [124, 164].
A first thorough evaluation covering >15 DE tools showed that if gene filtering is applied before DE testing, the methods developed for bulk RNA-seq performed just as well as methods specifically developed for single cells [165]. Interestingly, methods using transformed data rather than raw counts, e.g. limma [166], showed slightly higher concordance scores across data sets, i.e. they can handle variable signal-to-noise relations. In summary, this study as well as two others concluded that the performance improvement of scRNA-seq DE-tools is only minor [162, 167]. Nevertheless, a thorough assessment of scRNA-seq analysis workflows is still lacking, especially a dedicated analysis of all steps involved—ranging from the choice of expression quantification, prefiltering, normalization, and DE testing—with their relative contribution to the power to detect DE. For these benchmarking efforts gold standard data sets—as available for bulk methods [168, 169]—would be helpful. While FACS-sorted cell populations have been used as gold standards [170], assumptions, e.g., about homogeneity can be problematic. Hence, proper simulation tools that are adequate for scRNA-seq data are currently crucial for these efforts [88, 171].
Outlook
Clearly, scRNA-seq has become an established method in recent years and is becoming an essential tool in many biomedical areas, further urging to merge experimental and computational expertise in individual labs. However, experimental and computational methods are still fast evolving and better standardized reagents, and realistic simulation frameworks will be needed to benchmark them sufficiently well. As research questions will differ in weighing aspects of cell isolation, library generation and cost-efficiency, several different methods will likely coexist also in the longer term. This is even more true, as methods that quantify gene expression together with other -omic measurements, such as DNA sequence, epigenetic profiling or proteins, will be relevant for many research questions. As all these types of measurements require suspensions of cells or nuclei, crucial spatial information is lacking. Single-molecule imaging and/or in situ sequencing will be crucial tools to complement scRNA-seq data and might eventually even replace it.
Key Points
Experimental and computational methods for scRNA-seq have blossomed in recent years, making it necessary and difficult to pick appropriate methods
Experimentally, representative cell isolation from tissues is often the greatest challenge
Computationally, adequate normalizations and correction of batch and latent variables are the most crucial data processing steps
More representative spike-ins and standardized cells will be helpful to benchmark experimental methods and improve normalization across and within experiments
Gold standard data sets and proper simulation tools will be helpful to benchmark and improve computational methods.
Supplementary Data
Supplementary data are available online at https://academic.oup.com/bfg.
Funding
This work was supported by the Deutsche Forschungsgemeinschaft (DFG) through the SFB1243 subprojects A14 and A15.
Supplementary Material
Christoph Ziegenhain studied biology in Munich and Copenhagen until 2013, finished his PhD on scRNA-seq technologies in the Enard lab in 2017 and moved to the Sandberg lab in Stockholm in 2018.
Beate Vieth studied biology in Leuven and applied statistics in Ghent until 2012 and is doing her PhD in the Hellmann lab on statistical analysis of scRNA-seq data.
Swati Parekh studied bioinformatics in Rajkot and Chennai until 2008 and worked as a team leader for a genomics service provider before joining the Hellmann lab as a PhD student in evolutionary genomics.
Ines Hellmann did her PhD in Leipzig, a postdoc with Rasmus Nielsen in Copenhagen and Berkeley, continuing with Population Genomics as a group leader at the MFPL in Vienna before returning to Primate Genomics in Munich.
Wolfgang Enard studied biology in Munich, did his PhD, postdoc and group leader with Svante Pääbo in Leipzig and is since 2013 Professor in Munich. He is interested in using functional genomics to compare primates.
References
- 1. Linnarsson S, Teichmann SA.. Single-cell genomics: coming of age. Genome Biol 2016;17:97. [DOI] [PMC free article] [PubMed] [Google Scholar]
- 2. Tanay A, Regev A.. Scaling single-cell genomics from phenomenology to mechanism. Nature 2017;541(7637):331–8. [DOI] [PMC free article] [PubMed] [Google Scholar]
- 3. Reinius B, Sandberg R.. Random monoallelic expression of autosomal genes: stochastic transcription and allele-level regulation. Nat Rev Genet 2015;16:653–64. [DOI] [PubMed] [Google Scholar]
- 4. Reinius B, Mold JE, Ramsköld D, et al. Analysis of allelic expression patterns in clonal somatic cells by single-cell RNA-seq. Nat Genet 2016;48:1430–5. [DOI] [PMC free article] [PubMed] [Google Scholar]
- 5. Kolodziejczyk AA, Kim JK, Tsang JCH, et al. Single cell RNA-sequencing of pluripotent states unlocks modular transcriptional variation. Cell Stem Cell 2015;17(4):471–85. [DOI] [PMC free article] [PubMed] [Google Scholar]
- 6. Martinez-Jimenez CP, Eling N, Chen HC, et al. Aging increases cell-to-cell transcriptional variability upon immune stimulation. Science 2017;355(6332):1433–6. [DOI] [PMC free article] [PubMed] [Google Scholar]
- 7. Trapnell C. Defining cell types and states with single-cell genomics. Genome Res 2015;25(10):1491–8. [DOI] [PMC free article] [PubMed] [Google Scholar]
- 8. Björklund ÅK, Forkel M, Picelli S, et al. The heterogeneity of human CD127+ innate lymphoid cells revealed by single-cell RNA sequencing. Nat Immunol 2016;17(4):451–60. [DOI] [PubMed] [Google Scholar]
- 9. Villani AC, Satija R, Reynolds G, et al. Single-cell RNA-seq reveals new types of human blood dendritic cells, monocytes, and progenitors. Science 2017;356(6335) doi: 10.1126/science.aah4573. [DOI] [PMC free article] [PubMed] [Google Scholar]
- 10. Stubbington MJT, Rozenblatt-Rosen O, Regev A, et al. Single-cell transcriptomics to explore the immune system in health and disease. Science 2017;358(6359):58–63. [DOI] [PMC free article] [PubMed] [Google Scholar]
- 11. Jaitin DA, Kenigsberg E, Keren-Shaul H, et al. Massively parallel single-cell RNA-seq for marker-free decomposition of tissues into cell types. Science 2014;343(6172):776–9. [DOI] [PMC free article] [PubMed] [Google Scholar]
- 12. Poulin JF, Tasic B, Hjerling-Leffler J, et al. Disentangling neural cell diversity using single-cell transcriptomics. Nat Neurosci 2016;19(9):1131–41. [DOI] [PubMed] [Google Scholar]
- 13. Zeisel A, Muñoz-Manchado AB, Codeluppi S, et al. Cell types in the mouse cortex and hippocampus revealed by single-cell RNA-seq. Science 2015;347(6226):1138–42. [DOI] [PubMed] [Google Scholar]
- 14. La Manno G, Gyllborg D, Codeluppi S, et al. Molecular diversity of midbrain development in mouse, human, and stem cells. Cell 2016;167(2):566–80.e19. [DOI] [PMC free article] [PubMed] [Google Scholar]
- 15. Gokce O, Stanley GM, Treutlein B, et al. Cellular taxonomy of the mouse striatum as revealed by single-cell RNA-seq. Cell Rep 2016;16(4):1126–37. [DOI] [PMC free article] [PubMed] [Google Scholar]
- 16. Tasic B, Menon V, Nguyen TN, et al. Adult mouse cortical cell taxonomy revealed by single cell transcriptomics. Nat Neurosci 2016;19(2):335–46. [DOI] [PMC free article] [PubMed] [Google Scholar]
- 17. Lein E, Borm LE, Linnarsson S.. The promise of spatial transcriptomics for neuroscience in the era of molecular cell typing. Science 2017;358(6359):64–9. [DOI] [PubMed] [Google Scholar]
- 18. Haber AL, Biton M, Rogel N, et al. A single-cell survey of the small intestinal epithelium. Nature 2017;551:333–9. [DOI] [PMC free article] [PubMed] [Google Scholar]
- 19. Grün D, Lyubimova A, Kester L, et al. Single-cell messenger RNA sequencing reveals rare intestinal cell types. Nature 2015;525(7568):251–5. [DOI] [PubMed] [Google Scholar]
- 20. Muraro MJ, Dharmadhikari G, Grün D, et al. A single-cell transcriptome atlas of the human pancreas. Cell Syst 2016;3(4):385–94.e3. [DOI] [PMC free article] [PubMed] [Google Scholar]
- 21. Angerer P, Haghverdi L, Büttner M, et al. destiny—diffusion maps for large-scale single-cell data in R. Bioinformatics 2016;32(8):1241–3. [DOI] [PubMed] [Google Scholar]
- 22. Moignard V, Woodhouse S, Haghverdi L, et al. Decoding the regulatory network of early blood development from single-cell gene expression measurements. Nat Biotechnol 2015;33:269–76. [DOI] [PMC free article] [PubMed] [Google Scholar]
- 23. Haghverdi L, Büttner M, Wolf FA, et al. Diffusion pseudotime robustly reconstructs lineage branching. Nat Methods 2016;13(10):845–8. [DOI] [PubMed] [Google Scholar]
- 24. Dixit A, Parnas O, Li B, et al. Perturb-seq: dissecting molecular circuits with scalable single-cell RNA profiling of pooled genetic screens. Cell 2016;167(7):1853–66.e17. [DOI] [PMC free article] [PubMed] [Google Scholar]
- 25. Adamson B, Norman TM, Jost M, et al. A multiplexed single-cell CRISPR screening platform enables systematic dissection of the unfolded protein response. Cell 2016;167:1867–82.e21. [DOI] [PMC free article] [PubMed] [Google Scholar]
- 26. Datlinger P, Rendeiro AF, Schmidl C, et al. Pooled CRISPR screening with single-cell transcriptome readout. Nat Methods 2017;14(3):297–301. [DOI] [PMC free article] [PubMed] [Google Scholar]
- 27. Tirosh I, Izar B, Prakadan SM, et al. Dissecting the multicellular ecosystem of metastatic melanoma by single-cell RNA-seq. Science 2016;352(6282):189–96. [DOI] [PMC free article] [PubMed] [Google Scholar]
- 28. Venteicher AS, Tirosh I, Hebert C, et al. Decoupling genetics, lineages, and microenvironment in IDH-mutant gliomas by single-cell RNA-seq. Science 2017;355(6332). DOI: 10.1126/science.aai8478. [DOI] [PMC free article] [PubMed] [Google Scholar]
- 29. Patel AP, Tirosh I, Trombetta JJ, et al. Single-cell RNA-seq highlights intratumoral heterogeneity in primary glioblastoma. Science 2014;344(6190):1396–401. [DOI] [PMC free article] [PubMed] [Google Scholar]
- 30. Ebinger S, Özdemir EZ, Ziegenhain C, et al. Characterization of rare, dormant, and therapy-resistant cells in acute lymphoblastic leukemia. Cancer Cell 2016;30(6):849–62. [DOI] [PMC free article] [PubMed] [Google Scholar]
- 31. Rozenblatt-Rosen O, Stubbington MJT, Regev A, et al. The human cell atlas: from vision to reality. Nature 2017;550(7677):451–3. [DOI] [PubMed] [Google Scholar]
- 32. Regev A, Teichmann SA, Lander ES, et al. The human cell atlas. Elife 2017;6:e27041. [DOI] [PMC free article] [PubMed] [Google Scholar]
- 33. Karlsson K, Linnarsson S.. Single-cell mRNA isoform diversity in the mouse brain. BMC Genomics 2017;18(1):126. [DOI] [PMC free article] [PubMed] [Google Scholar]
- 34. Kelsey G, Stegle O, Reik W.. Single-cell epigenomics: recording the past and predicting the future. Science 2017;358(6359):69–75. [DOI] [PubMed] [Google Scholar]
- 35. Macaulay IC, Ponting CP, Voet T.. Single-cell multiomics: multiple measurements from single cells. Trends Genet 2017;33(2):155–68. [DOI] [PMC free article] [PubMed] [Google Scholar]
- 36. Cannoodt R, Saelens W, Saeys Y.. Computational methods for trajectory inference from single-cell transcriptomics. Eur J Immunol 2016;46(11):2496–506. [DOI] [PubMed] [Google Scholar]
- 37. Kumar P, Tan Y, Cahan P.. Understanding development and stem cells using single cell-based analyses of gene expression. Development 2017;144(1):17–32. [DOI] [PMC free article] [PubMed] [Google Scholar]
- 38. Wagner A, Regev A, Yosef N.. Revealing the vectors of cellular identity with single-cell genomics. Nat Biotechnol 2016;34(11):1145–60. [DOI] [PMC free article] [PubMed] [Google Scholar]
- 39. Andrews TS, Hemberg M.. Identifying cell populations with scRNASeq. Mol Aspects Med 2018;59:114–22. [DOI] [PubMed] [Google Scholar]
- 40. Chen J, Suo S, Tam PP, et al. Spatial transcriptomic analysis of cryosectioned tissue samples with Geo-seq. Nat Protoc 2017;12(3):566–80. [DOI] [PubMed] [Google Scholar]
- 41. Nichterwitz S, Chen G, Aguila Benitez J, et al. Laser capture microscopy coupled with Smart-seq2 for precise spatial transcriptomic profiling. Nat Commun 2016;7:12139. [DOI] [PMC free article] [PubMed] [Google Scholar]
- 42. Cadwell CR, Palasantza A, Jiang X, et al. Electrophysiological, transcriptomic and morphologic profiling of single neurons using Patch-seq. Nat Biotechnol 2016;34:199–203. [DOI] [PMC free article] [PubMed] [Google Scholar]
- 43. Fuzik J, Zeisel A, Máté Z, et al. Integration of electrophysiological recordings with single-cell RNA-seq data identifies neuronal subtypes. Nat Biotechnol 2016;34:175–83. [DOI] [PMC free article] [PubMed] [Google Scholar]
- 44. Lovatt D, Ruble BK, Lee J, et al. Transcriptome in vivo analysis (TIVA) of spatially defined single cells in live tissue. Nat Methods 2014;11:190–6. [DOI] [PMC free article] [PubMed] [Google Scholar]
- 45. Medaglia C, Giladi A, Stoler-Barak L, et al. Spatial reconstruction of immune niches by combining photoactivatable reporters and scRNA-seq. Science 2017;358(6370):1622–6. [DOI] [PMC free article] [PubMed] [Google Scholar]
- 46. Richardson GM, Lannigan J, Macara IG.. Does FACS perturb gene expression? Cytometry A 2015;87(2):166–75. [DOI] [PubMed] [Google Scholar]
- 47. van den Brink SC, Sage F, Vértesy Á, et al. Single-cell sequencing reveals dissociation-induced gene expression in tissue subpopulations. Nat Methods 2017;14:935–6. [DOI] [PubMed] [Google Scholar]
- 48. Lacar B, Linker SB, Jaeger BN, et al. Nuclear RNA-seq of single neurons reveals molecular signatures of activation. Nat Commun 2016;7:11022. [DOI] [PMC free article] [PubMed] [Google Scholar]
- 49. Newman AM, Liu CL, Green MR, et al. Robust enumeration of cell subsets from tissue expression profiles. Nat Methods 2015;12:453–7. [DOI] [PMC free article] [PubMed] [Google Scholar]
- 50. Grindberg RV, Yee-Greenbaum JL, McConnell MJ, et al. RNA-sequencing from single nuclei. Proc Natl Acad Sci USA 2013;110(49):19802–7. [DOI] [PMC free article] [PubMed] [Google Scholar]
- 51. Habib N, Li Y, Heidenreich M, et al. Div-seq: single-nucleus RNA-seq reveals dynamics of rare adult newborn neurons. Science 2016;353(6302):925–8. [DOI] [PMC free article] [PubMed] [Google Scholar]
- 52. Lake BB, Ai R, Kaeser GE, et al. Neuronal subtypes and diversity revealed by single-nucleus RNA sequencing of the human brain. Science 2016;352(6293):1586–90. [DOI] [PMC free article] [PubMed] [Google Scholar]
- 53. Krishnaswami SR, Grindberg RV, Novotny M, et al. Using single nuclei for RNA-seq to capture the transcriptome of postmortem neurons. Nat Protoc 2016;11(3):499–524. [DOI] [PMC free article] [PubMed] [Google Scholar]
- 54. Habib N, Avraham-Davidi I, Basu A, et al. Massively parallel single-nucleus RNA-seq with DroNc-seq. Nat Methods 2017;14(10):955–8. [DOI] [PMC free article] [PubMed] [Google Scholar]
- 55. Guillaumet-Adkins A, Rodríguez-Esteban G, Mereu E, et al. Single-cell transcriptome conservation in cryopreserved cells and tissues. Genome Biol 2017;18:45. [DOI] [PMC free article] [PubMed] [Google Scholar]
- 56. Thomsen ER, Mich JK, Yao Z, et al. Fixed single-cell transcriptomic characterization of human radial glial diversity. Nat Methods 2016;13:87–93. [DOI] [PMC free article] [PubMed] [Google Scholar]
- 57. Alles J, Karaiskos N, Praktiknjo SD, et al. Cell fixation and preservation for droplet-based single-cell transcriptomics. BMC Biol 2017;15(1):44. [DOI] [PMC free article] [PubMed] [Google Scholar]
- 58. Attar M, Sharma E, Li S, et al. A practical solution for preserving single cells for RNA sequencing. Sci Rep 2018;8:2151. [DOI] [PMC free article] [PubMed] [Google Scholar]
- 59. Rosenberg AB, Roco C, Muscat RA, et al. Scaling single cell transcriptomics through split pool barcoding. bioRxiv 2017; doi.org/10.1101/105163. [Google Scholar]
- 60. Cao J, Packer JS, Ramani V, et al. Comprehensive single-cell transcriptional profiling of a multicellular organism. Science 2017;357(6352):661–7. [DOI] [PMC free article] [PubMed] [Google Scholar]
- 61. Svensson V, Vento-Tormo R, Teichmann SA.. Moore’s law in single cell transcriptomics. arXiv preprint arXiv:1704.01379 2017.
- 62. Tang F, Barbacioru C, Wang Y, et al. mRNA-seq whole-transcriptome analysis of a single cell. Nat Methods 2009;6(5):377–82. [DOI] [PubMed] [Google Scholar]
- 63. Prakadan SM, Shalek AK, Weitz DA.. Scaling by shrinking: empowering single-cell ‘omics’ with microfluidic devices. Nat Rev Genet 2017;18(6):345–61. [DOI] [PMC free article] [PubMed] [Google Scholar]
- 64. Islam S, Kjällquist U, Moliner A, et al. Characterization of the single-cell transcriptional landscape by highly multiplex RNA-seq. Genome Res 2011;21(7):1160–7. [DOI] [PMC free article] [PubMed] [Google Scholar]
- 65. Hashimshony T, Wagner F, Sher N, et al. CEL-seq: single-cell RNA-seq by multiplexed linear amplification. Cell Rep 2012;2(3):666–73. [DOI] [PubMed] [Google Scholar]
- 66. Macosko EZ, Basu A, Satija R, et al. Highly parallel genome-wide expression profiling of individual cells using nanoliter droplets. Cell 2015;161(5):1202–14. [DOI] [PMC free article] [PubMed] [Google Scholar]
- 67. Klein AM, Mazutis L, Akartuna I, et al. Droplet barcoding for single-cell transcriptomics applied to embryonic stem cells. Cell 2015;161(5):1187–201. [DOI] [PMC free article] [PubMed] [Google Scholar]
- 68. Zheng GXY, Terry JM, Belgrader P, et al. Massively parallel digital transcriptional profiling of single cells. Nat Commun 2017;8:14049. [DOI] [PMC free article] [PubMed] [Google Scholar]
- 69. Gierahn TM, Wadsworth MH II, Hughes TK, et al. Seq-well: portable, low-cost RNA sequencing of single cells at high throughput. Nat Methods 2017;14:395–8. [DOI] [PMC free article] [PubMed] [Google Scholar]
- 70. Hochgerner H, Lönnerberg P, Hodge R, et al. STRT-seq-2i: dual-index 5’ single cell and nucleus RNA-seq on an addressable microwell array. Sci Rep 2017;7(1):16327. [DOI] [PMC free article] [PubMed] [Google Scholar]
- 71. Vickovic S, Ståhl PL, Salmén F, et al. Massive and parallel expression profiling using microarrayed single-cell sequencing. Nat Commun 2016;7:13182. [DOI] [PMC free article] [PubMed] [Google Scholar]
- 72. Kang HM, Subramaniam M, Targ S, et al. Multiplexed droplet single-cell RNA-sequencing using natural genetic variation. Nat Biotechnol 2018;36:89–94. [DOI] [PMC free article] [PubMed] [Google Scholar]
- 73. Zilionis R, Nainys J, Veres A, et al. Single-cell barcoding and sequencing using droplet microfluidics. Nat Protoc 2017;12:44–73. [DOI] [PubMed] [Google Scholar]
- 74. Petropoulos S, Edsgärd D, Reinius B, et al. Single-cell RNA-seq reveals lineage and X chromosome dynamics in human preimplantation embryos. Cell 2016;167(1):285. [DOI] [PMC free article] [PubMed] [Google Scholar]
- 75. Bagnoli JW, Ziegenhain C, Janjic A, et al. mcSCRB-seq: sensitive and powerful single-cell RNA sequencing. bioRxiv 2017;188367. [DOI] [PMC free article] [PubMed] [Google Scholar]
- 76. Picelli S, Björklund ÅK, Faridani OR, et al. Smart-seq2 for sensitive full-length transcriptome profiling in single cells. Nat Methods 2013;10:1096–8. [DOI] [PubMed] [Google Scholar]
- 77. Hashimshony T, Senderovich N, Avital G, et al. CEL-seq2: sensitive highly-multiplexed single-cell RNA-Seq. Genome Biol 2016;17:77. [DOI] [PMC free article] [PubMed] [Google Scholar]
- 78. Sasagawa Y, Danno H, Takada H, et al. Quartz-seq2: a high-throughput single-cell RNA-sequencing method that effectively uses limited sequence reads. Genome Biol 2018;19(1):29. [DOI] [PMC free article] [PubMed] [Google Scholar]
- 79. Wu AR, Neff NF, Kalisky T, et al. Quantitative assessment of single-cell RNA-sequencing methods. Nat Methods 2014;11(1):41–6. [DOI] [PMC free article] [PubMed] [Google Scholar]
- 80. Svensson V, Natarajan KN, Ly LH, et al. Power analysis of single-cell RNA-sequencing experiments. Nat Methods 2017;14(4):381–7. [DOI] [PMC free article] [PubMed] [Google Scholar]
- 81. Ziegenhain C, Vieth B, Parekh S, et al. Comparative analysis of single-cell RNA sequencing methods. Mol Cell 2017;65(4):631–43.e4. [DOI] [PubMed] [Google Scholar]
- 82. Fan X, Zhang X, Wu X, et al. Single-cell RNA-seq transcriptome analysis of linear and circular RNAs in mouse preimplantation embryos. Genome Biol 2015;16:148. [DOI] [PMC free article] [PubMed] [Google Scholar]
- 83. Sheng K, Cao W, Niu Y, et al. Effective detection of variation in single-cell transcriptomes using MATQ-seq. Nat Methods 2017;14(3):267–70. [DOI] [PubMed] [Google Scholar]
- 84. Faridani OR, Abdullayev I, Hagemann-Jensen M, et al. Single-cell sequencing of the small-RNA transcriptome. Nat Biotechnol 2016;34:1264–6. [DOI] [PubMed] [Google Scholar]
- 85. Zajac P, Islam S, Hochgerner H, et al. Base preferences in non-templated nucleotide incorporation by MMLV-derived reverse transcriptases. PLoS One 2013;8(12):e85270. [DOI] [PMC free article] [PubMed] [Google Scholar]
- 86. Parekh S, Ziegenhain C, Vieth B, et al. The impact of amplification on differential expression analyses by RNA-seq. Sci Rep 2016;6:25533. [DOI] [PMC free article] [PubMed] [Google Scholar]
- 87. Kivioja T, Vähärautio A, Karlsson K, et al. Counting absolute numbers of molecules using unique molecular identifiers. Nat Methods 2012;9:72–4. [DOI] [PubMed] [Google Scholar]
- 88. Vieth B, Ziegenhain C, Parekh S, et al. powsimR: power analysis for bulk and single cell RNA-seq experiments. Bioinformatics 2017;33(21):3486–8. [DOI] [PubMed] [Google Scholar]
- 89. SEQC/MAQC-III Consortium. A comprehensive assessment of RNA-seq accuracy, reproducibility and information content by the Sequencing Quality Control Consortium. Nat Biotechnol 2014;32(9):903–14. [DOI] [PMC free article] [PubMed] [Google Scholar]
- 90. Baker SC, Bauer SR, Beyer RP, et al. The external RNA controls consortium: a progress report. Nat Methods 2005;2(10):731–4. [DOI] [PubMed] [Google Scholar]
- 91. Risso D, Ngai J, Speed TP, et al. Normalization of RNA-seq data using factor analysis of control genes or samples. Nat Biotechnol 2014;32(9):896–902. [DOI] [PMC free article] [PubMed] [Google Scholar]
- 92. Tung PY, Blischak JD, Hsiao CJ, et al. Batch effects and the effective design of single-cell gene expression studies. Sci Rep 2017;7:39921. [DOI] [PMC free article] [PubMed] [Google Scholar]
- 93. Vallejos CA, Risso D, Scialdone A, et al. Normalizing single-cell RNA sequencing data: challenges and opportunities. Nat Methods 2017;14(6):565–71. [DOI] [PMC free article] [PubMed] [Google Scholar]
- 94. Soumillon M, Cacchiarelli D, Semrau S, et al. Characterization of directed differentiation by high-throughput single-cell RNA-seq. bioRxiv 2014. doi.org/10.1101/003236. [Google Scholar]
- 95. Baruzzo G, Hayer KE, Kim EJ, et al. Simulation-based comprehensive benchmarking of RNA-seq aligners. Nat Methods 2017;14(2):135–9. [DOI] [PMC free article] [PubMed] [Google Scholar]
- 96. Fonseca NA, Rung J, Brazma A, et al. Tools for mapping high-throughput sequencing data. Bioinformatics 2012;28(24):3169–77. [DOI] [PubMed] [Google Scholar]
- 97. Conesa A, Madrigal P, Tarazona S, et al. A survey of best practices for RNA-seq data analysis. Genome Biol 2016;17:13. [DOI] [PMC free article] [PubMed] [Google Scholar]
- 98. Engström PG, Steijger T, Sipos B, et al. Systematic evaluation of spliced alignment programs for RNA-seq data. Nat Methods 2013;10(12):1185–91. [DOI] [PMC free article] [PubMed] [Google Scholar]
- 99. Castelo-Branco G, Adameyko I, Linnarsson S. et al. RNA velocity in single cells. bioRxiv 2017. doi.org/10.1101/206052. [Google Scholar]
- 100. Teng M, Love MI, Davis CA, et al. A benchmark for RNA-seq quantification pipelines. Genome Biol 2016;17:74. [DOI] [PMC free article] [PubMed] [Google Scholar]
- 101. Germain PL, Vitriolo A, Adamo A, et al. RNAontheBENCH: computational and empirical resources for benchmarking RNAseq quantification and differential expression methods. Nucleic Acids Res 2016;44(11):5054–67. [DOI] [PMC free article] [PubMed] [Google Scholar]
- 102. Bray NL, Pimentel H, Melsted P, et al. Near-optimal probabilistic RNA-seq quantification. Nat Biotechnol 2016;34:525–7. [DOI] [PubMed] [Google Scholar]
- 103. Patro R, Mount SM, Kingsford C.. Sailfish enables alignment-free isoform quantification from RNA-seq reads using lightweight algorithms. Nat Biotechnol 2014;32:462–4. [DOI] [PMC free article] [PubMed] [Google Scholar]
- 104. Srivastava A, Sarkar H, Gupta N, et al. RapMap: a rapid, sensitive and accurate tool for mapping RNA-seq reads to transcriptomes. Bioinformatics 2016;32(12):i192–200. [DOI] [PMC free article] [PubMed] [Google Scholar]
- 105. Patro R, Duggal G, Love MI, et al. Salmon provides fast and bias-aware quantification of transcript expression. Nat Methods 2017;14(4):417–19. [DOI] [PMC free article] [PubMed] [Google Scholar]
- 106. Zhao S, Zhang B.. A comprehensive evaluation of ensembl, RefSeq, and UCSC annotations in the context of RNA-seq read mapping and gene quantification. BMC Genomics 2015;16:97. [DOI] [PMC free article] [PubMed] [Google Scholar]
- 107. Nellore A, Jaffe AE, Fortin JP, et al. Human splicing diversity and the extent of unannotated splice junctions across human RNA-seq samples on the sequence read archive. Genome Biol 2016;17:266. [DOI] [PMC free article] [PubMed] [Google Scholar]
- 108. Garber M, Grabherr MG, Guttman M, et al. Computational methods for transcriptome annotation and quantification using RNA-seq. Nat Methods 2011;8(6):469–77. [DOI] [PubMed] [Google Scholar]
- 109. Mortazavi A, Williams BA, McCue K, et al. Mapping and quantifying mammalian transcriptomes by RNA-seq. Nat Methods 2008;5:621–8. [DOI] [PubMed] [Google Scholar]
- 110. Derr A, Yang C, Zilionis R, et al. End Sequence Analysis Toolkit (ESAT) expands the extractable information from single-cell RNA-seq data. Genome Res 2016;26(10):1397–410. [DOI] [PMC free article] [PubMed] [Google Scholar]
- 111. Liao Y, Smyth GK, Shi W.. featureCounts: an efficient general purpose program for assigning sequence reads to genomic features. Bioinformatics 2014;30(7):923–30. [DOI] [PubMed] [Google Scholar]
- 112. Anders S, Pyl PT, Huber W.. HTSeq–a Python framework to work with high-throughput sequencing data. Bioinformatics 2015;31(2):166–9. [DOI] [PMC free article] [PubMed] [Google Scholar]
- 113. Roberts A, Pachter L.. Streaming fragment assignment for real-time analysis of sequencing experiments. Nat Methods 2013;10(1):71–3. [DOI] [PMC free article] [PubMed] [Google Scholar]
- 114. Hayer KE, Pizarro A, Lahens NF, et al. Benchmark analysis of algorithms for determining and quantifying full-length mRNA splice forms from RNA-seq data. Bioinformatics 2015;31(24):3938–45. [DOI] [PMC free article] [PubMed] [Google Scholar]
- 115. Parekh S, Ziegenhain C, Vieth B, et al. zUMIs: a fast and flexible pipeline to process RNA sequencing data with UMIs. bioRxiv 2017;153940. [DOI] [PMC free article] [PubMed] [Google Scholar]
- 116. Smith TS, Heger A, Sudbery I.. UMI-tools: modelling sequencing errors in unique molecular identifiers to improve quantification accuracy. Genome Res 2017;27(3):491–9. [DOI] [PMC free article] [PubMed] [Google Scholar]
- 117. Islam S, Zeisel A, Joost S, et al. Quantitative single-cell RNA-seq with unique molecular identifiers. Nat Methods 2014;11(2):163–6. [DOI] [PubMed] [Google Scholar]
- 118. Renaud G, Stenzel U, Maricic T, et al. deML: robust demultiplexing of Illumina sequences using a likelihood-based approach. Bioinformatics 2015;31(5):770–2. [DOI] [PMC free article] [PubMed] [Google Scholar]
- 119. Galanti L, Shasha D, Gunsalus K.. Pheniqs: fast and flexible quality-aware sequence demultiplexing. bioRxiv 2017;128512. [Google Scholar]
- 120. Petukhov V, Guo J, Baryawno N, et al. Accurate estimation of molecular counts in droplet-based single-cell RNA-seq experiments. bioRxiv 2017;171496. [DOI] [PMC free article] [PubMed] [Google Scholar]
- 121. Ilicic T, Kim JK, Kolodziejczyk AA, et al. Classification of low quality cells from single-cell RNA-seq data. Genome Biol 2016;17:29. [DOI] [PMC free article] [PubMed] [Google Scholar]
- 122. Bacher R, Kendziorski C.. Design and computational analysis of single-cell RNA-sequencing experiments. Genome Biol 2016;17:63. [DOI] [PMC free article] [PubMed] [Google Scholar]
- 123. Guo M, Wang H, Potter SS, et al. SINCERA: a pipeline for single-cell RNA-seq profiling analysis. PLoS Comput Biol 2015;11(11):e1004575. [DOI] [PMC free article] [PubMed] [Google Scholar]
- 124. Finak G, McDavid A, Yajima M, et al. MAST: a flexible statistical framework for assessing transcriptional changes and characterizing heterogeneity in single-cell RNA sequencing data. Genome Biol 2015;16:278. [DOI] [PMC free article] [PubMed] [Google Scholar]
- 125. McCarthy DJ, Campbell KR, Lun AT, Wills QF.. Scater: pre-processing, quality control, normalization and visualization of single-cell RNA-seq data in R. Bioinformatics 2017;33(8):1179–86. [DOI] [PMC free article] [PubMed] [Google Scholar]
- 126. DeLuca DS, Levin JZ, Sivachenko A, et al. RNA-SeQC: RNA-seq metrics for quality control and process optimization. Bioinformatics 2012;28(11):1530–2. [DOI] [PMC free article] [PubMed] [Google Scholar]
- 127. Li S, Łabaj PP, Zumbo P, et al. Detecting and correcting systematic variation in large-scale RNA sequencing data. Nat Biotechnol 2014;32:888–95. [DOI] [PMC free article] [PubMed] [Google Scholar]
- 128. Stegle O, Teichmann SA, Marioni JC.. Computational and analytical challenges in single-cell transcriptomics. Nat Rev Genet 2015;16(3):133–45. [DOI] [PubMed] [Google Scholar]
- 129. Lun ATL, Bach K, Marioni JC.. Pooling across cells to normalize single-cell RNA sequencing data with many zero counts. Genome Biol 2016;17:75. [DOI] [PMC free article] [PubMed] [Google Scholar]
- 130. Evans C, Hardin J, Stoebel DM.. Selecting between-sample RNA-Seq normalization methods from the perspective of their assumptions. Brief Bioinform 2017, doi: 10.1093/bib/bbx008. [DOI] [PMC free article] [PubMed] [Google Scholar]
- 131. Marinov GK, Williams BA, McCue K, et al. From single-cell to cell-pool transcriptomes: stochasticity in gene expression and RNA splicing. Genome Res 2014;24(3):496–510. [DOI] [PMC free article] [PubMed] [Google Scholar]
- 132. Robinson MD, Oshlack A.. A scaling normalization method for differential expression analysis of RNA-seq data. Genome Biol 2010;11(3):R25. [DOI] [PMC free article] [PubMed] [Google Scholar]
- 133. Anders S, Huber W.. Differential expression analysis for sequence count data. Genome Biol 2010;11(10):R106. [DOI] [PMC free article] [PubMed] [Google Scholar]
- 134. Bacher R, Chu LF, Leng N, et al. SCnorm: robust normalization of single-cell RNA-seq data. Nat Methods 2017;14(6):584–6. [DOI] [PMC free article] [PubMed] [Google Scholar]
- 135. Qiu X, Hill A, Packer J, et al. Single-cell mRNA quantification and differential analysis with Census. Nat Methods 2017;14(3):309–15. [DOI] [PMC free article] [PubMed] [Google Scholar]
- 136. Vallejos CA, Marioni JC, Richardson S.. BASiCS: Bayesian analysis of single-cell sequencing data. PLoS Comput Biol 2015;11(6):e1004333. [DOI] [PMC free article] [PubMed] [Google Scholar]
- 137. Treutlein B, Brownfield DG, Wu AR, et al. Reconstructing lineage hierarchies of the distal lung epithelium using single-cell RNA-seq. Nature 2014;509(7500):371–5. [DOI] [PMC free article] [PubMed] [Google Scholar]
- 138. Grün D, van Oudenaarden A.. Design and analysis of single-cell sequencing experiments. Cell 2015;163(4):799–810. [DOI] [PubMed] [Google Scholar]
- 139. External RNA Controls Consortium. Proposed methods for testing and selecting the ERCC external RNA controls. BMC Genomics 2005;6:150. [DOI] [PMC free article] [PubMed] [Google Scholar]
- 140. Jiang L, Schlesinger F, Davis CA, et al. Synthetic spike-in standards for RNA-seq experiments. Genome Res 2011;21(9):1543–51. [DOI] [PMC free article] [PubMed] [Google Scholar]
- 141. Ding B, Zheng L, Zhu Y, et al. Normalization and noise reduction for single cell RNA-seq experiments. Bioinformatics 2015;31(13):2225–7. [DOI] [PMC free article] [PubMed] [Google Scholar]
- 142. Katayama S, Töhönen V, Linnarsson S, et al. SAMstrt: statistical test for differential expression in single-cell transcriptome with spike-in normalization. Bioinformatics 2013;29(22):2943–5. [DOI] [PMC free article] [PubMed] [Google Scholar]
- 143. Kim JK, Kolodziejczyk AA, Illicic T, et al. Characterizing noise structure in single-cell RNA-seq distinguishes genuine from technical stochastic allelic expression. Nat Commun 2015;6:8687. [DOI] [PMC free article] [PubMed] [Google Scholar]
- 144. Grün D, Kester L, van Oudenaarden A.. Validation of noise models for single-cell transcriptomics. Nat Methods 2014;11(6):637–40. [DOI] [PubMed] [Google Scholar]
- 145. Lun ATL, Calero-Nieto FJ, Haim-Vilmovsky L, et al. Assessing the reliability of spike-in normalization for analyses of single-cell RNA sequencing data. Genome Res 2017;27(11):1795–806. [DOI] [PMC free article] [PubMed] [Google Scholar]
- 146. Azizi E, Prabhakaran S, Carr A, et al. Bayesian inference for single-cell clustering and imputing. Genomics Comput Biol 2017;3:46. [Google Scholar]
- 147. Lin P, Troup M, Ho JWK.. CIDR: ultrafast and accurate clustering through imputation for single-cell RNA-seq data. Genome Biol 2017;18(1):59. [DOI] [PMC free article] [PubMed] [Google Scholar]
- 148. Pierson E, Yau C.. ZIFA: dimensionality reduction for zero-inflated single-cell gene expression analysis. Genome Biol 2015;16:241. [DOI] [PMC free article] [PubMed] [Google Scholar]
- 149. Li WV, Li JJ.. scImpute: accurate and robust imputation for single cell RNA-seq data. Nat Comm 2018;9(1):997. [DOI] [PMC free article] [PubMed] [Google Scholar]
- 150. Lun ATL, Marioni JC.. Overcoming confounding plate effects in differential expression analyses of single-cell RNA-seq data. Biostatistics 2017;18(3):451–64. [DOI] [PMC free article] [PubMed] [Google Scholar]
- 151. Hicks SC, Townes FW, Teng M, Irizarry RA.. Missing data and technical variability in single-cell RNA-sequencing experiments. Biostatistics 2017, doi: 10.1093/biostatistics/kxx053. [DOI] [PMC free article] [PubMed] [Google Scholar]
- 152. Butler A, Satija R.. Integrated analysis of single cell transcriptomic data across conditions, technologies, and species. bioRxiv 2017;164889. [DOI] [PMC free article] [PubMed] [Google Scholar]
- 153. Leek JT. svaseq: removing batch effects and other unwanted noise from sequencing data. Nucleic Acids Res 2014;42:e161. [DOI] [PMC free article] [PubMed] [Google Scholar]
- 154. Shaham U, Stanton KP, Zhao J, et al. Removal of batch effects using distribution-matching residual networks. Bioinformatics 2017;33(16):2539–46. [DOI] [PMC free article] [PubMed] [Google Scholar]
- 155. Buettner F, Natarajan KN, Casale FP, et al. Computational analysis of cell-to-cell heterogeneity in single-cell RNA-sequencing data reveals hidden subpopulations of cells. Nat Biotechnol 2015;33(2):155–60. [DOI] [PubMed] [Google Scholar]
- 156. Buettner F, Pratanwanich N, Marioni JC, et al. Scalable latent-factor models applied to single-cell RNA-seq data separate biological drivers from confounding effects. bioRxiv 2016;087775. [Google Scholar]
- 157. Argelaguet R, Velten B, Arnol D, et al. Multi-Omics factor analysis disentangles heterogeneity in blood cancer. bioRxiv 2017;217554. [Google Scholar]
- 158. Kharchenko PV, Silberstein L, Scadden DT.. Bayesian approach to single-cell differential expression analysis. Nat Methods 2014;11(7):740–2. [DOI] [PMC free article] [PubMed] [Google Scholar]
- 159. Vu TN, Wills QF, Kalari KR, et al. Beta-Poisson model for single-cell RNA-seq data analyses. Bioinformatics 2016;32(14):2128–35. [DOI] [PMC free article] [PubMed] [Google Scholar]
- 160. Delmans M, Hemberg M.. Discrete distributional differential expression (D3E)–a tool for gene expression analysis of single-cell RNA-seq data. BMC Bioinformatics 2016;17:110. [DOI] [PMC free article] [PubMed] [Google Scholar]
- 161. Seyednasrollah F, Rantanen K, Jaakkola P, Elo LL.. ROTS: reproducible RNA-seq biomarker detector—prognostic markers for clear cell renal cell cancer. Nucleic Acids Res 2016;44:e1. [DOI] [PMC free article] [PubMed] [Google Scholar]
- 162. Jaakkola MK, Seyednasrollah F, Mehmood A, et al. Comparison of methods to detect differentially expressed genes between single-cell populations. Brief Bioinform 2016;bbw057. [DOI] [PMC free article] [PubMed] [Google Scholar]
- 163. Korthauer KD, Chu LF, Newton MA, et al. A statistical approach for identifying differential distributions in single-cell RNA-seq experiments. Genome Biol 2016;17:222. [DOI] [PMC free article] [PubMed] [Google Scholar]
- 164. Risso D, Schwartz K, Sherlock G, et al. GC-content normalization for RNA-seq data. BMC Bioinformatics 2011;12(1):480. [DOI] [PMC free article] [PubMed] [Google Scholar]
- 165. Soneson C, Robinson MD.. Bias, robustness and scalability in differential expression analysis of single-cell RNA-seq data. Nat Methods 2018; doi:10.1038/nmeth.4612. [DOI] [PubMed] [Google Scholar]
- 166. Phipson B, Lee S, Majewski IJ, et al. Robust hyperparameter estimation protects against hypervariable genes and improves power to detect differential expression. Ann Appl Stat 2016;10:946–63. [DOI] [PMC free article] [PubMed] [Google Scholar]
- 167. Dal Molin A, Baruzzo G, Di Camillo B.. Single-cell RNA-sequencing: assessment of differential expression analysis methods. Front Genet 2017;8:62. [DOI] [PMC free article] [PubMed] [Google Scholar]
- 168. Williams CR, Baccarella A, Parrish JZ, et al. Empirical assessment of analysis workflows for differential expression analysis of human samples using RNA-Seq. BMC Bioinformatics 2017;18:38. [DOI] [PMC free article] [PubMed] [Google Scholar]
- 169. Rigaill G, Balzergue S, Brunaud V, et al. Synthetic data sets for the identification of key ingredients for RNA-seq differential analysis. Brief Bioinform 2018;19(1):65–76. [DOI] [PubMed] [Google Scholar]
- 170. Kiselev VY, Kirschner K, Schaub MT, et al. SC3: consensus clustering of single-cell RNA-seq data. Nat Methods 2017;14(5):483–6. [DOI] [PMC free article] [PubMed] [Google Scholar]
- 171. Zappia L, Phipson B, Oshlack A.. Splatter: simulation of single-cell RNA sequencing data. Genome Biol 2017;18(1):174. [DOI] [PMC free article] [PubMed] [Google Scholar]
Associated Data
This section collects any data citations, data availability statements, or supplementary materials included in this article.