

Abstract
Objectives:
Assess the anti-tumor activity of everolimus and bevacizumab among patients with advanced neuroendocrine tumors. Assess perfusion computed tomography (pCT) as potential functional biomarker.
Method:
Patients with low to intermediate grade neuroendocrine tumors received one 3 week-cycle of bevacizumab 15 mg/kg day 1 or everolimus 10 mg daily. Subsequent cycles consisted of the combination of both drugs. pCTs were performed at baseline, end of cycle 1, and 3.
Results:
Therapy decreased BF proportional to baseline measurements. Bevacizumab was associated with a 44% decrease in BF (P<0.0001). After the addition of everolimus, a further 29% decrease (P=0.02) in BF was observed. Everolimus alone was associated with 13% increase in mean transit time (MTT; P=0.02). Clinical activity was demonstrated with a confirmed response rate of 21%, and median progression free survival of 14.6 (95% CI, 13.0 – 16.1) months. Pre-treatment tumor permeability surface (P=0.009), post-treatment MTT (P=0.003), percent reduction in BF (P=0.03), and percent reduction in blood volume (P=0.002) were associated with best percent reduction in tumor diameters.
Conclusions:
Bevacizumab and everolimus demonstrated anti-tumor activity. pCT is a promising tool for the development of anti-angiogenic strategies and for the selection of patients likely to benefit from therapy.
Keywords: Neuroendocrine tumors, anti-angiogengic therapy, mTOR, VEGF
Introduction
There is urgent need for the development of biomarkers in oncology to accelerate advances in novel therapeutics and to develop personalized therapy. Biomarkers for therapies targeting angiogenesis have been particularly challenging. This is in part due to the fact that tumor response rates, as assessed by morphologic imaging measures, with these and other molecularly targeted therapies have often been low. Nonetheless, treatment can delay progression and be associated with improvements in survival.1–3 Predictive, prognostic, and pharmacodynamic biomarkers that will enable development of novel drugs and drug combinations targeting angiogenesis are needed.
Well differentiated neuroendocrine tumors (WDNETs) can originate from cells scattered throughout the body. While generally thought to be rare, its diagnosed incidence is on the rise.4 WDNETs are vascular and known to express vascular endothelial growth factor (VEGF).5, 6 Prior studies with VEGF monoclonal antibody, bevacizumab,7 and VEGF tyrosine kinase inhibitors sunitinib,8, 9 sorafenib,10 and pazopanib11 have demonstrated promising activity. Perfusion CT (pCT) has demonstrated that bevacizumab leads to rapid and sustained decrease in tumor blood flow (BF). Data also suggested that lower post-treatment blood volume (BV) correlated with progression free survival (PFS).7 Further analyses of the pCT data demonstrated that the absolute decrease in tumor BF correlated with baseline BF.12 These results suggested bevacizumab decreased mean tumor BF by a certain percentage.
In recent placebo-controlled studies, everolimus, an oral inhibitor of mTOR, also demonstrated anti-tumor activity.13, 14 Everolimus has also been reported to have antiangiogenic properties distinct from VEGF inhibitors.15 Thus, there is rationale to combine everolimus with bevacizumab. Traditionally, testing whether combination therapy is more efficacious than monotherapy using conventional endpoints required a large sample size.
In the current study, we evaluated whether the combination of bevacizumab and everolimus further decreased tumor BF compared with either agent alone. The study used a novel study-design based on our prior observation that significantly reduced the number of patients required. We also assessed the correlation of pCT changes with tumor response profiles.
Method
Patients
Patients were ≥ 18 years old with histologically confirmed metastatic or unresectable WDNETs and at least one lesion suitable for pCT (≥ 3 cm transaxial diameter). Any number of prior antineoplastic therapies was allowed. Key eligibility criteria included Zubrod performance status of 0 or 1, adequate bone marrow, renal, and hepatic function, and adequately controlled blood pressure, lipid and glucose concentrations. Patients were ineligible if they had any uncontrolled medical conditions, received prior therapy with VEGF- or mTOR- inhibitors, or chronic treatment with corticosteroids. Prior (if dose stable for 2 month) and concomitant treatment with somatostatin analogue was allowed. Twenty-nine (74%) patients had progressive disease at study entry. Ten patients (26%) without documented progression were enrolled for poor prognostic features such as high tumor burden. All patients gave informed consent. The protocol was approved by the Institutional Review Committee of the M.D. Anderson Cancer Center, and the study followed the Declaration of Helsinki and good clinical practice guidelines.
Treatment and evaluation
Patients were randomly assigned to receive one 21-day cycle of intravenous bevacizumab 15 mg/kg/day day 1 or oral everolimus 10 mg daily. In subsequent cycles, patients received the combination of bevacizumab 15 mg/kg/day day 1 and everolimus 10 mg daily unless reduced, held, or discontinued for adverse events. Patients could remain on study until disease progression or completion of 12 months, which could be extended if therapy was felt to be beneficial by the treating physician.
Everolimus was held for grade 3 or 4 hematologic or grade 3 non-hematologic toxicities and resumed at 5 mg daily after recovery to grade ≤ 2. A further dose reduction to 5 mg every other day was allowed if toxicity recurred. Everolimus therapy was discontinued if recovery did not occur within 2 weeks and for any grade 4 non-hematologic toxicity.
Bevacizumab was held for grade 3 toxicity and discontinued for grade 4 toxicities. Treatment could resume at full dose if patient recovered to grade ≤ 1 within 8 weeks. Dose reduction was not allowed for bevacizumab.
Tumor response was assessed by multi-phasic CT every 9 weeks according to Response Evaluation Criteria in Solid Tumors (RECIST), version 1.0.16 National Cancer Institute Common Terminology Criteria for Adverse Events version 3.0 (CTCAE) were used to assess toxicity. PFS and overall survival (OS) were measured from the date of study entry.
Pefusion CT
Scans were obtained with patients in the supine position on a 64-row multidetector CT (LightSpeed, GE Medical Systems, Milwaukee, WI). Axial cine scans were performed using a single level of 4 cm thickness at the midpoint of the target lesion. CT data was collected at that single axial location using the cine mode during a 30 second breathhold (8i mode, 120kV, 90 mA). Data acquisition started 5 seconds after intravenous injection of 50 mL of a nonionic contrast agent (ioversol [Optiray™], 320 mg of iodine/100 mL, Mallinckrodt Inc., St Louis, MO) using an automatic injector at 7 mL/second, through an 18-gauge needle placed in an antecubital vein. The images, eight contiguous slices each of 5 mm thickness, were acquired in cine mode with a 1 second rotation speed, and were reconstructed at the CT console at half rotation intervals, giving an effective temporal resolution of 0.5 seconds.
The images were analyzed using CT-perfusion software on a workstation (CT Perfusion version 3, Advantage Windows 4.2; GE Medical Systems, Milwaukee, WI). This uses a deconvolution physiological model.17 A region of interest (ROI) was placed in the largest available artery in the cine sections, typically the abdominal aorta, which provided the arterial input function for generation of perfusion maps, using the Body Perfusion protocol. ROIs were drawn freehand around the periphery of target lesions with reference to the source cine CT images and perfusion parametric maps, on each axial section in which tumor was visualized. This generated mean BF, BV, mean transit time (MTT), and permeability surface (PS) values for each tumor ROI on each level. The pCT parameter values obtained for each level were then averaged for each lesion evaluated.
Study personnel responsible for the measurement of pCT (CD and CSN) were separate from those responsible for RECIST tumor measurements (JCY, ATP, DF).
Statistical Considerations
The study’s primary objectives were to determine effect of bevacizumab and everolimus as single agents on tumor blood flow and to determine the additive effect of being on both everolimus and bevacizumab. In our prior study, treatment with bevacizumab was associated with 29% decrease in tumor blood flow (standard deviation [SD] = 18%).7 Using a one-sample t-test of the percentage change, assuming SD = 0.2, 2.5% one-sided alpha, and 80% power, we would need 18 patients per arm to detect a mean of 13% as significantly different from 0. We corrected for multiple testing described in the primary study objectives by reducing our significance level (alpha) to 2.5% (P ≤ 0.025).
No formal adjustment of significance level was performed for exploratory analyses. These included baseline and treatment related changes in other pCT parameters including BV, MTT, and PS. Other exploratory analyses included the correlation of pCT parameters with best relative change in sum of RECIST target lesion diameters (Pearson correlation), PFS, and OS. All statistical calculations were performed using PASW Statistics 17.0 (SPSS Inc., Chicago, Illinois).
Result
Patient characteristics and baseline pCT parameters
Thirty-nine eligible patients (Table 1) were enrolled between January 2008 and June 2009. Twenty-nine patients (74%) had progressive disease at study entry. Of the remaining ten patients, nine (23%) were enrolled for high tumor burden (Table 1). Among these patients, 72 tumor lesions were evaluated by pCT at baseline. Thirty-six patients with 65 lesions were evaluable for all three planned pCT time-points.
Table 1.
Patient characteristics and pCT changes.
| Patient characteristic | |
|---|---|
| Gender | |
| Male | 17 (44%) |
| Female | 22 (56%) |
| Age (Mean, SD) | 56 (12.6) |
| Grade | |
| Low | 24 (62%) |
| Intermediate | 13 (33%) |
| FNA only | 2 (5%) |
| Primary site | |
| Lung | 2 (5%) |
| Pancreas | 13 (33%) |
| Small bowel | 13 (33%) |
| Rectum | 2 (5%) |
| Unknown | 9 (23%) |
| Prior therapy | |
| Surgery | 6 (15%) |
| Chemotherapy | 6 (15%) |
| Radiotherapy | 1 (3%) |
| Somatostatin analogue | 18 (46%) |
| Concurrent | |
| Somatostatin analogue | 12 (31%) |
| Disease at entry | |
| Progressive | 29 (74%) |
| Not progressive* | 10 (26%) |
9 of 10 patients not in progression at study entry had high tumor burden with sum of RECIST target lesion diameters greater than 15 cm at baseline. Mean of sum of RECIST target lesion diameters among patient not in progression was 27 cm (SD 21).
Pre- and post-treatment pCT confirmed our previous finding that the absolute decrease in tumor BF correlated with baseline BF (Figure 1) and further that there was correlation between baseline BF and BV, MTT (inverse correlation), and PS (Figure 1).
Figure 1. Baseline pCT measurements.

Each point represents one measured lesion. Among 36 patients, 72 lesions were measured at baseline and paired measurements were available for 65 lesions at week-9. A. Absolute decrease in tumor blood flow (BF) at week 9 correlated with baseline BF for 36 patients (65 lesions) with paired measurements at both time-points (R2 =.71; P<.0001). B. Correlation between baseline (36 patients with 72 lesions) BF and blood volume (BV) (R2 =.63; P<.0001). C. Inverse correlation between (36 patients with 72 lesions) baseline BF and mean transit time (MTT) (R2 =.38; P<.0001). D. Correlation between baseline (36 patients with 72 lesions) BF and permeability surface (PS) (R2 =.29; P<.0001).
Analyses of primary endpoints: Effects of bevacizumab and everolimus on BF
For the primary analyses, among patients receiving bevacizumab first (Figure 2), single agent bevacizumab was associated with a 44% decrease in BF at week-3 (P<0.0001). A further 29% decrease (P=0.02) was observed after receiving the combination of bevacizumab and everolimus at week-9.
Figure 2. Change in pCT parameters after treatment.
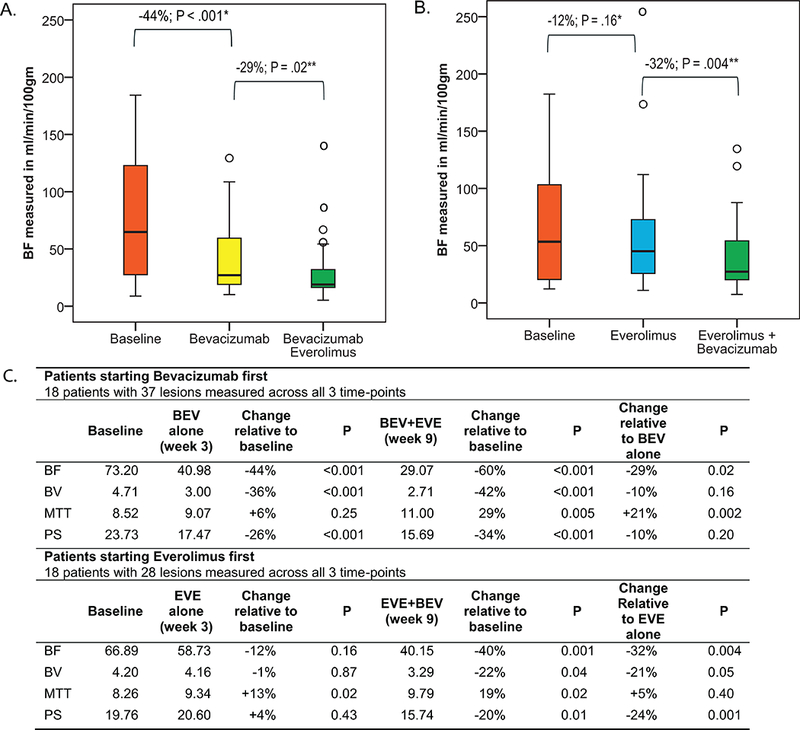
A. Bevacizumab alone was associated with −44% (week-3) change in mean blood flow (BF) (P<.0001). Addition of everolimus led to −29% (week-9) change in mean BF relative to single agent bevacizumab (P=.02) for a net −60% change relative to baseline (P<.0001). B. Single agent everolimus was associated with −12% (week-3) change in mean BF (P=.16). Addition of bevacizumab led to a −32% (week-9) in BF relative to single everolimus for a net −40% change relative to baseline (P=.004). C. Changes in mean blood volume (BV), mean transit time (MTT), and permeability surface (PS). Comparison made using Paired sample T-test. BF in ml/min/100gm, BV in ml/100gm, MTT in seconds, PS in ml/min/100gm.
BEV = Bevacizumab; EVE = everolimus
* Change relative to baseline
** Change relative to single
o Outliers
Among patients receiving everolimus first (Figure 2), single agent everolimus was associated with a 12% decrease in BF (P=0.16). The combination of everolimus and bevacizumab was associated with a further 32% decrease at week-9 compared to everolimus alone (P=0.004).
Exploratory analyses: Effect of bevacizumab and everolimus on BV, MTT, and PS
Effects of treatment on BV, MTT, and PS were also evaluated as exploratory endpoints (Figure 2). Bevacizumab treatment was associated with significant decrease in BV (P<0.0001), and PS (P<0.0001) but with no significant change in MTT (P=0.25). Everolimus treatment was associated with an increase in MTT (P=0.02) but not with changes in BV (P=0.87), or PS (P=0.43).
Clinical efficacy
Using intent-to-treat analysis, among 39 patients, there were 8 (21%) confirmed partial responses (PR), 2 (5%) unconfirmed PR, 27 (69%) stable disease (SD), 1 (3%) progressive disease (PD) and 1 (3%) unknown. A waterfall plot of best response to better characterize antitumor activity showed that the majority of patients had some degree of tumor reduction (Figure 3). At the time of this analysis, 26 patients have progressed. Median PFS was 14.6 (95% CI, 13.0 – 16.1) months (Figure 3). Twenty patients have died. Median OS was 27.9 (95% CI 19.9 – 35.9) months (Figure 3).
Figure 3. Clinical efficacy.
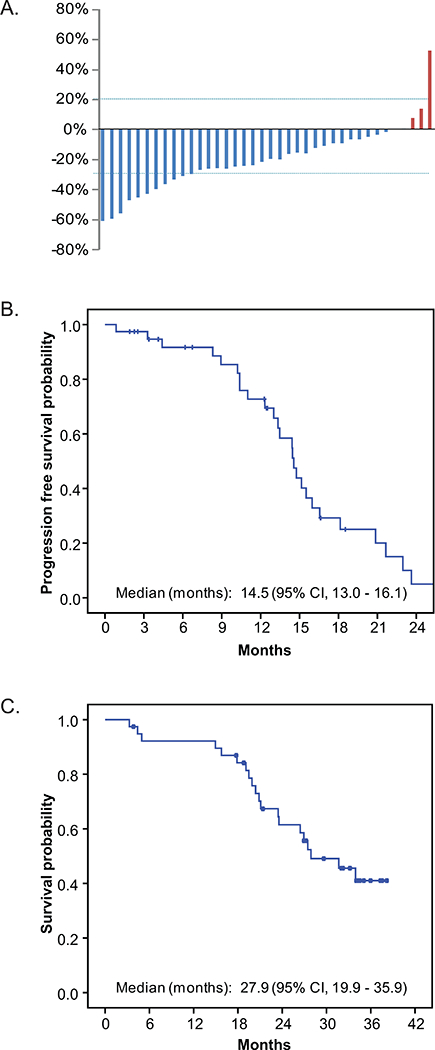
A. Waterfall plot of best response. B. Kaplan Meier plot of PFS. C. Kaplan Meier plot of OS.
Safety
Safety was monitored by patient diary, periodic physical examination and laboratory measurements. Most adverse events (AEs) were mild to moderate in severity and compatible with the known safety profiles of bevacizumab and everolimus (Table 2). Common adverse events included epistaxis (63%), fatigue (61%), mucositis (61%), infection (56%), hypertension (51%), and hypertriglyceridemia (51%). Grade 3/4 adverse events greater than 10% in frequency included neutropenia (15%), and proteinuria (12%).
Table 2.
Adverse events according to CTCAE version 3.0.
| Adverse Event | Any | G1 | G2 | G3 | G4 |
|---|---|---|---|---|---|
| Laboratory events | |||||
| ALT elevation | 12% | 2% | 5% | 5% | |
| Anemia | 32% | 12% | 15% | 5% | |
| AST elevation | 15% | 2% | 5% | 7% | |
| Hyperglycemia | 44% | 15% | 20% | 10% | |
| Hypertriglyceridemia | 51% | 34% | 15% | 2% | |
| Hypomagnesemia | 15% | 15% | |||
| Hypophosphatemia | 15% | 5% | 7% | 2% | |
| Neutropenia | 17% | 2% | 12% | 2% | |
| Proteinuria | 44% | 17% | 15% | 12% | |
| Thrombocytopenia | 20% | 7% | 7% | 5% | |
| Non-laboratory events | |||||
| Anorexia | 37% | 22% | 12% | 2% | |
| Cough | 17% | 17% | |||
| Diarrhea | 49% | 34% | 15% | ||
| Dizziness | 17% | 17% | |||
| Dysgeusia | 12% | 10% | 2% | ||
| Dyspnea | 24% | 22% | 2% | ||
| Edema | 46% | 39% | 5% | 2% | |
| Epistaxis | 63% | 61% | 2% | ||
| Fatigue | 61% | 37% | 17% | 7% | |
| Fever | 22% | 17% | 5% | ||
| Flatulence | 12% | 12% | |||
| Headache | 29% | 24% | 5% | ||
| Hypertension | 51% | 22% | 29% | ||
| Infection | 56% | 17% | 32% | 7% | |
| Insomnia | 15% | 12% | 2% | ||
| Mucositis/aphthous ulcer | 61% | 51% | 7% | 2% | |
| Nail change | 22% | 22% | |||
| Nausea | 44% | 34% | 5% | 5% | |
| Peripheral neuropathy | 17% | 17% | |||
| Skin rash | 15% | 12% | 2% | ||
| Vomiting | 27% | 20% | 2% | 5% | |
| Weight loss | 44% | 27% | 12% | 5% |
Bevacizumab was interrupted or discontinued in 8 patients. Proteinuria (4), increased transaminase (1), anal fissure (1), elective surgery (1), and epistaxis (1) were reasons for treatment interruption. Ten patients had adverse events requiring dose reduction of everolimus. Reasons for dose reduction include neutropenia (2), infection (2), thrombocytopenia (2), hyperglycemia (1), pneumonitis (1), stomatitis (1), and weight loss (1).
Exploratory analyses: Correlation of pCT findings with clinical efficacy
Baseline and post-treatment changes in pCT parameters were correlated with best relative change in sum of RECIST target lesion diameters. Among baseline parameters, correlation was observed between PS measurements and response as continuous parameter. Those with higher baseline PS had greater percentage reduction in tumor measurement (P=.009; Figure 4). No significant correlation between baseline BF, BV, and MTT with tumor response was observed.
Figure 4. Correlation of pCT findings with resp onse as represented by best change in sum of target lesion diameters.
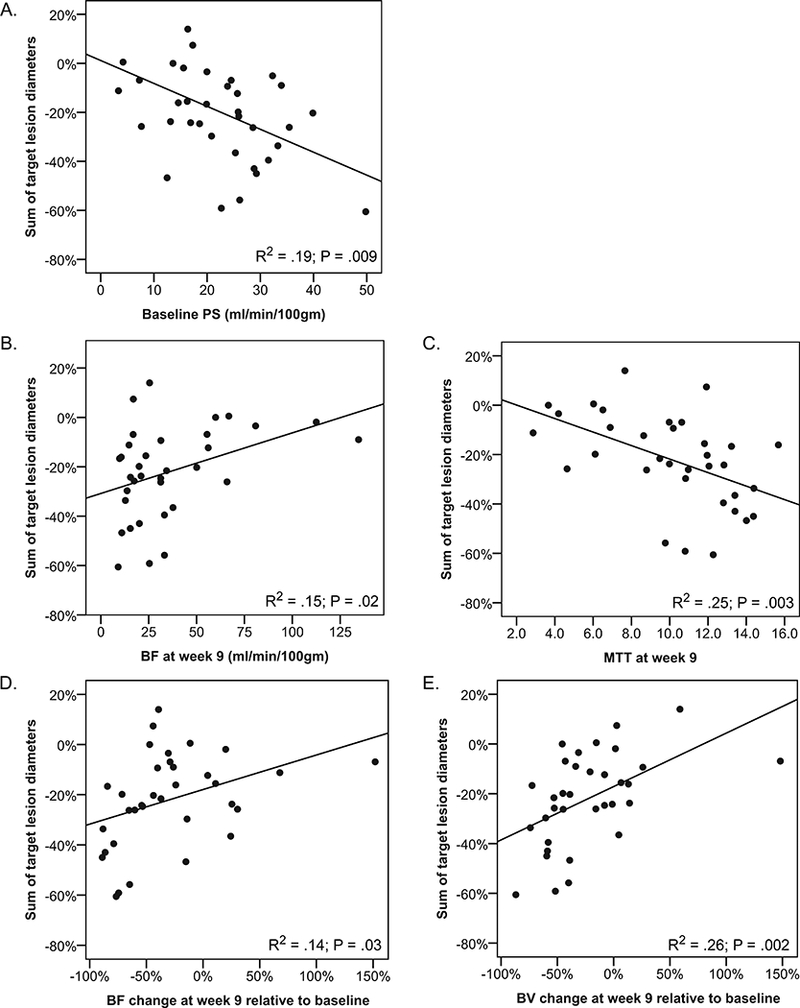
Each point represents one patient. P values are from Pearson correlation statistics. A. Baseline PS among 38 patients with baseline measurements. B. Post-treatment blood flow (BF) at week-9 among 36 patients with post-treatment measurements. C. Post-treatment mean transit time (MTT) at week-9 among 36 patients with post-treatment measurements.. D. Relative change in BF at week-9 among 36 patients with paired measurements. E. Relative change in blood volume (BV) at week-9 among 36 patients with paired measurements.
Post-treatment (week 9) measurement of BF and MTT also correlated with study outcomes. A lower post-treatment BF (P=0.02; Figure 4) or a higher post-treatment MTT (P=0.003; Figure 4) was associated with greater percentage reduction in sum of RECIST tumor measurements. Significant correlations between post-treatment BV and PS with tumor measurements were not observed.
When relative changes in pCT parameters (week 9) were correlated with outcome, percent decreases in BF (P=0.03; Figure 4) and BV (P=0.002; Figure 4) correlated with decreases in sum of RECIST tumor measurements.
No significant correlation between pCT parameters and PFS was observed.
Discussion
With 112 pCTs performed among 39 patients, the current study is the largest to assess the effect of a specific anti-angiogenic regimen in a homogenous patient population using dynamic tumor perfusion imaging. The study demonstrated a number of findings relevant to our understanding about the mechanism of agents targeting angiogenesis. First, we confirmed our earlier finding that the absolute decrease in tumor BF following bevacizumab and everolimus correlated with baseline BF and that such therapy produced a proportional decrease in tumor BF. This observation allowed us to design a study to assess and compare the effect of anti-angiogenic strategies on blood flow parameters.
In the current study, we demonstrated that bevacizumab decreased tumor BF. Single agent everolimus therapy was not associated with a significant change in tumor BF. The addition of everolimus among patients receiving bevacizumab was associated with a further 29% decrease in tumor BF at week-9. It can be argued that the current study does not allow us to know whether the further decrease was due to addition of everolimus or longer exposure to bevacizumab. However, in our prior study, there was no evidence of further decrease in BF after additional therapy beyond cycle one with bevacizumab.7, 12 Taken together, these suggest the further decrease observed is likely due to the addition of everolimus.
Bevacizumab therapy was associated with significant reductions in BF, BV, and PS. MTT was inversely correlated with BF at baseline. However, bevacizumab did not affect MTT. These findings are similar to observations in a study of pCT among renal cell carcinoma patients treated with VEGF tyrosine kinase inhibitors sunitinib or sorafenib.18
Preclinical data suggest that everolimus exerts antiangiogenic effect through mechanisms different from VEGF inhibitors.15 For example, in animal models, VEGF inhibitor decreased volume transfer coefficient (Ktrans), measured using quantitative T1-weighted dynamic contrast-enhanced MRI, and an marker of BF and PS. In contrast, everolimus reduced Tie-2 (an receptor of angiopietin), the amount of vessels, and tumor VEGF without affecting Ktrans.15 In the recently completed large randomized phase III study of everolimus in pancreatic NETs, everolimus therapy was associated with significant decreases in blood soluble VEGF receptor 2 and placental growth factor but no changes in VEGF.19 In the current study, everolimus did not result in significant changes in mean BF, BV or PS; everolimus was associated with a significant increase in MTT. How MTT relates to underlying tumor physiology is poorly understood and may warrant further investigation in future laboratory studies.
Since the initial report that a greater reduction in Ktrans, measured by dynamic contrast enhanced-magnetic resonance imaging, was associated with disease stabilization in phase I studies of VEGF tyrosine kinase inhibitor, PTK/ZK,20 many have attempted to correlate dynamic perfusion imaging findings with clinical outcome with varying degrees of success.7, 18, 21–23 One limitation of many past studies, including our prior study,7 is that dynamic imaging was optional and not uniformly performed among all patients limiting statistical power and raising the issue of potential selection bias. Other retrospective studies have included heterogenous groups of patients treated with different VEGF inhibitors. Nonetheless, many of these studies have suggested that dynamic imaging has potential to select patients likely to benefit from anti-angiogenic therapy.
In the current study, pre-treatment PS, percent reduction in BF, BV, and post-treatment MTT correlated with RECIST response. The high number of parameters correlating with outcome is likely related to the high degree of correlation between these parameters. Of particular interest is the correlation between pre-treatment PS and tumor response rate. This raises the possibility that one might be able to select patients likely to benefit from anti-angiogenic therapy based on one pre-treatment scan. The significant correlation between percent reduction in BF and BV with percent reduction in tumor measurement also suggests that anti-tumor activity is related to effects on the vasculature. This also points to the potential for even greater activity through the development of novel combinations or more efficient inhibitors of angiogenesis that exert greater effects on tumor blood flow.
There are several potential reasons why we did not see an association with perfusion parameters and PFS. First, the relatively small number of PFS events (22) meant that such analyses would have been severely underpowered. Second, without a control group, we could not separate the prognostic and predictive effect of these markers on PFS. For example, in a study of WDNETs, investigators found that high VEGF expression was associated with greater vascularity, aggressive behavior and shorter PFS.24 If antiangiogenic therapy had greater benefit for patients with more vascular tumors and worse prognosis, our analyses for prognostic and predictive effect on PFS would have been confounded. On the other hand, correlating biomarkers with reduction in tumor size requires only that spontaneous regression is not a part of the natural history of WDNETs.
In this study, we also tested the concept of correlating biomarkers with best response as a continuous parameter. As with many molecularly targeted agents, anti-angiogenic strategies are often associated with a low response rate, as assessed by current RECIST criteria, but may still have significant PFS and OS benefits when tested in larger phase III studies. A comparison of response rates in early biomarker development does not take advantage of all available information in what are invariably small studies. The significant P value observed in the continuous Pearson correlation demonstrated that there is a greater ability to detect useful biomarkers in smaller studies of therapies in early development using response as a continuous parameter.
It is recognized that “smaller and smarter trials” are needed to speed oncology drug development.25 Our data suggest pCT is a sensitive tool that can be leveraged for the rational development of anti-angiogenic strategies. For example, in early development, pCT could be used to assess effect of dose escalation, dosing interval on tumor perfusion, and aid in the development of novel combinations. pCT allows a more direct assessment of these issues in smaller proof-of-concept studies before larger randomized pivotal studies.
Our finding that pretreatment measurements and treatment associated changes in pCT parameters are associated with response also shows pCT to be promising for the selection of patients likely to respond when given antiangiogenic agents. However, these are secondary endpoints in the current study, and results should be considered hypothesis generating. A prospective study to confirm these findings is under development. In addition, measurement of pCT parameters remains highly manual and time-intensive at the current time. Improvements in software automation are needed for broader clinical use.
Finally, the combination of bevacizumab and everolimus was well tolerated and associated with evidence of clinical activity. Further development of this combination in pancreatic NETs is underway in a randomized phase II study sponsored by Cancer and Leukemia Group B (CALGB-80701).
Acknowledgments
Supported in part by Novartis Oncology and Genentech.
Research grants:: James C. Yao, Novartis (to institution); Alexandria T. Phan, Novartis (to institution); Chaan Ng, General Electric (to institution).
Footnotes
Conflict of interest statements:
Consultancy: James C. Yao, Novartis (paid)
Speaking fees: Alexandria T. Phan, Novartis
Clinical Trial Registration Number: ClinicalTrials.gov number, NCT00607113
References
- 1.Llovet JM, Ricci S, Mazzaferro V, et al. Sorafenib in advanced hepatocellular carcinoma. N Engl J Med. 2008; 359: 378–90. [DOI] [PubMed] [Google Scholar]
- 2.Hudes G, Carducci M, Tomczak P, et al. Temsirolimus, interferon alfa, or both for advanced renal-cell carcinoma. N Engl J Med. 2007; 356: 2271–81. [DOI] [PubMed] [Google Scholar]
- 3.Motzer RJ, Escudier B, Oudard S, et al. Efficacy of everolimus in advanced renal cell carcinoma: a double-blind, randomised, placebo-controlled phase III trial. Lancet. 2008; 372: 449–56. [DOI] [PubMed] [Google Scholar]
- 4.Yao JC, Hassan M, Phan A, et al. One hundred years after “carcinoid”: epidemiology of and prognostic factors for neuroendocrine tumors in 35,825 cases in the United States. J Clin Oncol. 2008; 26: 3063–72. [DOI] [PubMed] [Google Scholar]
- 5.Terris B, Scoazec JY, Rubbia L, et al. Expression of vascular endothelial growth factor in digestive neuroendocrine tumours. Histopathology. 1998; 32: 133–8. [DOI] [PubMed] [Google Scholar]
- 6.Ambs S, Bennett WP, Merriam WG, et al. Vascular endothelial growth factor and nitric oxide synthase expression in human lung cancer and the relation to p53. Br J Cancer. 1998; 78: 233–9. [DOI] [PMC free article] [PubMed] [Google Scholar]
- 7.Yao JC, Phan A, Hoff PM, et al. Targeting vascular endothelial growth factor in advanced carcinoid tumor: a random assignment phase II study of depot octreotide with bevacizumab and pegylated interferon alpha-2b. J Clin Oncol. 2008; 26: 1316–23. [DOI] [PubMed] [Google Scholar]
- 8.Kulke MH, Lenz HJ, Meropol NJ, et al. Activity of sunitinib in patients with advanced neuroendocrine tumors. J Clin Oncol. 2008; 26: 3403–10. [DOI] [PubMed] [Google Scholar]
- 9.Raymond E, Dahan L, Raoul JL, et al. Sunitinib malate for the treatment of pancreatic neuroendocrine tumors. N Engl J Med. 2011; 364: 501–13. [DOI] [PubMed] [Google Scholar]
- 10.Hobday TJ, Rubin J, Holen K, et al. MC044h, a phase II trial of sorafenib in patients (pts) with metastatic neuroendocrine tumors (NET): A Phase II Consortium (P2C) study. J Clin Oncol. 2007; 25: abstr 4504. [Google Scholar]
- 11.Phan AT, Yao JC, Fogelman DR, et al. A prospective, multi-institutional phase II study of GW786034 (pazopanib) and depot octreotide (sandostatin LAR) in advanced low-grade neuroendocrine carcinoma (LGNEC). J Clin Oncol. 2010; 28: abstr 4001. [Google Scholar]
- 12.Ng CS, Charnsangavej C, Wei W, et al. Perfusion CT Findings in Patients With Metastatic Carcinoid Tumors Undergoing Bevacizumab and Interferon Therapy. AJR Am J Roentgenol. 2011; 196: 569–76. [DOI] [PubMed] [Google Scholar]
- 13.Yao JC, Shah MH, Ito T, et al. Everolimus for advanced pancreatic neuroendocrine tumors. N Engl J Med. 2011; 364: 514–23. [DOI] [PMC free article] [PubMed] [Google Scholar]
- 14.Pavel M, Hainsworth JD, Baudin E, et al. A randomized, double-blind, placebo-controlled, multicenter phase III trial of everolimus + octreotide LAR vs. placebo + octreotide LAR in patients with advanced neuroendocrine tumors (NET) (RADIANT-2). Ann Oncol. 2010; 21: viii4. [DOI] [PMC free article] [PubMed] [Google Scholar]
- 15.Lane HA, Wood JM, McSheehy PM, et al. mTOR inhibitor RAD001 (everolimus) has antiangiogenic/vascular properties distinct from a VEGFR tyrosine kinase inhibitor. Clin Cancer Res. 2009; 15: 1612–22. [DOI] [PubMed] [Google Scholar]
- 16.Therasse P, Arbuck SG, Eisenhauer EA, et al. New guidelines to evaluate the response to treatment in solid tumors. European Organization for Research and Treatment of Cancer, National Cancer Institute of the United States, National Cancer Institute of Canada. J Natl Cancer Inst. 2000; 92: 205–16. [DOI] [PubMed] [Google Scholar]
- 17.Lee TY. Functional CT: physiological models. Trends in Biotechnol. 2002; 20: S3–10. [Google Scholar]
- 18.Fournier LS, Oudard S, Thiam R, et al. Metastatic renal carcinoma: evaluation of antiangiogenic therapy with dynamic contrast-enhanced CT. Radiology. 256: 511–8. [DOI] [PubMed] [Google Scholar]
- 19.Yao JC, Tsuchihashi Z, Panneerselvam A, et al. Effect of Everolimus Treatment on Markers of Angiogenesis in Patients With Advanced Pancreatic Neuroendocrine Tumours (pNET) – Results From the Phase III RADIANT-3 Study. Eur J Cancer. 2011; 47: S463. [Google Scholar]
- 20.Morgan B, Thomas AL, Drevs J, et al. Dynamic contrast-enhanced magnetic resonance imaging as a biomarker for the pharmacological response of PTK787/ZK 222584, an inhibitor of the vascular endothelial growth factor receptor tyrosine kinases, in patients with advanced colorectal cancer and liver metastases: results from two phase I studies. J Clin Oncol. 2003; 21: 3955–64. [DOI] [PubMed] [Google Scholar]
- 21.Lind JS, Meijerink MR, Dingemans AM, et al. Dynamic contrast-enhanced CT in patients treated with sorafenib and erlotinib for non-small cell lung cancer: a new method of monitoring treatment? Eur Radiol. 20: 2890–8. [DOI] [PMC free article] [PubMed] [Google Scholar]
- 22.Hahn OM, Yang C, Medved M, et al. Dynamic contrast-enhanced magnetic resonance imaging pharmacodynamic biomarker study of sorafenib in metastatic renal carcinoma. J Clin Oncol. 2008; 26: 4572–8. [DOI] [PMC free article] [PubMed] [Google Scholar]
- 23.Baar J, Silverman P, Lyons J, et al. A vasculature-targeting regimen of preoperative docetaxel with or without bevacizumab for locally advanced breast cancer: impact on angiogenic biomarkers. Clin Cancer Res. 2009; 15: 3583–90. [DOI] [PMC free article] [PubMed] [Google Scholar]
- 24.Zhang J, Jia Z, Li Q, et al. Elevated expression of vascular endothelial growth factor correlates with increased angiogenesis and decreased progression-free survival among patients with low-grade neuroendocrine tumors. Cancer. 2007; 109: 1478–86. [DOI] [PubMed] [Google Scholar]
- 25.Ellis LM, Bernstein DS, Voest EE, et al. American society of clinical oncology perspective: raising the bar for clinical trials by defining clinically meaningful outcomes. J Clin Oncol. 2014; 32: 1277–80. [DOI] [PubMed] [Google Scholar]