

Abstract
Background & Aims
Intestinal microbiota modulate metabolism and associate closely with epithelial cells in the intestine. In intestinal epithelial cells (IECs), histone deacetylase 3 (HDAC3) integrates microbiota-derived signals to control intestinal homeostasis. We investigated whether HDAC3 in IECs regulates metabolism and the development of obesity in mice.
Methods
Adult C57BL/6 (control) mice and mice with constitutive or inducible IEC-specific disruption of Hdac3 (HDAC3ΔIEC mice) were placed on a standard chow or high-fat diet (HFD, 60% kcal from fat). We measured body composition, weight, glucose tolerance, and energy expenditure. IECs were isolated from small intestine and gene expression and lipid levels were analyzed. HDAC3 levels were determined in 43 pediatric patient ileal biopsies and compared with body weight.
Results
Control mice fed a HFD gained weight, became obese, and had reduced glucose tolerance with increased serum insulin, whereas HFD-fed HDAC3ΔIEC mice did not develop obesity. Serum levels of triglycerides were reduced in HDAC3ΔIEC mice and these mice had less liver fat and smaller adipocytes, compared with HFD-fed control mice. HDAC3ΔIEC mice had similar food intake and activity as control mice, but higher energy expenditure due to increased catabolism. IECs from HDAC3ΔIEC mice had altered expression levels of genes that regulate metabolism in response to the microbiota (such as Chka, Mttp, Apoa1, and Pck1) and accumulated triglycerides, compared with IECs from control mice. The microbiota-derived short chain fatty acid, butyrate, was decreased in obese mice. Butyrate significantly reduced the activity of HDAC3 and increased Pck1 expression in only control IECs. Administration of butyrate to control mice with diet-induced obesity, but not HDAC3ΔIEC mice, led to significant weight loss. Disruption of HDAC3 in IECs of mice after they became obese led to weight loss and improved metabolic profile. Levels of HDAC3 in intestinal biopsy samples correlated with patient weight.
Conclusions
We found epithelial HDAC3 promotes development of diet-induced obesity in studies of mice, and butyrate reduces activity of HDAC3 in IECs to prevent diet-induced obesity. This pathway might be manipulated to prevent or reduce obesity-associated disease.
Keywords: mouse model, overweight, gene regulation, epigenetics
INTRODUCTION
Obesity is a global pandemic associated with an increased risk for developing respiratory and cardiovascular disease, type 2 diabetes and cancer1, 2. The pathophysiology of obesity and obesity-associated diseases reflect alterations in the central nervous system and peripheral tissues such as liver, adipose, and muscle. However, recent studies have also revealed that the intestinal microbiota play a significant role in modulating metabolic homeostasis and driving obesity3-5. Reconstitution of germ-free mice with commensal microbes increased body fat, leptin, insulin resistance, and metabolic rate, indicating that the gut microbiota regulate host metabolism6. Further, specific commensal bacterial compositions, such as those characterized by low Bacteroidetes and high Firmicutes, have been associated with obesity and more effective energy harvest7, 8. Probiotics, prebiotics, and fecal microbiota transplant represent therapeutic strategies that have been proposed for promoting an anti-obesity intestinal environment9-11, however deciphering the host pathways that enable microbiota-dependent regulation of metabolic homeostasis is needed to direct effective approaches.
The mammalian intestinal tract represents an initial site of exposure to the microbiota, highlighting that mechanisms in the intestine may underlie how microbial cues regulate metabolic homeostasis and development of obesity. Epigenetic modifications regulate gene expression in response to environmental cues, and recent epigenome-wide studies have identified strong ties between epigenetic modifications and obesity in human cohorts12, 13. In addition, microbiota-derived metabolites such as short chain fatty acids (SCFAs) inhibit epigenetic-modifying enzymes called histone deacetylases (HDACs)14-18. These findings provoke the hypothesis that epigenetic-dependent pathways in the intestine may integrate microbiota-derived cues to modulate local and/or systemic metabolic homeostasis, however the cellular and molecular mechanisms that mediate this regulation are not known.
Intestinal epithelial cells (IECs) line the lumen of the intestine and are critical for nutrient absorption, maintenance of barrier function, and production of immunomodulatory factors19-22. In recent work, we identified that a specific histone deacetylase, HDAC3, modulates histone acetylation in IECs and integrates microbiota-derived signals to regulate intestinal homeostasis23, 24. Interestingly, HDAC3 expression in the liver, muscle, and adipose is essential for healthy lipid homeostasis25-29, however, whether intestinal regulation by HDAC3 impacts metabolic homeostasis is not known. In this study, we aimed to test whether HDAC3 functions in IECs to mediate regulation of body weight by using mice that lack IEC-intrinsic HDAC3 expression. Further, we examined whether HDAC3-dependent metabolic alterations reflected impaired integration of signals from commensal microbes, such as SCFAs that can inhibit HDACs. In addition, we employed an inducible animal model to test whether directed disruption of HDAC3 specifically in adult mice was sufficient to impact metabolic homeostasis.
METHODS
Animals
HDAC3FF mice30 were bred to C57BL/6 mice expressing Cre-recombinase31 or tamoxifen-dependent Cre recombinase32 under the control of the villin promoter to generate HDAC3 IEC and HDAC3 IEC-IND mice, respectively23. Adult male and female control mice (HDAC3FF) and mice lacking IEC-intrinsic HDAC3 (HDAC3ΔIEC, or inducible HDAC3ΔIEC-IND) were gender and litter matched and maintained on either standard chow (Purina, 13% kcal from fat)) or high-fat diet (HFD) (60% kcal from fat). For induced deletion of HDAC3 in naïve mice, HDAC3FF and HDAC3ΔIEC-IND mice were fed diet containing 400mg/kg tamoxifen (Teklad). For induction in obese conditions, mice were induced by oral gavage (50 mg/kg tamoxifen, q 24h) or by a shorter course of 0.5 mg tamoxifen, intraperitoneal once every two days over 10 days with assessment 3-5 days after the final injection. Butyrate was administered via oral gavage (80 mg q 24h). Germ-free (GF) mice were maintained in plastic isolators in the CCHMC Gnotobiotic Mouse Facility, fed autoclaved feed and water, and monitored to ensure absence of microbes. Quantification of body fat and lean mass were assessed by Echo-MRI. Serum insulin was measured using an insulin ELISA kit (Alpco). For glucose tolerance tests, animals were fasted for 8-10h. Mice were injected intraperitoneally with glucose (2 g/kg), and blood glucose was measured using an Accu-chek glucometer. Mice were used at 10-12 weeks old, and housed up to 4 per cage in a ventilated cage system in a 12h light/dark cycle, with free access to water and food. All experiments were done according to the guidelines of the Institutional Animal Care and Use Committee.
Human analyses
Intestinal HDAC3 expression and body weight Z scores were compared using previously published RNA-seq data from pediatric control patients (n = 43) that were enrolled within the Crohn’s and Colitis Foundation sponsored RISK study33. Log transformed Transcript Per Million (TPM) values for HDAC3 expression in ileal biopsy samples were used for correlation analyses across weights.
Energy expenditure
Food intake, activity, and metabolic rates for individual mice were measured by indirect calorimetry using a 16-chamber, open-circuit Oxymax system at the Mouse Metabolic Phenotyping Center of the University of Cincinnati. Briefly, mice were individually housed in calorimeter chambers through which air with a known O2 concentration was passed at a constant flow rate. The system automatically withdrew gas samples from each chamber every 35 min for 24h and calculated the volumes of O2 consumed and CO2 generated by each mouse. Heat expenditures measured throughout the study were carried out in both light and dark cycles. Simultaneous measurements of food consumption and activity based on horizontal photobeam breaks were collected.
IEC harvest and RNA-sequencing
IECs were isolated from small intestine (12cm section including jejunum and ileum) by shaking the tissue in 1 mM EDTA/1 mM DTT. For explants, the small intestine was removed and divided longitudinally, washed and placed in complete media with vehicle (H2O) or butyrate (10mM) for 3h prior to IEC harvest. RNA was isolated using the RNeasy Kit (Qiagen). Directional polyA RNA-seq was performed by the Sequencing Core at the University of Cincinnati. NEBNext Poly(A) mRNA Magnetic Isolation Module was used for polyA RNA purification with the Apollo 324 system (WaferGen) and PrepX PolyA script. Individually indexed and compatible libraries were proportionally pooled for clustering in cBot system (Illumina). Libraries at the final concentration of 15 pM were clustered onto a single read flow cell using Illumina TruSeq SR Cluster kit v3, and sequenced to 50 bp using TruSeq SBS kit on Illumina HiSeq. Sequence reads were aligned by using Illumina sequence analysis pipeline by the Laboratory for Statistical Genomics and Systems Biology at the University of Cincinnati. DAVID pathway analysis was performed on significantly differentially expressed genes (FDR<0.1; fold change ≥1.5).
Real-time PCR, Western blotting, HDAC activity
RNA was isolated using the RNeasy Kit (Qiagen) then subjected to reverse transcription (Verso). ChIP was performed as described previously23, 30, 34 with few modifications. Briefly, cells were fixed in 1% PFA for 10 min and quenched with glycine. Total cell extracts were sonicated using a Covaris S220 Focused-ultrasonicator and nuclear extracts were immunoprecipitated with rabbit anti-H3K9Ac (Millipore). Real-time PCR was performed using SYBR (Applied Biosystems) and analyzed with a threshold in the linear range of amplification. For expression, samples were normalized to an unaffected control gene. ChIP-qPCR was analyzed as % of input and ALBUMIN was compared as a negative control for H3K9Ac. Motif enrichment at H3K9Ac enrichment sites within PCK1 (chr2:173152775-173153246) was determined using TRAP single sequence analysis software with matrices from TRANSFAC. For Western blot analyses, cells were lysed in a modified RIPA buffer. Blots were probed with anti-histone H3 (Santa Cruz) and anti-acetyl-histone H3 (Millipore) and imaged using an Odyssey Fc imager (LICOR). Band densitometry was measured with Image Studio software. For HDAC enzymatic quantification, IECs were lysed in RIPA and equal protein amounts were in incubated with HDAC substrate (Active Motif), followed by developer with trichostatin A to stop the reaction24. Fluorescence was measured using a fluorescent plate reader (Biotek Synergy 2).
Nuclear magnetic resonance-based short chain fatty acid quantification
Mouse fecal samples were lyophilized and 50 mg of dry sample was processed by homogenizing using Minilys (Berten tech). Samples were filtered using pre-washed 3 kDa spin filters (NANOSEP 3K, Pall Life Sciences) and resuspended in buffer containing 100 mM phosphate and 1.0 mM TMSP. One-dimensional 1H NMR spectra were acquired on a Bruker Avance II 600 MHz spectrometer. Upon Fourier transformation, each spectrum was manually phased, baseline corrected, and referenced to TMSP. Chemical shifts were assigned to metabolites based on reference database spectra and concentrations calculated using Chenomx software.
Lipid Assessment and Histology
Dietary fat uptake was measured by feeding diet containing 5% non-absorbable sucrose polybehenate esters ad libitum for 3 days, after which a fecal sample was collected and analyzed by gas chromatography. The ratio of total fatty acid methyl esters to the behenate methyl esters was used to calculate the percentage of fat uptake35. Lipid was extracted from IECs using an adapted Folch method. Triglyceride measurements were performed using kits from Fisher. Sections of intestine, liver, and epididymal white adipose were fixed in 10% formalin, paraffin embedded, and stained with hematoxylin and eosin. Oil Red O staining was performed on frozen sections fixed in 4% paraformaldehyde and sucrose protected. For comparison of histologic differences, three sections were blindly selected per sample from each mouse and quantified using ImageJ software.
Statistical Analyses
Results are expressed as mean ± s.e.m. Mice of the indicated genotypes were assigned at random to groups. Statistical significance was determined with the Student’s t-test, and two-way ANOVA where indicated for two independent variables. All data meet the assumptions of the statistical tests used. Results were considered significant at *p ≤ 0.05; **p ≤ 0.01; ***p ≤ 0.001. Spearman’s rank coefficient (r) and statistical significance were calculated using Prism version 7.0 (GraphPad Software).
RESULTS
Intestinal epithelial HDAC3 expression regulates development of diet-induced obesity
In order to examine the relationship between intestinal HDAC3 and body weight, HDAC3 expression in human small intestinal samples was evaluated relative to age-normalized patient weight Z score. Interestingly, HDAC3 expression in the human intestine positively correlated with patient weight (Figure 1A and B), suggesting that dysregulation by intestinal HDAC3 may lead to alterations in body weight. Thus, to test the role of intestinal HDAC3 on diet-induced weight gain, we compared control mice (HDAC3FF) to mice lacking HDAC3 specifically within intestinal epithelial cells (IECs) (HDAC3ΔIEC) (Figure 1C and Supplementary Figure 1A). Consistent with tissue specific loss of a histone deacetylase, IECs from HDAC3ΔIEC mice exhibited elevated acetylated histone H3 (Supplementary Figure 1B), whereas this difference was not observed in kidney, a tissue that can express low levels of villin mRNA (Supplementary Figure 1C). At steady state, normal chow-fed HDAC3ΔIEC mice exhibited minimal differences in weight or body composition (Figure 1D and E). During the same timeframe, high fat diet (HFD)-fed male control HDAC3FF mice exhibited marked weight gain, as expected (Figure 1F). However, age and gender-matched HDAC3ΔIEC mice did not develop HFD-induced obesity (Figure 1F) and exhibited significantly less obesity-associated adiposity (Figure 1G). Collectively, these data indicate that HDAC3 expression specifically in IECs mediates the development of diet-induced obesity and loss of HDAC3 expression in these cells confers prevention of HFD-dependent weight gain.
Figure 1. Intestinal epithelial HDAC3 expression regulates development of diet-induced obesity.
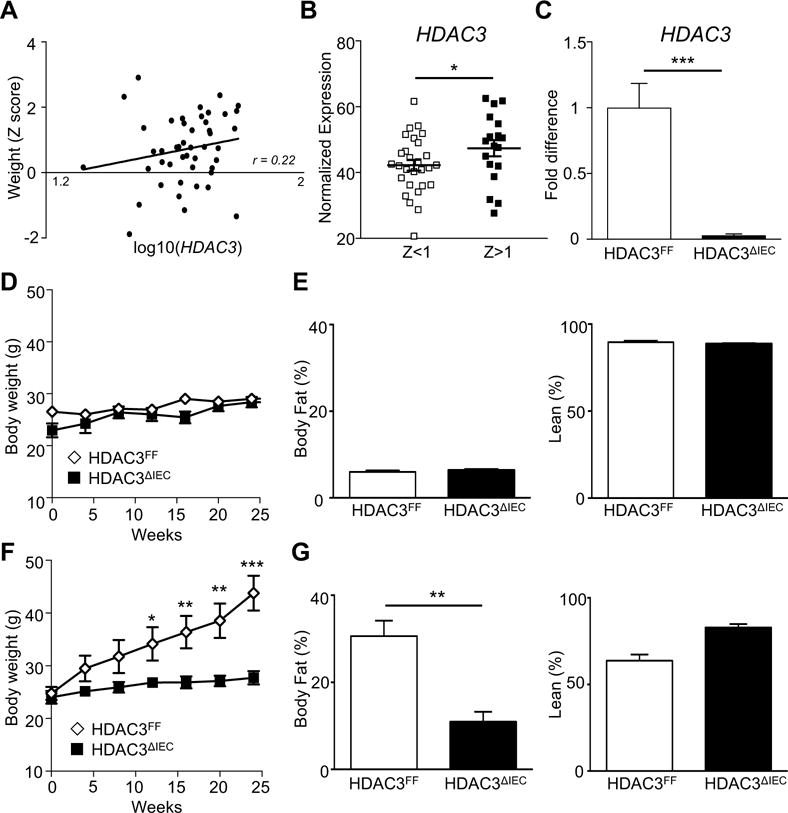
(A) Correlation between HDAC3 expression in the ileum and body weight Z-scores across 43 pediatric patients confirmed to lack intestinal inflammation by histology. (B) HDAC3 expression in patients from (A) based on body weight Z-score stratification. (C) HDAC3 expression in IECs from HDAC3FF or HDAC3 IEC mice by real-time PCR. (D-G) Male, age matched, C57BL/6 control (HDAC3FF) and HDAC3ΔIEC mice were fed (D, E) normal chow or a (F, G) high fat diet (HFD). (D, F) Body weight. (E, G) Body composition (% body fat and % lean tissue) quantified at 20 weeks. Data represent 4-8 mice per group. Results are shown as mean ± s.e.m. r: Spearman’s rank coefficient. *p<0.05, **p<0.01, ***p<0.001.
IEC-intrinsic deletion of HDAC3 improves obesity-associated glucose and lipid abnormalities
Obesity often presents with significant alterations in systemic glucose and lipid homeostasis. Consistently, obese HDAC3FF mice demonstrated impaired glucose tolerance (Figure 2A) and increased serum insulin relative to normal chow fed mice (Supplementary Figure 2A, Figure 2B). However, HFD-fed HDAC3ΔIEC mice exhibited improved glucose tolerance and insulin levels relative to control HDAC3FF mice (Figure 2A and B). Interestingly, female HDAC3ΔIEC mice also demonstrated markedly less HFD-induced obesity (Figure 2C and D) and obesity-triggered glucose dysregulation (Figure 2E), demonstrating that metabolic regulation by IEC-intrinsic HDAC3 occurs independent of gender. Serum triglycerides were decreased in HDAC3ΔIEC mice (Figure 2F), suggesting that loss of HDAC3 activity in IECs results in abnormal lipid absorption and/or decreased triglyceride storage. Comparable histology was observed in the liver and adipose of normal chow fed HDAC3FF and HDAC3ΔIEC mice (Supplementary Figure 2B and C). Under HFD conditions, as expected, control mice developed characteristic features of obesity-triggered hepatic lipidosis and enlarged, lipid-filled adipocytes (Figure 2G, Supplementary Figure 3A and B). In contrast, HFD-fed HDAC3ΔIEC mice exhibited significantly less fatty change in the liver and smaller adipocytes (Figure 2G, Supplementary Figure 3A and B), while intestinal length remained similar to HFD-fed control mice (Supplementary Figure 3C and D). Collectively, these data demonstrate that mice lacking IEC-intrinsic HDAC3 do not develop metabolic alterations associated with obesity.
Figure 2. IEC-intrinsic deletion of HDAC3 improves obesity-associated glucose and lipid abnormalities.
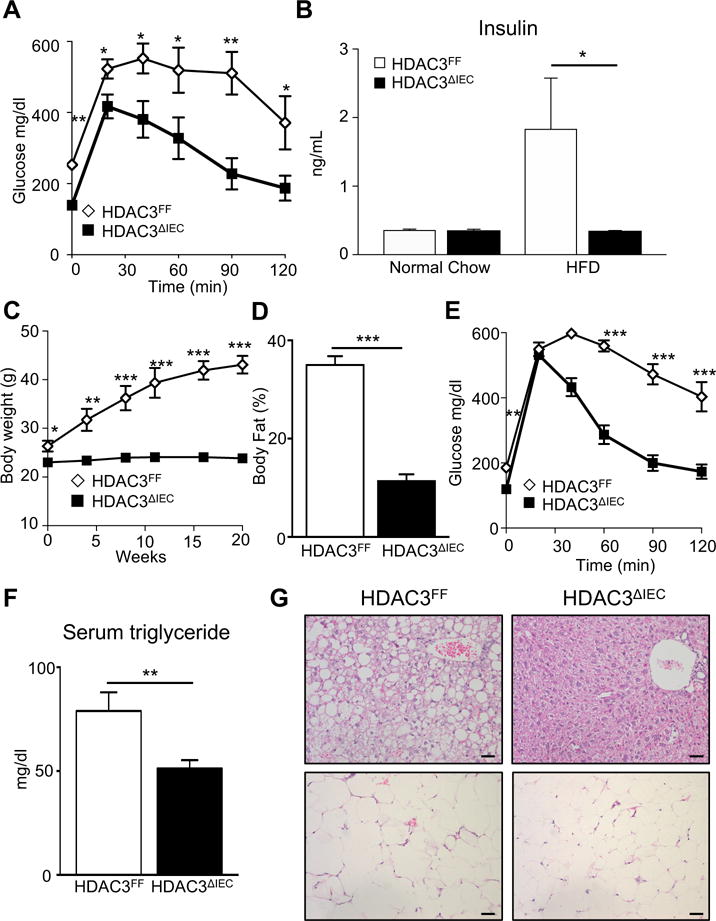
(A) Glucose tolerance test (GTT) and (B) serum insulin for HDAC3FF and HDAC3ΔIEC mice fed normal chow or HFD for 20 weeks. (C-E) Female, age matched, C57BL/6 control (HDAC3FF) and HDAC3ΔIEC mice fed HFD. (C) Body weight (D) % body fat and (E) GTT analyzed at 20 weeks HFD feeding. (F) Serum triglycerides and (G) H&E stained sections of liver (top) and adipose (bottom) in mice on HFD, scale bar 20μm. Data represent 4-8 mice per group. Results are shown as mean ± s.e.m. *p<0.05, **p<0.01, ***p<0.001.
HDAC3ΔIEC mice demonstrate increased energy expenditure
In order to understand the mechanisms underlying how HDAC3ΔIEC mice remain resistant to the development of diet-induced obesity, several metabolic parameters were compared by employing a comprehensive lab animal monitoring system. HFD-fed HDAC3ΔIEC mice housed individually in metabolic cages demonstrated significantly decreased body weight (Figure 3A). However, these mice exhibited similar daily food intake (Figure 3B) and no difference in physical activity during the light and dark cycles relative to controls (Figure 3C), indicating that their decreased weight did not result from increased activity or decreased feeding. Instead, indirect calorimetry showed that heat production was significantly increased in HFD-fed HDAC3ΔIEC mice compared to control HDAC3FF mice (Figure 3D). Correspondingly, HDAC3ΔIEC mice demonstrated elevated carbon dioxide production (VCO2) (Figure 3E) and oxygen consumption (VO2) (Figure 3F), particularly during the wakeful dark cycle (Figure 3D-F). Lean mass represents the major contributor of energy expenditure, but when values were normalized to lean mass, HDAC3 IEC mice still displayed significantly increased heat production (Supplementary Figure 3E) as well as VO2 and VCO2 (Supplementary Figure 3F). Thus, since differences were not observed in food intake and spontaneous physical activity, higher energy expenditure due to increased catabolism in HDAC3ΔIEC mice primarily facilitates resistance to adiposity and body weight gain.
Figure 3. HDAC3ΔIEC mice demonstrate increased energy expenditure.
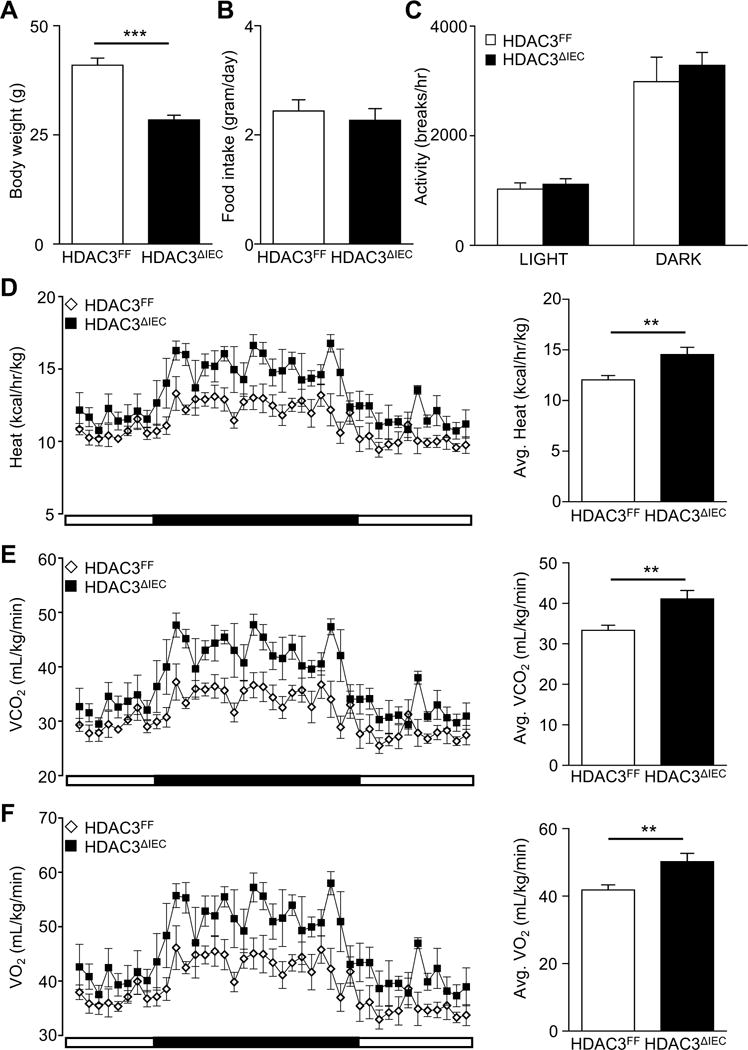
(A) Body weight of HDAC3FF and HDAC3ΔIEC male mice fed HFD for 16 weeks. (B) Food intake for individually housed mice in (A) measured over 24h in metabolic chambers. (C) Physical activity measured by photobeam breaks. (D) Heat generation (E) CO2 production and (F) O2 consumption. Data represent 4-6 mice per group. Results are shown as mean ± s.e.m. **p<0.01, ***p<0.001.
HDAC3 regulates expression of microbiota-dependent metabolic pathways in IECs
While the largest proportion of the intestinal microbiota resides in the colon, the small intestine also harbors large numbers of commensal microbes and represents the primary site for nutrient digestion and absorption. Consistent with a functional role for the microbiota in small intestine, genome-wide transcriptional profiling of IECs isolated from the jejunum and ileum of germ-free (GF) and conventionally (CNV)-housed mice demonstrated significant microbiota-dependent regulation of small intestinal IEC gene expression (Figure 4A). RNA-sequencing also uncovered that HDAC3 expression in IECs from the same location in the intestine mediates regulation of host gene expression (Figure 4B). Interestingly, functional annotation tools demonstrated that differentially expressed genes in both comparisons were enriched for lipid metabolism (Figure 4C), highlighting that metabolic dysregulation in the intestine of HDAC3ΔIEC mice may trigger systemic elevation in energy expenditure and resistance to weight gain. Pathway analyses suggested that the 120 overlapping genes represented multiple metabolic processes in IECs ranging from retinol and steroid metabolism to PPAR signaling and glycerophospholipid regulation (Supplementary Figure 4A), rather than a single regulatory mechanism. Consistent with RNA-seq data, expression of multiple genes within this subset (Choline kinase alpha (CHKA), Microsomal triglyceride transfer protein (MTTP), Apolipoprotein A1 (APOA1), Phosphoenolpyruvate Carboxykinase 1 (PCK1)) were confirmed in an independent cohort by real-time PCR analysis to be sensitive to the intestinal microbiota (Supplementary Figure 4B), and elevated in IECs harvested from the small intestine of microbiota-replete HDAC3ΔIEC mice (Figure 4D).
Figure 4. HDAC3 regulates expression of microbiota-dependent metabolic pathways in IECs.
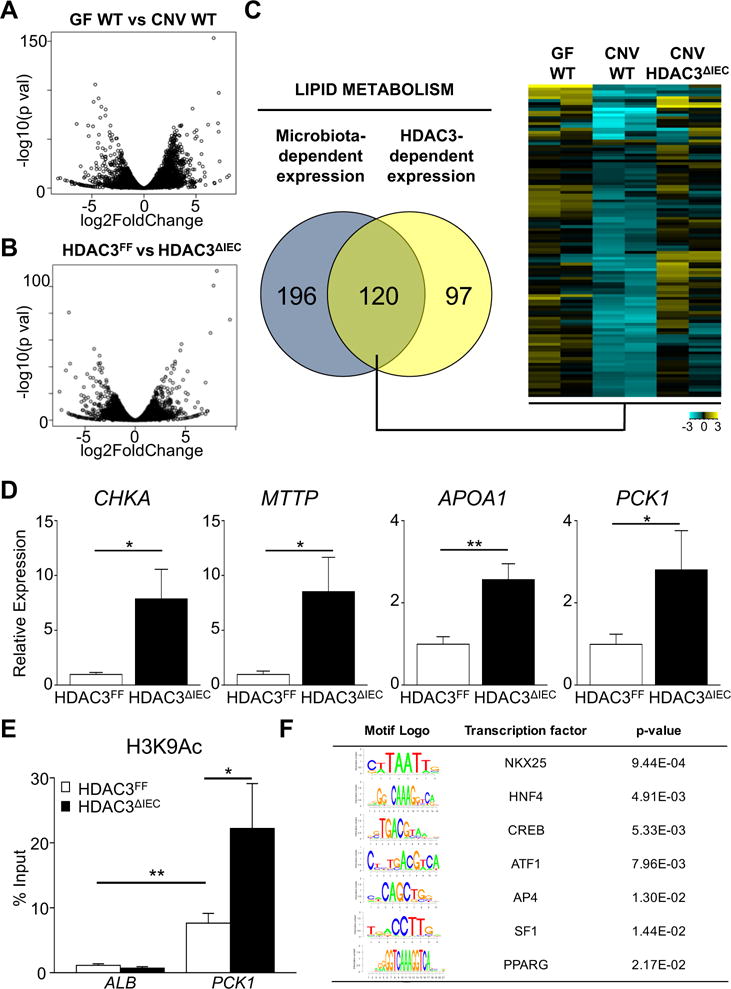
RNA-sequencing was performed on IECs isolated from mid-distal small intestine. Volcano plots of differential gene expression between (A) germ-free (GF) versus microbiota-replete conventionally-housed (CNV) mice and (B) HDAC3FF versus HDAC3ΔIEC mice, n=2 per group. (C) Venn analysis of genes enriched in lipid metabolism that are dependent on the microbiota and HDAC3. Heat-map of relative transcript abundance of overlapping genes. (D) mRNA expression by real-time PCR in IECs from the small intestine. (E) ChIP-qPCR comparing H3K9Ac levels at Phosphoenolpyruvate Carboxykinase 1 (PCK1) promoter in IECs (F) TRANSFAC identification of transcription factor binding motifs within hyperacetylated region of PCK1 promoter. Data represent 3-6 mice per group. Results are shown as mean ± s.e.m. *p<0.05, **p<0.01.
Expression of PCK1, a critical enzyme in gluconeogenesis and glyceroneogenesis in liver and adipose, respectively36, 37, was dependent on HDAC3 in IECs. Although the relative impact of PCK1 expression in IECs is not clear, this enzyme represents a central regulator of metabolic homeostasis. Thus, to determine whether deletion of HDAC3 was associated with epigenetic differences in PCK1, histone acetylation in primary IECs from HDAC3FF and HDAC3 IEC mice was compared utilizing chromatin immunoprecipitation (ChIP) for H3K9Ac, a histone mark that can be removed by HDAC3 at directly repressed target genes30. ChIP-qPCR analyses revealed that H3K9Ac was enriched in the promoter of PCK1 relative to a negative control gene, and that H3K9Ac levels at this site were elevated in HDAC3-deleted IECs (Figure 4E), consistent with control of histone acetylation by HDAC3. Further, in depth examination of this HDAC3-sensitive genomic region within the PCK1 gene revealed several distinct transcription factor binding motifs (Figure 4F), suggesting that altered gene expression in HDAC3 IEC mice reflects an integrated effect of multiple transcriptional regulators. Collectively, these analyses implicate a central role for HDAC3 in coordinating IEC expression of microbiota-sensitive genes that regulate metabolic homeostasis in the small intestine.
Butyrate decreases obesity in a HDAC3-dependent manner
Given that loss of IEC-intrinsic HDAC3 expression protects against obesity, inhibition of HDAC3 enzymatic activity may promote decreased weight and loss of HDAC3 inhibitors could stimulate weight gain. To first directly test whether the level of HDAC enyzmatic activity in IECs is impacted specifically by HDAC3, IECs from small intestine of HDAC3FF mice and HDAC3ΔIEC mice were compared using an assay that quantifies activity from multiple HDACs. As predicted, loss of HDAC3 expression significantly decreased global levels of HDAC enzymatic activity in the intestinal epithelium (Figure 5A), suggesting that its enzymatic activity may be actively regulated in IECs. Commensal bacteria ferment dietary products, leading to the production of SCFAs in the intestinal lumen that can be taken up by IECs. Some SCFAs, such as butyrate and proprionate, can inhibit HDAC activity in vitro14-17. Interestingly, metabolite analyses of intestinal contents demonstrated significantly reduced levels of both butyrate and proprionate in obese HFD-fed mice relative to normal chow fed mice (Figure 5B), provoking the hypothesis that SCFAs in lean mice may maintain healthy inhibition of IEC-intrinsic HDAC3 activity.
Figure 5. Butyrate decreases obesity in a HDAC3-dependent manner.
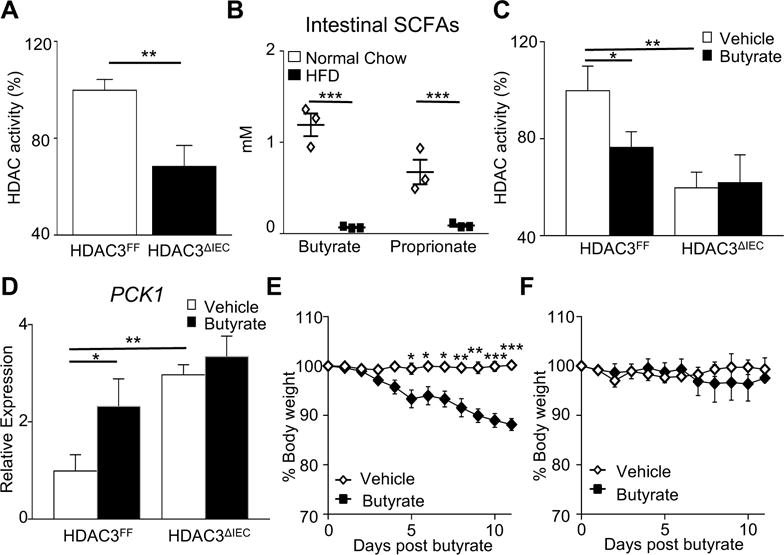
(A) HDAC activity in IECs from the small intestine of HDAC3FF and HDAC3ΔIEC mice. (B) Nuclear magnetic resonance identification of short chain fatty acids in intestinal contents. (C) HDAC activity and (D) PCK1 mRNA expression in IECs from small intestine explants following vehicle or butyrate treatment. (E, F) Changes in body weight following daily oral gavage with butyrate in (E) wildtype or (F) HDAC3ΔIEC mice fed HFD for 20 weeks prior and during butyrate exposure. Data represent 3-6 mice per group. Results are shown as mean ± s.e.m. *p<0.05, **p<0.01, ***p<0.001.
To directly test if butyrate regulates primary IECs, small intestinal explants were treated with butyrate prior to IEC isolation. Butyrate significantly decreased HDAC enzymatic activity (Figure 5C) and induced PCK1 expression (Figure 5D) in IECs. However, butyrate-dependent reduction in HDAC activity and derepression of PCK1 expression was lost in IECs that lacked HDAC3 (Figure 5C and D), highlighting that butyrate regulation of IECs is mediated largely by HDAC3. To test the impact of this mechanism in vivo, butyrate was administered to HFD-fed obese male and female mice. Remarkably, butyrate administration led to a significant reduction in weight (Figure 5E), however, this weight loss was dependent on HDAC3 as weight did not change in HFD-fed HDAC3ΔIEC mice with butyrate (Figure 5F). Taken together, these data indicate that butyrate promotes leanness by inhibiting IEC-intrinsic HDAC3 activity and suggests that loss of intestinal butyrate with HFD may relieve HDAC3 inhibition in IECs and promote weight gain.
HDAC3 in the intestine actively modulates lipid homeostasis
Within the small intestine, dietary lipids are absorbed, processed, and transported by IECs. The decrease in serum triglycerides in HDAC3ΔIEC indicated that HDAC3 may be necessary for dietary lipid uptake. However, lipid uptake quantification using a defined safflower lipid diet indicated that HDAC3ΔIEC mice were able to take up lipid from the diet similar to HDAC3FF control mice (Figure 6A). Instead, jejunal IECs from HFD-fed HDAC3ΔIEC mice contained increased lipid relative to HDAC3FF mice as demonstrated by Oil Red O staining (Figure 6B, Supplementary Figure 5A) and triglyceride quantification (Figure 6C), consistent with alterations in lipid processing and/or transport from IECs. Similarly, short exposure of intestinal explants to the HDAC3 inhibitor butyrate, also resulted in increased triglyceride levels in IECs (Supplementary Figure 5B), suggesting that HDAC3 in IECs may play a dynamic role in maintaining intestinal lipid homeostasis. Thus, to eliminate potential developmental effects of IEC-intrinsic HDAC3 depletion and examine active regulation, an inducible mouse model (HDAC3 IEC-IND) was employed in which significant HDAC3 deletion was triggered in mature IECs by dietary tamoxifen exposure for 21 days (Figure 6D and E). Interestingly, induced deletion of HDAC3 in IECs of adult mice yielded similar histological findings to HFD-fed HDAC3ΔIEC mice, characterized by accumulation of lipid in IECs and a lack of lipid observed in the lamina propia lymphatics (Figure 6F, Supplementary Figure 5C), demonstrating that HDAC3 in the intestine actively modulates lipid homeostasis.
Figure 6. HDAC3 in the intestine actively modulates lipid homeostasis.
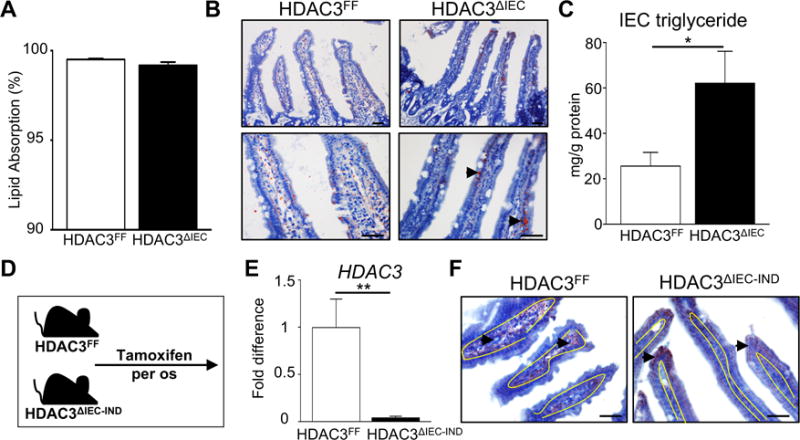
(A) Dietary fat uptake measured using non-absorbable sucrose polybehenate. (B) Oil Red O stained jejunal tissue from mice fed HFD. Arrowheads indicate Oil Red O stained lipid. (C) Triglyceride levels in IECs of HFD-fed mice. (D) Experimental plan in which HDAC3FF and HDAC3ΔIEC-IND mice were fed diet containing 400mg/kg tamoxifen over 30 days. (E) HDAC3 expression in IECs following tamoxifen. (F) Oil Red O stained jejunal tissue following tamoxifen-induced deletion of HDAC3 in adult mice. Yellow lines represent junction between epithelium and lamina propria. Scale bar 20μm. Data represent 4-6 mice per group. Results are shown as mean ± s.e.m. *p<0.05, **p<0.01, ***p<0.001.
Induced disruption of IEC-HDAC3 provides therapeutic effect in obese mice
In order to test how IEC-intrinsic HDAC3 functions following the development of obesity, the inducible mouse model was next employed in obese mice. Following establishment of diet-induced obesity, mice received tamoxifen via daily oral gavage while high fat diet was maintained (Figure 7A). Both groups initially lost weight due to non-specific effects of tamoxifen in obese mice. However, with prolonged tamoxifen-exposure, HDAC3 IEC-IND mice demonstrated increased weight loss relative to tamoxifen-exposed control mice (Figure 7B), revealing that disruption of IEC-intrinsic HDAC3 in obese adult mice results in improved body weight. In order to examine the metabolic profile of mice due to disruption in the IEC-intrinsic HDAC3 pathway prior to weight differences, obese HDAC3FF and HDAC3 IEC-IND mice were subjected to tamoxifen via intraperitoneal injection every other day for 10 days (Figure 7C). Prior to and following this shorter course of tamoxifen, HDAC3 IEC-IND mice maintained similar body weight to control HDAC3FF mice (Supplementary Figure 6A). However, despite comparable weight, induced loss of IEC-intrinsic HDAC3 expression in this context was sufficient to decrease serum triglycerides (Supplementary Figure 6B), reduce fasting glucose levels (Supplementary Figure 6C), and improve glucose tolerance (Figure 7D and E), suggesting that their improved glucose tolerance may not be entirely secondary to leanness. Collectively, these data indicate that HDAC3 in IECs of adult mice is critical for active regulation of metabolic homeostasis and that targeting intestinal HDAC3 in the context of obesity may initiate metabolic improvement and promote weight loss.
Figure 7. Induced disruption of IEC-HDAC3 provides therapeutic effect in obese mice.
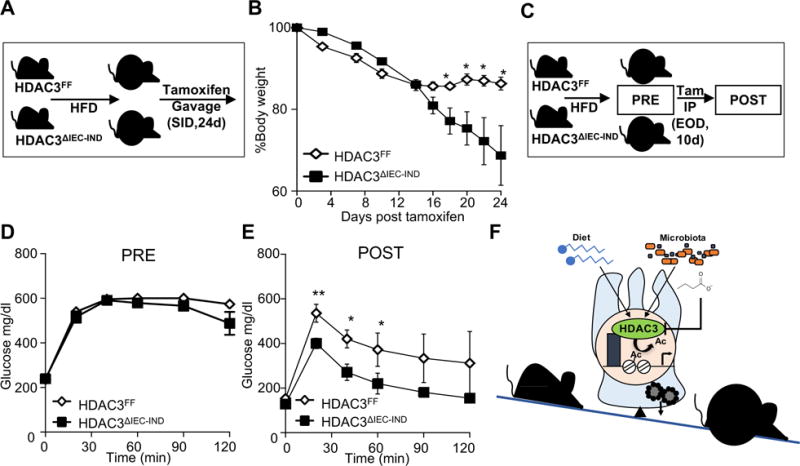
(A) Experimental plan in which mice were fed HFD for 20 weeks. Tamoxifen was then administered once daily by oral gavage while continuing HFD. (B) Changes in body weight following oral administration of tamoxifen to obese HDAC3FF and HDAC3ΔIEC-IND mice. (C) Experimental plan in which mice were fed HFD for 20 weeks and tamoxifen was administered intraperitoneally to obese HDAC3FF and HDAC3ΔIEC-IND mice over 10 days. (D, E) glucose tolerance in HFD-fed mice (D) pre- and (E) post-tamoxifen. (F) Intestinal epithelial HDAC3 differentially regulates the balance between intestinal and systemic metabolic homeostasis in response to signals from the diet and microbiota. Data represent 4-7 mice per group. Results are shown as mean ± s.e.m. *p<0.05, **p<0.01.
DISCUSSION
In this study, we identified that HDAC3 expression in the intestine critically impacts the development of diet-induced obesity. Small intestinal HDAC3 expression in pediatric patients positively correlated with body weight. Although this correlation was not particularly strong, we found that loss of HDAC3 in the intestinal epithelium of mice led to increased energy expenditure, decreased obesity, and improved glucose tolerance on high fat diet. Further, administration of butyrate, a microbiota-derived SCFA that inhibits HDAC3 activity, or inducible disruption of IEC-intrinsic HDAC3 improved metabolic profile and body weight in obese mice. These data support that HDAC3 represents a key enzyme that regulates how the intestinal epithelium integrates signals from microbiota to modulate metabolic homeostasis (Figure 7F).
HDAC3 deletion resulted in abnormal triglyceride accumulation in IECs with a concurrent increase in energy expenditure, decrease in serum triglycerides, body fat, and weight gain. Interestingly, this increased triglyceride level in IECs paralleled the decrease in the plasma triglycerides observed in HDAC3ΔIEC mice. Transcriptional analyses of IECs revealed that changes observed in HDAC3 IEC mice corresponded with altered expression of several microbiota-sensitive metabolic genes. While many of these targets have been evaluated extensively in tissues such as liver and adipose, how their expression in IECs collectively impacts intestinal and systemic metabolism remains to be directly evaluated. PCK1, for example, is expressed in small intestinal IECs of rodents and humans38, 39, and based on its known functions in classical metabolic organs36, 37, this enzyme may increase glyceroneogenesis in IECs and contribute to the abnormally elevated triglycerides observed in IECs of HDAC3 IEC mice. Interestingly, HDAC3 associates with nuclear hormone receptors and other transcription factors that direct lipid homeostasis and PCK1 expression in other cells25-29, 40-43. While the systemic impact of HDAC3 expression on weight varies depending on the targeted cell type, these data collectively highlight a conserved role for HDAC3 in lipid regulation across functionally divergent tissues, and suggest future evaluation of PCK1 in IECs.
Our previous work showed that the composition of the microbiota in HDAC3 IEC mice does not induce phenotypic alterations, but rather that integration of signals from commensal microbes via IEC-intrinsic HDAC3 is critical for healthy homeostasis23,24. Commensal bacteria produce SCFAs in the intestine and we found that levels of SCFAs were significantly higher in the intestine of lean mice relative to obese mice. Mice fed SCFAs have reduced development of HFD-induced obesity and insulin resistance44,45. Consistently, here we found that the microbiota-derived metabolite, butyrate, improved weight in obese mice, and that this SCFA-induced weight loss is in part due to HDAC3 inhibition in IECs. Taken together, these findings support that SCFA-directed inhibition of HDAC3 enzymatic activity, similar to decreased IEC-intrinsic HDAC3 expression, promotes a lean metabolic phenotype. Thus, loss of intestinal butyrate in high fat-exposed obese individuals would enable increased HDAC3 activity in IECs that can induce obesity-promoting epithelial regulation in the intestine.
Childhood obesity and diabetes have been increasing at an alarming rate and children of obese parents exhibit increased risk for developing obesity later in life2, 46. Similar to the hereditary nature of epigenetics, the maternal microbiota directs establishment of the microbiota in children47. Thus, maternal obesity that is regulated by intestinal HDAC3 may trigger changes in microbiota that alter risk of obesity in offspring. Importantly, this study also suggests that decreased SCFAs in obese mothers may not only alter maternal weight, but may influence epigenetic mechanisms in the fetal intestine prior to development of the child’s own microbiota. Thus, HDAC3-driven epigenetic pathways that promote maternal obesity may also predispose offspring to development of obesity and diabetes later in life. Further, antibiotic exposure reduces intestinal lipid transport and has been linked to early obesity, raising the possibility that antibiotic-induced alterations in the intestine may be regulated by HDAC348-51.
Lipopolysaccharide (LPS) can cause inflammation-associated obesity in murine models in part through interaction with Toll-like receptor 4 (TLR4)52-54. Our previous study indicated that HDAC3ΔIEC mice exhibited impaired intestinal epithelial barrier function, resulting in elevated LPS in draining lymph nodes and increased susceptibility to intestinal inflammation in the context of the microbiota23. However, dampening HDAC activity in macrophages provides anti-inflammatory macrophage responses to LPS55. Thus, cell- and environment-specific roles for HDAC3 appear to dictate the context in which targeting HDAC3 provides an effective therapeutic strategy. This study reveals that in the context of high fat diet, HDAC3 regulation of IEC-dependent energy balance more than counters potential pro-obesity effects of low grade intestinal or systemic inflammation. Therefore, targeting intestinal HDAC3 directly or through microbiota-based strategies may represent a potential mechanism for specifically preventing obesity and tackling sequelae associated with obesity.
Supplementary Material
Acknowledgments
We thank the Way and Divanovic labs for useful discussions and members of the Alenghat lab for critical reading of the manuscript. We thank RISK investigators for patient recruitment and the Crohn’s and Colitis Foundation for RISK support. We also thank R. Karns, CCHMC Veterinary Services, CCHMC Pathology Research Core, NMR-based Metabolomics Core at CCHMC, the University of Cincinnati Genomics, Epigenomics and Sequencing Core, and Mouse Metabolic Phenotyping Center for services and technical assistance. This research is supported by the National Institutes of Health (DK093784, DK114123, DK116868 to T.A.), a Crohn’s and Colitis Foundation/Janssen/AGA award to T.A., and an Alpha Omega Alpha Carolyn L. Kuckein Fellowship to P.L. T.A. holds a Career Award for Medical Scientists from the Burroughs Wellcome Fund and is a Pew Scholar in the Biomedical Sciences, supported by the Pew Charitable Trust. This project is supported in part by PHS grant P30 DK078392, CEG grant P30 ES006096, T35 DK060444 (P.L.) DK103557 (P.T.). DK59630 (P.T.), and the CCHMC Trustee Award and Procter Scholar’s Program.
Funding. NIH grants DK093784, DK078392, DK060444, DK103557, DK59630, DK114123, DK116868, Crohn’s & Colitis Foundation, Burroughs Wellcome Fund, Pew Charitable Trust.
Footnotes
Publisher's Disclaimer: This is a PDF file of an unedited manuscript that has been accepted for publication. As a service to our customers we are providing this early version of the manuscript. The manuscript will undergo copyediting, typesetting, and review of the resulting proof before it is published in its final citable form. Please note that during the production process errors may be discovered which could affect the content, and all legal disclaimers that apply to the journal pertain.
Author Contributions. T.A., J.W., and V.W. designed the studies and analyzed the data. J.W., V.W., and J.M. carried out experiments. P.T. provided reagents and technical expertise. Y.H. and T.D. conducted human analyses. T.A., J.W., and P.L. wrote the manuscript.
Conflicts of interest. The authors disclose no conflicts.
References
- 1.Finucane MM, Stevens GA, Cowan MJ, et al. National, regional, and global trends in body-mass index since 1980: systematic analysis of health examination surveys and epidemiological studies with 960 country-years and 9.1 million participants. Lancet. 2011;377:557–67. doi: 10.1016/S0140-6736(10)62037-5. [DOI] [PMC free article] [PubMed] [Google Scholar]
- 2.Ng M, Fleming T, Robinson M, et al. Global, regional, and national prevalence of overweight and obesity in children and adults during 1980-2013: a systematic analysis for the Global Burden of Disease Study 2013. Lancet. 2014;384:766–81. doi: 10.1016/S0140-6736(14)60460-8. [DOI] [PMC free article] [PubMed] [Google Scholar]
- 3.Jiang C, Xie C, Lv Y, et al. Intestine-selective farnesoid X receptor inhibition improves obesity-related metabolic dysfunction. Nat Commun. 2015;6:10166. doi: 10.1038/ncomms10166. [DOI] [PMC free article] [PubMed] [Google Scholar]
- 4.Everard A, Geurts L, Caesar R, et al. Intestinal epithelial MyD88 is a sensor switching host metabolism towards obesity according to nutritional status. Nat Commun. 2014;5:5648. doi: 10.1038/ncomms6648. [DOI] [PMC free article] [PubMed] [Google Scholar]
- 5.Sonnenburg JL, Backhed F. Diet-microbiota interactions as moderators of human metabolism. Nature. 2016;535:56–64. doi: 10.1038/nature18846. [DOI] [PMC free article] [PubMed] [Google Scholar]
- 6.Bäckhed F, Ding H, Wang T, et al. The gut microbiota as an environmental factor that regulates fat storage. 2004 doi: 10.1073/pnas.0407076101. [DOI] [PMC free article] [PubMed] [Google Scholar]
- 7.Ley RE, Bäckhed F, Turnbaugh P, et al. Obesity alters gut microbial ecology. Proc Natl Acad Sci U S A. 2005;102:11070–5. doi: 10.1073/pnas.0504978102. [DOI] [PMC free article] [PubMed] [Google Scholar]
- 8.Turnbaugh PJ, Ley RE, Mahowald MA, et al. An obesity-associated gut microbiome with increased capacity for energy harvest. Nature. 2006;444:1027–131. doi: 10.1038/nature05414. [DOI] [PubMed] [Google Scholar]
- 9.Okubo H, Nakatsu Y, Kushiyama A, et al. Gut microbiota as a therapeutic target for metabolic disorders. Curr Med Chem. 2017 doi: 10.2174/0929867324666171009121702. [DOI] [PubMed] [Google Scholar]
- 10.Gerard P. Gut microbiota and obesity. Cell Mol Life Sci. 2016;73:147–62. doi: 10.1007/s00018-015-2061-5. [DOI] [PMC free article] [PubMed] [Google Scholar]
- 11.Vrieze A, Van Nood E, Holleman F, et al. Transfer of intestinal microbiota from lean donors increases insulin sensitivity in individuals with metabolic syndrome. Gastroenterology. 2012;143:913–6 e7. doi: 10.1053/j.gastro.2012.06.031. [DOI] [PubMed] [Google Scholar]
- 12.Dick KJ, Nelson CP, Tsaprouni L, et al. DNA methylation and body-mass index: a genome-wide analysis. Lancet. 2014;383:1990–8. doi: 10.1016/S0140-6736(13)62674-4. [DOI] [PubMed] [Google Scholar]
- 13.Wahl S, Drong A, Lehne B, et al. Epigenome-wide association study of body mass index, and the adverse outcomes of adiposity. Nature. 2017;541:81–86. doi: 10.1038/nature20784. [DOI] [PMC free article] [PubMed] [Google Scholar]
- 14.Macfarlane S, Macfarlane GT. Regulation of short-chain fatty acid production. Proc Nutr Soc. 2003;62:67–72. doi: 10.1079/PNS2002207. [DOI] [PubMed] [Google Scholar]
- 15.Dashwood RH, Ho E. Dietary histone deacetylase inhibitors: from cells to mice to man. Semin Cancer Biol. 2007;17:363–9. doi: 10.1016/j.semcancer.2007.04.001. [DOI] [PMC free article] [PubMed] [Google Scholar]
- 16.Candido EP, Reeves R, Davie JR. Sodium butyrate inhibits histone deacetylation in cultured cells. Cell. 1978;14:105–13. doi: 10.1016/0092-8674(78)90305-7. [DOI] [PubMed] [Google Scholar]
- 17.Waldecker M, Kautenburger T, Daumann H, et al. Inhibition of histone-deacetylase activity by short-chain fatty acids and some polyphenol metabolites formed in the colon. J Nutr Biochem. 2008;19:587–93. doi: 10.1016/j.jnutbio.2007.08.002. [DOI] [PubMed] [Google Scholar]
- 18.Krautkramer KA, Kreznar JH, Romano KA, et al. Diet-Microbiota Interactions Mediate Global Epigenetic Programming in Multiple Host Tissues. Mol Cell. 2016;64:982–992. doi: 10.1016/j.molcel.2016.10.025. [DOI] [PMC free article] [PubMed] [Google Scholar]
- 19.Kaser A, Niederreiter L, Blumberg RS. Genetically determined epithelial dysfunction and its consequences for microflora-host interactions. Cell Mol Life Sci. 2011;68:3643–9. doi: 10.1007/s00018-011-0827-y. [DOI] [PMC free article] [PubMed] [Google Scholar]
- 20.Maynard CL, Elson CO, Hatton RD, et al. Reciprocal interactions of the intestinal microbiota and immune system. Nature. 2012;489:231–41. doi: 10.1038/nature11551. [DOI] [PMC free article] [PubMed] [Google Scholar]
- 21.Ramanan D, Cadwell K. Intrinsic Defense Mechanisms of the Intestinal Epithelium. Cell Host Microbe. 2016;19:434–41. doi: 10.1016/j.chom.2016.03.003. [DOI] [PMC free article] [PubMed] [Google Scholar]
- 22.Bevins CL, Salzman NH. Paneth cells, antimicrobial peptides and maintenance of intestinal homeostasis. Nat Rev Microbiol. 2011;9:356–68. doi: 10.1038/nrmicro2546. [DOI] [PubMed] [Google Scholar]
- 23.Alenghat T, Osborne LC, Saenz SA, et al. Histone deacetylase 3 coordinates commensal-bacteria-dependent intestinal homeostasis. Nature. 2013;504:153–7. doi: 10.1038/nature12687. [DOI] [PMC free article] [PubMed] [Google Scholar]
- 24.Navabi N, Whitt J, Wu SE, et al. Epithelial Histone Deacetylase 3 Instructs Intestinal Immunity by Coordinating Local Lymphocyte Activation. Cell Rep. 2017;19:1165–1175. doi: 10.1016/j.celrep.2017.04.046. [DOI] [PMC free article] [PubMed] [Google Scholar]
- 25.Feng D, Liu T, Sun Z, et al. A circadian rhythm orchestrated by histone deacetylase 3 controls hepatic lipid metabolism. Science. 2011;331:1315–9. doi: 10.1126/science.1198125. [DOI] [PMC free article] [PubMed] [Google Scholar]
- 26.Montgomery RL, Potthoff MJ, Haberland M, et al. Maintenance of cardiac energy metabolism by histone deacetylase 3 in mice. The Journal of Clinical Investigation. 2008 doi: 10.1172/JCI35847. [DOI] [PMC free article] [PubMed] [Google Scholar]
- 27.Emmett MJ, Lim HW, Jager J, et al. Histone deacetylase 3 prepares brown adipose tissue for acute thermogenic challenge. Nature. 2017;546:544–548. doi: 10.1038/nature22819. [DOI] [PMC free article] [PubMed] [Google Scholar]
- 28.Ferrari A, Longo R, Fiorino E, et al. HDAC3 is a molecular brake of the metabolic switch supporting white adipose tissue browning. Nat Commun. 2017;8:93. doi: 10.1038/s41467-017-00182-7. [DOI] [PMC free article] [PubMed] [Google Scholar]
- 29.Sun Z, Miller RA, Patel RT, et al. Hepatic Hdac 3 promotes gluconeogenesis by repressing lipid synthesis and sequestration. Nat Med. 2012 doi: 10.1038/nm.2744. [DOI] [PMC free article] [PubMed] [Google Scholar]
- 30.Mullican SE, Gaddis CA, Alenghat T, et al. Histone deacetylase 3 is an epigenomic brake in macrophage alternative activation. Genes Dev. 2011;25:2480–8. doi: 10.1101/gad.175950.111. [DOI] [PMC free article] [PubMed] [Google Scholar]
- 31.Madison BB, Dunbar L, Qiao XT, et al. Cis elements of the villin gene control expression in restricted domains of the vertical (crypt) and horizontal (duodenum, cecum) axes of the intestine. J Biol Chem. 2002;277:33275–83. doi: 10.1074/jbc.M204935200. [DOI] [PubMed] [Google Scholar]
- 32.el Marjou F, Janssen KP, Chang BH, et al. Tissue-specific and inducible Cre-mediated recombination in the gut epithelium. Genesis. 2004;39:186–93. doi: 10.1002/gene.20042. [DOI] [PubMed] [Google Scholar]
- 33.Haberman Y, Tickle TL, Dexheimer PJ, et al. Pediatric Crohn disease patients exhibit specific ileal transcriptome and microbiome signature. J Clin Invest. 2014;124:3617–33. doi: 10.1172/JCI75436. [DOI] [PMC free article] [PubMed] [Google Scholar]
- 34.Alenghat T, Meyers K, Mullican SE, et al. Nuclear receptor corepressor and histone deacetylase 3 govern circadian metabolic physiology. Nature. 2008;456:997–1000. doi: 10.1038/nature07541. [DOI] [PMC free article] [PubMed] [Google Scholar]
- 35.Jandacek RJ, Heubi JE, Tso P. A novel, noninvasive method for the measurement of intestinal fat absorption. Gastroenterology. 2004;127:139–44. doi: 10.1053/j.gastro.2004.04.007. [DOI] [PubMed] [Google Scholar]
- 36.Sun Y, Liu S, Ferguson S, et al. Phosphoenolpyruvate carboxykinase overexpression selectively attenuates insulin signaling and hepatic insulin sensitivity in transgenic mice. J Biol Chem. 2002;277:23301–7. doi: 10.1074/jbc.M200964200. [DOI] [PubMed] [Google Scholar]
- 37.Franckhauser S, Munoz S, Pujol A, et al. Increased fatty acid re-esterification by PEPCK overexpression in adipose tissue leads to obesity without insulin resistance. Diabetes. 2002;51:624–30. doi: 10.2337/diabetes.51.3.624. [DOI] [PubMed] [Google Scholar]
- 38.Yanez AJ, Nualart F, Droppelmann C, et al. Broad expression of fructose-1,6-bisphosphatase and phosphoenolpyruvate carboxykinase provide evidence for gluconeogenesis in human tissues other than liver and kidney. J Cell Physiol. 2003;197:189–97. doi: 10.1002/jcp.10337. [DOI] [PubMed] [Google Scholar]
- 39.Mithieux G, Misery P, Magnan C, et al. Portal sensing of intestinal gluconeogenesis is a mechanistic link in the diminution of food intake induced by diet protein. Cell Metab. 2005;2:321–9. doi: 10.1016/j.cmet.2005.09.010. [DOI] [PubMed] [Google Scholar]
- 40.McGee-Lawrence ME, Carpio LR, Schulze RJ, et al. Hdac3 Deficiency Increases Marrow Adiposity and Induces Lipid Storage and Glucocorticoid Metabolism in Osteochondroprogenitor Cells. J Bone Miner Res. 2016;31:116–28. doi: 10.1002/jbmr.2602. [DOI] [PMC free article] [PubMed] [Google Scholar]
- 41.Gonzalez FJ, Jiang C, Patterson AD. An Intestinal Microbiota-Farnesoid X Receptor Axis Modulates Metabolic Disease. Gastroenterology. 2016;151:845–859. doi: 10.1053/j.gastro.2016.08.057. [DOI] [PMC free article] [PubMed] [Google Scholar]
- 42.Fajas L, Egler V, Reiter R, et al. The retinoblastoma-histone deacetylase 3 complex inhibits PPARgamma and adipocyte differentiation. Dev Cell. 2002;3:903–10. doi: 10.1016/s1534-5807(02)00360-x. [DOI] [PubMed] [Google Scholar]
- 43.Zhang J, Henagan TM, Gao Z, et al. Inhibition of glyceroneogenesis by histone deacetylase 3 contributes to lipodystrophy in mice with adipose tissue inflammation. Endocrinology. 2011;152:1829–38. doi: 10.1210/en.2010-0828. [DOI] [PMC free article] [PubMed] [Google Scholar]
- 44.Gao Z, Yin J, Zhang J, et al. Butyrate improves insulin sensitivity and increases energy expenditure in mice. Diabetes. 2009;58:1509–17. doi: 10.2337/db08-1637. [DOI] [PMC free article] [PubMed] [Google Scholar]
- 45.Lin HV, Frassetto A, Kowalik EJ, Jr, et al. Butyrate and propionate protect against diet-induced obesity and regulate gut hormones via free fatty acid receptor 3-independent mechanisms. PLoS One. 2012;7:e35240. doi: 10.1371/journal.pone.0035240. [DOI] [PMC free article] [PubMed] [Google Scholar]
- 46.Whitaker KL, Jarvis MJ, Beeken RJ, et al. Comparing maternal and paternal intergenerational transmission of obesity risk in a large population-based sample. Am J Clin Nutr. 2010;91:1560–7. doi: 10.3945/ajcn.2009.28838. [DOI] [PubMed] [Google Scholar]
- 47.Collado MC, Cernada M, Bauerl C, et al. Microbial ecology and host-microbiota interactions during early life stages. Gut Microbes. 2012;3:352–65. doi: 10.4161/gmic.21215. [DOI] [PMC free article] [PubMed] [Google Scholar]
- 48.Cho I, Yamanishi S, Cox L, et al. Antibiotics in early life alter the murine colonic microbiome and adiposity. Nature. 2012;488:621–6. doi: 10.1038/nature11400. [DOI] [PMC free article] [PubMed] [Google Scholar]
- 49.Cox LM, Yamanishi S, Sohn J, et al. Altering the intestinal microbiota during a critical developmental window has lasting metabolic consequences. Cell. 2014;158:705–21. doi: 10.1016/j.cell.2014.05.052. [DOI] [PMC free article] [PubMed] [Google Scholar]
- 50.Bailey LC, Forrest CB, Zhang P, et al. Association of antibiotics in infancy with early childhood obesity. JAMA Pediatr. 2014;168:1063–9. doi: 10.1001/jamapediatrics.2014.1539. [DOI] [PubMed] [Google Scholar]
- 51.Sato H, Zhang LS, Martinez K, et al. Antibiotics Suppress Activation of Intestinal Mucosal Mast Cells and Reduce Dietary Lipid Absorption in Sprague-Dawley Rats. Gastroenterology. 2016;151:923–932. doi: 10.1053/j.gastro.2016.07.009. [DOI] [PMC free article] [PubMed] [Google Scholar]
- 52.Cani PD, Bibiloni R, Knauf C, et al. Changes in gut microbiota control metabolic endotoxemia-induced inflammation in high-fat diet-induced obesity and diabetes in mice. Diabetes. 2008;57:1470–81. doi: 10.2337/db07-1403. [DOI] [PubMed] [Google Scholar]
- 53.Shi H, Kokoeva MV, Inouye K, et al. TLR4 links innate immunity and fatty acid–induced insulin resistance. J Clin Invest. 2006;116:3015–25. doi: 10.1172/JCI28898. [DOI] [PMC free article] [PubMed] [Google Scholar]
- 54.Suganami T, Mieda T, Itoh M, et al. Attenuation of obesity-induced adipose tissue inflammation in C3H/HeJ mice carrying a Toll-like receptor 4 mutation. Biochem Biophys Res Commun. 2007;354:45–9. doi: 10.1016/j.bbrc.2006.12.190. [DOI] [PubMed] [Google Scholar]
- 55.Lohman RJ, Iyer A, Fairlie TJ, et al. Differential Anti-inflammatory Activity of HDAC Inhibitors in Human Macrophages and Rat Arthritis. J Pharmacol Exp Ther. 2016;356:387–96. doi: 10.1124/jpet.115.229328. [DOI] [PubMed] [Google Scholar]
Associated Data
This section collects any data citations, data availability statements, or supplementary materials included in this article.