Abstract
Animals change sensory responses and their eventual behaviors, depending on their internal metabolic status and external food availability. However, the mechanisms underlying feeding state‐dependent behavioral changes remain undefined. Previous studies have shown that Caenorhabditis elegans hermaphrodite exhibits avoidance behaviors to acute exposure of a pheromone, ascr#3 (asc‐ΔC9, C9). Here, we show that the ascr#3 avoidance behavior is modulated by feeding state via the insulin signaling pathway. Starvation increases ascr#3 avoidance behavior, and loss‐of‐function mutations in daf‐2 insulin‐like receptor gene dampen this starvation‐induced ascr#3 avoidance behavior. DAF‐2 and its downstream signaling molecules, including the DAF‐16 FOXO transcription factor, act in the ascr#3‐sensing ADL neurons to regulate synaptic transmission to downstream target neurons, including the AVA command interneurons. Moreover, we found that starvation decreases the secretion of INS‐18 insulin‐like peptides from the intestine, which antagonizes DAF‐2 function in the ADL neurons. Altogether, this study provides insights about the molecular communication between intestine and sensory neurons delivering hunger message to sensory neurons, which regulates avoidance behavior from pheromones to facilitate survival chance.
Keywords: avoidance behavior, DAF‐2 insulin receptor, feeding state, pheromone, synaptic transmission
Subject Categories: Cancer, Signal Transduction, Transcription
Introduction
Acute and chronic adaptations to the ever‐changing external and internal environments are crucial for animal survival. Internal metabolic status induced by satiety and hunger has been shown to modulate animal physiology and behavior (see review Mayer, 2011). Particularly, depending on feeding status, animals change sensory responses, leading to altered behavioral outcomes (Magni et al, 2009; Nassel & Winther, 2010; Palouzier‐Paulignan et al, 2012). These effects of feeding state on the sensory system have been widely reported in invertebrate and vertebrate systems. For example, increased food intake reduces monkey visual responses, causing decreased behavioral response to food sources (Critchley & Rolls, 1996). In another example, starvation promotes food‐seeking behavior via direct modulation of Drosophila olfactory neurons (Root et al, 2011). However, molecular or circuit mechanisms underlying feeding state‐regulated sensory responses still remain largely uncharacterized.
The nematode Caenorhabditis elegans has a well‐defined nervous system with only 302 neurons that mediate a broad spectrum of sensory behaviors, such as chemosensation, nociception, thermosensation, foraging, and feeding. These behaviors are plastic and can be modulated by the animal's feeding state (see review Sengupta, 2013). For example, acute starvation alters patterns of locomotion and decreases the rates of pharyngeal pumping and egg laying (Trent et al, 1983; Avery & Thomas, 1997; Sawin et al, 2000; Hills et al, 2004). In addition, the presence or absence of food acutely affects chemosensory behaviors; presence of food enhances avoidance behavior to repulsive chemicals (Ezcurra et al, 2011), whereas absence of food increases adaptation to repeated exposure of attractive odorants and noxious soluble chemicals, including copper and glycerol (Colbert & Bargmann, 1997; Ezcurra et al, 2016). Chronic starvation has shown to also affect chemosensory behaviors and gene expression of chemosensory signaling genes (Saeki et al, 2001; Gruner et al, 2014, 2016). However, little is known about the mechanisms underlying starvation‐mediated changes of chemosensory behaviors.
Insulin level reflects feeding state of an animal and directly regulates sensory responses (Fadool et al, 2000; Lacroix et al, 2008). In Drosophila, starvation increases attractive behaviors to favorable odors and decreases avoidance behaviors to unfavorable odors via the change of neuronal activities in the olfactory neurons by regulating insulin signaling (Root et al, 2011; Ko et al, 2015). In C. elegans, INS‐1, an insulin‐like peptide, regulates olfactory response to odorants and thus affects their olfactory behavior (Chalasani et al, 2010). However, a systemic analysis to investigate how insulin signaling regulates the sensory behavior by food availability in the whole organism context has not been performed yet.
Caenorhabditis elegans produces a complex pheromone mixture composed of small chemicals called ascarosides. Subsets of ascarosides have been shown to regulate many aspects of nematode development and behavior including dauer formation and sensory perception (Jeong et al, 2005; Butcher et al, 2007; Edison, 2009; Macosko et al, 2009). Previously, we showed that adult hermaphrodites exhibit acute avoidance to the ascaroside ascr#3, which is mediated by the nociceptive ADL neurons (Jang et al, 2012). Moreover, early experience of ascr#3 modulates ascr#3 avoidance as adults, indicating that ascr#3 avoidance behaviors are plastic (Hong et al, 2017).
Here, we show that ascr#3 avoidance is further modulated by feeding state. We found that prolonged starvation enhances ascr#3 avoidance behaviors of adult hermaphrodites. DAF‐2 insulin‐like signaling acts in the ADL ascr#3‐sensing neurons to mediate starvation‐induced ascr#3 avoidance by upregulation of the expression level of synaptic molecules via DAF‐16 FOXO. Moreover, we also found that prolonged starvation inhibits secretion of an insulin‐like peptide INS‐18 from the intestine, which antagonizes the function of DAF‐2 in ADL. Taken together, these results indicate that prolonged starvation affects the secretion of intestinal insulin‐like peptides, which may function via a DAF‐2 receptor to regulate the synaptic output of pheromone‐sensing neurons and thus the pheromone avoidance behavior.
Results
Starvation alters avoidance behaviors to ascr#3 via the DAF‐2 insulin‐like receptor
To investigate whether ascr#3 avoidance behaviors are affected by feeding state, we fed or starved young adult animals for 3, 6, or 24 h and examined acute avoidance to 100 nM ascr#3 (Fig 1A). We found that animals starved for longer than 6 h showed increased ascr#3 avoidance, compared to animals well‐fed and animals starved for only 3 h (Fig 1B). Increased ascr#3 avoidance appeared to be mediated by increased long reversals but not short reversals or omega turns in starved animals (Fig EV1A; Hong et al, 2017). The increased ascr#3 avoidance in the animals starved for 6 h was reversed to normal level, after 24 h of re‐feeding (Fig 1C). To further examine the effects of starvation on ascr#3 avoidance, we tested eat‐2 loss‐of‐function mutant animals. eat‐2 encodes nicotinic acetylcholine receptor subunit of which mutations cause decreased pharyngeal pumping, resulting in a dietary restriction state (Lakowski & Hekimi, 1998; Lopez et al, 2013). We found that ascr#3 avoidance was increased in eat‐2 mutants, similar to that of wild‐type animals starved for 6 h (Fig EV1B). These results indicate that feeding state influences avoidance behavior to ascr#3.
Figure 1. An insulin/IGF‐1‐like receptor, daf‐2, is required for increase in ascr#3 avoidance under starvation conditions.
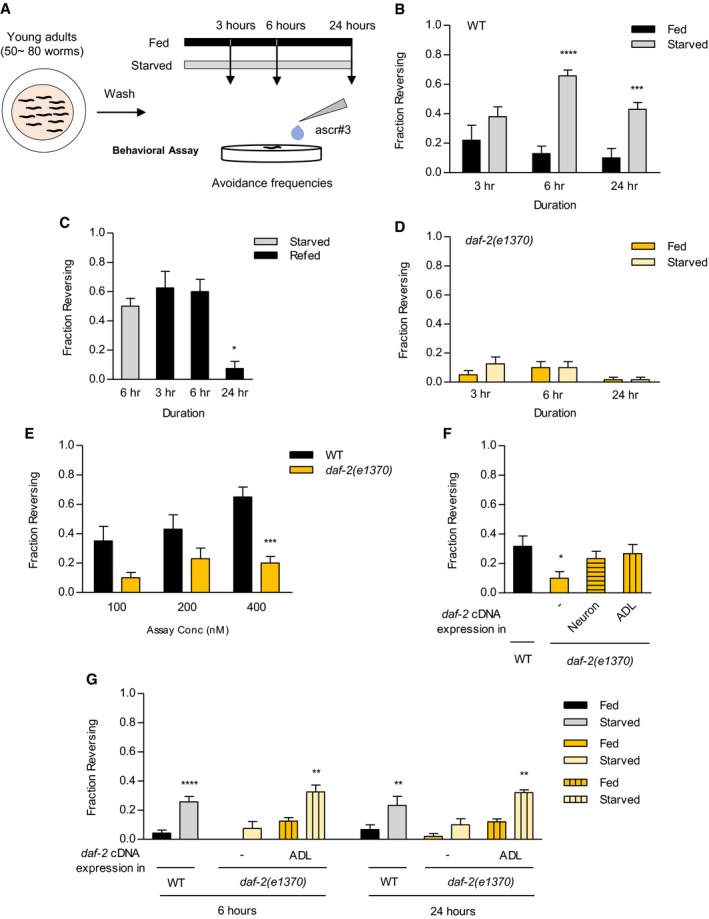
- Experimental scheme of ascr#3 avoidance assay depending upon starvation. 50–100 young adult animals are washed and placed on seeded (fed: colored in black) or non‐seeded (starved: colored in gray) plates for each duration: 3, 6, and 24 h; then, various concentrations of ascr#3 are delivered to the front of a freely moving forward animal to measure avoidance frequencies responding to ascr#3.
- Fraction reversing of fed and starved animals in response to ascr#3 exposure. n = 50–70. ***P < 0.001 and ****P < 0.0001 (one‐way ANOVA Bonferroni's test).
- Fraction reversing of re‐fed animals from 6‐h starvation in response to ascr#3 exposure. A 24‐h re‐feeding period reverses ascr#3 avoidances to well‐fed status. n = 40–80. *P < 0.05 (one‐way ANOVA Dunnett's Test).
- Fraction reversing of daf‐2 mutant animals in fed and starved status in response to ascr#3 exposure. n = 40–60.
- Fraction reversing of well‐fed wild‐type animals and daf‐2 mutants in response to 100, 200, and 400 nM ascr#3. n = 60. ***P < 0.001 (Bonferroni's test).
- Fraction reversing of wild‐type animals, daf‐2 mutants, and daf‐2 mutants expressing unc‐14p::daf‐2 cDNA (neurons) or sre‐1p::daf‐2 cDNA (ADL) in response to 500 nM ascr#3. daf‐2 cDNA expression in neuron and ADL restores the defect of ascr#3 avoidance in daf‐2 mutants. n = 60. *P < 0.05 (Dunnett's test).
- Fraction reversing of wild‐type animals, daf‐2 mutants, and daf‐2 mutants expressing sre‐1p::daf‐2 cDNA (ADL) in fed and starved conditions in response to ascr#3. n = 40–70. **P < 0.01 and ****P < 0.0001 (Bonferroni's test).
Figure EV1. Effect of DAF‐2/insulin‐like receptor and feeding status on ascr#3 avoidance.
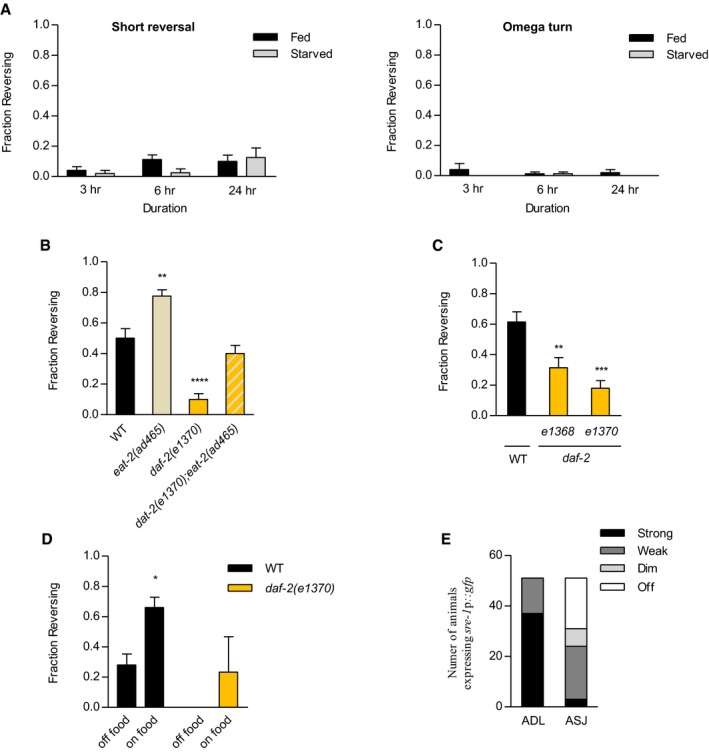
- Fraction reversing of wild‐type animals exhibiting short reversal (left) and omega turn under different feeding conditions (right). n = 40–80.
- Fraction reversing of wild‐type animals and eat‐2 mutants, daf‐2 mutants, and eat‐2;daf‐2 double mutants under fed conditions. n = 80–110. **P < 0.01 and ****P < 0.0001 (Dunnett's Test).
- Fraction reversing of daf‐2 alleles, e1368, and e1370 in response to 500 nM ascr#3 in fed conditions. n = 50–70. **P < 0.01 and ***P < 0.001 (Dunnett's test).
- Fraction reversing of wild‐type and daf‐2 mutant animals on on‐food or off‐food conditions. n = 30–50. *P < 0.05 (Bonferroni's test).
- The number of transgenic animals expressing sre‐1p::gfp in ADL and ASJ. n = 31.
Since DAF‐2/insulin‐like signaling has been reported to modify effects of dietary restriction (Lemieux & Ashrafi, 2015), we investigated whether DAF‐2 regulates starvation‐mediated increase in ascr#3 avoidance. We tested ascr#3 avoidance of daf‐2(e1370) reduction‐of‐function mutants under well‐fed and starved conditions (Kimura et al, 1997) and found that this mutation not only suppressed increased ascr#3 avoidance in animals starved for 6 h or 24 h, but also decreased ascr#3 avoidance in well‐fed animals (Fig 1D and E). ascr#3 avoidance was also decreased in well‐fed daf‐2(e1368) mutant animals carrying another reduction‐of‐function allele (Fig EV1C). In addition, daf‐2 mutation suppressed the enhancement of ascr#3 avoidance in eat‐2 mutants (Fig EV1B). Furthermore, increased ascr#3 avoidance in the presence of food was also abolished in daf‐2 mutants (Fig EV1D; Jang et al, 2012). These results suggest that DAF‐2/insulin‐like signaling modulates feeding state‐dependent alteration of ascr#3 avoidance.
We next examined where DAF‐2 acts to control ascr#3 avoidance. We expressed daf‐2 cDNA under the control of upstream regulatory sequences of unc‐14 (pan‐neuronal; Ogura et al, 1997) or sre‐1 (ADL marker) gene (Fig EV1E; Jang et al, 2012; Gruner et al, 2014; Hong et al, 2017). Pan‐neuronal expression or ADL‐specific expression of daf‐2 cDNA fully rescued the defects of ascr#3 avoidance in daf‐2 mutants (Fig 1F). Moreover, the expression of daf‐2 cDNA in ADL also restored increased avoidance behaviors to ascr#3 in animals starved for 6 h or 24 h (Fig 1G). Taken together, these observations indicate that DAF‐2/insulin‐like signaling acts in the ascr#3‐sensing ADL neurons to regulate ascr#3 avoidance behaviors in a feeding state‐dependent manner.
DAF‐2 signaling mediates Ca2+ responses, not in the ADL sensory neurons, but in the AVA interneurons upon ascr#3 exposure
Previously, works showed that ADL neurons exhibit transient Ca2+ responses to acute ascr#3 exposure in a dose‐dependent manner (Jang et al, 2012). Therefore, altered ascr#3 avoidance in daf‐2 mutants may be due to decreased ADL Ca2+ responses to ascr#3 exposure. In order to test the hypothesis, we measured the intracellular Ca2+ dynamics of ADL upon ascr#3 exposure using the genetically encoded calcium sensor GCaMP3 (Chronis et al, 2007; Jang et al, 2012). We found that the Ca2+ activities of ADL were unaltered in daf‐2 mutants, compared to wild‐type animals, when animals were exposed to either 100 nM or 500 nM ascr#3 (Fig 2A). Previously, it was shown that Ca2+ transients of ADL upon ascr#3 exposure were not affected by starvation for 6 h (Gruner et al, 2014). These results indicate that the loss of DAF‐2 and starvation for 6 h do not affect sensory response of ADL to ascr#3.
Figure 2. DAF‐2 affects Ca2+ transients not in the ADL ascr#3‐sensing neurons but their downstream target neurons.
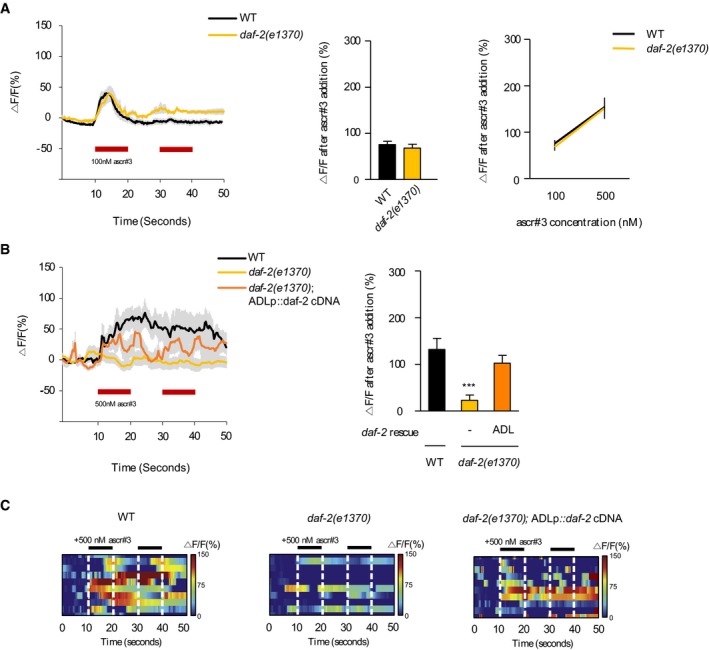
- Ca2+ transients of ADL upon ascr#3 exposure in wild‐type animals and daf‐2 mutants. Ca2+ transients to 100 nM ascr#3 of ADL (left), the average peak percentage changes in fluorescence upon 100 nM ascr#3 exposure (middle), and the dose–response curve of the average peak percentage changes in fluorescence Ca2+ peaks upon 100 and 500 nM ascr#3 exposure (right). n = 7–12.
- Ca2+ transients of AVA upon 500 nM ascr#3 exposure in wild‐type animals, daf‐2 mutants, and daf‐2 mutants expressing sre‐1p::daf‐2 cDNA (ADL). Ca2+ transients in response to ascr#3 in AVA (left), the average peak percentage changes in fluorescence upon 100 nM ascr#3 exposure (right). n = 10. ***P < 0.001 (Dunnett's test).
- Heat‐map images of Ca2+ transients in AVA upon 500 nM ascr#3 exposure in wild‐type animals (left), daf‐2 mutants (middle), and daf‐2 mutants expressing sre‐1p::daf‐2 cDNA (right). Each row represents Ca2+ responses of individual animals to ascr#3 exposure. n = 10.
The ADL sensory neurons form chemical synapses onto the AVA, AVD, and AIB interneurons, which trigger backward movements by activating DA or VA motor neurons (Chalfie et al, 1985; White et al, 1986). The signals from ADL neurons mainly transit to AVA but not AVD and AIB upon ascr#3 exposure (Hong et al, 2017). Thus, we next monitored Ca2+ transients of AVA in daf‐2 mutants and found that the Ca2+ transients of AVA upon ascr#3 exposure were abolished in daf‐2 mutants. Similar to the ascr#3 avoidance defects, ascr#3 Ca2+ transient defects in daf‐2 mutants were fully rescued by daf‐2 cDNA expression in ADL (Fig 2B and C), indicating that DAF‐2 acts in ADL to regulate ascr#3 responses of the ADL downstream target neurons.
DAF‐2 signaling regulates chemical synaptic transmission from ADL
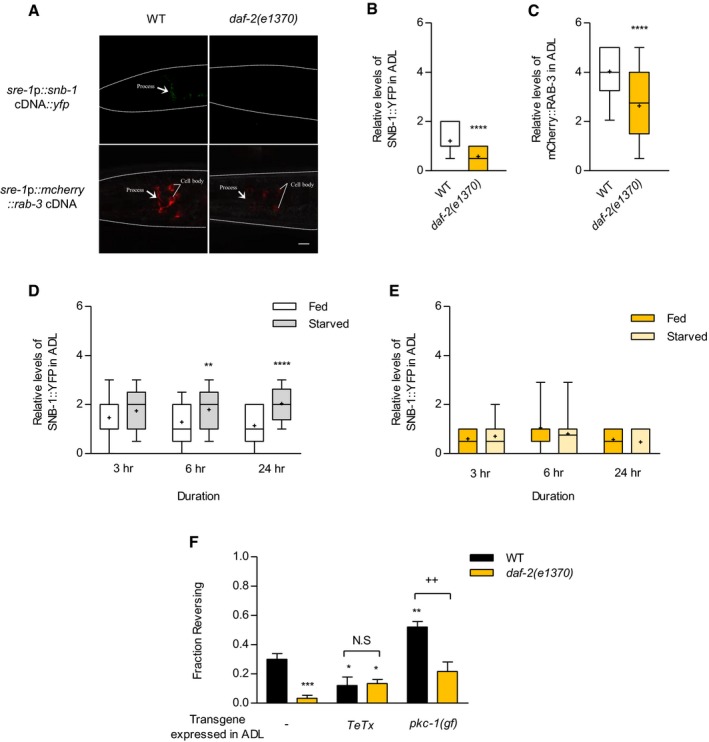
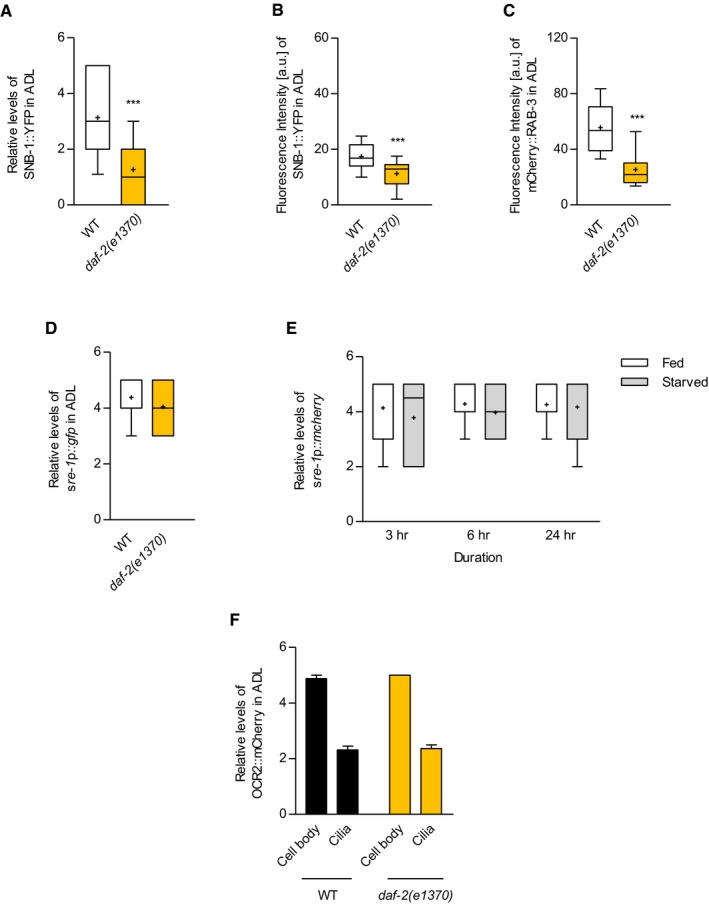
The finding that loss of DAF‐2 function decreases ascr#3 responses in ADL downstream neurons prompted us to examine the effects of DAF‐2 signaling on chemical synaptic transmission from ADL. We first examined synaptic densities in the ADL neurons by expressing functional YFP‐tagged SNB‐1/synaptobrevin, which is a component of SNARE (soluble NSF attachment protein receptor) proteins and has been used as a pre‐synaptic marker in C. elegans (Nonet et al, 1998; Shen & Bargmann, 2003; Sieburth et al, 2005; Noma & Jin, 2015). We measured fluorescence intensity of SNB‐1::YFP in areas near the nerve ring where ADL and AVA connect each other (White et al, 1986). We found that, in wild‐type animals, the expression of SNB‐1::YFP was detected in the processes of the ADL neurons close to the nerve ring regions (Figs 3A and B, and EV2A and B). However, the fluorescence level of SNB‐1::YFP was significantly decreased in daf‐2 mutants (Figs 3A and B, and EV2A and B). We also monitored the expression of RAB‐3 Ras GTPase protein, which plays key roles in synaptic vesicle release (Nonet et al, 1997). In wild‐type animals, RAB‐3 proteins were consistently detected in the soma and processes of the ADL neurons (Figs 3A and C, and EV2C). Similar to SNB‐1, the mCherry‐tagged RAB‐3 level in ADL was also decreased in both the soma and the processes of daf‐2 mutants (Figs 3A and C, and EV2C). The promoter activity of the sre‐1 gene was not affected by daf‐2 mutations and starvation (Fig EV2D and E; Gruner et al, 2014). We further examined the fluorescence level of OCR‐2::mCherry in daf‐2 mutants. ocr‐2 encodes a TRPV channel that acts in the ADL neurons to mediate ascr#3 avoidance (Jang et al, 2012). We found that OCR‐2 level was not altered in daf‐2 mutants (Fig EV2F). These results suggest that DAF‐2 specifically regulates the protein levels of pre‐synaptic proteins in the ADL neurons, and then, the reduction in these protein levels in daf‐2 mutants leads to the lack of AVA neuronal responses which eventually result in the suppression of the pheromone avoidance behaviors upon ascr#3 exposure.
Figure 3. DAF‐2 regulates synaptic transmissions in ADL .
-
ARepresentative images of wild‐type animals (left) and daf‐2 mutants (right) expressing sre‐1p::snb‐1 cDNA::yfp (top) and sre‐1p::mCherry::rab‐3 cDNA (bottom). The scale bar is 10 μm.
-
B, CRelative fluorescence intensity of wild‐type animals and daf‐2 mutant animals expressing sre‐1p::snb‐1 cDNA::yfp (B) and sre‐1p::mCherry::rab‐3 cDNA (C). n = 59–60. ****P < 0.0001 (unpaired Student's t‐test).
-
DRelative fluorescence intensity of sre‐1p::snb‐1 cDNA::yfp of wild‐type animals in fed and starved conditions for 3, 6, and 24 h. n = 37–80. **P < 0.01 and ****P < 0.0001 (Bonferroni's test).
-
ERelative fluorescence intensity of sre‐1p::snb‐1 cDNA::yfp of daf‐2 mutants in fed and starved conditions. n = 20–30.
-
FFraction reversing of wild‐type animals and daf‐2 mutant animals expressing sre‐1p::TeTx and sre‐1p::pkc‐1(gf). n = 50–90. *P < 0.05, **P < 0.01, and ***P < 0.001 (Dunnett's test). ++ P < 0.01 (unpaired Student's t‐test).
Figure EV2. Quantification of SNB‐1::YFP and mCherry::RAB‐3 and gene expression of sre‐1 promoter upon daf‐2 mutation or starvation.
-
ARelative fluorescence intensity of integrated animals expressing sre‐1p::snb‐1 cDNA::yfp. n = 30. ***P < 0.0001 (unpaired Student's t‐test).
-
B, CQuantification of fluorescence intensity of wild‐type and daf‐2 mutant animals expressing sre‐1p::snb‐1 cDNA::yfp (B) and sre‐1p::mCherry::rab‐3 cDNA (C) analyzed using ImageJ software. n = 13–41. ***P < 0.001 (unpaired Student's t‐test).
-
DRelative fluorescence intensity of daf‐2 mutants expressing sre‐1p::gfp. n = 50.
-
ERelative fluorescence intensity of transgenic animals expressing sre‐1p::mCherry in fed and starved conditions. n = 29–35.
-
FRelative fluorescence intensity of wild‐type and daf‐2 mutant animals expressing sre‐1p::ocr‐2 genome::mcherry. n = 41.
We then examined the SNB‐1::YFP level in starved wild‐type animals and found that the SNB‐1 level was increased in ADL after 6‐ and 24‐h starvation (Fig 3D). Moreover, daf‐2 mutation also suppressed the increase in SNB‐1 level in starved wild‐type animals (Fig 3E). Together, these results indicate that starvation status may regulate ADL synaptic transmission via the expression levels of synaptic vesicle molecules.
Chemical synaptic outputs of ADL mediate avoidance behaviors to ascr#3 (Jang et al, 2012; Hong et al, 2017). Consistent with the previous report, blocking of chemical synaptic transmission from ADL by expressing tetanus toxin light chain (TeTx) decreased ascr#3 avoidance in wild‐type animals which appeared not to be further decreased by daf‐2 mutation (Fig 3F; Jang et al, 2012). We next increased the chemical synaptic output of ADL by expressing gain‐of‐function mutation of pkc‐1 protein kinase C gene which promotes synaptic vesicle fusion (Sieburth et al, 2007; Tsunozaki et al, 2008). We found that the expression of pkc‐1(gf) enhanced avoidance behavior to ascr#3 in wild‐type animals (Fig 3F). The daf‐2 mutant animals expressing sre‐1p::pkc‐1(gf) also suppressed the enhancement of ascr#3 avoidance (Fig 3F). These results support that DAF‐2 signaling regulates ascr#3 avoidance by modulating the synaptic activity in ADL. Taken together, these results indicate that feeding status and DAF‐2 insulin signaling may regulate ADL synaptic transmission via the change in synaptic vesicle protein levels.
PI3K/AKT/FOXO act downstream of DAF‐2 in ADL to regulate ascr#3 avoidance behavior
In canonical insulin signaling, DAF‐2 signals through AGE‐1 (phosphoinositide 3‐kinase), PDK‐1 (phosphoinositide‐dependent kinase), AKT‐1/AKT‐2 (Akt/protein kinase B family), DAF‐18 (PTEN), and DAF‐16/FOXO (Kimura et al, 1997; Ogg & Ruvkun, 1998; Engelman et al, 2006; Murphy & Hu, 2013). We investigated whether these genes affect DAF‐2‐mediate ascr#3 avoidance behaviors as well as protein levels of SNB‐1 in ADL. Similar to daf‐2 mutants, age‐1 or akt‐1 mutants exhibited decreased avoidance to ascr#3 and SNB‐1 level in ADL (Fig 4A and B). However, the mutations in akt‐2, pdk‐1, or daf‐18 did not affect ascr#3 avoidance (Fig 4A).
Figure 4. PI3K/AKT/FOXO pathway acts downstream of daf‐2 signaling in ADL to mediate ascr#3 avoidance.
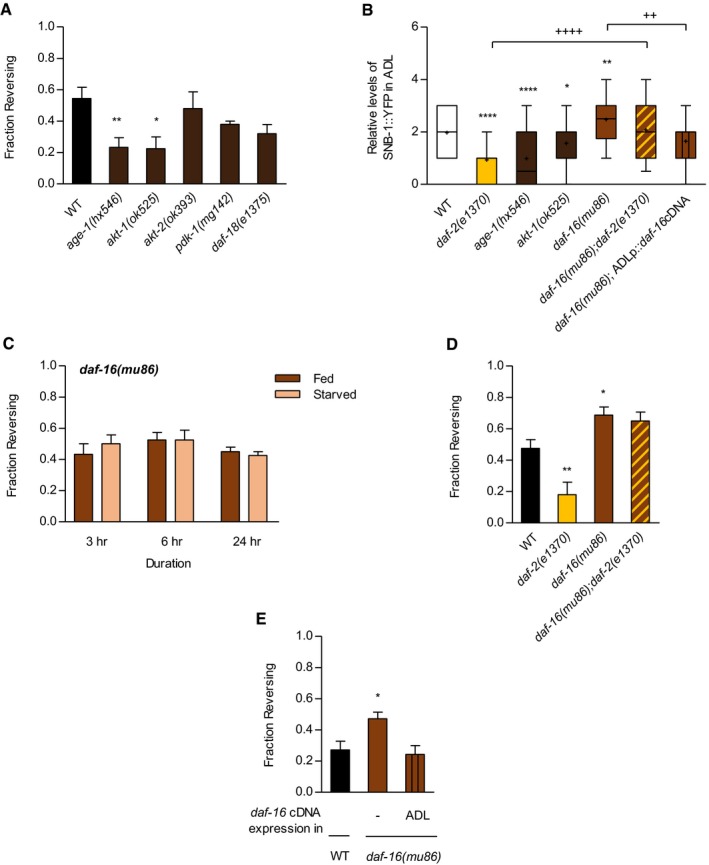
- Fraction reversing of wild‐type animals, age‐1 mutants, akt‐1 mutants, akt‐2 mutants, and pdk‐1 mutants in response to 500 nM ascr#3. n = 40–90. *P < 0.05 and **P < 0.01 (Dunnett's test).
- Relative fluorescence intensity of transgenic animals expressing sre‐1p::snb‐1 cDNA::yfp, including daf‐2 mutants, age‐1 mutants, akt‐1 mutants, daf‐16 mutants, daf‐16;daf‐2 double mutants, and daf‐16 mutants expressing sre‐1p::daf‐16 cDNA (ADL). n = 37–218. *, **, and **** present different from wild type at P < 0.05, P = 0.01, and P < 0.0001 (Dunnett's test). ++ P < 0.01 and ++++ P < 0.0001 (unpaired Student's t‐test). Tops and bottoms of boxes indicate the 25th and 75th percentiles, respectively; whiskers represent 10th–90th percentile. Median is indicated by a horizontal line, and the average is marked by “+” in the box.
- Fraction reversing of daf‐16 mutant animals in fed and starved conditions in response to ascr#3 exposure. n = 30–40.
- Fraction reversing of wild‐type animals, daf‐2 mutants, daf‐16 mutants, and daf‐16;daf‐2 double mutants in response to ascr#3. n = 50–80. *P < 0.05 and **P < 0.01 (Dunnett's test).
- Fraction reversing of wild‐type animals, daf‐16 mutants, and daf‐16 mutants expressing sre‐1p::daf‐16 cDNA (ADL). n = 70. *P < 0.05 (Dunnett's test).
We next tested daf‐16, a major downstream target of daf‐2, and found that the mutation of daf‐16 increased ascr#3 avoidance behavior under well‐fed conditions (Figs 4C and D, and EV3A). Furthermore, we found that this increased ascr#3 avoidance in daf‐16 mutants was maintained under starved conditions (Fig EV3A). SNB‐1 level in ADL was increased in daf‐16 mutants (Fig 4B), and daf‐16;daf‐2 double mutants showed increased ascr#3 avoidance and SNB‐1 level similar to that seen in daf‐16 mutants (Fig 4B and D). The expression of daf‐16 cDNA isoform(a) in ADL rescued the ascr#3 avoidance and SNB‐1 level phenotypes of daf‐16 mutants (Fig 4B and E). These results indicate that daf‐16 antagonizes daf‐2 function cell autonomously in ADL to regulate ascr#3 avoidance and the expression of ADL synaptic proteins. However, ascr#3 avoidance was unaltered in the mutants of a NRF transcription factor/skn‐1, which is another downstream factor to daf‐2 (Fig EV3B; Ewald et al, 2015), suggesting a specific role of daf‐16 in daf‐2‐mediated ascr#3 avoidance. Taken together, these results further suggest that the DAF‐2/AGE‐1/AKT‐1/DAF‐16 signaling pathway mediates feeding state‐dependent modulation of ascr#3 avoidance by regulating synaptic outputs of ADL.
Figure EV3. ascr#3 avoidance behaviors of daf‐16 mutants and of skn‐1 mutants.

-
A, BFraction reversing of daf‐16 mutants (A) and skn‐1 mutants (B) in response to 100, 200, and 400 nM ascr#3 under fed conditions. (A) n = 60, *P < 0.05 (Bonferroni's test). (B) n = 40–50.
Intestinal INS‐18 insulin‐like peptide modulates ascr#3 avoidance behavior by inhibiting DAF‐2 signaling in ADL
Next, we sought to identify how feeding status regulates DAF‐2 signaling in the ADL sensory neurons. We first searched for ligands for DAF‐2 insulin‐like receptor by screening a subset of insulin‐like peptide (ILPs) mutants including ins‐1, ins‐7, ins‐18, ins‐22, ins‐32, ins‐35, and daf‐28 in well‐fed conditions. We found that ins‐1 and ins‐18 mutants showed decreased and increased ascr#3 avoidance, respectively, but other mutants did not exhibit altered ascr#3 avoidance (Fig 5A). We then generated daf‐16;ins‐1 double mutants and found that these double mutants showed decreased ascr#3 avoidance, comparable to that of ins‐1 mutants (Fig 5B), indicating that ins‐1 may function in parallel to or downstream of daf‐2/daf‐16 to regulate ascr#3 avoidance. We next tested daf‐2;ins‐18 double mutants and found that daf‐2 mutation suppressed the increase of ascr#3 avoidance in ins‐18 mutants (Fig 5C). In addition, ins‐18 mutants showed increased SNB‐1 level in ADL, and daf‐2 mutation abolished increased SNB‐1 level in ins‐18 mutants (Fig 5D and E). These results suggest that INS‐18 acts upstream of DAF‐2 signaling and that INS‐18 antagonizes the DAF‐2 function.
Figure 5. INS‐18, which is secreted in the intestine, inhibits DAF‐2 signaling in ADL .
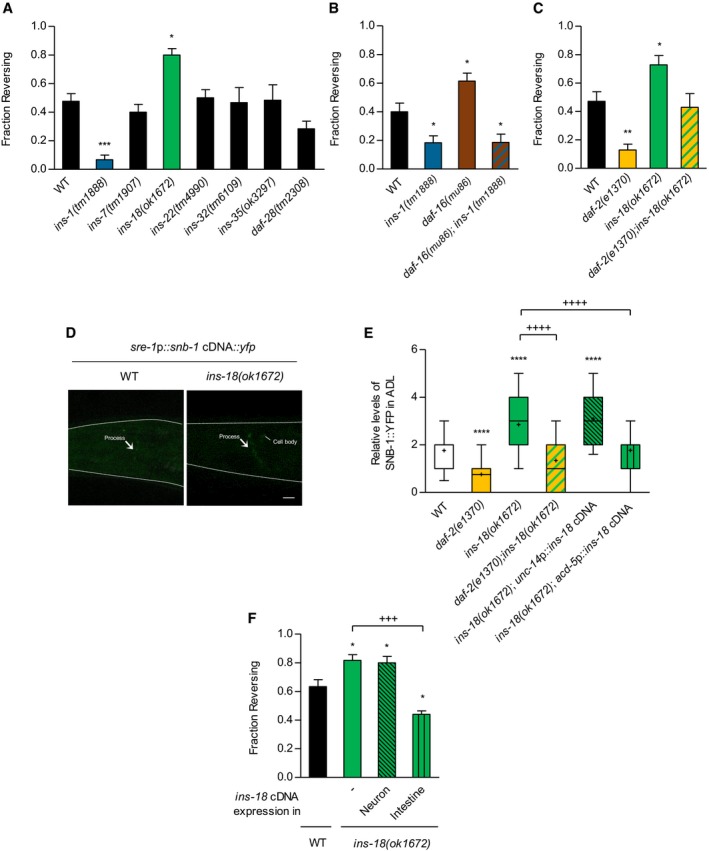
- Fraction reversing of insulin‐like peptide mutants, ins‐1, ins‐7, ins‐18, ins‐22, ins‐32, ins‐35, and daf‐28 in response to ascr#3. n = 40–170. *P < 0.05 and ***P < 0.001 (Dunnett's test).
- Fraction reversing of wild‐type animals, ins‐1 mutants, daf‐16 mutants, and daf‐16;ins‐1 double mutants in response to ascr#3. n = 60–70. *P < 0.05 (Dunnett's test).
- Fraction reversing of wild‐type animals, daf‐2 mutants, ins‐18 mutants, and daf‐2;ins‐18 double mutants in response to ascr#3. n = 70. *P < 0.05 and **P < 0.01 (Dunnett's test).
- Representative images of wild‐type animals (right) and ins‐18 mutants (left) expressing sre‐1p::snb‐1 cDNA::yfp. Scale bar is 10 μm.
- Relative fluorescence intensity of sre‐1p::snb‐1 cDNA::yfp in wild‐type animals, daf‐2 mutants, ins‐18 mutants, daf‐2;ins‐18 double mutants, and ins‐18 mutants expressing unc‐14p::ins‐18 cDNA (neuron) and acd‐5p::ins‐18 cDNA (intestine). n = 35–75. ****P < 0.0001 (Dunnett's test). ++++ P < 0.0001 (unpaired Student's test). Tops and bottoms of boxes indicate the 25th and 75th percentiles, respectively; whiskers represent 10th–90th percentile. Median is indicated by a horizontal line, and the average is marked by “+” in the box.
- Fraction reversing of wild‐type animals, ins‐18 mutants, and ins‐18 mutants expressing unc‐14p::ins‐18 cDNA (neuron), and ins‐18 mutants expressing acd‐5p::ins‐18 cDNA (intestine). n = 60. *P < 0.05 (Dunnett's test). +++ P < 0.001 (unpaired Student's test).
Previously, the ins‐18 gene has been shown to be expressed in the neurons and intestine of C. elegans (Pierce et al, 2001; Matsunaga et al, 2012; Ritter et al, 2013; Hung et al, 2014). To identify the sites of action of ins‐18, we expressed ins‐18 cDNA under the pan‐neural unc‐14 or rgef‐1 promoter and the intestinal acd‐5 promoter in ins‐18 mutants (Fig EV4A). The unc‐14, rgef‐1, and acd‐5 genes encode a RUN domain‐containing protein, a Ras guanine nucleotide releasing protein, and an ortholog of the human sodium channels epithelial gene, respectively (Ogura et al, 1997; Altun‐Gultekin et al, 2001; Camon et al, 2003). Interestingly, we found that intestinal expression, but not neuronal expression of ins‐18 cDNA fully restored ascr#3 avoidance and SNB‐1 level in ins‐18 mutants (Figs 5E and F, and EV4B), suggesting that the ins‐18 gene expressed in the intestine regulates ascr#3 avoidance by antagonizing DAF‐2 signaling in ADL.
Figure EV4. Expression pattern of acd‐5 promoter in the intestine and neuronal rescue of ins‐18 phenotype.
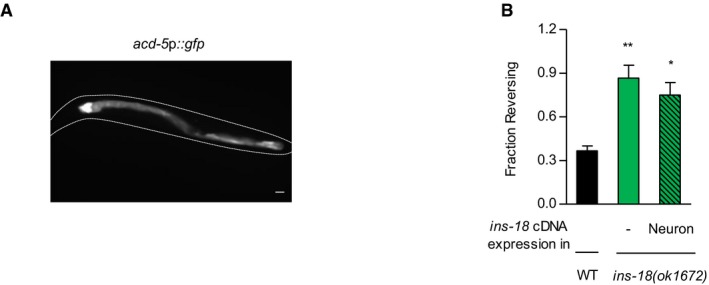
- A representative image of a transgenic animal expressing acd‐5p::gfp. Scale bar is 10 μm.
- Fraction reversing of wild‐type animals, ins‐18 mutants, and ins‐18 mutants expressing su006(rgef‐1)p::ins‐18 cDNA::gfp (neuron). n = 30–40. *P < 0.05 and **P < 0.01 (Dunnett's test).
Feeding state regulates secretion of intestinal INS‐18
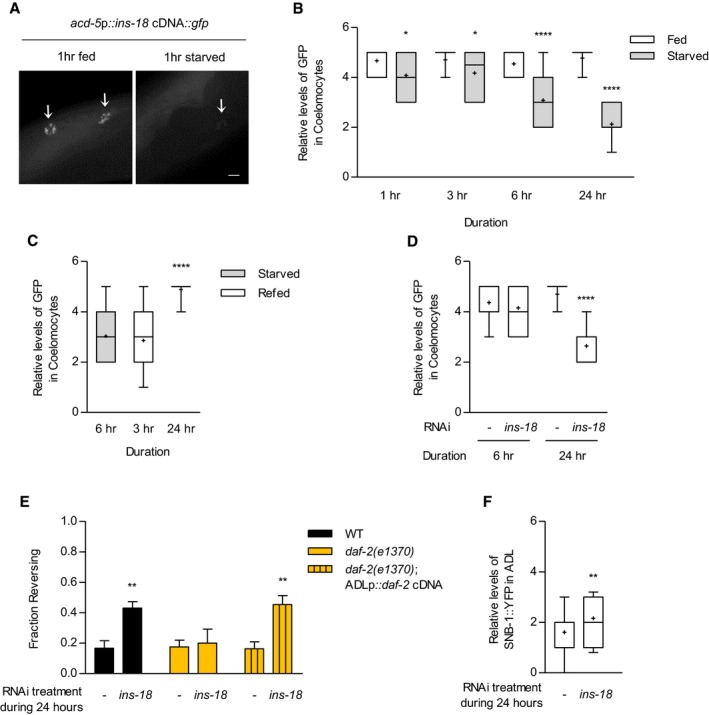
Since intestinal INS‐18 non‐cell autonomously modulates the DAF‐2/DAF‐16 pathway in ADL, we wondered if intestinal ins‐18 expression could be changed by feeding state. However, as previously reported, ins‐18 expression in the intestine, which was monitored by the expression of ins‐18p::gfp transgene, was unaltered upon starvation (Fig EV5A; Ritter et al, 2013). We next examined whether INS‐18 is released from the intestine under fed and starved conditions by measuring GFP accumulation in coelomocytes of transgenic animals expressing functional acd‐5p::ins‐18 cDNA::gfp (Hung et al, 2014). Coelomocytes are scavenger cells that uptake secreted proteins into body cavity, and thus, secreted proteins such as ILPs appear to be accumulated in coelomocytes (Fares & Greenwald, 2001; Sieburth et al, 2007). We found that INS‐18::GFP was consistently accumulated in fed animals (Fig 6A and B). However, INS‐18::GFP accumulation was gradually decreased from 1 to 24 h of starvation (Fig 6A and B). Moreover, this decreased INS‐18 secretion was restored by 24 h of re‐feeding (Fig 6C), suggesting that feeding state regulates the secretion of intestinal INS‐18. To further investigate the roles of INS‐18 secretion on the modulation of DAF‐2 pathway in ADL, we temporarily knocked down ins‐18 function for 6 and 24 h using RNA interference (RNAi). Although ins‐18 knockdown for 6 h did not alter intestinal INS‐18 release which is probably due to insufficient time for RNAi for 6‐h mimicking starvation for 6 h (Kamath et al, 2003), ins‐18 knockdown for 24 h decreased intestinal INS‐18 release and improved ascr#3 avoidance, as observed in starved animals (Fig 6D and E). We next knocked down ins‐18 for 24 h in daf‐2 mutant animals. Similar to the effects on ins‐18 mutants, daf‐2 mutation suppressed the increase of ascr#3 avoidance in ins‐18 RNAi‐treated worms, and the expression of daf‐2 cDNA in ADL restored the enhanced ascr#3 avoidance in ins‐18 RNAi‐treated daf‐2 mutants (Fig 6E). In addition, ins‐18 RNAi for 24 h also increased SNB‐1 level in ADL (Fig 6F). In summary, these results indicate that temporal regulation of INS‐18 secretion from the intestine plays a major role in feeding state‐dependent ascr#3 avoidance mediated by ADL.
Figure EV5. Expression of ins‐18 promoter upon starvation.
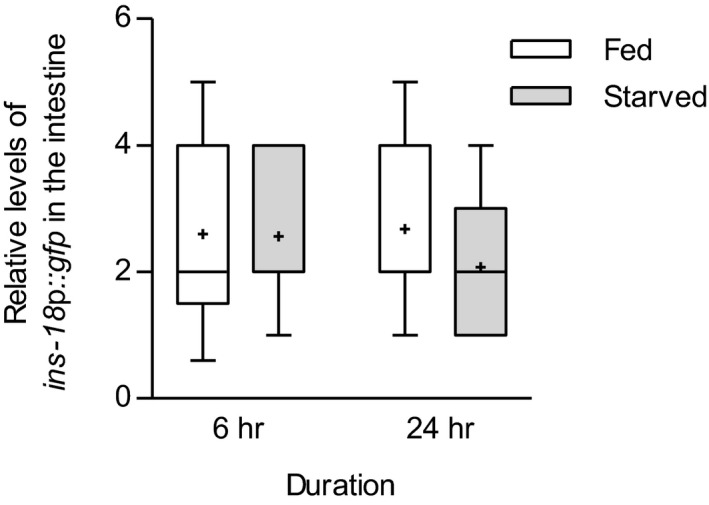
Relative fluorescence intensity of expressing ins‐18p::gfp in the intestine in 6‐h and 24‐h fed and starved conditions. n = 25–40. Tops and bottoms of boxes indicate the 25th and 75th percentiles, respectively; whiskers represent 10th–90th percentile. Median is indicated by a horizontal line, and the average is marked by “+” in the box.
Figure 6. Intestinal INS‐18 secretion modulates ascr#3 avoidance in a feeding state‐dependent fashion.
-
ARepresentative images of transgenic animals expressing acd‐5p::ins‐18 cDNA::gfp at 1‐h fed and starved conditions. Arrows indicate coelomocyte. Scale bar is 10 μm.
-
B, CRelative fluorescence intensity of the accumulated GFP of transgenic animals expressing acd‐5p::ins‐18 cDNA::gfp in coelomocytes at different times after feeding, starving (B), and re‐feeding conditions (C). n = 39–50. (B) *P = 0.05 and ****P < 0.0001 (Bonferroni's test). (C) ****P < 0.0001 (Dunnett's test).
-
DRelative fluorescence intensity of the accumulated GFP of transgenic animals expressing acd‐5p::ins‐18 cDNA::gfp in coelomocytes under ins‐18 RNAi treatment. n = 36–59. ****P < 0.0001 (Bonferroni's test).
-
EFraction reversing of wild‐type animals, daf‐2 mutants, and daf‐2 mutants expressing sre‐1p::daf‐2 cDNA treated with ins‐18 RNAi for 24 h. n = 80–100. **P < 0.01 (Bonferroni's test).
-
FRelative fluorescence intensity of wild‐type animals expressing sre‐1p::snb‐1 cDNA::yfp in 24 h‐ins‐18 RNAi condition. n = 57–58. **P < 0.01 (unpaired Student's t‐test).
Discussion
In this study, we analyzed the mechanisms underlying the modulation of ascr#3 avoidance behaviors by feeding status. Our data support a model in which prolonged starvation decreases secretion of INS‐18 insulin‐like peptide from the intestine, and INS‐18 antagonistically acts on DAF‐2 insulin‐like pathway in ascr#3‐sensing ADL neurons, which regulate the strength of ADL synaptic outputs and thus ascr#3 avoidance behaviors (Fig 7). ascr#3 is the potent aversive pheromone in C. elegans hermaphrodites representing harsh conditions of overcrowding (Jang et al, 2012; Hong et al, 2017). Thus, starved animals may enhance avoidance behavior for harsh conditions to find more affordable conditions.
Figure 7. A model for feeding state‐dependent modulation of ascr#3 avoidance behaviors.
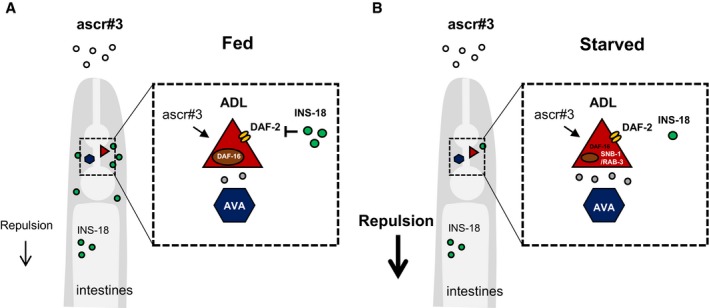
- In fed conditions, INS‐18 released from the intestine blocks the activity of DAF‐2 signaling in ADL, which suppresses chemical synaptic transmission in ADL and decreases avoidance behavior to ascr#3.
- In starved conditions, secretion of INS‐18 from the intestine is decreased, which activates the DAF‐2 signaling of ADL, resulting in increase in synaptic release from ADL to downstream neurons, and promotes enhanced avoidance behavior to ascr#3.
In Drosophila, insulin signaling also regulates feeding state‐dependent chemosensory responses. For example, flies starved for over 4 h exhibit increased attractive behaviors to food odorants, including vinegar (Root et al, 2011; Ko et al, 2015). These behavioral changes are mediated by increased synaptic activities of vinegar‐responsive olfactory sensory neurons (OSNs) to downstream target neurons, which are facilitated by increased expression of the short neuropeptide F receptor sNPFR1 in the same OSNs. Starvation appears to decrease circulating insulin level which subsequently increases sNPFR1 expression via insulin receptor activity in OSNs, causing enhanced synaptic transmission of OSNs and the consequent attraction behaviors (Root et al, 2011). Thus, these basic endocrine and circuit mechanisms underlying prolonged starvation‐induced behavioral changes in Drosophila are comparable to those identified by us in C. elegans, suggesting an evolutionarily conserved mechanisms underlying feeding state‐dependent behavioral plasticity.
It was previously shown that an insulin‐like peptide, INS‐1, regulates food‐related odor responses in C. elegans (Chalasani et al, 2010). In ins‐1 mutants, Ca2+ activities of the AWC olfactory neurons in response to food‐related odorants are increased, and thus, AWC‐mediated behaviors are enhanced, suggesting that similar to negative regulatory role of INS‐18 in the ADL neuronal activities found in our study, INS‐1 dampens the activities of the AWC olfactory neurons (Chalasani et al, 2010). Here, we also found distinct roles of INS‐1 in ascr#3 avoidance, which is strongly decreased in ins‐1 mutants, suggesting a positive regulatory role of INS‐1 in ascr#3 avoidance behaviors (Fig 5A). Since INS‐1 acts in AWC post‐synaptic target AIA interneurons to regulate AWC activities in feedback loop, it is intriguing to identify where INS‐1 acts and how INS‐1 interacts with INS‐18 to regulate ascr#3 avoidance.
Park et al (2017) showed that C. elegans hermaphrodites avoid high concentration of ascr#1 (daumone‐1) and ascr#2, in addition to ascr#3. Moreover, avoidance to these three pheromones is decreased in daf‐16 mutants but not altered in daf‐2 mutants, which is different from what we found in this study: ascr#3 avoidance is increased in daf‐16 mutants of which mutations suppressed decreased ascr#3 avoidance in daf‐2 mutants. In addition, we and other laboratories have not observed ascr#2 avoidance (Jang et al, 2012; Hong et al, 2017). This discrepancy could be due to different assay systems used in these studies; we performed the drop assay with a single animal, whereas Park et al mainly used the classic chemotaxis assay with population animals. The drop assay detects acute avoidance within 1 s upon direct pheromone exposure to animals, whereas classic population assay determines stationary response to the concentration gradient of a chemical in an hour; thus, the results from these assays may reflect different aspects of avoidance responses to pheromones (Bargmann et al, 1993; Jang & Bargmann, 2013). Other possibilities are different genetic backgrounds of wild‐type and mutant animals and/or quality and quantity of reagents, including pheromones, used (Lucanic et al, 2017). It would be intriguing to explore this problem in the future.
Previously, Gruner et al (2014, 2016) showed that the expression of the ADL‐specific chemoreceptor gene, srh‐234, is also regulated by the feeding state of an animal and insulin signaling. Prolonged starvation causes downregulation of the srh‐234 gene expression, which appears to be mediated by daf‐2 in the daf‐16‐dependent manner acting in ADL. Compared to our studies wherein prolonged starvation increased daf‐2 signaling in the ADL neurons to increase ascr#3 avoidance behavior, the starvation condition decreased daf‐2 signaling in the ADL neurons to decrease srh‐234 expression (Gruner et al, 2014). In addition, mutually exclusive sets of insulin‐like peptides, most of which seem to be secreted from the intestine, are involved: INS‐18 and INS‐1 for ascr#3 avoidance and INS‐3, INS‐7, INS‐21, INS‐26, and INS‐28 for the srh‐234 gene expression in the ADL neurons (Gruner et al, 2016). Moreover, srh‐234 expression is further regulated by multiple signaling pathways, including the NPR‐1 neuropeptide, KIN‐29 salt‐inducible kinase, and OCR‐2 TRPV channels, as well as the presence of food (Gruner et al, 2014). Moreover, the expression of another ADL‐expressed gene, srh‐34, is upregulated by starvation (Gruner et al, 2014). Therefore, their results together with our results suggest a multitude of complexity in the function of and/or gene expression in the ADL sensory neurons. Investigating ascr#3 avoidance behaviors in other internal and external contexts and identifying srh‐234 gene function would be the next step to address different roles of insulin signaling in between ascr#3 avoidance and srh‐234 gene expression.
Neuromodulatory systems in the intestine‐sensory neuron axis play key roles to integrate feeding state with external environmental cues and shape the activities of peripheral as well as central system to generate appropriate behavioral outcomes. Our study showed that systemic circuit mechanisms underlie feeding state‐dependent modulation of synaptic activities at the sensory level and suggest C. elegans as a good model system to further study this type of behavioral plasticity.
Materials and Methods
Strains and constructs
N2 strain was used as the wild‐type animals. All strains were maintained on Escherichia coli OP50‐seeded NGM plates at 20°C (Brenner, 1974). The strains used in this study are listed in Table EV1.
pJH664 (rgef‐1p::daf‐2 cDNA), pVDL14 (sre‐1p::daf‐2 cDNA, SL2::mCherry), and pMG14 (sre‐1p::daf‐16a cDNA, SL2::mCherry), which were kind gifts from Mei Zhen and Alexander van der Linden, were used for daf‐2 and daf‐16 rescue in pan‐neuronal and ADL experiments. ins‐18 cDNA was amplified and inserted into pMC10 vector using the restriction enzymes AgeI and NotI, and the promoter region of unc‐14 or acd‐5 was placed into the plasmids using the each pairs of enzymes—HindIII and BamHI or SphI and XmaI for ins‐18 cDNA expression in neuron and the intestine, respectively.
sre‐1p::mCherry::rab‐3 cDNA was prepared by exchanging the promoter region of MVC016 (nlp::mCherry::rab‐3 cDNA, a kind gift from Miri VanHoven) via restriction enzyme sites of SphI and SmaI, and sre‐1p::snb‐1 cDNA::yfp were constructed from PCZ530 (unc‐25p::snb‐1 cDNA::yfp, a kind gift from Yishi Jin).
sre‐1p::gfp and sre‐1p::mCherry transgenes were produced by cutting the sre‐1 promoter from sre‐1p::GCaMP3 and subcloning into pPD95.77 or MC10 vector which contains gfp and mCherry through enzyme target sites HindIII and BamHI.
ins‐18 cDNA::gfp was extracted from pJH1498 (su006p::ins‐18 cDNA::gfp, a kind gift by Mei Zhen) and was attached to acd‐5 promoter in MC10 vector.
All plasmids were injected at 5–15 ng (rescue experiments) and 50 ng (expression analysis) with unc‐122p::gfp or unc‐122p::dsRed, which were injection markers.
ascr#3 avoidance assay
ascr#3 avoidance assay was modified from a previously described drop assay (Jang et al, 2012; Hong et al, 2017). All assays were performed in the absence of food at 20°C. We usually used 500 nM ascr#3, which was diluted into M13 buffer, in the assay, except under the conditions of Fig 1B–D and G, and EV1D wherein 100 nM ascr#3 was applied, and those of Figs 1E and EV3A and B, wherein 100, 200, and 400 nM ascr#3 were applied (detailed ascr#3 concentration was noted in figure legends). In the assay, young adult animals were transformed onto non‐seeded plates. M13 buffer was delivered on the tip of the head, and if the animals did not response to M13 buffer for 10 s, we dropped ascr#3 on the freely moving animal's head. Short or long reversals were defined as reversals with fewer than two head bends or more than two head bends, respectively. Long reversal responding to ascr#3 within 4 s was counted as an avoidance behavior.
Starvation assay
The starvation assay was based on a previously described method (Gruner et al, 2014). Ten young adults were placed on an OP50 seeded plate for egg laying and discarded in 2–4 h to synchronize animal stage. The animals were grown at 20°C for about 3 days, washed with distilled water, and placed onto seeded or non‐seeded plates for 3, 6, and 24 h. For re‐feeding OP50, animals starved for 6 h were transferred onto a seeded plate, and ascr#3 avoidance was tested for 3, 6, and 24 h, respectively.
In vivo Ca2+ imaging
We followed a previously published in vivo Ca2+ imaging protocol (Jang et al, 2012). Custom‐made microfluidic chips were processed as previously described (Chronis et al, 2007). GCaMP3 attached with the promoter of sre‐1 and nmr‐1 was utilized for ADL and AVA imaging, respectively. In the imaging processes, the transgenic animals were exposed to fluorescence light for 1–2 min, and the images were taken during 1 min under fixed exposure time using 40× objective of a Zeiss Axioplan microscope with a Zeiss AxioCam HR. We used Image J and custom‐written MATLAB to analyze the acquired images. More specifically, the cell body area of an ADL neuron was selected as the region of interest and a similar sized area near the cell body was selected as the background. Average fluorescence intensities in the first 5 s of imaging were used for normalization to calculate ΔF/F. The peak of “ΔF/F” represented maximum ΔF/F during the first ascr#3 exposure, and these data were averaged to obtain the average peak of ΔF/F.
Fluorescence quantification
The expression of sre‐1p::gfp and sre‐1p::mCherry was measured by grading the fluorescence brightness from 0 to 5 (as assessed by the naked eye), in the increasing order, following expressions in cell body and processes of ADL. For example, strongly bright fluorescence in both the soma and processes was ranked as 4 or 5. The expression without GFP reflection in the soma and processes was graded as 3. Weak expression in the soma but not in the process was ranked as 1 or 2.
The intensity of snb‐1 cDNA and rab‐3 cDNA in ADL was examined by monitoring the expression of puncta in ADL processes located in the middle of the nerve ring where ADL has synaptic connections to AVA (White et al, 1986). When SNB‐1 or RAB‐3 proteins were localized in both the soma and processes (Fig 3A: RAB‐3 expression in wild‐type animals), we counted the brightness as 4 or 5. Brightness was ranked as 3 for visual fluorescence expression in ADL processes but not in the soma. Brightness level 1 and 2 represented faint or dim fluorescent expression in the middle of the process in ADL.
To quantify expression levels of SNB‐1::YFP and mCherry::RAB‐3 represented in Fig EV2B and C, we captured images of sre‐1p::snb‐1 cDNA::yfp and sre‐1p::mCherry::rab‐3 cDNA expression in the ADL neurons with a Zeiss Axioplan microscope using a 40× objective and a CCD camera (Hamamatsu). Then, we measured fluorescence levels using Image J software (https://imagej.nih.gov/ij/index.html).
The quantifications of the expressions of sre‐1p::gfp, sre‐1p::mCherry, sre‐1p::snb‐1 cDNA::yfp, sre‐1p::mCherry::rab‐3 cDNA, and acd‐5p::gfp::ins‐18 cDNA were performed under a 40× objective lens of Zeiss Axioplan microscopy, except for the images of acd‐5p::gfp, which were acquired under a 10× objective lens.
The representative images were obtained using Zeiss LSM700/780 confocal microscope and Zeiss Axioplan microscope, and the acquired images were edited using ZEN 2010 light edition software and ImageJ.
ins‐18 RNAi treatment
We followed a previously described RNAi feeding method (Kamath et al, 2003). ins‐18 RNAi was kindly provided by Jeong‐Hoon Hahm. NGM plates that contained IPTG were seeded using bacteria HT115 or HT115 containing ins‐18 RNAi grown in LB broth; they were then placed at room temperature for ~ 2 days in the dark. Young adult animals were placed onto the IPTG plates seeded for 6 and 24 h. Then, we examined rates of SNB‐1::YFP in ADL and avoidance behaviors using 500 nM ascr#3.
Statistical analysis
All statistical analyses were performed using the software Prism 5.0/7.0. Difference of two groups of subjects was evaluated using a two‐tailed unpaired Student's t‐test. One‐way ANOVA test analyzed more than multiple subjects, such as Dunnett's test (individual comparisons) and Bonferroni's test (paired group comparisons). SEM is indicated by error bars in each graph. More statistical information is represented in all figure legends.
Author contributions
LR, YJC, and YHH performed the experiments; SP, SC, HC, and RAB provided reagents; LR, YHH, and KK analyzed and interpreted data; and LR and KK wrote the manuscript.
Conflict of interest
The authors declare that they have no conflict of interest.
Supporting information
Expanded View Figures PDF
Table EV1
Review Process File
Acknowledgements
We thank Oliver Hobert, Cornelia Bargmann, Yishi Jin, Alexander van der Linden, and Mei Zhen for reagents and the Caenorhabditis Genetics Center (NIH Office of Research Infrastructure Programs, P40 OD010440) and the National BioResource Project (Japan) for strains. We also thank and Alexander van der Linden, Jeong‐Hoon Hahm, Young‐Jae You, Sunkyung Lee, Seung‐Jae V. Lee, S.V. Lee laboratory members, and K. Kim laboratory members for helpful comments and discussion on the manuscript. This work was supported by the KBRI Basic Research Program of the Ministry of Science, ICT and Future Planning (17‐BR‐04), the National Research Foundation of Korea (NRF‐2015R1D1A1A09061430, NRF‐2017R1A4A1015534), and DGIST R&D Program of the Ministry of Science, ICT and Future Planning (17‐BD‐06) (K.K.), the KBSI grant (#T37416) (Y.H.H), and NIH GM087533 and GM118775 (R.A.B).
The EMBO Journal (2018) 37: e98402
References
- Altun‐Gultekin Z, Andachi Y, Tsalik EL, Pilgrim D, Kohara Y, Hobert O (2001) A regulatory cascade of three homeobox genes, ceh‐10, ttx‐3 and ceh‐23, controls cell fate specification of a defined interneuron class in C. elegans . Development 128: 1951–1969 [DOI] [PubMed] [Google Scholar]
- Avery L, Thomas JH (1997) Feeding and defecation In C. elegans II, Riddle DL, Blumenthal T, Meyer BJ, Priess JR. (eds), pp 679–716. Cold Spring Harbor, NY: Cold Spring Harbor Laboratory Press; [PubMed] [Google Scholar]
- Bargmann CI, Hartwieg E, Horvitz HR (1993) Odorant‐selective genes and neurons mediate olfaction in C. elegans . Cell 74: 515–527 [DOI] [PubMed] [Google Scholar]
- Brenner S (1974) The genetics of Caenorhabditis elegans . Genetics 77: 71–94 [DOI] [PMC free article] [PubMed] [Google Scholar]
- Butcher RA, Fujita M, Schroeder FC, Clardy J (2007) Small‐molecule pheromones that control dauer development in Caenorhabditis elegans . Nat Chem Biol 3: 420–422 [DOI] [PubMed] [Google Scholar]
- Camon E, Magrane M, Barrell D, Binns D, Fleischmann W, Kersey P, Mulder N, Oinn T, Maslen J, Cox A, Apweiler R (2003) The Gene Ontology Annotation (GOA) project: implementation of GO in SWISS‐PROT, TrEMBL, and InterPro. Genome Res 13: 662–672 [DOI] [PMC free article] [PubMed] [Google Scholar]
- Chalasani SH, Kato S, Albrecht DR, Nakagawa T, Abbott LF, Bargmann CI (2010) Neuropeptide feedback modifies odor‐evoked dynamics in Caenorhabditis elegans olfactory neurons. Nat Neurosci 13: 615–621 [DOI] [PMC free article] [PubMed] [Google Scholar]
- Chalfie M, Sulston JE, White JG, Southgate E, Thomson JN, Brenner S (1985) The neural circuit for touch sensitivity in Caenorhabditis elegans . J Neurosci 5: 956–964 [DOI] [PMC free article] [PubMed] [Google Scholar]
- Chronis N, Zimmer M, Bargmann CI (2007) Microfluidics for in vivo imaging of neuronal and behavioral activity in Caenorhabditis elegans . Nat Methods 4: 727–731 [DOI] [PubMed] [Google Scholar]
- Colbert HA, Bargmann CI (1997) Environmental signals modulate olfactory acuity, discrimination, and memory in Caenorhabditis elegans . Learn Mem 4: 179–191 [DOI] [PubMed] [Google Scholar]
- Critchley HD, Rolls ET (1996) Hunger and satiety modify the responses of olfactory and visual neurons in the primate orbitofrontal cortex. J Neurophysiol 75: 1673–1686 [DOI] [PubMed] [Google Scholar]
- Edison AS (2009) Caenorhabditis elegans pheromones regulate multiple complex behaviors. Curr Opin Neurobiol 19: 378–388 [DOI] [PMC free article] [PubMed] [Google Scholar]
- Engelman JA, Luo J, Cantley LC (2006) The evolution of phosphatidylinositol 3‐kinases as regulators of growth and metabolism. Nat Rev Genet 7: 606–619 [DOI] [PubMed] [Google Scholar]
- Ewald CY, Landis JN, Porter Abate J, Murphy CT, Blackwell TK (2015) Dauer‐independent insulin/IGF‐1‐signalling implicates collagen remodelling in longevity. Nature 519: 97–101 [DOI] [PMC free article] [PubMed] [Google Scholar]
- Ezcurra M, Tanizawa Y, Swoboda P, Schafer WR (2011) Food sensitizes C. elegans avoidance behaviours through acute dopamine signalling. EMBO J 30: 1110–1122 [DOI] [PMC free article] [PubMed] [Google Scholar]
- Ezcurra M, Walker DS, Beets I, Swoboda P, Schafer WR (2016) Neuropeptidergic signaling and active feeding state inhibit nociception in Caenorhabditis elegans . J Neurosci 36: 3157–3169 [DOI] [PMC free article] [PubMed] [Google Scholar]
- Fadool DA, Tucker K, Phillips JJ, Simmen JA (2000) Brain insulin receptor causes activity‐dependent current suppression in the olfactory bulb through multiple phosphorylation of Kv1.3. J Neurophysiol 83: 2332–2348 [DOI] [PMC free article] [PubMed] [Google Scholar]
- Fares H, Greenwald I (2001) Genetic analysis of endocytosis in Caenorhabditis elegans: coelomocyte uptake defective mutants. Genetics 159: 133–145 [DOI] [PMC free article] [PubMed] [Google Scholar]
- Gruner M, Nelson D, Winbush A, Hintz R, Ryu L, Chung SH, Kim K, Gabel CV, van der Linden AM (2014) Feeding state, insulin and NPR‐1 modulate chemoreceptor gene expression via integration of sensory and circuit inputs. PLoS Genet 10: e1004707 [DOI] [PMC free article] [PubMed] [Google Scholar]
- Gruner M, Grubbs J, McDonagh A, Valdes D, Winbush A, van der Linden AM (2016) Cell‐autonomous and non‐cell‐autonomous regulation of a feeding state‐dependent chemoreceptor gene via MEF‐2 and bHLH transcription factors. PLoS Genet 12: e1006237 [DOI] [PMC free article] [PubMed] [Google Scholar]
- Hills T, Brockie PJ, Maricq AV (2004) Dopamine and glutamate control area‐restricted search behavior in Caenorhabditis elegans . J Neurosci 24: 1217–1225 [DOI] [PMC free article] [PubMed] [Google Scholar]
- Hong M, Ryu L, Ow MC, Kim J, Je AR, Chinta S, Huh YH, Lee KJ, Butcher RA, Choi H, Sengupta P, Hall SE, Kim K (2017) Early pheromone experience modifies a synaptic activity to influence adult pheromone responses of C. elegans . Curr Biol 27: 3168–3177 [DOI] [PMC free article] [PubMed] [Google Scholar]
- Hung WL, Wang Y, Chitturi J, Zhen M (2014) A Caenorhabditis elegans developmental decision requires insulin signaling‐mediated neuron‐intestine communication. Development 141: 1767–1779 [DOI] [PMC free article] [PubMed] [Google Scholar]
- Jang H, Kim K, Neal SJ, Macosko E, Kim D, Butcher RA, Zeiger DM, Bargmann CI, Sengupta P (2012) Neuromodulatory state and sex specify alternative behaviors through antagonistic synaptic pathways in C. elegans . Neuron 75: 585–592 [DOI] [PMC free article] [PubMed] [Google Scholar]
- Jang H, Bargmann CI (2013) Acute behavioral responses to pheromones in C. elegans (adult behaviors: attraction, repulsion). Methods Mol Biol 1068: 285–292 [DOI] [PubMed] [Google Scholar]
- Jeong PY, Jung M, Yim YH, Kim H, Park M, Hong E, Lee W, Kim YH, Kim K, Paik YK (2005) Chemical structure and biological activity of the Caenorhabditis elegans dauer‐inducing pheromone. Nature 433: 541–545 [DOI] [PubMed] [Google Scholar]
- Kamath RS, Fraser AG, Dong Y, Poulin G, Durbin R, Gotta M, Kanapin A, Le Bot N, Moreno S, Sohrmann M, Welchman DP, Zipperlen P, Ahringer J (2003) Systematic functional analysis of the Caenorhabditis elegans genome using RNAi. Nature 421: 231–237 [DOI] [PubMed] [Google Scholar]
- Kimura KD, Tissenbaum HA, Liu Y, Ruvkun G (1997) daf‐2, an insulin receptor‐like gene that regulates longevity and diapause in Caenorhabditis elegans . Science 277: 942–946 [DOI] [PubMed] [Google Scholar]
- Ko KI, Root CM, Lindsay SA, Zaninovich OA, Shepherd AK, Wasserman SA, Kim SM, Wang JW (2015) Starvation promotes concerted modulation of appetitive olfactory behavior via parallel neuromodulatory circuits. eLife 4: e08298 [DOI] [PMC free article] [PubMed] [Google Scholar]
- Lacroix MC, Badonnel K, Meunier N, Tan F, Schlegel‐Le Poupon C, Durieux D, Monnerie R, Baly C, Congar P, Salesse R, Caillol M (2008) Expression of insulin system in the olfactory epithelium: first approaches to its role and regulation. J Neuroendocrinol 20: 1176–1190 [DOI] [PubMed] [Google Scholar]
- Lakowski B, Hekimi S (1998) The genetics of caloric restriction in Caenorhabditis elegans . Proc Natl Acad Sci USA 95: 13091–13096 [DOI] [PMC free article] [PubMed] [Google Scholar]
- Lemieux GA, Ashrafi K (2015) Neural regulatory pathways of feeding and fat in Caenorhabditis elegans . Annu Rev Genet 49: 413–438 [DOI] [PubMed] [Google Scholar]
- Lopez AL, Chen J, Joo HJ, Drake M, Shidate M, Kseib C, Arur S (2013) DAF‐2 and ERK couple nutrient availability to meiotic progression during Caenorhabditis elegans oogenesis. Dev Cell 27: 227–240 [DOI] [PMC free article] [PubMed] [Google Scholar]
- Lucanic M, Plummer WT, Chen E, Harke J, Foulger AC, Onken B, Coleman‐Hulbert AL, Dumas KJ, Guo S, Johnson E, Bhaumik D, Xue J, Crist AB, Presley MP, Harinath G, Sedore CA, Chamoli M, Kamat S, Chen MK, Angeli S et al (2017) Impact of genetic background and experimental reproducibility on identifying chemical compounds with robust longevity effects. Nat Commun 8: 14256 [DOI] [PMC free article] [PubMed] [Google Scholar]
- Macosko EZ, Pokala N, Feinberg EH, Chalasani SH, Butcher RA, Clardy J, Bargmann CI (2009) A hub‐and‐spoke circuit drives pheromone attraction and social behaviour in C. elegans . Nature 458: 1171–1175 [DOI] [PMC free article] [PubMed] [Google Scholar]
- Magni P, Dozio E, Ruscica M, Celotti F, Masini MA, Prato P, Broccoli M, Mambro A, More M, Strollo F (2009) Feeding behavior in mammals including humans. Ann N Y Acad Sci 1163: 221–232 [DOI] [PubMed] [Google Scholar]
- Matsunaga Y, Gengyo‐Ando K, Mitani S, Iwasaki T, Kawano T (2012) Physiological function, expression pattern, and transcriptional regulation of a Caenorhabditis elegans insulin‐like peptide, INS‐18. Biochem Biophys Res Commun 423: 478–483 [DOI] [PubMed] [Google Scholar]
- Mayer EA (2011) Gut feelings: the emerging biology of gut‐brain communication. Nat Rev Neurosci 12: 453–466 [DOI] [PMC free article] [PubMed] [Google Scholar]
- Murphy CT, Hu PJ (2013) Insulin/insulin‐like growth factor signaling in C. elegans . WormBook 1–43 [DOI] [PMC free article] [PubMed] [Google Scholar]
- Nassel DR, Winther AM (2010) Drosophila neuropeptides in regulation of physiology and behavior. Prog Neurobiol 92: 42–104 [DOI] [PubMed] [Google Scholar]
- Noma K, Jin Y (2015) Optogenetic mutagenesis in Caenorhabditis elegans . Nat Commun 6: 8868 [DOI] [PMC free article] [PubMed] [Google Scholar]
- Nonet ML, Staunton JE, Kilgard MP, Fergestad T, Hartwieg E, Horvitz HR, Jorgensen EM, Meyer BJ (1997) Caenorhabditis elegans rab‐3 mutant synapses exhibit impaired function and are partially depleted of vesicles. J Neurosci 17: 8061–8073 [DOI] [PMC free article] [PubMed] [Google Scholar]
- Nonet ML, Saifee O, Zhao H, Rand JB, Wei L (1998) Synaptic transmission deficits in Caenorhabditis elegans synaptobrevin mutants. J Neurosci 18: 70–80 [DOI] [PMC free article] [PubMed] [Google Scholar]
- Ogg S, Ruvkun G (1998) The C. elegans PTEN homolog, DAF‐18, acts in the insulin receptor‐like metabolic signaling pathway. Mol Cell 2: 887–893 [DOI] [PubMed] [Google Scholar]
- Ogura K, Shirakawa M, Barnes TM, Hekimi S, Ohshima Y (1997) The UNC‐14 protein required for axonal elongation and guidance in Caenorhabditis elegans interacts with the serine/threonine kinase UNC‐51. Genes Dev 11: 1801–1811 [DOI] [PubMed] [Google Scholar]
- Palouzier‐Paulignan B, Lacroix MC, Aime P, Baly C, Caillol M, Congar P, Julliard AK, Tucker K, Fadool DA (2012) Olfaction under metabolic influences. Chem Senses 37: 769–797 [DOI] [PMC free article] [PubMed] [Google Scholar]
- Park D, Hahm JH, Park S, Ha G, Chang GE, Jeong H, Kim H, Kim S, Cheong E, Paik YK (2017) A conserved neuronal DAF‐16/FoxO plays an important role in conveying pheromone signals to elicit repulsion behavior in Caenorhabditis elegans . Sci Rep 7: 7260 [DOI] [PMC free article] [PubMed] [Google Scholar]
- Pierce SB, Costa M, Wisotzkey R, Devadhar S, Homburger SA, Buchman AR, Ferguson KC, Heller J, Platt DM, Pasquinelli AA, Liu LX, Doberstein SK, Ruvkun G (2001) Regulation of DAF‐2 receptor signaling by human insulin and ins‐1, a member of the unusually large and diverse C. elegans insulin gene family. Genes Dev 15: 672–686 [DOI] [PMC free article] [PubMed] [Google Scholar]
- Ritter AD, Shen Y, Fuxman Bass J, Jeyaraj S, Deplancke B, Mukhopadhyay A, Xu J, Driscoll M, Tissenbaum HA, Walhout AJ (2013) Complex expression dynamics and robustness in C. elegans insulin networks. Genome Res 23: 954–965 [DOI] [PMC free article] [PubMed] [Google Scholar]
- Root CM, Ko KI, Jafari A, Wang JW (2011) Presynaptic facilitation by neuropeptide signaling mediates odor‐driven food search. Cell 145: 133–144 [DOI] [PMC free article] [PubMed] [Google Scholar]
- Saeki S, Yamamoto M, Iino Y (2001) Plasticity of chemotaxis revealed by paired presentation of a chemoattractant and starvation in the nematode Caenorhabditis elegans . J Exp Biol 204: 1757–1764 [DOI] [PubMed] [Google Scholar]
- Sawin ER, Ranganathan R, Horvitz HR (2000) C. elegans locomotory rate is modulated by the environment through a dopaminergic pathway and by experience through a serotonergic pathway. Neuron 26: 619–631 [DOI] [PubMed] [Google Scholar]
- Sengupta P (2013) The belly rules the nose: feeding state‐dependent modulation of peripheral chemosensory responses. Curr Opin Neurobiol 23: 68–75 [DOI] [PMC free article] [PubMed] [Google Scholar]
- Shen K, Bargmann CI (2003) The immunoglobulin superfamily protein SYG‐1 determines the location of specific synapses in C. elegans . Cell 112: 619–630 [DOI] [PubMed] [Google Scholar]
- Sieburth D, Ch'ng Q, Dybbs M, Tavazoie M, Kennedy S, Wang D, Dupuy D, Rual JF, Hill DE, Vidal M, Ruvkun G, Kaplan JM (2005) Systematic analysis of genes required for synapse structure and function. Nature 436: 510–517 [DOI] [PubMed] [Google Scholar]
- Sieburth D, Madison JM, Kaplan JM (2007) PKC‐1 regulates secretion of neuropeptides. Nat Neurosci 10: 49–57 [DOI] [PubMed] [Google Scholar]
- Trent C, Tsuing N, Horvitz HR (1983) Egg‐laying defective mutants of the nematode Caenorhabditis elegans . Genetics 104: 619–647 [DOI] [PMC free article] [PubMed] [Google Scholar]
- Tsunozaki M, Chalasani SH, Bargmann CI (2008) A behavioral switch: cGMP and PKC signaling in olfactory neurons reverses odor preference in C. elegans . Neuron 59: 959–971 [DOI] [PMC free article] [PubMed] [Google Scholar]
- White JG, Southgate E, Thomson JN, Brenner S (1986) The structure of the nervous system of the nematode Caenorhabditis elegans . Philos Trans R Soc Lond B Biol Sci 314: 1–340 [DOI] [PubMed] [Google Scholar]
Associated Data
This section collects any data citations, data availability statements, or supplementary materials included in this article.
Supplementary Materials
Expanded View Figures PDF
Table EV1
Review Process File


