Abstract
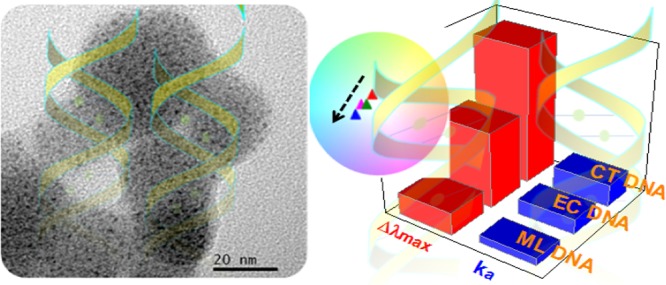
In this work, we report the interaction of a fluorescent ZnO–Au nanocomposite with deoxyribonucleic acid (DNA), leading to AT-specific DNA interaction, which is hitherto not known. For this study, three natural double-stranded (ds) DNAs having different AT:GC compositions were chosen and a ZnO–Au nanocomposite has been synthesized by anchoring a glutathione-protected gold nanocluster on the surface of egg-shell-membrane (ESM)-based ZnO nanoparticles. The ESM-based bare ZnO nanoparticles did not show any selective interaction toward DNA, whereas intrinsic fluorescence of the ZnO–Au nanocomposite shows an appreciable blue shift (Δλmax = 18 nm) in the luminescence wavelength of 520 nm in the presence of ds calf thymus (CT) DNA over other studied DNAs. In addition, the interaction of the nanocomposite through fluorescence studies with single-stranded (ss) CT DNA, synthetic polynucleotides, and nucleobases/nucleotides (adenine, thymine, deoxythymidine monophosphate, deoxyadenosine monophosphate) was also undertaken to delineate the specificity in interaction. A minor blue shift (Δλmax = 5 nm) in the emission wavelength at 520 nm was observed for single-stranded CT DNA, suggesting the proficiency of the nanocomposite for discriminating ss and ds CT DNA. More importantly, fluorescence signals from the nano-bio-interaction could be measured directly without any modification of the target, which is the foremost advantage emanated from this study compared with other previous reports. The AT base-pair-induced enhancement was also found to be highest for the melting temperature of CT DNA (ΔTmCT = 6.7 °C). Furthermore, spectropolarimetric experiments followed by calorimetric analysis provided evidence for specificity in AT-rich DNA interaction. This study would lead to establish the fluorescent ZnO–Au nanocomposite as a probe for nanomaterial-based DNA-binding study, featuring its specific interaction toward AT-rich DNA.
Introduction
The interaction between engineered nanoparticles (NPs) and biomolecules has led to the development of new type of biosensors1,2 and biomolecular targets.3,4 To explore the fundamental5,6 and technological7 aspects of nano-bio-interaction, a broad range of inorganic,8,9 organic,10 and hybrid nanostructures11 or nanocomposites12,13 exhibiting well-defined structural, optical, electrical, and magnetic properties have been targeted by many investigators. Among these, metal–semiconductor nanocomposites possessing synergy between different components are also being projected as a new class of materials for this purpose.14,15 There are several reports on ZnO-based DNA sensors using thiol-oligonucleotide or fluorophore-labeled target DNA and related perspectives of their interaction.16−20 Among the metal nanoparticles, Au has been considered as a classical material because of its novel optical properties arising out of plasmonic resonance, biocompatibility, and above all availability of facile synthesis procedures for achieving controlled particle size distribution compared to other noble metal nanoparticles.21−27 Simultaneously, ZnO–Au composites have also been explored by many; for example, Purwidyantri et al. demonstrated Au NP-decorated zinc oxide as a platform for bacterial DNA hybridization.28 Singhal et al. reported the electrochemical performance of zinc oxide/platinum–palladium (ZnO/Pt–Pd) with DNA.29 Perumal et al. developed a detection strategy for DNA from pathogenic leptospirosis with a gold-seeded ZnO nanoflower.30 Foo et al. described a Au-decorated ZnO thin-film-based biosensor using a thiol-modified single-stranded (ss) DNA probe.31 However, all of these electrochemical methods involve an additional reducing/oxidizing agent, which makes the detection more complicated. In contrast, optical detection, namely, the fluorescence-based method, offers high sensitivity toward specific molecular recognition with a rapid response and easy operating technique.32 Recently, resonance Raman scattering has also been used for a specific DNA target sequence.33 Apart from gold nanoparticles, gold nanoclusters (Au NCs) also exhibit size-dependent strong fluorescence property, photostability, and functionality for bioconjugation.34−36 Hence, several current studies focus on developing fluorescent probes using gold nanoclusters, such as, a label-free sensor has been developed by Wang’s group using gold nanoclusters (Au NCs).37 Several theoretical studies also support the strong interaction of Au NCs with nucleobases.38−42 From the data available in the literature, distinguished affinity of gold nanoclusters toward nucleobases is evident.
In the past, we have carried out extensive work in understanding the interaction of various nanostructures like carbon spindles,10 silver nanoparticles,8 and ZnO nanoparticles43 with DNA. In one of our recent studies, the interaction of fluorescent ZnO rods with DNA, which incidentally resulted in Escherichia coli (EC) DNA-specific interaction leading to white light emission, has been reported.9 Inspired by this result and motivated by the affinity of gold nanocluster toward oligonucleotides,38−42 we have extended our research with fluorescent nanocomposites to understand the synergistic effect of two fluorescent materials in a single nanocomposite to find out if there could be base-pair-specific interaction with such composites. For this purpose, we have chosen two individual fluorescent materials, ZnO nanoparticles, exhibiting emission at 389 and 513 nm, and gold nanoclusters, exhibiting emission at 610 nm. Here, we present a fluorescent ZnO–Au nanocomposite exhibiting dual emission at ∼390 and 520 nm as a probe for elucidating DNA interaction and specificity. Highly monodispersed glutathione (a natural thiol-containing tripeptide)-protected fluorescent gold nanoclusters (G-Au NCs) were synthesized via a facile synthetic method, followed by their deposition onto preformed egg-shell-membrane (ESM)-based ZnO nanoparticles. A rigorous characterization of the nanocomposite was carried out prior to investigating the nano-bio-interaction. Three natural DNAs, calf thymus (CT), E. coli (EC), and Micrococcus lysodeikticus (ML) DNAs, having different AT:GC compositions were chosen for this study. A noticeable change in the fluorescence of the synthesized nanocomposite in the presence of CT DNA indicates its strong interaction, which can be ascribed to the synergistic effect of the synthesized nanocomposite derived from the unique combination of G-Au NCs and ZnO nanoparticles. Furthermore, thorough investigation was also carried out to understand the fundamental aspects of binding that can explain the differences in binding efficiency to different DNAs.
Results and Discussion
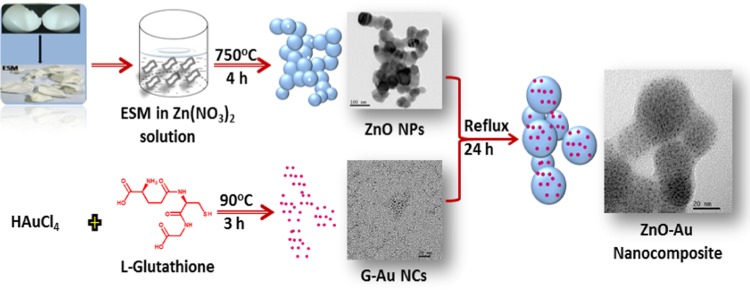
Carboxylic groups are the commonly employed functional groups for anchoring plasmonic materials onto the ZnO surface.44 Thus, following this, here, we have also used glutathione-protected Au NCs with carboxylic acid groups for forming a composite with ZnO nanoparticles. A schematic of the synthesis procedure is shown in Figure 1. Disappearance of the absorption spectra of bare G-Au NCs from the supernatant of the resultant ZnO–Au nanocomposite after centrifugation confirms the complete anchoring of G-Au NCs onto ZnO nanoparticles and the successful formation of the nanocomposite.
Figure 1.
Synthesis of the AZO nanocomposite is shown as a schematic representation.
To gain insight into the crystalline nature of gold nanoclusters (G-Au NCs), ESM-based native ZnO (ZO) nanoparticles, and ZnO–Au (AZO) nanocomposites, the X-ray diffraction (XRD) study was performed as presented in Figure 2. It is very difficult to acquire strong reflections in the XRD pattern for nanoclusters. Recently, Wu et al. studied the crystal structure of glutathione-capped gold nanoclusters through XRD measurements and reported two broad reflections with 2θ at around 37.5 and 66.5°, respectively.45 But, here, we have observed only one broad diffraction peak at 33.03° with a weak intensity for G-Au NCs. The XRD pattern of bare ZO nanoparticles is in good accordance with that of the hexagonal wurtzite ZnO lattice reported elsewhere.46 Furthermore, besides the diffraction peaks of ZnO, the diffraction peaks of gold nanoclusters are not observed in the composite because of their negligible intensity.47
Figure 2.
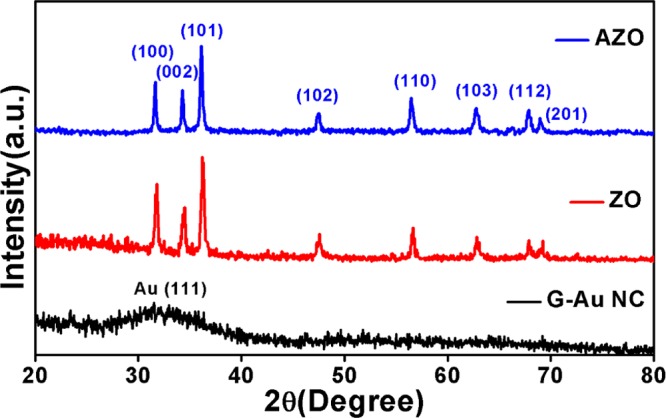
XRD patterns of gold nanoclusters (G-Au NCs), native ZnO (ZO) NPs, and ZnO–Au nanocomposite (AZO).
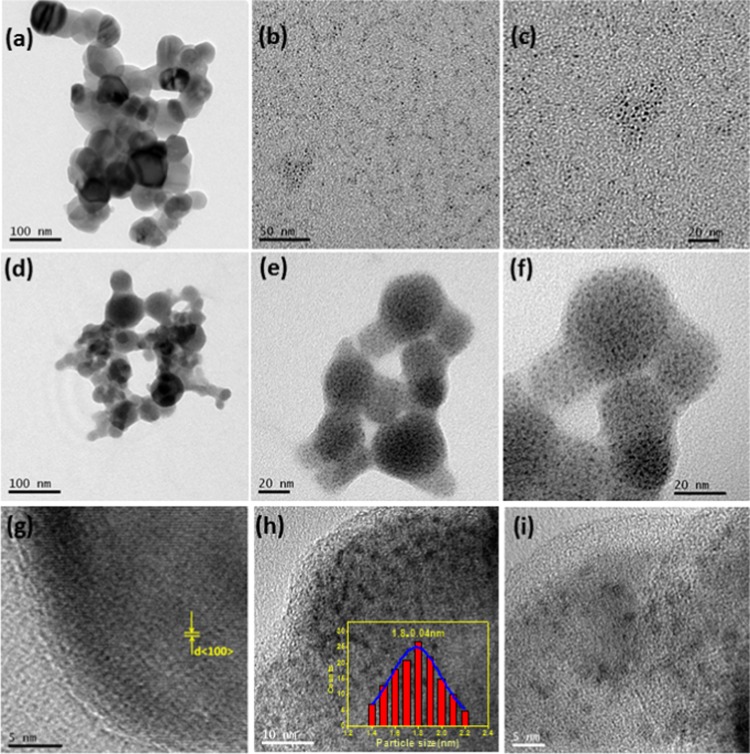
Figure 3a–f depicts the representative bright field transmission electron microscopy (TEM) images of native ZO nanoparticles, as-synthesized G-Au NCs, and the binary AZO nanocomposite with monodispersed G-Au NCs, respectively, at low (Figure 3a,b,d) and high magnifications (Figure 3c,e,f). Figure 3g–i represents the corresponding high-resolution TEM (HRTEM) images. The bright field image presented in Figure 3a reveals the formation of almost spherical ZnO nanoparticles with an average size of 30–40 nm using ESM as a biotemplate. Figure 3b,c represents the as-synthesized gold nanoclusters with an average size of 1.8 nm. Figure 3d–f clearly demonstrates the formation of a binary AZO nanocomposite, depicting uniform distribution of very small gold nanoclusters onto ZnO nanoparticles. The light contrast particles are ZnO nanoparticles, and the dark particles are G-Au NCs. In addition, bright field images of the AZO nanocomposite also confirm the well-anchored G-Au NCs on the surfaces of ZnO and it is hard to observe individual ZO nanoparticles or G-Au NCs, which signifies the successful integration of the G-Au NCs on the ZO nanoparticles. Importantly, the average size of G-Au NCs (∼1.8 ± 0.04 nm) was well preserved in our system, as evident from Figure 3c,f. Interestingly, the HRTEM image of native ZnO (Figure 3g), which shows the lattice fringes of 0.281 nm d-spacing corresponding to the (100) lattice plane, becomes faint with the presence of very small G-Au NCs in the nanocomposite (Figure 3h,i), confirming the co-existence of ZnO and G-Au NCs.
Figure 3.
TEM bright field images of (a) native ZnO (ZO) NPs, (b, c) as-synthesized gold nanoclusters (G-Au NCs), (d), (e), and (f) ZnO–Au (AZO) nanocomposite, respectively, HRTEM of (g) ZO and (h) and (i) AZO nanocomposite, respectively.
To clarify the presence of anchoring sites within the composite, the Fourier transform infrared (FT-IR) study of the pure glutathione (G) ligand, G-Au NCs, ZO nanoparticles, and the AZO nanocomposite was carried out as shown in Figure 4. The FT-IR spectrum of ZO shows a stretching band at approximately 436 cm–1 due to the vibration of Zn–O bonds.48 The band identified at around 1630 cm–1 is attributed to the bending vibration of the H–O–H group of chemisorbed water, and the broad band at 3000–3650 cm–1 is reasonable to confirm the adsorption of water molecules.49 The stretching Zn–O band at 436 cm–1 (as observed in bare ZnO) shifted to 428 cm–1 in the AZO nanocomposite. On the other hand, in comparison in the spectrum of pure glutathione ligand, the characteristic peak related to the S–H stretching vibration at 2524 cm–1 was not found in the spectrum of G-Au NC within the detection limit, whereas the other peaks at 3353 and 1714 cm–1 that stem from −NH2 and the −C=O stretching vibration modes, originating from glutathione ligands, and the weak band at 1456 cm–1 peak arising from CH2–S methylene scissoring (δ) were also observed.50,51 This confirms the disappearance of S–H bonds and the formation of the S–Au chemical bond in the synthesized gold nanoclusters. However, the nature of the characteristic bands in the G-Au NC and AZO nanocomposite is slightly different from that of the original ligand with low intensity. The characteristic peaks observed at 2925, 3257, and 3443 cm–1 in the AZO nanocomposite are responsible for C–H, N–H, and O–H stretching frequencies, respectively.47
Figure 4.
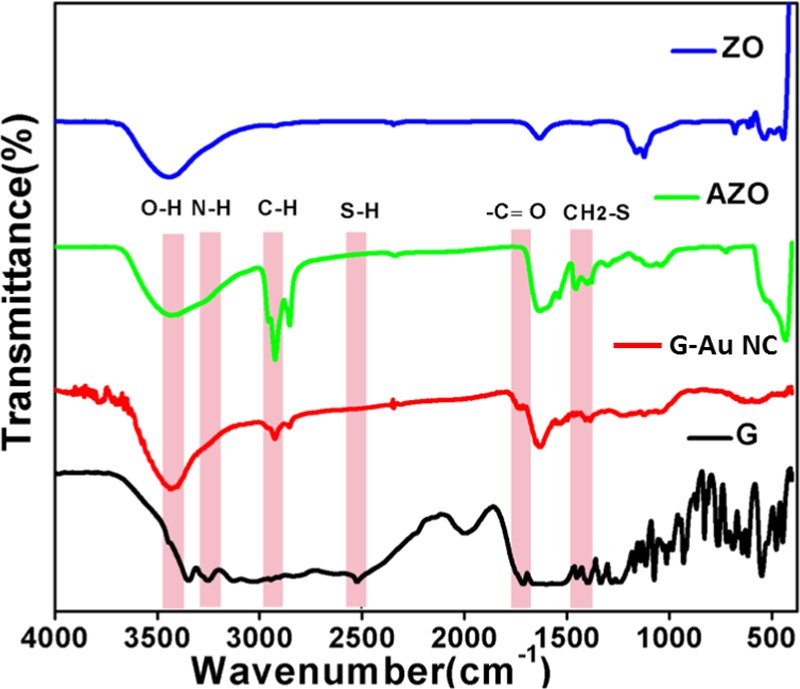
FT-IR study of pure glutathione (G), gold nanocluster (G-Au NC), ZnO–Au nanocomposite (AZO), and native ZnO (ZO).
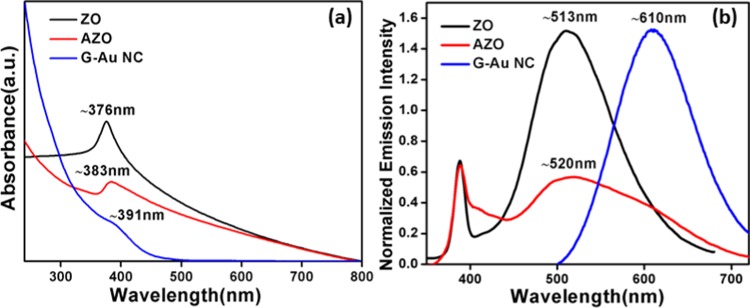
The recorded absorption spectra of ZnO nanoparticles, G-Au NCs, and ZnO–Au nanocomposite in the 250–800 nm range are presented in Figure 5a. The pure gold nanocluster has a characteristic shoulder peak at 391 nm, which is consistent with Au(0)@Au(I)–thiolate structures, as discussed earlier by Xie’s group.52 The absence of absorption band at around >500 nm for Au–thiolate NCs indicates that the obtained G-Au NCs are distinctly different from the conventional plasmonic gold nanoclusters.53,54 ZnO nanoparticles exhibit a threshold (band gap) in the UV region of 376 nm (3.29 eV), which is attributed to the excitonic absorption of ZnO. The absorption profile of ZnO in the nanocomposite is significantly red-shifted compared to that of bare ZnO, with an onset at 383 nm (3.23 eV).
Figure 5.
(a) Recorded UV–visible and (b) emission spectra of native ZnO (ZO) NPs (λex = 345 nm), ZnO–Au (AZO) nanocomposite (λex = 345 nm), and gold nanocluster (G-Au NC) (λex = 420 nm).
Figure 5b illustrates the steady-state emission spectra of bare ZO nanoparticles, G-Au NCs, and AZO nanocomposites. As we have reported earlier, under excitation at 345 nm, ZnO nanoparticles exhibit two emission bands: a narrow near-band-edge (NBE) emission in the UV region with a maximum at ∼389 nm owing to the direct radiative recombination of excitons and a broad emission in the visible zone with a maximum at ∼513 nm corresponding to the oxygen-vacancy-related surface defects.46,55 On the other hand, G-Au NCs show a strong luminescence property with an emission maximum at ∼610 nm on excitation at 420 nm.56 A large Stokes (λemi – λabs ∼ 190 nm) shift in the emission is consistent with the aggregation-induced emission of Au(I)–thiolate complexes on the Au(0) surface, as demonstrated by Xie’s group.52 A digital image as in Figure S1 demonstrates the strong red emission of G-Au NCs under UV light (λ365 nm) exposure. This emissive property undoubtedly distinguishes the ultra-small G-Au NCs from the larger plasmonic Au nanoparticles. Emission spectra of the resultant nanocomposite (AZO) show the NBE emission at ∼390 nm and the surface-defect-related broad emission in the 450–720 nm region, as shown in Figure 5b. Interestingly, it was observed that in the nanocomposite the spectral intensity of the surface-defect-related emission was significantly reduced with extended spectral span. The multidentate anchoring ability of the glutathione ligand enables G-Au NCs to bind to the defect present in the ZnO surface, which may induce extended spectral span toward longer wavelength in the resultant nanocomposite.
DNA-Binding Studies
The usual biophysical techniques are implemented to investigate the interaction of AZO with DNA. As discussed earlier, the ZnO–Au nanocomposite displays a characteristic absorption band at ∼383 nm. The interaction of the nanocomposite with CT, EC, and ML DNAs was monitored in the 250–800 nm region, as shown in Figure S2. The concentration of DNA solution used was in the range of 0.1–0.7 μM. As evident from Figure S2, with the increasing concentration of CT DNA, there is a gradual decrease in absorbance without any shift of the absorption band of the nanocomposite. This gradual decrease in absorbance was observed in all of the studied DNAs. The absorption spectrum of the nanocomposite exhibited 12.6, 14.28, and 14.61% decrease in the absorbance band at ∼383 nm upon incremental addition of CT, EC, and ML DNA, respectively.
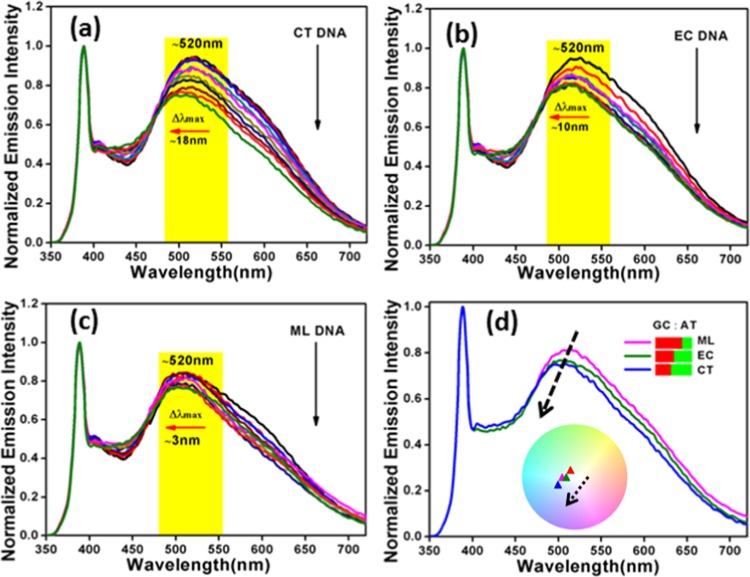
In the recent past, fluorescence spectroscopy became a well-accepted tool to monitor the binding kinetics of DNA–NP interactions.9,43,57 Initially, we have studied the interaction of native ZnO nanoparticles with the aforementioned three DNAs. With the addition of all of the DNAs, irrespective of the AT:GC composition, quenching of the surface defect peak maximum at around 513 nm of the bare ZO nanoparticles was observed, as evident from Figure S3. The observed spectral changes for all of the DNA–ZnO titrations were same. Recent computational studies of ZnO with DNA/RNA assigned the fluorescence quenching to the nano-bio-interaction at the defect level.58 However, here, bare ZnO could not selectively interact with DNAs. Therefore, in this work, the luminescence property of the ZnO–Au nanocomposite was chosen to explore the interaction with different DNAs. For this purpose, the ZnO–Au nanocomposite was titrated with CT, EC, and ML DNAs, respectively, and emission spectra were monitored as presented in Figure 6. For better data comparison, all of the emission spectra have been normalized with respect to band edge emission at ∼390 nm. Such a plot helps in monitoring the actual change of the surface-defect-related peak with varying DNA concentrations. Figure 6a shows a marginal change in the intensity of the emission band, at ∼520 nm, of the nanocomposite upon addition of CT DNA at the initial stage of the interaction. However, further addition of CT DNA elicited a continuous reduction in the intensity of the emission maximum at ∼520 nm along with a blue shift of ∼18 nm at the saturation level. This was indicative of a strong binding of the ZnO–Au nanocomposite with CT DNA. Spectroscopic titration with EC DNA (Figure 6b) also reduced the emission intensity with a blue shift of ∼10 nm under the same experimental conditions. The decrease in the emission intensity in above cases can also be due to the microenvironmental variation in the nanocomposite–DNA complex system. In contrast, in the case of ML DNA titration (Figure 6c), the shift in the emission maximum at ∼520 nm was only ∼3 nm, i.e., only a minor shift was noticed. It is clear that CT DNA containing 42% GC + 58% AT showed a maximum shift in the emission maximum at ∼520 nm and EC DNA containing 50% GC + 50% AT showed a closely similar change, whereas ML DNA containing 72% GC + 28% AT did not exhibit any significant change. However, this change is markedly different from that in our previous reports on the studies of fluorescent ZnO43 and carbon spindles10 with DNA, thereby suggesting a distinctly different binding pathway compare to the former. The fluorescence spectral changes of this nature though small are sufficient for providing good binding analysis, as already demonstrated by earlier groups.59,60 The base composition of DNA has been found to strongly influence the spectral nature of the nanocomposite emission by altering the relative intensity of the emission maximum at ∼520 nm with significant shifts in the peak position. The signature of the AT:GC composition of DNA on the shift in the emission band can be distinctly visualized from Figure 6d. The inset of Figure 6d typically displays the Commission Internationale de Ľeclairage (CIE) 1931 diagram exhibiting the shift in the emission wavelength as a function of DNA composition. The CIE co-ordinates were found to be (0.32, 0.40), (0.29, 0.36), (0.30, 0.38), and (0.29, 0.35) for the AZO nanocomposite, AZO-CT DNA, AZO-EC DNA, and AZO-ML DNA, respectively. A simple variation in the AT:GC composition essentially shifts the CIE indices. In addition, to understand the crucial role of the gold nanoclusters in DNA interaction, controlled experiments with only G-Au NCs were also monitored under the same experimental conditions for a comparative purpose, as depicted in Figure S4. There are several reports in the literature describing the interaction between Au NCs and DNA.38−42 An experimental study by Kimura-Suda et al. investigated the adsorption affinity of gold nanoclusters toward individual nucleobases and found the lowest affinity for thymine.41 However, in the present study, the red-emitting bare G-Au NCs did not show significant variation in the activity toward all of the studied DNAs. Hence, it can be assumed that the changes in the emission spectra of the nanocomposite upon addition of different DNAs are attributed to the contribution from both ZnO and G-Au NC. Accordingly, the emission spectra of the bare nanocomposite and the nanocomposite after complexation with all of the studied DNAs at their saturation point were deconvoluted into two separated Gaussian components (Figure S5) with maxima at ∼520 and ∼610 nm, respectively. It can be seen that the synergistic effect of ZnO NPs/G-Au NCs in the AZO nanocomposite leads to specificity in DNA interaction, resulting in a shift in the emission profile, as discussed above. It is reasonable to evaluate the limit of detection (LOD) from the plots of F0–F of the AZO nanocomposite versus DNA concentration, as shown in Figure S6. Here, F is the fluorescence intensity of the nanocomposite in the presence of different concentrations of DNA and F0 is the initial fluorescence intensity in the absence of DNA. The limit of detection (LOD) has been determined using the standard equation involved as signal-to-noise ratio of (3σ/S), where σ is the standard deviation of the blank and S is the slope obtained from the linear plot. The fluorometric results confirmed the detection of CT DNA with a linear range from 0.1 to 0.7 μM with a low detection limit of 36 nM; conversely, it was estimated to be 62 and 66 nM for EC and ML DNAs, respectively. This outcome shows that the AZO nanocomposite exhibited a noticeable wavelength shift on interaction with CT DNA along with a lowest LOD value compared to that of other DNAs, as discussed above.
Figure 6.
Fluorescence study of AZO with (a) CT, (b) EC, and (c) ML DNA’s (0.1–1.2 μM), respectively, and (d) variation of emission of the AZO nanocomposite as a function of AT:GC composition; the inset displays the observed wavelength shift in terms of CIE diagram.
We have additionally extended our fluorometric studies with polynucleotides, which have similar composition to natural DNAs, as shown in Figure 7. A detailed examination reveals that initial addition of the poly(dA)·poly(dT) poly AT pair causes a hypochromic effect of the visible emission band at ∼520 nm, followed by a blue shift in the visible emission band with a reasonable hyperchromic effect. A remarkable shift in the emission band from 520 to 489 nm was noticed at the saturation level as a result of the interaction of AZO with poly AT. It is to be noted that the interaction of AZO with the poly(dG)·poly(dC) (poly GC) pair, demonstrated in Figure 7b, did not exhibit any significant change on the fluorescence of the nanocomposite. The observed shift (Δλ) in the emission band at 520 nm during the interaction of AZO with poly AT and poly GC is further highlighted in Figure 7c. The substantial shift in the λmax (Δλ = 31 nm) toward a shorter wavelength in the case of poly AT over poly GC is consistent with the fluorometric results obtained with natural DNAs. The above results demonstrate the influence of base composition and concentration of DNA, leading to AT base pair selectivity of the composite.
Figure 7.
Fluorescence study of AZO with polynucleotides: (a) poly(dA)·poly(dT) (poly AT) pair and (b) poly(dG)·poly(dC) (poly GC) pair and (c) shift in the peak maximum at 520 nm after the addition of AT and GC polynucleotides.
To establish a probable interaction mechanism of AZO with DNA, further studies were carried out with DNA bases/nucleosides. Because the AT pair exhibited distinguishable emission characteristics compared with the GC pair, as shown in Figure 7, to obtain additional insight into the affinity and specificity of the ZnO–Au nanocomposite, similar experiments were also carried out with nucleoside derivatives such as deoxyadenosine monophosphate and deoxythymidine monophosphate. For each nucleoside, the fluorescence spectra were measured, as shown in Figure S7a,b. Only in the case of deoxyadenosine monophosphate, the shift of the emission band was recognized more precisely than that of deoxythymidine monophosphate. This result also corroborates the results obtained with the polynucleotides (vide supra). To extract more valuable information, we have also performed the fluorescence titration of the nanocomposite with different bases, viz. adenine and thymine, and the results are shown in Figure S7c,d. Fluorescence titration data with deoxyadenosine monophosphate and adenine were similar and quite comparable, although not identical. Interestingly, the fluorescence spectrum was blue-shifted about 24 nm only for deoxyadenosine monophosphate titration. In other words, it appears that the adenine base is partially responsible for the observed blue shift in emission upon complexation. However, this shift is not as extreme as it was found for the AT pair because of strong binding. The strong interaction between the nanocomposite and AT pair was found as a reflection of the noticeable wavelength shift. However, the addition of thymine does not influence the spectral maximum at 520 nm. Although we have not specified the molecular recognition of these interactions, it is quite reasonable that anchoring of the gold nanocluster onto the ZnO surface accounts for the complex formation with AT-specific DNA, which ultimately leads to strong binding.
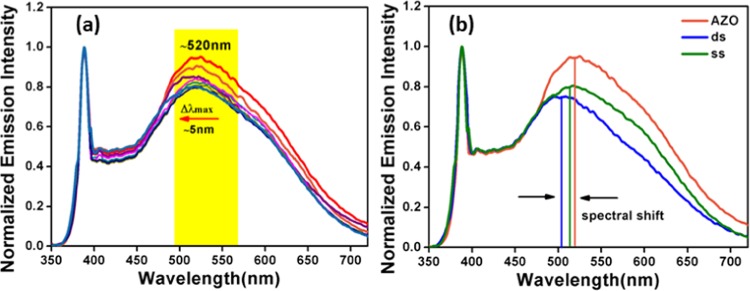
Having sufficient information regarding the binding of ZnO–Au nanocomposite with different double-stranded (ds) DNAs, we studied the titration of the composite with single-stranded (ss) CT DNA. The representative fluorescence titration profile of the AZO nanocomposite with ss CT DNA is presented in Figure 8a. In comparison to that for ds DNA, a decrease in the emission intensity at ∼520 nm in addition to a minor (∼5 nm) blue shift was noticed for ss CT DNA (Figure 8b). However, what is unusual about this is that in spite of the less structural complexity of ss DNA the fluorometric result is not as pronounced as it was found for the interaction of ds DNA with the nanocomposite. This subtle ability of any composite to distinguish between single-stranded and double-stranded DNAs suggests its proficiency in DNA-binding studies. All of the results together enable us to unequivocally establish the uniqueness of the fluorescent ZnO–Au nanocomposite in identifying DNA specificity.
Figure 8.
Fluorescence titrations of AZO with (a) ss CT DNA and (b) comparison of the emission of AZO with that of ss and ds CT DNAs at a saturated concentration of DNA.
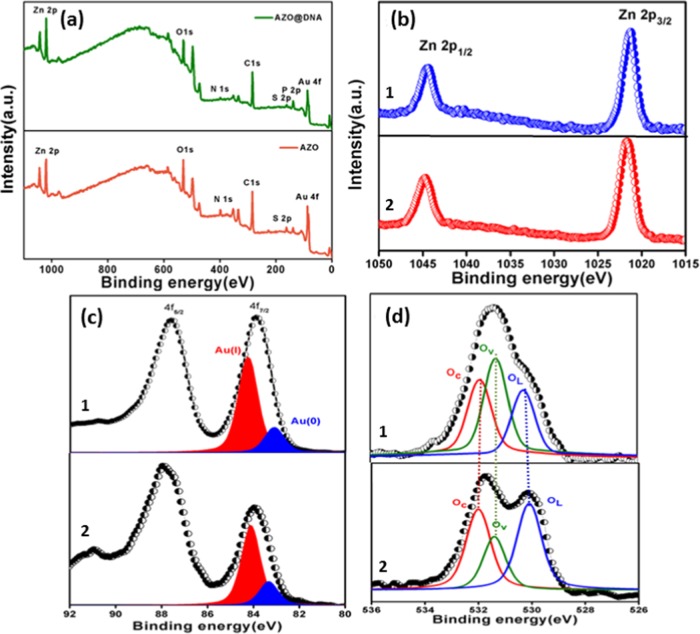
To explore X-ray photoelectron spectroscopy (XPS) as a tool to understand the binding nature of the AZO nanocomposite after interaction with CT DNA, studies have been carried out here. The survey scan of the AZO nanocomposite over a wide range of binding energy was acquired initially, which had various characteristic peaks of the elements present in the nanocomposite (Figure 9a). The wide scan spectrum of the AZO-CT DNA complex shows the presence of phosphorous contributed from DNA. For a more detailed analysis, highly resolved photoemission spectra are shown in Figure 9b–d along with fitted reliable distinction and assignment of the different components in all of the core-level spectra. As demonstrated in Figure 9b, the binding energies of Zn 2p1/2 and Zn 2p3/2 of the AZO nanocomposite are found to be 1044.7 and 1021.7 eV, respectively, manifesting the presence of Zn2+ in the AZO nanocomposite.61 For Zn 2p, the peak positions and widths of this component in bare AZO nanocomposite and after treatment with CT DNA strictly remained consistent. Figure 9c also depicts the photoemission spectra of the Au 4f core level. The binding energy of Au 4f in the AZO nanocomposite is found to be shifted toward a lower binding energy, i.e., for 4f7/2, 83.87 eV and for 4f5/2, 87.57 eV, compared to that of pure gold (4f7/2, 84.00 eV and 4f5/2, 87.71 eV),62 as shown in Figure 9c. Similar to the previous reports, the Au 4f7/2 spectrum was deconvoluted in the two components of Au(I) and Au(0) with binding energies of 84.27 and 83.17 eV, respectively.53,56 However, the intensity ratio of 4f7/2 to 4f5/2 drastically changed from 1.022 to 0.710 after complexation with CT DNA. On the other hand, the O 1s core-level spectrum (Figure 9d) reveals an asymmetric nature, which upon deconvolution has been attributed to lattice oxygen (OL, 530.27 eV) i.e., O2– ions on the wurtzite structure with hexagonal Zn2+ ion array, surface oxygen vacancy (Ov, 531.37 eV) correlated with O2– ions in the oxygen-deficient area, and chemisorbed oxygen (Oc, 531.8 eV), as shown in Figure 9d.61,63 Interestingly, the O 1s spectrum of the AZO-CT DNA complex exhibited an apparent redistribution between the different deconvoluted components of O 1s. Such behavior is due to a change in the ratio of the integral area of Ov to OL from 1.18 to 0.72 and of OC to OL from 1.3 to 0.89. Indeed, the changes observed in Au 4f and O 1s spectra clearly approve the AZO-CT DNA complex formation, which was also evident from the fluorescence results.
Figure 9.
(a) Analysis of the survey XPS spectrum of AZO and core-level XPS spectra of (b) Zn 2p, (c) Au 4f, and (d) O 1s in the AZO nanocomposite (1 and 2 indicate before and after treatment with CT DNA, respectively).
To further elucidate the mechanism of nanocomposite–DNA interaction, liquid FT-IR study was performed for the ZnO–Au nanocomposite and DNA-bound nanocomposites, as shown in Figure S8. Absorption bands in the 1750–1600 cm–1 region were assigned to the in-plane vibrations of mainly the base residues related to the stretching motions of the C=N, C=O, and C=C bonds of the nucleic acids.64 Peaks at 1660–1665 and 1564 cm–1 are assigned to the vibration of C4=O of thymine and amide II of the adenine moiety, respectively.65 The 1160 cm–1 band is considered to be due to the stretching vibrations of the sugar–phosphate backbone for B-DNA.66 A weak band at 860 cm–1 is mainly ascribed to the C–O–P–O–C backbone vibration, which characterizes the B form of DNA.64 The bands appearing at 987 and 1080 cm–1 are due to the skeletal vibrations of ribose-phosphate and PO2– group in DNA.64 The specific peaks are either shifted, weak, or become invisible in the case of DNA-bound nanocomposites, which collectively indicate the possible interaction of DNA with nanocomposites. The sharp changes in the intensity of the band at 1080 cm–1 for all of the DNAs bound with nanocomposites confirmed that the phosphate of DNA mainly interacts and assists the binding of nanocomposites with DNA molecules.
Study on DNA Structure
The stabilities of the control DNA duplexes and the nanocomposites conjugated with duplexes were determined by a UV thermal denaturation study by monitoring the absorbance at 260 nm with increasing temperature, as illustrated in Figure 10. Melting data strongly support the shifting of melting temperature of DNA (Tm) to higher values with an increase in the percentage of GC content in the double-helix structure. The Tm values of CT, EC, and ML DNAs were 64.6, 65.5, and 90.4 °C, respectively, (Figure 10a–c) under the conditions studied here. After mixing with the ZnO–Au nanocomposite, the Tm values increased substantially and changed to 71.3, 69.2, and 92.4 °C, respectively, for CT, EC, and ML DNAs.
Figure 10.
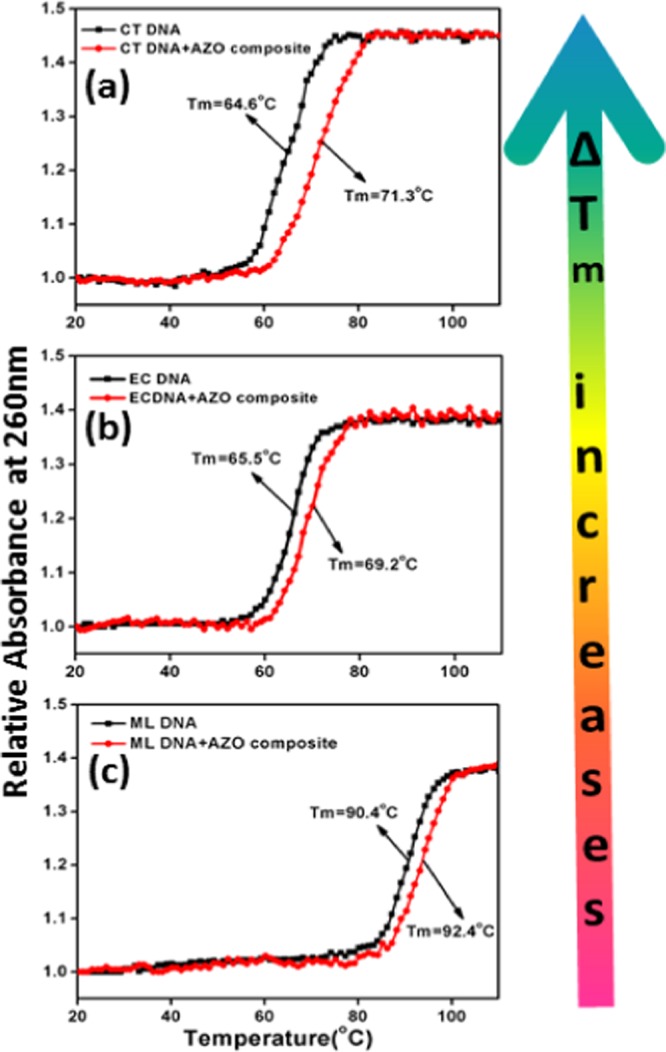
Thermal melting profile of (a) CT DNA, (b) EC DNA, and (c) ML DNA and their complexes with AZO, respectively.
The induced maximum shift in the melting temperature of CT DNA (ΔTmCT = 6.7 °C) in the presence of the nanocomposite reveals the selective thermal stabilization effect compared to that for EC (ΔTmEC = 3.7 °C) and ML (ΔTmML = 2 °C) DNAs under identical experimental conditions. This observed hyperchromicity trend in thermal stability was reproducible from three independent sets of experiments. This AT base-pair-induced enhancement in Tm further reflects the preferential binding of the nanocomposite toward CT DNA compared to others.
The study of conformational changes of DNA upon binding with nanomaterials by utilizing the circular dichroism (CD) spectroscopic technique is also a unique technique for defining the nanocomposite–DNA interaction. Figure 11 configures the CD spectrum of each DNA in citrate phosphate buffer at pH ∼ 7.4, displaying a typical B-DNA conformation with a major positive peak at ∼275 nm due to base stacking and a negative peak at ∼245 nm for the helical block of the double helix, furnishing the asymmetric domain of the bases.67 The AZO nanocomposite is not CD-responsive due to the absence of a chiral center. The gradual addition of the nanocomposite to CT DNA induced considerable alteration in the CD spectrum of CT DNA, as shown in Figure 11, but the effect caused by the nanocomposite on EC and ML DNAs is not significant. The band intensity of CT DNA at ∼275 nm was decreased without clear shift in their position as well as in accordance with B-DNA conformation it was remained unchanged. This variation in the band intensity may occur due to the perturbation of the local relative orientation of the bases to accommodate the nanocomposite, which is required to influence the binding interaction between CT DNA and the AZO nanocomposite. Such an observation is also consistent with the greater selective binding affinity of the nanocomposite for the CT DNA.
Figure 11.
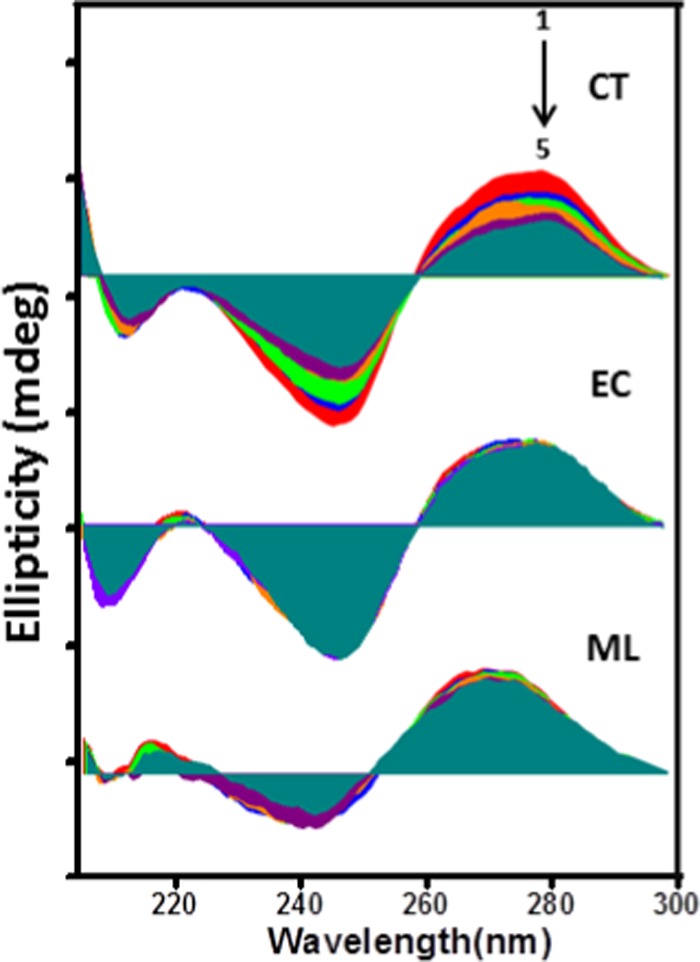
Subsequent changes in the CD spectra of CT, EC, and ML DNAs on stepwise addition of AZO (initial [DNA] = 60 μM).
Furthermore, when the CD responses obtained for CT DNA bound to the AZO nanocomposite (Figure S9) were monitored as a function of temperature (20–70 °C), surprisingly, a slight enhancement in the intensity of the band at ∼275 nm and a diminution in the intensity of the band at ∼245 nm were observed. This result reveals that ds CT DNA is strongly stabilized upon its binding to the nanocomposite at higher temperatures.
To propose the probable DNA-binding mechanism of the composite, we have considered a classical minor groove binder named Hoechst 33258, 2-(4-hydroxyphenyl)-5-[5-(4-methylpiperazine-1-yl) benzimidazo-2-yl] bezimidazole. The change in the emission profile of Hoechst in the presence of CT DNA with successive addition of the AZO nanocomposite has been presented in Figure S10. It eventually shows a potential increment in the fluorescence intensity of the Hoechst–DNA complex. The Hoechst displacement study supports the non-groove-binding nature of the nanocomposite.
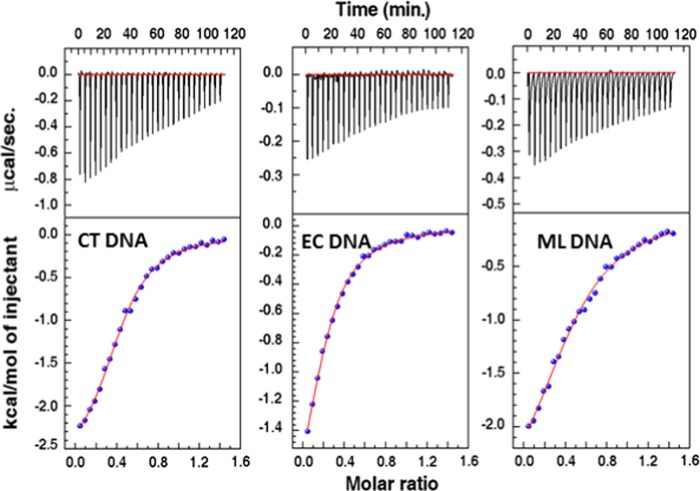
We also tried to quantify the efficacy of the interactions between the AZO nanocomposite and the selected DNA duplexes through thermodynamic parameters. In general, non-covalent forces that direct foreign particles and DNA binding admit electrostatic and hydrophobic interactions, hydrogen bonds, and van der Waals forces. Short-range hydrophobic interactions generally result in positive values of the enthalpy and entropy change in contrast to long-range ionic-type interactions like van der Waals forces or hydrogen bond formation, where negative values of both the enthalpy and entropy change predominate.68 From the calorimetric titration, we have evaluated the Gibbs energy and enthalpy of the binding association, which ultimately enables us to quantify the change in entropy for the binding process. Isothermal titration calorimetry (ITC) profiles for the binding of nanocomposite under investigation with the DNA’s at 20 °C are presented in Figure 12. The continuous lines are consistent with the best integrated isotherm for the one-site model. All of the ITC thermograms validate the exothermic essence of the reactions, and the outcome of the ITC experiments is summarized in Table 1. It can be seen that ITC experiments direct the trend in the binding constant value as follows: CT > EC > ML, being highest for CT DNA, which also indicates a greater binding affinity of the nanocomposite to CT DNA over other DNAs. Interestingly, the summarized binding data of DNAs with the composite was mainly supported by the negative enthalpy and positive entropy contributions. The highest binding threshold found for CT DNA was mostly entropy-driven (TΔS° = 4.22 kcal/mol) with an enthalpy contribution of 2.76 kcal/mol.
Figure 12.
ITC profiles for the titration of CT DNA, EC DNA, and ML DNA with the AZO nanocomposite.
Table 1. Thermodynamic Parameters Derived from ITC Experiments for the AZO Nanocomposite at 20 °C.
| DNA | N | Ka | ΔH° (kcal/mol) | TΔS° (kcal/mol) | ΔG° (kcal/mol) |
|---|---|---|---|---|---|
| CT DNA | 0.434 | 1.47 × 10⁵ | –2.76 | 4.22 | –6.98 |
| EC DNA | 0.213 | 8.50 × 10⁴ | –2.56 | 4.07 | –6.63 |
| ML DNA | 0.484 | 5.97 × 10⁴ | –3.02 | 3.28 | –6.30 |
Most of the research in this area is mainly focused on the dye-labeled DNA interaction study. We have presented a comparative study with the established fluorescent sensors already in use in this field, as presented in Table 2. Most of the existing fluorescent sensors for DNA detection mainly deal with fluorescent DNA probes with well-known rapid hybridization kinetics. However, the goal of the present investigation is mainly aimed at a label-free DNA interaction study of fluorescent nanomaterials that could exhibit noticeable specificity. Compared with the fluorogenic conjugates mentioned in Table 2, the projected fluorescent ZnO–Au nanocomposite is capable of discriminating ss and ds CT DNAs without the use of any dye or quantum dots (QDs) in the synthesis procedure. Interestingly, an appreciable change in the intrinsic fluorescence of the nanocomposite with specificity indicates their selective interaction, which can be ascribed to the mutual effect derived from the unique combination of G-Au NCs and ZnO nanoparticles.
Table 2. Comparison of the Analytical Performance of the Nanomaterial-Based Fluorescent Sensor for DNA Detection.
| nanomaterial | feature | detection limit | reference |
|---|---|---|---|
| single-walled carbon nanotubes (SWNT) | SWNT function as both a “nanoscaffold” and a “nanoquencher” of the fluorophore | 4.0 nM | (69) |
| Pd nanowire | substantial fluorescence quenching of dye followed by specific hybridization | 0.3 nM | (70) |
| graphene oxide | molecular beacon used as a probe to identify target analyte | 12 nM | (71) |
| MoS2 nanosheet | single-layer MoS2 nanosheet used as quencher | 500 pM | (72) |
| carbon nitride nanosheet | photoinduced electron transfer (PET)-based fluorescence quenching | 2.1 nM | (73) |
| CdTe QDs and Ru-complex | Ru-complex acts as both the quencher to QDs and a receptor to ds-DNA | 5 ng/mL | (74) |
| zinc(II)–protoporphyrin IX/G-quadruplex | using functional hairpin structures and Exo-III assisted analyte recycling | 5 nM | (75) |
| dumbbell-shaped DNA hosted Cu NPs | probe DNA assimilated by Exo-I and Exo-III | (76) | |
| CdTe QDs and Al(III) gatifloxacin (Al-GFLX) | PET process between QDs and Al-GFLX efficiently activated by dsDNA | 6.83 ng/mL | (77) |
| fluorescent Ag nanocluster | surface plasmon-enhanced energy transfer process involving fluorescent DNA/AgNC string and Au NPs | 2.5 nM | (78) |
| DNA–silver nanoclusters | analysis of different DNAs by simply varying the probe DNA sequence | 5.0 × 10⁶ mol/L | (79) |
| ZnO–Au nanocomposite | change in fluorescence of the nanocomposite without additional target | 36 nM | this work |
More importantly, fluorescence signals arising from the nano-bio-interaction can be measured directly without any modification of the target, which is the foremost advantage compared to that of other previous results. Besides these, through first-principles calculations, different groups reported the possible way of interaction of nanomaterials and DNA.60,80−83 However, there are limited experimental research works pertaining to the interaction of nanomaterials and DNA mainly driven by direct binding study. To sum up, as shown in Table 3, it is found that when nanomaterials interact with CT DNA the magnitude of binding constant (Ka) was derived to be in the order of 104–105 M–1. None of the above binding studies have focused on the fluorescent nanocomposite derived from two individual fluorescent nanomaterials and compared the synergistic effect of individual fluorophore. Compared to that in the aforementioned studies, the intrinsic fluorescence of the ZnO–Au nanocomposite shows an appreciable blue shift in the emission maximum at ∼520 nm in the presence of CT DNA over the other studied DNAs with comparable binding constant values, which is more interesting compared to other results, as depicted in Table 3.
Table 3. Comparison of Binding Constant Values of Nanomaterials with CT DNA.
Conclusions
Here, the ZnO–Au nanocomposite has been synthesized by anchoring a glutathione-protected gold nanocluster on the surface of ESM-based ZnO nanoparticles. According to the detailed material characterization results, the as-synthesized nanocomposites were found to exhibit interesting optical properties with substantial integrity between their constituents, which turned out to be advantageous for their use as a fluorescent probe. Fluorescence titrations of the nanocomposite with the different DNAs reveal the favorable binding interaction of the nanocomposite toward CT DNA with a maximum blue shift of the surface-related spectra of the nanocomposite. In addition, the results obtained from the titrations with synthetic polynucleotides were consistent with the fluorometric results obtained with natural DNAs. Although we have not assigned the specific molecular recognition of these interactions, it is quite likely that anchoring of the gold nanocluster onto the ZnO surface is accountable for the complex formation with AT-specific DNA, which was evident from the fluorometric titration and XPS study. Compared with the native ZnO, in virtue of this appreciable fluorometric change, the synthesized nanocomposite could act as a fluorescent probe for DNA interaction with improved specificity. More significantly, we have also found that, contrary to the expectation, the binding of ss CT DNA with the nanocomposite was not as effective for a noticeable fluorometric change as it was for ds CT DNA. Hence, this AZO nanocomposite possesses the proficiency to distinguish ss and ds DNAs, which is a highly interesting observation for DNA-based diagnostics. Besides fluorometric results, the thermal melting study, CD spectroscopic results, and the thermodynamic evaluation clearly reveal the greater binding harmony of the nanocomposite to CT DNA compared to that to the other DNAs. Thus, it is anticipated that this type of fluorescent ZnO–Au nanocomposite will be poised to elucidate a new perspective in DNA-binding study with specificity and will open up an interesting aspect in this field.
Experimental Section
Materials
Zinc nitrate hexahydrate (Zn(NO3)2·6H2O) was bought from Merck Ltd. All DNAs; the synthetic polynucleotides (poly(dA)·poly(dT) and poly(dG)·poly(dC)); the corresponding monophosphate residues of the DNA; and the purine and pyrimidine base components, i.e., adenine hydrochloride hydrate, thymine, tetrachloroauric acid trihydrate (HAuCl4·3H2O), and Hoechst 33258, were obtained from Sigma-Aldrich. The reduced form of l-glutathione (GSH) was purchased from Alfa Aesar. All of the compounds were treated without any further purification. Ultrapure water (18.2 MΩ cm) was used throughout the experiment. All of the DNA solutions were prepared as previously reported.9 The concentrations of calf thymus (CT), E. coli (EC), and M. lysodeikticus (ML) DNAs were determined spectroscopically from the absorbance value using their corresponding molar absorption coefficients.9
Synthesis of ZnO Nanoparticles
The stock solution (0.1 M, 100 mL) of zinc nitrate (Zn(NO3)2·6H2O, 99.9%) was prepared in distilled water. The egg shell membrane (ESM) was scaled off manually from its CaCO3 shell of commercial eggs and was washed properly using distilled water and dried under an IR lamp.87 The fresh ∼1 g ESM was immersed in the zinc salt solution and stirred on a magnetic stirrer for 10 min, followed by keeping it at room temperature for 112 h without any perturbation to favor the adsorption of zinc ions onto the membrane. The white sheetlike Zn–ESM hybrid membranes were removed from the salt solution, rinsed thoroughly using distilled water, and dried under an IR lamp. Finally, the as-synthesized white product was calcined at 750 °C for 4 h to prepare ZnO nanoparticles (ZO NPs).
Synthesis of Luminescent G-Au NCs
For batch preparation, the freshly prepared aqueous solutions of GSH (10 mL, 7.5 mM) and HAuCl4 (10 mL, 5 mM) were mixed under gentle stirring, followed by increasing the reaction temperature to 90 °C and leaving for 3 h for completing the reaction. A constant volume was maintained during the reaction. After cooling down to room temperature, the as-obtained solution was stored at 4 °C for 24 h. The final product was precipitated out by adding ethanol, dispersed in water, and kept at 4 °C for further use.
Integration of ZnO Nanoparticles with G-Au NCs
The calcined ZnO powder (20 mg) was well dispersed in a water–ethanol mixture by sonicating for 15 min, followed by dropwise addition of 5 mL of G-Au NC solution to it and refluxing the mixture at 120 ± 5 °C for 24 h to synthesize the ZnO–Au nanocomposite. The final solution was centrifuged at 12 000 rpm, washed with water several times, and dried under vacuum at 60 °C. The product was denoted AZO.
Characterization
X-ray Diffraction Analysis
Structural characterization of G-Au NCs, ZO nanoparticles, and AZO nanocomposite was carried out using room temperature powder X-ray diffraction (XRD) collected on X’pert pro MPD XRD of the PANalytical system. The target used was Cu Kα radiation (l = 1.5406 Å) with a scan rate of 2°/min.
Transmission Electron Microscopy Study
Morphological evolution of native ZnO nanoparticles (ZO), luminescent gold nanoclusters (G-Au NCs), and AZO nanocomposite was analyzed by TEM microscopy on a Tecnai G2 30ST (FEI) high-resolution transmission electron microscope operated at 300 kV.
X-ray Photoelectron Spectroscopy
The X-ray photoelectron spectroscopy study was performed with a PHI 5000 Versa probe II scanning XPS microprobe (ULVAC-PHI). Monochromatic Al Kα (hν = 1486.6 eV) radiation accompanied by a total resolution of about 0.7 eV and a beam size of 100 mm was maintained for the measurements.
Fourier Transform Infrared Spectroscopy Study
Fourier transform infrared (FT-IR) spectra have been acquired at room temperature on a Perkin Elmer FT-IR spectrometer using the full range from 4000 to 400 cm–1 collecting 200 scans with a resolution of 4 cm–1. The pellets were made with highly pure potassium bromide (Sigma-Aldrich (Germany)). Before collecting the spectra, we have varied the ratio of sample to KBr to nullify the background signal.
Interaction Study with DNAs
Absorption Titration
A Shimadzu UV-3600 UV–vis–NIR spectrophotometer was used for recording the absorption spectra. For each titration, aliquots of a micromolar stock solution of DNA were added successively to a fixed concentration AZO composite solution and the absorption study was continued by maintaining 1 min as the equilibration time per aliquot up to the saturation point.
Fluorescence Titration
A steady-state spectrofluorimeter (QM-40, Photon Technology International, PTI) connected by a xenon lamp (150 W) as an excitation source was employed for fluorescence titrations. Bare ZO NPs and the composite in the presence of different DNAs were excited at 345 nm, and Hoechst 33258 was excited at 341 nm.
Thermal Melting Experiment
For the thermal melting analysis (relative absorbance versus temperature curves) of each DNA with and without the AZO nanocomposite, a Shimadzu Pharmaspec 1700 unit (Shimadzu Corporation, Kyoto, Japan) attached with the Peltier controlled TMSPC-8 model accessory was used. The stock solution of DNA was mixed with the AZO composite, the measurements were performed with the help of Teflon-stoppered eight segmented micro optical quartz cuvettes (10 mm optical path length and 110 μL capacity), and the temperature of the cell was increased from 20 to 110 °C, maintaining the heating rate of 0.5 °C/min, followed by the continuous monitoring of the absorbance change at 260 nm wavelength. From the midpoint of the melting transition, the melting temperature (Tm) was determined.
Isothermal Calorimetric Titration
The energetics of the current study with each DNA was performed by isothermal titration calorimetry (ITC) using a MicroCal VP-ITC unit (MicroCal, Inc., Northampton, MA). The protocols for the measurements were maintained as described in our earlier report.9
Circular Dichoric Measurement
For spectropolarimetric study, a J-815 Jasco unit (Jasco International Co. Ltd, Hachioji, Japan) fixed with a temperature controller (model PFD 425L/15) was used to collect spectra in the UV region from 400 to 200 nm at 20 ± 0.5 °C under a nitrogen atmosphere. For the CD experiment, we have also used a 10 mm path length quartz cuvette, the concentration of DNA used was 60 μM, and the composite concentration was increased gradually up to saturation. For each sample, the average scan was fitted after subtracting the buffer baseline.
Acknowledgments
P.S.D. acknowledges the financial support from the network project on MULTIFUN CSC0101 of Council of Scientific and Industrial Research (CSIR), Govt of India. S.D. thanks CSIR MULTIFUN for the fellowship. S.C. acknowledges University Grant Commission (UGC), Govt of India, for awarding senior research fellowship.
Supporting Information Available
The Supporting Information is available free of charge on the ACS Publications website at DOI: 10.1021/acsomega.7b02096.
Digital image of the G-Au NC solution under visible and UV light; absorption titrations of the AZO composite; fluorescence titrations of ZO nanoparticles and G-Au NCs with all of the studied DNAs; deconvoluted emission spectra of the composite with and without DNAs; F0–F versus [DNA]; fluorescence titrations of AZO with deoxyadenosine monophosphate, deoxythymine monophosphate, adenine, and thymine; liquid FT-IR study of AZO with all of the studied DNAs; temperature-dependent CD spectroscopic study of the AZO-CT DNA complex; and Hoechst displacement study (PDF)
Author Present Address
§ Centre for Advanced Materials, Indian Association for the Cultivation of Science, Kolkata 700032, India (S.M.).
The authors declare no competing financial interest.
Supplementary Material
References
- Howes P. D.; Chandrawati R.; Stevens M. M. Colloidal Nanoparticles as Advanced Biological Sensors. Science 2014, 346, 1247390 10.1126/science.1247390. [DOI] [PubMed] [Google Scholar]
- Anker J. N.; Hall W. P.; Lyandres O.; Shah N. C.; Zhao J.; Van Duyne R. P. Biosensing with Plasmonic Nanosensors. Nat. Mater. 2008, 7, 442–453. 10.1038/nmat2162. [DOI] [PubMed] [Google Scholar]
- Storhoff J. J.; Elghanian R.; Mirkin C. A.; Letsinger R. L. Sequence-Dependent Stability of DNA-Modified Gold Nanoparticles. Langmuir 2002, 18, 6666–6670. 10.1021/la0202428. [DOI] [Google Scholar]
- Tan S. J.; Campolongo M. J.; Luo D.; Cheng W. Building Plasmonic Nanostructures with DNA. Nat. Nanotechnol. 2011, 6, 268–276. 10.1038/nnano.2011.49. [DOI] [PubMed] [Google Scholar]
- Prado-Gotor R.; Grueso E. A Kinetic Study of the Interaction of DNA with Gold Nanoparticles: Mechanistic Aspects of the Interaction. Phys. Chem. Chem. Phys. 2011, 13, 1479–1489. 10.1039/C0CP00901F. [DOI] [PubMed] [Google Scholar]
- Liu J. Adsorption of DNA onto Gold Nanoparticles and Graphene Oxide: Surface Science and Applications. Phys. Chem. Chem. Phys. 2012, 14, 10485–10496. 10.1039/c2cp41186e. [DOI] [PubMed] [Google Scholar]
- Samanta A.; Medintz I. L. Nanoparticles and DNA – a Powerful and Growing Functional Combination in Bionanotechnology. Nanoscale 2016, 8, 9037–9045. 10.1039/C5NR08465B. [DOI] [PubMed] [Google Scholar]
- Pramanik S.; Chatterjee S.; Saha A.; Devi P. S.; Kumar G. S. Unraveling the Interaction of Silver Nanoparticles with Mammalian and Bacterial DNA. J. Phys. Chem. B 2016, 120, 5313–5324. 10.1021/acs.jpcb.6b01586. [DOI] [PubMed] [Google Scholar]
- Das S.; Pramanik S.; Chatterjee S.; Das P. P.; Devi P. S.; Kumar G. S. Selective Binding of Genomic Escherichia coli DNA with ZnO Leads to White Light Emission: A New Aspect of Nano-Bio Interaction and Interface. ACS Appl. Mater. Interfaces 2017, 9, 644–657. 10.1021/acsami.6b11109. [DOI] [PubMed] [Google Scholar]
- Roy A.; Chatterjee S.; Pramanik S.; Devi P. S.; Kumar G. S. Selective Detection of Escherichia coli DNA Using Fluorescent Carbon Spindles. Phys. Chem. Chem. Phys. 2016, 18, 12270–12277. 10.1039/c5cp07849k. [DOI] [PubMed] [Google Scholar]
- Sun D.; Gang O. Binary Heterogeneous Super lattices Assembled from Quantum Dots and Gold Nanoparticles with DNA. J. Am. Chem. Soc. 2011, 133, 5252–5254. 10.1021/ja111542t. [DOI] [PubMed] [Google Scholar]
- Das M.; Dhand C.; Sumana G.; Srivastava A.; Nagarajan R.; Nain L.; Iwamoto M.; Manaka T.; Malhotra B. D. Electrophoretic Fabrication of Chitosan-Zirconium-Oxide Nanobiocomposite Platform for Nucleic Acid Detection. Biomacromolecules 2011, 12, 540–547. 10.1021/bm1013074. [DOI] [PubMed] [Google Scholar]
- Huang Y.; Li H.; Wang L.; Mao X.; Li G. Highly Sensitive Protein Detection Based on Smart Hybrid Nanocomposite-Controlled Switch of DNA Polymerase Activity. ACS Appl. Mater. Interfaces 2016, 8, 28202–28207. 10.1021/acsami.6b09270. [DOI] [PubMed] [Google Scholar]
- Rao K. S.; Narasimha G.; Manorama S. V. Multifunctional Inorganic Nanocomposite of Fe3O4@SiO2@Ru(BiPy)2(BPC) for DNA Recognition. ChemistrySelect 2017, 2, 986–990. 10.1002/slct.201601912. [DOI] [Google Scholar]
- Dutta Chowdhury A.; Agnihotri N.; Doong R.; De A. Label-Free and Nondestructive Separation Technique for Isolation of Targeted DNA from DNA–Protein Mixture Using Magnetic Au–Fe3O4 Nanoprobes. Anal. Chem. 2017, 89, 12244–12251. 10.1021/acs.analchem.7b03095. [DOI] [PubMed] [Google Scholar]
- Tak M.; Gupta V.; Tomar M. Flower-like ZnO Nanostructure Based Electrochemical DNA Biosensor for Bacterial Meningitis Detection. Biosens. Bioelectron. 2014, 59, 200–207. 10.1016/j.bios.2014.03.036. [DOI] [PubMed] [Google Scholar]
- Mohammed A. M.; Ibraheem I. J.; Obaid A. S.; Bououdina M. Nanostructured ZnO-Based Biosensor: DNA Immobilization and Hybridization. Sens. Biosensing Res. 2017, 15, 46–52. 10.1016/j.sbsr.2017.07.003. [DOI] [Google Scholar]
- Kumar N.; Dorfman A.; Hahm J. Ultrasensitive DNA Sequence Detection Using Nanoscale ZnO Sensor Arrays. Nanotechnology 2006, 17, 2875–2881. 10.1088/0957-4484/17/12/009. [DOI] [Google Scholar]
- Ma L.; Liu B.; Huang P. J.; Zhang X.; Liu J. DNA Adsorption by ZnO Nanoparticles near Its Solubility Limit: Implications for DNA Fluorescence Quenching and DNAzyme Activity Assays. Langmuir 2016, 32, 5672–5680. 10.1021/acs.langmuir.6b00906. [DOI] [PubMed] [Google Scholar]
- Liu B.; Liu J. Comprehensive Screen of Metal Oxide Nanoparticles for DNA Adsorption, Fluorescence Quenching and Anion discrimination. ACS Appl. Mater. Interfaces 2015, 7, 24833–24838. 10.1021/acsami.5b08004. [DOI] [PubMed] [Google Scholar]
- Yang X.; Yang M.; Pang B.; Vara M.; Xia Y. Gold Nanomaterials at Work in Biomedicine. Chem. Rev. 2015, 115, 10410–10488. 10.1021/acs.chemrev.5b00193. [DOI] [PubMed] [Google Scholar]
- Li N.; Zhao P.; Astruc D. Anisotropic Gold Nanoparticles: Synthesis, Properties, Applications, and Toxicity. Angew. Chem., Int. Ed. 2014, 53, 1756–1789. 10.1002/anie.201300441. [DOI] [PubMed] [Google Scholar]
- Saha K.; Agasti S. S.; Kim C.; Li X.; Rotello V. M. Gold Nanoparticles in Chemical and Biological Sensing. Chem. Rev. 2012, 112, 2739–2779. 10.1021/cr2001178. [DOI] [PMC free article] [PubMed] [Google Scholar]
- Shen M.; Yang M.; Li H.; Liang Z.; Li G. A Novel Electrochemical Approach for Nuclear Factor Kappa B Detection Based on Triplex DNA and Gold Nanoparticles. Electrochim. Acta 2012, 60, 309–313. 10.1016/j.electacta.2011.11.047. [DOI] [Google Scholar]
- Zhu X.; Liu Y.; Yang J.; Liang Z.; Li G. Gold Nanoparticle-based Colorimetric Assay of Single-nucleotide Polymorphism of Triplex DNA. Biosens. Bioelectron. 2010, 25, 2135–2139. 10.1016/j.bios.2010.02.017. [DOI] [PubMed] [Google Scholar]
- Zhu X.; Liu M.; Zhang H.; Wang H.; Li G. A Chemical Approach to Accurately Characterize the Coverage Rate of Gold Nanoparticles. J. Nanopart. Res. 2013, 15, 1900 10.1007/s11051-013-1900-2. [DOI] [Google Scholar]
- Zhu X. L.; Yang Q. L.; Huang J. Y.; Suzuki I.; Li G. X. Colorimetric Study of the Interaction Between Gold Nanoparticles and a Series of Amino Acids. J. Nanosci. Nanotechnol. 2008, 8, 353–357. 10.1166/jnn.2008.013. [DOI] [PubMed] [Google Scholar]
- Purwidyantri A.; Chen C.-H.; Chen L.-Y.; Chen C.-C.; Luo J.-D.; Chiou C.-C; Tian Y.-C.; Lin C.-Y.; Yang C.-M.; Lai H.-C.; Lai C.-S. Speckled ZnO Nanograss Electrochemical Sensor for Staphylococcus epidermidis Detection. J. Electrochem. Soc. 2017, 164, B205–B211. 10.1149/2.0811706jes. [DOI] [Google Scholar]
- Singhal C.; Pundirb C. S.; Naranga J. A Genosensor for Detection of Consensus DNA Sequence of Dengue Virus using ZnO/Pt-Pd Nanocomposites. Biosens. Bioelectron. 2011, 40, 44–56. 10.1016/j.bios.2017.05.047. [DOI] [PubMed] [Google Scholar]
- Perumal V.; Hashim U.; Gopinath S. C. B.; Haarindraprasad R.; Foo K. L.; Balakrishnan S. R.; Poopalan P. ‘Spotted Nanoflowers’: Gold seeded Zinc Oxide Nanohybrid for Selective Bio-capture. Sci. Rep. 2015, 5, 12231. [DOI] [PMC free article] [PubMed] [Google Scholar]
- Foo K. L.; Hashim U.; Voon C. H.; Kashif M.; Ali M. E. Au Decorated ZnO Thin Film: Application to DNA Sensing. Microsyst. Technol. 2016, 22, 903–910. 10.1007/s00542-015-2572-x. [DOI] [Google Scholar]
- Tagit O.; Hildebrandt N. Fluorescence Sensing of Circulating Diagnostic Biomarkers Using Molecular Probes and Nanoparticles. ACS Sens. 2017, 2, 31–45. 10.1021/acssensors.6b00625. [DOI] [PubMed] [Google Scholar]
- Liu Y.; Zhong M.; Shan G.; Li Y.; Huang B.; Yang G. Biocompatible ZnO/Au Nanocomposites for Ultrasensitive DNA Detection Using Resonance Raman Scattering. J. Phys. Chem. B 2008, 112, 6484–6489. 10.1021/jp710399d. [DOI] [PubMed] [Google Scholar]
- Pei Y.; Zeng X. C. Investigating the Structural Evolution of Thiolate Protected Gold Clusters from First-Principles. Nanoscale 2012, 4, 4054–4072. 10.1039/c2nr30685a. [DOI] [PubMed] [Google Scholar]
- Chen L. Y.; Wang C. W.; Yuan Z. Q.; Chang H. T. Fluorescent Gold Nanoclusters: Recent Advances in Sensing and Imaging. Anal. Chem. 2015, 87, 216–229. 10.1021/ac503636j. [DOI] [PubMed] [Google Scholar]
- Jin R.; Zeng C.; Zhou M.; Chen Y. Atomically Precise Colloidal Metal Nanoclusters and Nanoparticles: Fundamentals and Opportunities. Chem. Rev. 2016, 116, 10346–10413. 10.1021/acs.chemrev.5b00703. [DOI] [PubMed] [Google Scholar]
- Jiang X.; Feng D. Q.; Liub G.; Fanb D.; Wang W. A Fluorescent Switch Sensor for Detection of Anticancer Drug and CT DNA Based on the Glutathione Stabilized Gold Nanoclusters. Sens. Actuators, B 2016, 232, 276–282. 10.1016/j.snb.2016.03.100. [DOI] [Google Scholar]
- Jena N. K.; Chandrakumar K. R. S.; Ghosh S. K. DNA Base–Gold Nanocluster Complex as a Potential Catalyzing Agent: An Attractive Route for CO Oxidation Process. J. Phys. Chem. C 2012, 116, 17063–17069. 10.1021/jp3046609. [DOI] [Google Scholar]
- Sarmah A.; Roy R. K. Interaction between Small Gold Clusters and Nucleobases: A Density Functional Reactivity Theory Based Study. J. Phys. Chem. C 2015, 119, 17940–17953. 10.1021/acs.jpcc.5b04948. [DOI] [Google Scholar]
- Shukla M. K.; Dubey M.; Zakar E.; Leszczynski J. DFT Investigation of the Interaction of Gold Nanoclusters with Nucleic Acid Base Guanine and the Watson–Crick Guanine-Cytosine Base Pair. J. Phys. Chem. C 2009, 113, 3960–3966. 10.1021/jp808622y. [DOI] [Google Scholar]
- Kimura-Suda H.; Petrovykh D. Y.; Tarlov M. J.; Whitman L. J. Base-Dependent Competitive Adsorption of Single-Stranded DNA on Gold. J. Am. Chem. Soc. 2003, 125, 9014–9015. 10.1021/ja035756n. [DOI] [PubMed] [Google Scholar]
- Kryachko E. S.; Remacle F. Complexes of DNA Bases and Gold Clusters Au3 and Au4 Involving Nonconventional N–H···Au Hydrogen Bonding. Nano Lett. 2005, 5, 735–739. 10.1021/nl050194m. [DOI] [PubMed] [Google Scholar]
- Das S.; Chatterjee S.; Pramanik S.; Devi P. S.; Kumar G. S. A New Insight into the Interaction of ZnO with Calf thymus DNA through Surface Defects. J. Photochem. Photobiol., B 2018, 178, 339–347. 10.1016/j.jphotobiol.2017.10.039. [DOI] [PubMed] [Google Scholar]
- Im J.; Singh J.; Soares J. W.; Steeves D. M.; Whitten J. E. Synthesis and Optical Properties of Dithiol-Linked ZnO/Gold Nanoparticle Composites. J. Phys. Chem. C 2011, 115, 10518–10523. 10.1021/jp202461f. [DOI] [Google Scholar]
- Wu Z. K.; Chen J.; Jin R. C. One-Pot Synthesis of Au25(SG)18 2- and 4-nm Gold Nanoparticles and Comparison of Their Size-Dependent Properties. Adv. Funct. Mater. 2011, 21, 177–183. 10.1002/adfm.201001120. [DOI] [Google Scholar]
- Das P. P.; Agarkar S. A.; Mukhopadhyay S.; Manju U.; Ogale S. B.; Sujatha Devi P. Defects in Chemically Synthesized and Thermally Processed ZnO Nanorods: Implications for Active Layer Properties in Dye-sensitized Solar Cells. Inorg. Chem. 2014, 53, 3961–3972. 10.1021/ic500279q. [DOI] [PubMed] [Google Scholar]
- Liu S.; Xu Y.-J. Photo-induced Transformation Process at Gold Clusters Semiconductor Interface: Implications for the Complexity of Gold Clusters-based Photocatalysis. Sci. Rep. 2016, 6, 22742 10.1038/srep22742. [DOI] [PMC free article] [PubMed] [Google Scholar]
- Verma S.; Jain S. L. Nanosized Zinc Peroxide (ZnO2): A Novel Inorganic Oxidant for the Oxidation of Aromatic Alcohols to Carbonyl Compounds. Inorg. Chem. Front. 2014, 1, 534–539. 10.1039/C3QI00092C. [DOI] [Google Scholar]
- Noei H.; Qiu H.; Wang Y.; Löffler E.; Wöll C.; Muhler M. M. The Identification of Hydroxyl Groups on ZnO Nanoparticles by Infrared Spectroscopy. Phys. Chem. Chem. Phys. 2008, 10, 7092–7097. 10.1039/b811029h. [DOI] [PubMed] [Google Scholar]
- Gao X.; Lu Y.; Liu M.; He S.; Chen W. Sub-nanometer Sized Cu6(GSH)3 Clusters: One-step Synthesis and Electrochemical Detection of Glucose. J. Mater. Chem. C 2015, 3, 4050–4056. 10.1039/C5TC00246J. [DOI] [Google Scholar]
- Yu M.; Zhou C.; Liu J.; Hankins J. D.; Zheng J. Luminescent Gold Nanoparticles with pH-Dependent Membrane Adsorption. J. Am. Chem. Soc. 2011, 133, 11014–11017. 10.1021/ja201930p. [DOI] [PMC free article] [PubMed] [Google Scholar]
- Luo Z.; Yuan X.; Yu Y.; Zhang Q.; Leong D. T.; Lee J. Y.; Xie J. From Aggregation-Induced Emission of Au(I)–Thiolate Complexes to Ultrabright Au(0)@Au(I)–Thiolate Core–Shell Nanoclusters. J. Am. Chem. Soc. 2012, 134, 16662–16670. 10.1021/ja306199p. [DOI] [PubMed] [Google Scholar]
- Negishi Y.; Nobusada K.; Tsukuda T. Glutathione-Protected Gold Clusters Revisited: Bridging the Gap between Gold(I)–Thiolate Complexes and Thiolate-Protected Gold Nanocrystals. J. Am. Chem. Soc. 2005, 127, 5261–5270. 10.1021/ja042218h. [DOI] [PubMed] [Google Scholar]
- Yu Y.; Chen X.; Yao Q. F.; Yu Y.; Yan N.; Xie J. P. Scalable and Precise Synthesis of Thiolated Au10–12, Au15, Au18, and Au25 Nanoclusters via pH Controlled CO Reduction. Chem. Mater. 2013, 25, 946–952. 10.1021/cm304098x. [DOI] [Google Scholar]
- Mukhopadhyay S.; Das P. P.; Maity S.; Ghosh P.; Devi P. S. Solution Grown ZnO Rods: Synthesis, Characterization and Defect Mediated Photocatalytic Activity. Appl. Catal., B 2015, 165, 128–138. 10.1016/j.apcatb.2014.09.045. [DOI] [Google Scholar]
- Zhang J.; Yuan Y.; Liang G.; Arshad M. N.; Albar H. A.; Sobahic T. R.; Yu S. H. A Microwave-facilitated Rapid Synthesis of Gold Nanoclusters with Tunable Optical Properties for Sensing Ions and Fluorescent Ink. Chem. Commun. 2015, 51, 10539–10542. 10.1039/c5cc03086b. [DOI] [PubMed] [Google Scholar]
- Akhlaghi Y.; Kompany-Zareh M.; Hormozi-Nezhad M. R. Multiway Investigation of Interaction between Fluorescence Labeled DNA Strands and Unmodified Gold Nanoparticles. Anal. Chem. 2012, 84, 6603–6610. 10.1021/ac3008576. [DOI] [PubMed] [Google Scholar]
- Saha S.; Sarkar P. Understanding the Interaction of DNA-RNA Nucleobases with Different ZnO Nanomaterials. Phys. Chem. Chem. Phys. 2014, 16, 15355–15366. 10.1039/c4cp01041h. [DOI] [PubMed] [Google Scholar]
- Elmes R. B. P.; Orange K. N.; Cloonan S. M.; Williams D. C.; Gunnlaugsson T. Luminescent Ruthenium(II) Polypyridyl Functionalized Gold Nanoparticles; Their DNA Binding Abilities and Application As Cellular Imaging Agents. J. Am. Chem. Soc. 2011, 133, 15862–15865. 10.1021/ja2061159. [DOI] [PubMed] [Google Scholar]
- Martínez-Calvo M.; Orange K. N.; Elmes R. B. P.; Poulsen B. C.; Williams D. C.; Gunnlaugsson T. Ru(II)-polypyridyl Surface Functionalised Gold Nanoparticles as DNA Targeting Supramolecular Structures and Luminescent Cellular Imaging Agents. Nanoscale 2016, 8, 563–574. 10.1039/c5nr05598a. [DOI] [PubMed] [Google Scholar]
- Mukhopadhyay S.; Maiti D.; Chatterjee S.; Devi P. S.; Kumar G. S. Design and Application of Au decorated ZnO/TiO2 as a Stable Photocatalyst for Wide Spectral Coverage. Phys. Chem. Chem. Phys. 2016, 18, 31622–31633. 10.1039/c6cp06903g. [DOI] [PubMed] [Google Scholar]
- Ono L. K.; Cuenya B. R. Formation and Thermal Stability of Au2O3 on Gold Nanoparticles: Size and Support Effects. J. Phys. Chem. C 2008, 112, 4676–4686. 10.1021/jp711277u. [DOI] [Google Scholar]
- Leelavathi A.; Madrasa G.; Ravishankar N. Origin of Enhanced Photocatalytic Activity and Photoconduction in High Aspect Ratio ZnO Nanorods. Phys. Chem. Chem. Phys. 2013, 15, 10795–10802. 10.1039/c3cp51058a. [DOI] [PubMed] [Google Scholar]
- Wood B. R. The Importance of Hydration and DNA Conformation in Interpreting Infrared Spectra of Cells and Tissues. Chem. Soc. Rev. 2016, 45, 1980–1998. 10.1039/C5CS00511F. [DOI] [PubMed] [Google Scholar]
- Deiana M.; Mettra B.; Matczyszyn K.; Piela K.; Pitrat D.; Banska J. O.; Monnereau C.; Andraud C.; Samoc M. Interactions of a Biocompatible Water-soluble Anthracenyl Polymer Derivative with Double-stranded DNA. Phys. Chem. Chem. Phys. 2015, 17, 30318–30327. 10.1039/c5cp05381a. [DOI] [PubMed] [Google Scholar]
- Lu K. C.; Prohofsky E. W.; Van Zandt L. L. Vibrational modes of A-DNA, B-DNA and A-RNA Backbones: An Application of a Green-function Refinement Procedure. Biopolymers 1977, 16, 2491–2506. 10.1002/bip.1977.360161112. [DOI] [PubMed] [Google Scholar]
- Polyanichko A. M.; Andrushchenko V. V.; Chikhirzhina E. V.; Vorob’ev V. I.; Wieser H. The Effect of Manganese(II) on DNA Structure: Electronic and Vibrational Circular Dichroism Studies. Nucleic Acids Res. 2004, 32, 989–999. 10.1093/nar/gkh242. [DOI] [PMC free article] [PubMed] [Google Scholar]
- Ross P. D.; Subramanian S. Thermodynamics of Protein Association Reactions: Forces Contributing to Stability. Biochemistry 1981, 20, 3096–3102. 10.1093/nar/gkh242. [DOI] [PubMed] [Google Scholar]
- Yang R.; Jin J. Y.; Chen Y.; Shao N.; Kang H. Z.; Xiao Z. Y.; Tang Z. W.; Wu Y. R.; Zhu Z.; Tan W. H. Carbon Nanotube-Quenched Fluorescent Oligonucleotides: Probes that Fluoresce upon Hybridization. J. Am. Chem. Soc. 2008, 130, 8351–8358. 10.1021/ja800604z. [DOI] [PubMed] [Google Scholar]
- Zhang L.; Guo S. J.; Dong S. J.; Wang E. K. Pd Nanowires as New Biosensing Materials for Magnified Fluorescent Detection of Nucleic Acid. Anal. Chem. 2012, 84, 3568–3573. 10.1021/ac2032194. [DOI] [PubMed] [Google Scholar]
- Dong H.; Gao W. C.; Yan F.; Ji H. X.; Ju H. X. Fluorescence Resonance Energy Transfer between Quantum Dots and Graphene Oxide for Sensing Biomolecules. Anal. Chem. 2010, 82, 5511–5517. 10.1021/ac100852z. [DOI] [PubMed] [Google Scholar]
- Zhu C.; Zeng Z. Y.; Li H.; Li F.; Fan C. H.; Zhang H. Single-Layer MoS2-Based Nanoprobes for Homogeneous Detection of Biomolecules. J. Am. Chem. Soc. 2013, 135, 5998–6001. 10.1021/ja4019572. [DOI] [PubMed] [Google Scholar]
- Wang Q.; Wang W.; Lei J.; Xu N.; Gao F.; Ju H. Fluorescence Quenching of Carbon Nitride Nanosheet through Its Interaction with DNA for Versatile Fluorescence Sensing. Anal. Chem. 2013, 85, 12182–12188. 10.1021/ac403646n. [DOI] [PubMed] [Google Scholar]
- Zhao D.; Chan W. H.; He Z.; Qiu T. Quantum Dot-Ruthenium Complex Dyads: Recognition of Double-Strand DNA through Dual-Color Fluorescence Detection. Anal. Chem. 2009, 81, 3537–3543. 10.1021/ac9000892. [DOI] [PubMed] [Google Scholar]
- Zhang Z.; Sharon E.; Freeman R.; Liu X.; Willner I. Fluorescence Detection of DNA, Adenosine-5′-Triphosphate (ATP), and Telomerase Activity by Zinc(II)-Protoporphyrin IX/G-Quadruplex Labels. Anal. Chem. 2012, 84, 4789–4797. 10.1021/ac300348v. [DOI] [PubMed] [Google Scholar]
- Chen J.; Ji X.; Tinnefeld P.; He Z. Multifunctional Dumbbell-Shaped DNA-Templated Selective Formation of Fluorescent Silver Nanoclusters or Copper Nanoparticles for Sensitive Detection of Biomolecules. ACS Appl. Mater. Interfaces 2016, 8, 1786–1794. 10.1021/acsami.5b09678. [DOI] [PubMed] [Google Scholar]
- Shen Y.; Zhang N.; Sun Y.; Zhao W.; Ye D.; Xu J.; Chen H. Activatable QD-Based Near-Infrared Fluorescence Probe for Sensitive Detection and Imaging of DNA. ACS Appl. Mater. Interfaces 2017, 9, 25107–25113. 10.1021/acsami.7b05871. [DOI] [PubMed] [Google Scholar]
- Ma J.-L.; Yin B.; Le H.; Ye B. Label-Free Detection of Sequence-Specific DNA Based on Fluorescent Silver Nanoclusters-Assisted Surface Plasmon-Enhanced Energy Transfer. ACS Appl. Mater. Interfaces 2015, 7, 12856–12863. 10.1021/acsami.5b03837. [DOI] [PubMed] [Google Scholar]
- Feng L.; Liu J.; Zhang S. C.; Zhang X. R. Label-free DNA Detection Based on a DNA–Silver Nanocluster Pair. Anal. Methods 2015, 7, 5689–5694. 10.1039/C5AY01194A. [DOI] [Google Scholar]
- Gowtham S.; Scheicher R. H.; Pandey R.; Karna S. P.; Ahuja R. First-principles Study of Physisorption of Nucleic Acid Bases on Small-diameter Carbon Nanotubes. Nanotechnology 2008, 19, 125701 10.1088/0957-4484/19/12/125701. [DOI] [PubMed] [Google Scholar]
- Lu G.; Maragakie P.; Kaxirac E. Carbon Nanotube Interaction with DNA. Nano Lett. 2005, 5, 897–900. 10.1021/nl050354u. [DOI] [PubMed] [Google Scholar]
- Kryachko E. S.; Remacle F. Complexes of DNA Bases and Watson-Crick Base Pairs with Small Neutral Gold Clusters. J. Phys. Chem. B 2005, 109, 22746–22757. 10.1021/jp054708h. [DOI] [PubMed] [Google Scholar]
- Soto-Verdugo V.; Metiu H.; Gwinn E. The Properties of Small Ag Clusters Bound to DNA Bases. J. Chem. Phys. 2010, 132, 195102 10.1063/1.3419930. [DOI] [PubMed] [Google Scholar]
- Roy S.; Sadhukhan R.; Ghosh U.; Das T. K. Interaction Studies Between Biosynthesized Silver Nanoparticle with Calf thymus DNA and Cytotoxicity of Silver Nanoparticles. Spectrochim. Acta, Part A 2015, 141, 176–184. 10.1016/j.saa.2015.01.041. [DOI] [PubMed] [Google Scholar]
- Prado-Gotor R.; Grueso E. A Kinetic Study of the Interaction of DNA with Gold Nanoparticles: Mechanistic Aspects of the Interaction. Phys. Chem. Chem. Phys. 2011, 13, 1479–1489. 10.1039/C0CP00901F. [DOI] [PubMed] [Google Scholar]
- Babu E. P.; Subastri A.; Suyavaran A.; Lokeshwarara P.; Kumar M. S.; Jeevaratnama K.; Thirunavukkarasua C. Extracellularly Synthesized ZnO Nanoparticles Interact with DNA and Augment Gamma Radiation Induced DNA Damage Through Reactive Oxygen Species. RSC Adv. 2015, 5, 62067–62077. 10.1039/C5RA09935H. [DOI] [Google Scholar]
- Devi P. S.; Banerjee S.; Roy Chowdhury S.; Kumar G. S. Eggshell Membrane: A Natural Biotemplate to Synthesize Fluorescent Gold Nanoparticles. RSC Adv. 2012, 2, 11578–11585. 10.1039/c2ra21053c. [DOI] [Google Scholar]
Associated Data
This section collects any data citations, data availability statements, or supplementary materials included in this article.


