Abstract
Thermally fluctuating biofilaments possessing porous structures or viscoelastic properties exhibit energy losses from internal friction as well as external friction from drag. Prior models for internal friction account for energy dissipation solely from the dynamic bending of filaments. In this paper, we present a new energy dissipation model that captures the important effects of dynamic shear in addition to bending. Importantly, we highlight that shear-induced friction plays a major role in energy dissipation for shorter filaments and for shorter wavelengths (larger wavenumbers). The new model exhibits coupled shear-bending energy relaxation on two distinct time scales in lieu of a single time scale predicted by bending alone. We employ this model to interpret results from prior experiments on the internal friction of thermally fluctuating chromosomes and the drag-induced friction of thermally fluctuating microtubules. The examples confirm the energy relaxation on two time scales associated with internal friction and on two length scales associated with external friction. Overall, this new model that accounts for shear deformation yields superior estimates of energy dissipation for fluctuating biofilaments.
Introduction
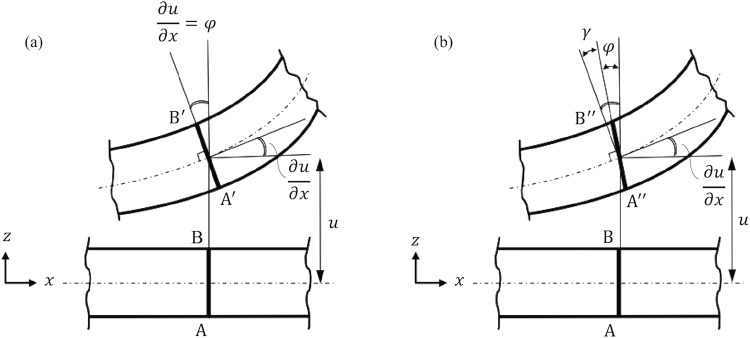
Biofilaments including microtubules, DNA, and actin filaments are semiflexible micro-scale polymer structures that perform essential functions in living cells. Understanding the dynamical behavior and the material properties of biofilaments are central to understanding their structure-function relations. A variety of models describe the material stiffness and thermal fluctuations of biofilaments1–6. Primary among these is the worm-like chain (WLC) model7,8 which represents a biofilament as a continuous isotropic rod undergoing dynamic bending while subject to thermal excitation and hydrodynamic drag9–11. Poirier and Marko12 extend the WLC model to account for internal friction due to dynamic bending. Subsequent studies have employed that model to describe the internal dissipation of biofilaments in addition to external friction due to hydrodynamic drag4,11–13. However, the WLC model8 and its extension for bending-induced internal friction12 are based on classical Euler-Bernoulli theory for beam bending14 which tacitly assumes that the cross sections of the filament remain planar and perpendicular to the (fluctuating) filament centerline; see Fig. 1a. These kinematic assumptions, which remain accurate only for long filaments and long wavelength (small wavenumber) fluctuations, limit the applicability of the WLC model.
Figure 1.
Schematic of rod cross section before deformation (bottom) and after deformation (top). The worm-like chain model employs Euler-Bernoulli theory in which the deformed cross section A′B′ remains perpendicular to the rod centerline (a). In Timoshenko theory, the deformed cross section A″B″ does not remain perpendicular to the rod centerline due to the additional rotation due to shear (b). In particular, φ and γ are the rotations due to bending deformation and shear deformation, respectively, and thus is the total rotation of the deformed cross section.
However, understanding the dynamics of short biofilaments remains of great interest when one considers the many short-range interactions within the cell achieved through biofilaments as well as biophysical experiments on short biofilaments. For example, short (<10 μm long15) microtubules are actively recruited in intracellular transport and cellular mitosis while short (<5 μm long16) actin filaments, responsible for cell motility, dominate the distribution of actin. Key measures of biofilament length include the ratio of the filament length to diameter L/2r and the ratio of the wavelength of dynamic fluctuations to the filament radius λ/r. For short filaments (L/2r < 10)14,17 or short wavelength fluctuations (λ/r < 10)14, the effect of shear deformation becomes important relative to bending deformation. At these length scales, the filament exhibits direct shear deformation and the filament cross sections no longer remain perpendicular to the filament centerline (see Fig. 1b) as assumed in the WLC model (see Fig. 1a). This shear effect in biofilaments can be quite pronounced as exposed herein in the context of internal friction. The effect of shear on the stiffness properties of short biofilaments has previously been observed in18,19. For example, Pampaloni et al.19 measured the persistence length of thermally fluctuating microtubules having lengths from 2.6 to 47.5 μm. Both theory and experiment confirm that the persistence length of short microtubules (shorter than 21 μm) is length-dependent as a consequence of shear deformation. Thus, it stands to reason that shear deformation in thermally fluctuating biofilaments may also significantly affect dissipation properties as well. To address this hypothesis, we present a new model for thermally fluctuating biofilaments, based on Timoshenko beam theory, which considers shear deformation as an additional source of elastic deformation and energy dissipation. This model reveals important effects of dynamic shear (above those due to dynamic bending) on both internal and external dissipation mechanisms. Results demonstrate that shear deformation leads to qualitatively new energy dissipation behaviors including dissipation dynamics on two time scales associated with internal friction and on two length scales associated with external friction. These new theoretical predictions successfully describe the experimental trends observable in studies of fluctuating chromosomal fragments12 and microtubules13.
Methods
We propose a model of energy dissipation for thermally fluctuating biofilaments possessing short lengths (L/2r < 10)14,17 or short wavelength fluctuations (λ/r < 10)14 in which shear deformation is not negligible. To this end, we employ Timoshenko beam theory14 which models the coupled bending-shear deformations of elastic rods. The governing Langevin formulation is
| 1 |
| 2 |
in which u(x, t) denotes the fluctuating transverse displacement of the filament (in directions perpendicular to the filament centerline) due to random thermal excitation n(x, t), x denotes the filament contour length coordinate, and t denotes time. The quantities φ and are the components of the rotation of the filament cross section due to bending deformation and shear deformation, respectively. The filament bending stiffness B = EI is composed of the filament’s Young’s modulus E and area moment of inertia I while the filament shear stiffness S = GA is composed of the filament’s shear modulus G and cross sectional area A. The quantity κ denotes the Timoshenko shear correction factor which, for a filament with circular cross section, is κ = 0.7514. Here, η denotes the external hydrodynamic drag coefficient (Stoke’s regime), and and are the internal dissipation coefficients due to bending and shear deformations, respectively. Consequently, the third and fourth terms in (1) and the second term in (2) model the internal dissipation due to shear (coefficient ) and bending (coefficient ). Consistent with the Langevin formulation, the inertial terms that otherwise appear in Timoshenko theory14 are neglected. A derivation of (1–2) is included in the Supplemental Materials.
As in prior analyses12, energy dissipation can be quantified by computing the autocorrelation function for the transverse displacement u for thermal fluctuations assuming ideal (white) thermal noise. To this end, the autocorrelation function for u follows from a Fourier transform of (1) and (2)
| 3 |
| 4 |
in which Uqω and Φqω denote the (double) Fourier transforms of the transverse displacement u and the rotation φ, respectively. The quantities q and ω are the wavenumber and frequency of propagating waves, respectively. The resulting autocorrelation function (derived in the Supplemental Materials) becomes
| 5 |
| 6 |
Here τ1 and τ2 are two distinct energy relaxation times and T is the lag-time. Thus, this result immediately reveals that energy relaxation occurs on the two time scales τ1 and τ2 that are functions of the wavenumber q, internal viscosities and , and hydrodynamic drag η through the quantities M, N, and P detailed in the Supplemental Materials. We discuss these time scales and the effects of shear deformation in detail below.
In the limit of long filaments or long wavelengths, the shear deformation is negligible and the total rotation of the cross section due to bending alone obeys the kinematic constraint Upon employing this constraint, the formulation above recovers the single time scale autocorrelation function for the WLC model (based on Euler-Bernoulli beam theory) employed in12.
| 7 |
| 8 |
For further reference, (8) becomes
| 9 |
in which q* = qL is a non-dimensional wavenumber with L being the filament length.
While the above analysis (5 and 6) reveals the effects of shear on internal friction, one can perform a parallel analysis to expose the effects of shear on external friction due to hydrodynamic drag alone. In this case , Eqs (1 and 2) simplify to
| 10 |
| 11 |
The associated autocorrelation for u and its relaxation time τd become
| 12 |
| 13 |
Details of this analysis are provided in the Supplemental Materials. For further reference, (13) is expanded as
| 14 |
to reveal the explicit dependence of this relaxation time on two length scales. By contrast, for long filaments or long wavelengths, the WLC model ((9) with ) predicts that the relaxation time τ due to external friction depends on a single length scale per
| 15 |
Results and Discussion
Internal friction in large and small wavenumber limits
Equation (5), based on Timoshenko beam theory, explicitly accounts for the direct shear of filaments which is ignored in the prior formulations based on Euler-Bernoulli beam theory. Importantly, (5) reveals that the energy relaxation arises on two time scales τ1 and τ2. Thus, the physics of internal friction when shear is included is qualitatively different from that when shear is ignored for which single time scale relaxation (7) occurs.
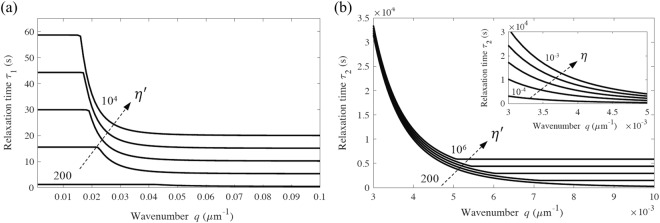
Figure 2 illustrates the dependence of the two relaxation times τ1 and τ2 (6) with wavenumber q over a wide range of values for as examples. The parameters selected pertain to a thermally fluctuating chromosomal filament12 having E = 500 Pa, r = 1 μm, η = 0.001, and G = 227 Pa (Poisson’s ratio υ = 0.1)20. Inspection of Fig. 2 reveals that τ1 and τ2 become independent of wavenumber in the large wavenumber (q → ∞) limit for which (6) yields
| 16 |
Figure 2.
Main figure: Relaxation times (a) τ1 and (b) τ2 for the autocorrelation of transverse displacement of a thermally fluctuating chromosome. Properties: E = 500 Pa, r = 1 μm, η = 0.001 kg/(m.s)12, G = 227 Pa, and ranging from 200 to 104 kg/(m.s) for (a) and from 200 to 106 kg/(m.s) for (b). Inset: In the small wavenumber limit, the relaxation time τ2 is independent of η′, however, it scales with the hydrodynamic drag coefficient, η, ranging from 0.0001 to 0.001 kg/(m.s).
For comparison, the relaxation time (8) from Euler-Bernoulli theory reduces to
| 17 |
From (16) and (17), the relaxation time τ1 from Timoshenko theory recovers the relaxation time τ from Euler-Bernoulli theory, in the large wavenumber limit. However, the relaxation time τ2 defines a second time scale, a shear relaxation time that cannot be captured by modeling thermal fluctuations using Euler-Bernoulli theory.
Figure 2 also reveals the expected limiting behaviors at small wavenumbers. In the small wavenumber (q → 0) limit, (6) yields
| 18 |
Thus, τ2 reproduces the same limit from Euler-Bernoulli theory (8) at the small wavenumber limit which confirms the overwhelming influence of hydrodynamic drag over bending-induced internal friction12. As further illustrated in Fig. 2b in this limit, the relaxation time τ2 becomes independent of internal dissipation (η′), and scales with hydrodynamic drag (η); see Fig. 2b (inset). However, τ1 depends on the shear internal dissipation coefficient in this limit. In particular, for q → 0, the wavelength approaches infinity, and the filament fluctuations reduce to essentially rigid body motions without significant internal friction but with significant external friction due to hydrodynamic drag.
Experimental evidence of shear effect on internal friction
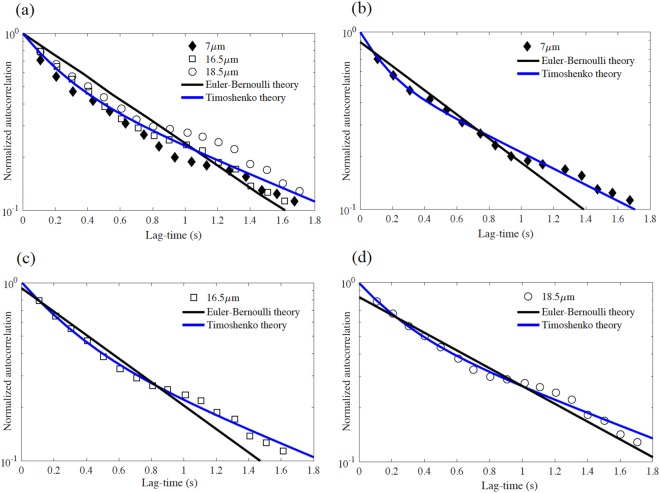
We employ the new model, based on Timoshenko theory, to evaluate results of prior experiments on the internal friction for thermally fluctuating chromosomes of varying length12. The chromosomal segments considered formed cantilevers of lengths 7, 16.5, and 18.5 μm having estimated properties: E = 500 Pa, G = 227 Pa, r = 1 μm, and η = 0.001 kg/(m.s). The measured autocorrelation of the transverse fluctuations of all three chromosome lengths are illustrated in Fig. 3a as well as the best-fit curves employing Timoshenko (5) and Euler-Bernoulli (7) theory. We employ a standard “fit” function in MATLAB™ that employs “Nonlinear Least Squares” to solve for (fit) the four unknown model parameters (R1, R2, τ1, and τ2) in (5) and the two unknown model parameters (R and τ) in (7) to the experimental data.
Figure 3.
(a) Experimental autocorrelations of transverse displacement of thermally fluctuating chromosomes reported in12 for all three chromosome lengths and with model fits determined by Timoshenko theory (5) and Euler-Bernoulli theory (7). Autocorrelations for (b) 7 μm-chromosome, (c) 16.5 μm-chromosome, and (d) 18.5 μm-chromosome.
Notice that the experimental data deviate from the single time scale behavior (7), a feature most evident for the shortest chromosome (7 μm); see Fig. 3b and note log scale. For all lengths, the data clearly exhibit the two time scale behavior consistent with (5). Consequently, Timoshenko theory yields superior fits to the experimental data for all chromosome lengths (Fig. 3b–d) or averaged across all lengths (Fig. 3a). To quantify the degree of fit, we report the root mean squared error (RMSE) between the model fit to the experimental autocorrelation in Table 1; refer to column 4. The root mean squared error using Timoshenko theory remains less than that for the Euler-Bernoulli theory by a factor of 4 for the shortest length (Fig. 3b) to a factor of 2 (Fig. 3d) for the longest length. This trend confirms the expectation that shear deformation becomes increasingly important with the shorter filament lengths commonly found in the cell.
Table 1.
The relaxation times and internal dissipation coefficients of three chromosomes modeled by Euler-Bernoulli (EB) theory and Timoshenko (T) theory.
| Chromosome length, L (μm) | Dominant wavenumber, qdom ≈ π/2L (μm−1) | Theory | RMSE | Relaxation time (s) from fitting (5) and (7) to experimental data | Internal dissipation coefficients (kg/(m.s)) at dominant wavenumber using (6) and (8) | Internal dissipation coefficients (kg/(m.s)) at large wavenumber limit using (16) and (17) |
|---|---|---|---|---|---|---|
| 7 | 0.22 | EB | 0.052 | τ = 0.64 | ||
| T | 0.013 | τ1 = 0.13, τ2 = 0.95 | , | , | ||
| 16.5 | 0.09 | EB | 0.039 | τ = 0.66 | ||
| T | 0.012 | τ1 = 0.27, τ2 = 1.16 | , | , | ||
| 18.5 | 0.08 | EB | 0.030 | τ = 0.87 | ||
| T | 0.015 | τ1 = 0.23, τ2 = 1.23 | , | , | ||
| All three-lengths combined | — | EB | 0.050 | τ = 0.70 | — | |
| T | 0.031 | τ1 = 0.22, τ2 = 1.13 | — | , |
The root mean squared error (RMSE) represents the square root of the integral of the square of the difference between the experimentally measured autocorrelation and the associated theoretical fit.
The thermal fluctuations of the chromosomes are dominated by the smallest wavenumber bending mode, q ≈ π/2L for cantilevered chromosomes. We also report in Table 1 the dominant wavenumber for each of the three chromosome lengths and the associated relaxation times and internal dissipation coefficients as predicted by Timoshenko (5) and Euler-Bernoulli (7) theory. From (16) (and as illustrated in Fig. 2), the relaxation times in the large wavenumber limit are approximately for q > 0.06 μm−1 and for q > 0.007 μm−1, respectively. Since the dominant wavenumbers of the three chromosomes (qdom = 0.22, 0.09, 0.08 μm−1) are all within the range of this limiting behavior (q > 0.06, 0.007 μm−1), we expect the internal viscosity coefficients and from (6) to be consistent with those of the large wavenumber limit (16) which are also reported in Table 1 (last column). The process of fitting two exponentials (5) to the experimental autocorrelations via nonlinear least squares yields two solutions for τ1 and τ2. For example, for the 7 μm length chromosome in Fig. 3, we obtain the two solutions:
(a) τ1 = 0.13, τ2 = 0.95
(b) τ1 = 0.95, τ2 = 0.13
Since the dominant wavenumber of the 7 μm length chromosome (qdom = 0.22 μm−1) is in the large wavenumber limit, we expect the internal viscosity coefficients and from (6) to be consistent with those of the large wavenumber limit (16). Accordingly, the first solution (a) is accepted and the second solution (b) is rejected. This procedure leads to the relaxation times and the associated internal dissipation coefficients for bending and shear reported in Table 1 (and for all chromosome lengths).
The effective internal dissipation coefficient of mitotic chromosomes measured by dynamic force relaxation has been reported as η′ ≈ 100 kg/(m.s)21. Consequently, Poirier and Marko12 expected the bending relaxation time to be 0.3s. However, the estimated relaxation time based on Euler-Bernoulli theory (7) for the three chromosomes yields τ ≈ 0.7s12 and ; refer to Table 1 and Fig. 3a. By contrast, the relaxation time τ1 based on Timoshenko theory (5) yields τ1 ≈ 0.22s, which is significantly closer to the expected value. Consequently, the bending internal dissipation coefficient from Timoshenko theory (16) is also consistent with the experimental value η′ ≈ 100 kg/(m.s)21. Further, note that while the relaxation time calculated by Euler-Bernoulli theory (7) is close to the average of two relaxation times calculated by Timoshenko theory (5), the latter captures the two-stage (two-exponential) relaxation behavior evident in the experimental results of Fig. 3 for all chromosome lengths. Finally note that, as mentioned before, the effect of shear increases in the large wavenumber limit, specifically when λ/r < 1014, and this limit naturally arises in the spectrum of the thermal fluctuations of biofilaments.
Effect of shear on external friction due to hydrodynamic drag
Figure 4 illustrates the predicted dependence of τd with wavenumber q over a wide range of η for (chromosomal) filaments. In the large wavenumber limit (q → ∞) in (13), τd → ; see Fig. 4. In the small wavenumber limit (q → 0) in (13), τd → which recovers the limiting behavior of Euler-Bernoulli theory (15). Thus, shear deformation can be ignored in the small wavenumber limit for fluctuating filaments having no internal friction. Also in this limit, the wavelength approaches infinity and the filament fluctuations reduce to rigid body motions.
Figure 4.
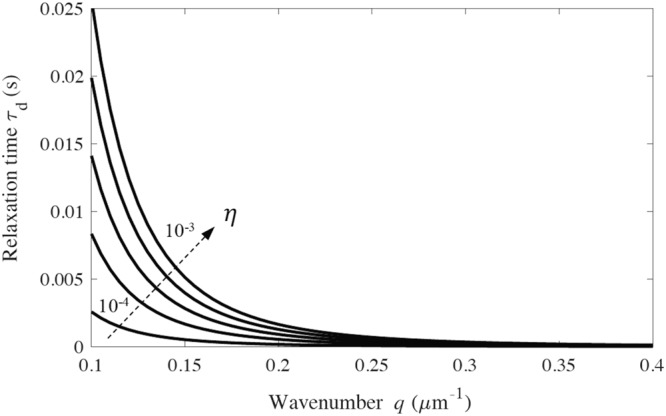
Relaxation time τd for the autocorrelation of transverse displacement of thermally fluctuating chromosomes with E = 500 Pa, r = 1 μm12, G = 227 Pa, , and η = 0.0001−0.001 kg/(m.s).
Experimental evidence for shear effect on hydrodynamic drag
In this second example, we consider the experiments of Taute et al.13 on thermal fluctuations of microtubules spanning lengths 2–30 μm. Figure 5 illustrates the experimentally determined relaxation time (for mean squared transverse displacement) as a function of microtubule length L for the fluctuations of the cantilevered microtubules. As described in13, Fig. 5 reveals that the relaxation time scales as L4 for microtubules longer than 10 μm. However, for microtubules shorter than 10 μm, the relaxation time scales as L2 instead, which deviates from Euler-Bernoulli theory (15) in which η′ = 0. Suspecting the influence of internal friction, Taute et al. employed (9) based on Euler-Bernoulli theory, however, the relaxation time (9) scales as L4 and L0 for large and small lengths, respectively. This mismatch between the experimental data and the theoretical models ((9) and (15)) for short-length filaments arises from neglecting the shear effect in the WLC model based on Euler-Bernoulli beam theory. The experimentally-observed scaling (L4 and L2 for large and small lengths, respectively) is instead revealed by (14) which captures the influence of shear deformation. We provide in Fig. 5 the best-fit curve to the experimental data using Timoshenko theory (14). Inspection reveals that the prediction based on Timoshenko theory remains a good fit at all lengths and, importantly, that it conforms to the asymptotic behaviors noted in the experiments at short lengths (L2–dependence) and long lengths (L4–dependence).
Figure 5.
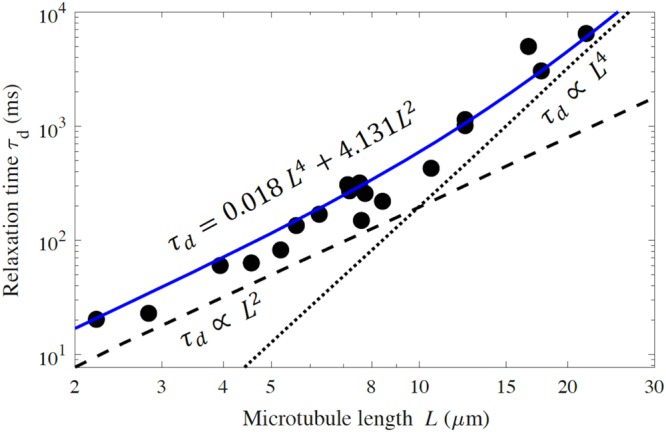
Relaxation time extracted from mean squared displacement of microtubules vs. microtubule length as measured by Taute et al.13 from thermal fluctuations of filaments. The fitted dotted-line with slope 4 and the dashed-line with slope 2 offered by Taute et al.13 reproduce the asymptotes of the Timoshenko theory (14) (blue curve) which remains a good approximation for all lengths.
As mentioned above, shear deformation will ultimately become dominant for higher order modes, in particular, for modes that satisfy λn/r < 10, where n is the mode number. For the clamped-free microtubules studied therein, the wavelengths are λn ≅ 2L/(2n−1)π. Accordingly, the above criterion leads to the following predictions of which modes will be dominated by shear as a function of microtubule length.
From Table 2, for the shorter length (2 μm) microtubules, shear will dominate bending for all modes n > 5 while still also playing an active role for modes n < 5 (though to a lesser degree as the mode number decreases). Of course, bending will dominate the modes of the longer length microtubules as expected. These conclusions are evident in Fig. 5, which considers the entire range 2 < L < 30 μm, and which illustrates that shear deformation is non-negligible for microtubules as L decreases. While this result confirms the importance of shear deformation for short microtubules, it also predicts that the dominant source of dissipation in this experiment derives from hydrodynamic effects rather than the internal friction effects as originally suspected in13.
Table 2.
The mode numbers in which shear deformation becomes dominant as a function of microtubule length.
| L = 2 μm | L = 10 μm | L = 30 μm |
| n > 5 | n > 25 | n > 77 |
Conclusions
In this paper, we reveal the significant influence of shear deformation in the energy dissipation of thermally fluctuating biofilaments. In particular, the influence of shear becomes pronounced for short filaments (L/2r < 10) or for short wavelength fluctuations (λ/r < 10). We present a new model for the energy dissipation mechanisms in biofilaments deriving from both internal and external friction. The model, based on Timoshenko beam theory, explicitly accounts for the direct shear of filaments that is ignored in the worm-like chain model based on Euler-Bernoulli beam theory. The new model predicts that shear deformation leads to energy relaxation on two time scales associated with internal friction and on two length scales associated with external friction. With shear effects included, the model replicates experimental behaviors observed for thermally fluctuating chromosomes, with dissipation dominated by internal friction, as well as for thermally fluctuating microtubules, with dissipation dominated by hydrodynamic drag. The model is offered in an analytical form that can be readily employed in future studies of thermally fluctuating biofilaments.
Electronic supplementary material
Acknowledgements
This material is based upon work supported by the National Science Foundation under Grant No. CMMI-1404747.
Author Contributions
A.M. developed the theory and both A.M. and N.P. interpreted the results and wrote the paper.
Competing Interests
The authors declare no competing interests.
Footnotes
Publisher's note: Springer Nature remains neutral with regard to jurisdictional claims in published maps and institutional affiliations.
References
- 1.Harnau L, Reineker P. Equilibrium and dynamical properties of semiflexible chain molecules with confined transverse fluctuations. Phys. Rev. E. 1999;60:4671. doi: 10.1103/PhysRevE.60.4671. [DOI] [PubMed] [Google Scholar]
- 2.Venier P, Maggs AC, Carlier M-F, Pantaloni D. Analysis of microtubule rigidity using hydrodynamic flow and thermal fluctuations. J. Biol. Chem. 1994;269:13353–13360. [PubMed] [Google Scholar]
- 3.Gittes F, Mickey B, Nettleton J, Howard J. Flexural rigidity of microtubules and actin filaments measured from thermal fluctuations in shape. J. Cell Biol. 1993;120:923–934. doi: 10.1083/jcb.120.4.923. [DOI] [PMC free article] [PubMed] [Google Scholar]
- 4.Janson ME, Dogterom M. A Bending Mode Analysis for Growing Microtubules: Evidence for a Velocity-Dependent Rigidity. Biophys. J. 2004;87:2723–2736. doi: 10.1529/biophysj.103.038877. [DOI] [PMC free article] [PubMed] [Google Scholar]
- 5.Bouchiat C, et al. Estimating the Persistence Length of a Worm-Like Chain Molecule from Force-Extension Measurements. Biophys. J. 1999;76:409–413. doi: 10.1016/S0006-3495(99)77207-3. [DOI] [PMC free article] [PubMed] [Google Scholar]
- 6.Hiraiwa T, Ohta T. Viscoelasticity of a single semiflexible polymer Chain. Macromolecules. 2009;42:7553–7562. doi: 10.1021/ma901098c. [DOI] [Google Scholar]
- 7.Soda K. Dynamics of stiff chains. I. Equation of motion. J. Phys. Soc. Japan. 1973;35:866–870. doi: 10.1143/JPSJ.35.866. [DOI] [Google Scholar]
- 8.Aragón SR, Pecora R. Dynamics of Wormlike Chains. Macromolecules. 1985;18:1868–1875. doi: 10.1021/ma00152a014. [DOI] [Google Scholar]
- 9.Broedersz CP, Mackintosh FC. Modeling semiflexible polymer networks. Rev. Mod. Phys. 2014;86:995–1036. doi: 10.1103/RevModPhys.86.995. [DOI] [Google Scholar]
- 10.Harnau, L., Winkler, R. G. & Reineker, P. Dynamic structure factor of semiflexible macromolecules in dilute solution Dynamic structure factor of semiflexible macromolecules in dilute solution. J. Chem. Phys. 6355 (1996).
- 11.Brangwynne CP, et al. Bending Dynamics of Fluctuating Biopolymers Probed by Automated High-Resolution Filament Tracking. Biophys. J. 2007;93:346–359. doi: 10.1529/biophysj.106.096966. [DOI] [PMC free article] [PubMed] [Google Scholar]
- 12.Poirier MG, Marko JF. Effect of Internal Friction on Biofilament Dynamics. Phys. Rev. Lett. 2002;88:228103. doi: 10.1103/PhysRevLett.88.228103. [DOI] [PubMed] [Google Scholar]
- 13.Taute KM, Pampaloni F, Frey E, Florin EL. Microtubule dynamics depart from the wormlike chain model. Phys. Rev. Lett. 2008;100:1–4. doi: 10.1103/PhysRevLett.100.028102. [DOI] [PubMed] [Google Scholar]
- 14.Graff, K. F. Wave motion in elastic solids. (Courier Corporation, 2012).
- 15.Brugués J, Nuzzo V, Mazur E, Needleman DJ. Nucleation and transport organize microtubules in metaphase spindles. Cell. 2012;149:554–564. doi: 10.1016/j.cell.2012.03.027. [DOI] [PubMed] [Google Scholar]
- 16.Burlacu S, Janmey PA, Borejdo J. Distribution of actin filament lengths measured by fluorescence microscopy. Am. J. Physiol. 1992;262:C569–77. doi: 10.1152/ajpcell.1992.262.3.C569. [DOI] [PubMed] [Google Scholar]
- 17.Swamidas ASJ, Yang X, Seshadri R. Timoshenko and Euler Formulations. J. Eng. Mech. 2004;130:1297–1308. doi: 10.1061/(ASCE)0733-9399(2004)130:11(1297). [DOI] [Google Scholar]
- 18.Kis A, et al. Nanomechanics of Microtubules. Phys. Rev. Lett. 2002;89:248101. doi: 10.1103/PhysRevLett.89.248101. [DOI] [PubMed] [Google Scholar]
- 19.Pampaloni F, et al. Thermal fluctuations of grafted microtubules provide evidence of a length-dependent persistence length. Proc. Natl. Acad. Sci. USA. 2006;103:10248–10253. doi: 10.1073/pnas.0603931103. [DOI] [PMC free article] [PubMed] [Google Scholar]
- 20.Poirier M, Eroglu S, Chatenay D, Marko JF. Reversible and irreversible unfolding of mitotic newt chromosomes by applied force. Mol. Biol. Cell. 2000;11:269–276. doi: 10.1091/mbc.11.1.269. [DOI] [PMC free article] [PubMed] [Google Scholar]
- 21.Poirier MG, Nemani A, Gupta P, Eroglu S, Marko JF. Probing chromosome structure with dynamic force relaxation. Phys. Rev. Lett. 2001;86:360–363. doi: 10.1103/PhysRevLett.86.360. [DOI] [PubMed] [Google Scholar]
Associated Data
This section collects any data citations, data availability statements, or supplementary materials included in this article.


