Abstract
Although immunotherapy continues to demonstrate efficacy in a variety of refractory cancers, currently, no any immunotherapeutic strategy is clinically used for gastric cancer (GC) except its microsatellite instable subtype. Thus, it is important to identify molecular biomarkers for predicting the responders to GC immunotherapy. TP53 mutations frequently occur in GC and are associated with unfavorable clinical outcomes in GC. We performed a comprehensive characterization of the associations between TP53 mutations and immune activities in GC based on two large-scale GC cancer genomics data. We compared expression and enrichment levels of 787 immune-related genes and 23 immune gene-sets among TP53-mutated GCs, TP53‐wildtype GCs, and normal tissue, and explored the correlations between p53-mediated pathways and immune activities in GC. Strikingly, almost all analyzed immune gene-sets were significantly downregulated in enrichment levels in TP53-mutated GCs compared to TP53‐wildtype GCs. These less active immune pathways and cell types in TP53-mutated GCs included 15 immune cell types and function, tumor-infiltrating lymphocytes, regulatory T cells, immune checkpoint, cytokine and cytokine receptor, human leukocyte antigen, pro‐inflammatory, and parainflammation. Moreover, we identified a number of p53-mediated pathways and proteins that were significantly associated with immune activities in GC. Furthermore, we demonstrated that the TP53 mutation itself could result in the depressed immune activities in GC and other cancer types. We revealed that chromosomal instability was an important mechanism for the depressed tumor immunity in TP53-mutated cancers. Finally, we showed that immune cell infiltration and immune activities were likely positively associated with survival prognosis in GC. Our findings suggest that p53 may play an important role in activating tumor immunity in GC and other cancer types and that the TP53 mutation status could be useful in stratifying cancer patients responsive to a certain immunotherapy.
Introduction
TP53 is the most frequently mutated gene in human cancers and are associated with poor prognosis in various cancers [1]. The associations of p53 with immune regulation have been extensively explored [2] including the roles p53 played in tumor immune regulation [3], [4], [5], [6]. For example, p53 activation might enhance antitumor immunity [6]. p53 targeted many tumor immunosuppression-associated genes such as PD-L1, VISTA, and FOXP3 [3]. p53 played a role in antitumor immunosurveillance by regulating VISTA [3].
Cancer immunotherapies have recently demonstrated high efficacy in treating various cancers such as immune checkpoint blockade [7] and chimeric antigen receptor (CAR) T cell therapy [8]. Several immune checkpoint inhibitors such as ipilimumab (anti-CTLA4), nivolumab (anti-PD1), pembrolizumab (anti-PD1), atezolizumab (anti-PD-L1), and avelumab (anti-PD-L1) are being clinically used to treat various advanced malignancies including the cancers with deficient mismatch repair (dMMR). Unfortunately, these therapies are only beneficial to partial patients. Thus, discovering the biomarkers that are effective in predicting the cancer immunotherapeutic response is a pressing need. Several studies have shown that high tumor mutation burden was associated with a positive clinical response to CTLA4 or PD1 blockade [9], [10], [11], [12]. The dMMR, neoantigens, and PD-L1 expressions have been associated with response to cancer immune checkpoint blockade treatment [12], [13], [14]. However, few studies have correlated cancer immunotherapy response with the TP53 mutation status, although a recent phase II clinical trial demonstrated that p53-mutated metastatic breast cancer patients had an overall survival (OS) benefit when treated by the immuno-oncology viral agent REOLYSIN and paclitaxel combination [15].
Gastric cancer (GC) is the fourth most common cancer and the second leading cause of cancer death in the world [16]. GC is particularly prevalent in Asian countries, such as in China [17]. Based on genomic profiles, The Cancer Genome Atlas (TCGA) classified GC into four subtypes: Epstein–Barr virus (EBV) associated, microsatellite instable (MSI), genomically stable (GS), and chromosomal instability (CIN) [18]. The Asian Cancer Research Group (ACRG) classified GC into four subtypes: microsatellite stable (MSS)/epithelial-mesenchymal transition (EMT), MSI, MSS/p53+, and MSS/p53− [19]. The high heterogeneity of GC makes GC treatment a big challenge [20]. Some targeted therapies for GC have been investigated such as targeting HER2, EGFR, and VEGFR. Besides, immune checkpoint blockade targeting CTLA4, PD1, or PD-L1 is being evaluated in the immunotherapy of GC. Recently, FDA has approved the PD1 inhibitor pembrolizumab in treating dMMR (or MSI) cancers including the MSI subtype of GC.
TP53 is the most frequently mutated gene in GC (approximately 50%) [19]. To explore the effect of TP53 mutations on GC immunity, we performed comprehensive comparisons of expression or enrichment levels of 787 immune-related genes and 23 gene-sets between TP53-mutated and TP53‐wildtype GCs based on TCGA [18] and ACRG [19] GC genomics datasets. We aimed at addressing several questions, including: Is the immunity of TP53-mutated GCs different from TP53-wildtype GCs? What factors may explain the differences in the immunity between TP53-mutated and TP53-wildtype GCs? Are there any associations of TP53 mutations, immune cell infiltration, and clinical outcomes in GC?
Materials and Methods
Materials
We downloaded TCGA RNA-Seq gene expression profiles (Level 3), gene somatic mutations (Level 2), somatic copy number alteration (Level 3), protein expression profiles (Level 3), and clinical data from the genomic data commons data portal (https://portal.gdc.cancer.gov/). The ACRG gene expression profiles data were downloaded from NCBI Gene Expression Omnibus (GSE62254), and somatic mutations and clinical data were obtained from the publication [19].
Comparisons of Gene Expression Levels, Gene-Set Enrichment Levels, and Protein Expression Levels between Two Classes of Samples
We normalized the TCGA GC and colon cancer gene expression values by base-2 log transformation and used the downloaded ACRG gene expression data since they have been normalized. We quantified the enrichment level or activity of an immune cell type or function in a sample using the single-sample gene-set enrichment analysis (ssGSEA) score [21], [22]. We compared expression levels of a single gene between two classes of samples using Student's t test and compared enrichment levels (ssGSEA scores) of a gene-set between two classes of samples using Mann-Whitney U test. Based on the normalized GC protein expression profiles data in TCGA, we compared protein expression levels between TP53-mutated and TP53-wildtype GCs using Student's t test. We used the Benjamini-Hochberg method [23] to calculate the false discovery rate (FDR) in adjusting for multiple tests. The threshold of FDR < 0.05 was used to identify the differentially expressed genes (proteins) and differentially enriched gene-sets. We performed the comparisons of gene expression data between TP53-mutated or TP53-wildtype GCs and normal tissue only in TCGA since ACRG had no gene expression data in normal tissue available.
Gene-Set Enrichment Analysis
We performed a pathway analysis of the set of genes that were differentially expressed between TP53-mutated and TP53-wildtype GCs using the GSEA software [24]. The gene-set enrichment analysis was implemented for the set of genes that were upregulated in TP53-mutated GCs and the set of genes that were downregulated in TP53-mutated GCs compared to TP53-wildtype GCs concurrently in both datasets, respectively (Student's t test, FDR < 0.05). The threshold of adjusted P value FDR < 0.05 was used to identify the KEGG pathways with differential activities between TP53-mutated and TP53‐wildtype GCs.
Comparison of the Immune Cell Infiltration Degree between TP53-Mutated and TP53‐Wildtype GCs
We used ESTIMATE [25] to evaluate the degree of immune cell infiltration in GC. For each GC sample, we obtained an immune score to quantify the degree of immune cell infiltration in the GC tissue. We compared the immune scores between TP53-mutated and TP53-wildtype GCs using Mann-Whitney U test.
Comparison of Mutation Counts between TP53-Mutated and TP53‐Wildtype GCs
We compared the total mutation counts between TP53-mutated and TP53-wildtype GCs using Mann-Whitney U test. The comparison was performed only in TCGA since the somatic mutation data in TCGA were generated by whole exome sequencing, while data were generated by targeted exome sequencing in ACRG.
Correlations of Pathway or Protein Activities with Immune Activities in GC
We explored the correlations of the p53-mediated pathway activities with enrichment levels of the 23 immune gene-sets. We obtained the gene-set collections for the p53-mediated pathways from KEGG [26] and quantified the activity of a pathway and the enrichment level of an immune gene-set in a GC sample by the ssGSEA score [21], [22]. To correct for the strong correlation between the p53 pathway and the other p53-mediated pathways, we used the first-order partial correlation to evaluate the correlations between the pathways and the immune gene-sets with the R package “ppcor” [27]. The correlation between a pathway and an immune gene-set was defined as significant if FDR < 0.05. We quantified the correlation between a protein and an immune gene-set by calculating the Spearman correlation coefficient (“rho”) of expression levels of the protein and ssGSEA scores of the immune gene-set.
Survival Analyses
We compared OS and disease-free survival (DFS) time between two groups of GC patients classified based on gene expression levels, gene-set enrichment levels, and immune scores, respectively. Kaplan-Meier survival curves were used to show the survival differences between both classes of patients (gene higher-expression-level patients vs. gene lower-expression-level patients, gene-set higher-enrichment-level patients vs. gene-set lower-enrichment-level patients, and higher-immune-score patients vs. lower-immune-score patients). We used the median values of gene expression levels, gene-set enrichment levels (ssGSEA scores), or immune scores to classify patients into two different groups. The log-rank test was used to calculate the significance of survival time differences between two classes of patients with a threshold of P < .05.
Results
TP53 Mutations Are Associated with Depressed Expression of Immune Cell Types and Functional Marker Genes in GC
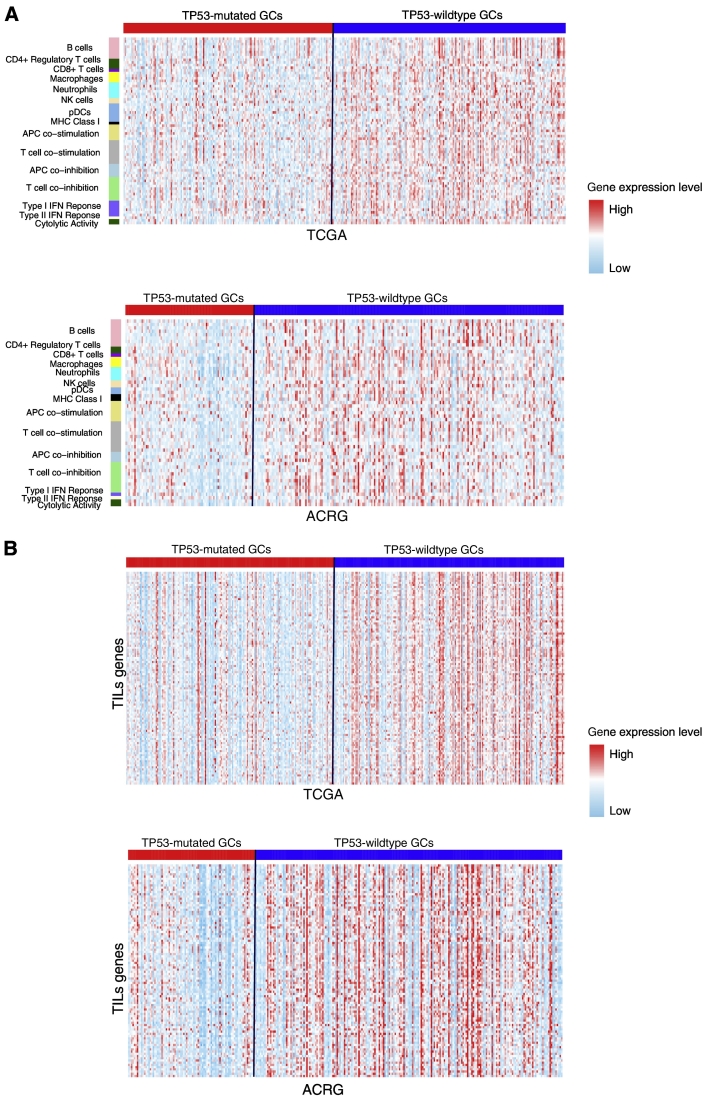
We analyzed the activities of 15 immune cell types and functional gene-sets in GC. These gene-sets represent B cells, CD4+ regulatory T cells, CD8+ T cells, macrophages, neutrophils, natural killer (NK) cells, plasmacytoid dendritic cells (pDCs), major histocompatibility complex (MHC) class I, APC co-stimulation, T cell co-stimulation, APC co-inhibition, T cell co-inhibition, TYPE I IFN response, type II IFN response, and cytolytic activity, respectively [28]. We found that a substantial number of genes in the 15 gene-sets had significantly lower expression levels in TP53-mutated GCs than in TP53-wildtype GCs (Figure 1A; Supplementary Table S1). For example, 7 of the 10 B cell marker genes, the CD8+ T cell marker gene (CD8A), both NK cell marker genes (KLRC1 and KLRF1), 8 of the 10 T cell co-inhibition marker genes, and both cytolytic activity genes (GZMA and PRF1) were more lowly expressed in TP53-mutated GCs than in TP53-wildtype GCs in both datasets.
Figure 1.
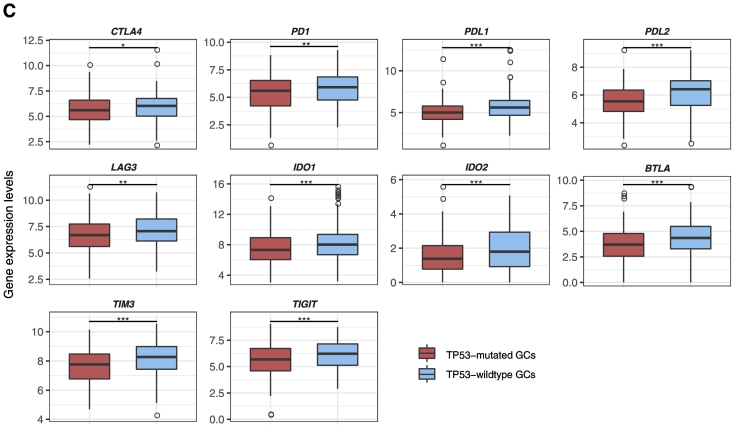
TP53-mutated GCs likely have the depressed expression of immune cell types and functional marker, TILs, and immune checkpoint genes compared to TP53-wildtype GCs. (A) Heat map for expression levels of immune cell types and functional genes in TP53-mutated and TP53-wildtype GCs. (B). Heat map for expression levels of TILs genes in TP53-mutated and TP53-wildtype GCs. (C) A number of important immune checkpoint genes show significantly lower expression levels in TP53-mutated GCs than in TP53-wildtype GCs in TCGA. *: P < .05, **: P < .01, ***: P < .001, ****: P < .0001, and it applies to all the following box charts.
Strikingly, we found that all 15 immune cell types and functional gene-sets showed significantly lower ssGSEA scores in TP53-mutated GCs than in TP53-wildtype GCs in at least one dataset and 12 in both datasets (Mann-Whitney U test, P < .05) (Supplementary Table S1, Figure S1A). These results suggest that TP53-mutated GCs likely have depressed immune activities compared to TP53-wildtype GCs. Compared to normal tissue, the ssGSEA scores for B cells, CD8+ T cells, neutrophils, NK cells, and cytolytic activity were significantly lower in TP53-mutated GCs, while showing no significant differences in TP53-wildtype GCs. These data indicated that TP53 mutations might comprise the activity of immune attack on GC cells by the host immune system. Interestingly, the CD4+ regulatory T cell and its marker genes FOXP3, CTLA4, and IL32 had significantly higher enrichment or expression levels in both TP53-mutated and TP53-wildtype GCs than in normal tissue. The higher activity of the CD4+ regulatory T cells in GC may imply the GC immunosuppression mechanism [29].
TP53 Mutations Are Associated with Decreased Immune Cell Infiltration and Lower Immunosuppressive Activity in GC
The density of tumor-infiltrating lymphocytes (TILs) is associated with cancer prognosis [30], [31]. We compared expression levels of 122 TILs gene signatures [32] between TP53-mutated and TP53-wildtype GCs. Strikingly, we found that 107 (88%) TILs genes were more lowly expressed in TP53-mutated GCs in at least one dataset (100 in both datasets) (Figure 1B; Supplementary Table S2). The ssGSEA scores for the TILs gene-set were significantly lower in TP53-mutated GCs than in TP53-wildtype GCs (Mann-Whitney U test, P = 1.29*10−7, 3.80*10−5 for TCGA and ACRG, respectively) (Supplementary Figure S1B). It indicates that TP53 mutations are associated with decreased TILs infiltration in GC.
Regulatory T (Treg) cells and the immune checkpoint pathway play important roles in tumor immunosuppression [7], [33]. We compared the ssGSEA scores of the Treg and immune checkpoint gene-sets which, respectively, included 70 and 47 gene signatures [34] between TP53-mutated and TP53-wildtype GCs, respectively. We found that both gene-sets showed significantly lower enrichment levels in TP53-mutated GCs than in TP53-wildtype GCs (Mann-Whitney U test, P < .05). Moreover, many notable immune checkpoint genes were downregulated in TP53-mutated GCs such as CTLA4, PD1, PD-L1, PD-L2, IDO1/2, BTLA, LAG3, TIM3, and TIGIT (Figure 1C; Supplementary Table S3, Figure S1, C and D). These results indicated that TP53 mutations were associated with lower immunosuppressive activity in GC, suggesting that p53 may transactivate tumor immunosuppressive pathways. This finding is in line with prior studies [3].
TP53 Mutations Are Associated with Lower Cytokine Activity in GC
Cytokines are important components of the tumor microenvironment and play important roles in tumor immunity [35]. Of 261 cytokine and cytokine receptor (CCR) genes [36], 91 were downregulated in TP53-mutated GCs in at least one dataset versus 16 upregulated in TP53-mutated GCs (Fisher's exact test, P < 2.2*10−16, OR = 8.17) compared to TP53-wildtype GCs (Supplementary Table S4, Figure S2A). The CCR gene-set enrichment levels were significantly lower in TP53-mutated GCs than in TP53-wildtype GCs (Mann-Whitney U test, P = 2.93*10−7, 4.22*10−4 for TCGA and ACRG, respectively) (Figure 2A). It suggests that TP53 mutations may suppress the activity of cytokines in GC.
Figure 2.
TP53-mutated GCs likely have the depressed expression of CCR and HLA genes compared to TP53-wildtype GCs. (A) Comparison of enrichment levels of the CCR gene-set between TP53-mutated and TP53-wildtype GCs. (B) A number of HLA genes show significantly lower expression levels in TP53-mutated GCs than in TP53-wildtype GCs.
TP53 Mutations Are Associated with the Upregulation of Cancer-Testis Antigens in GC
Cancer-testis antigens (CTAs) are a group of immunogenic proteins that are aberrantly activated and expressed in various cancers [37]. We found that 125 of the 223 CTA genes [38] were more highly expressed in TP53-mutated GCs in at least one dataset versus 8 more highly expressed in TP53-wildtype GCs (Fisher's exact test, P < 2.2*10−16, OR = 34) (Supplementary Table S5). Notably, the CTA genes upregulated in TP53-mutated GCs included MAGEAs, NY-ESO-1, and PRAME that are promising targets for developing cancer vaccines [37]. Enrichment levels of the CTA gene-set were significantly higher in TP53-mutated GCs than in TP53-wildtype GCs (Mann-Whitney U test, P = 1.98*10−12 and 3.32*10−8 for TCGA and ACRG, respectively). These data indicated that p53 could suppress the expression of many CTA genes, a finding consistent with a previous study showing that p53 regulated CTA genes [39]. As expected, enrichment levels of the CTA gene-set were significantly higher in both TP53-mutated GCs and TP53-wildtype GCs than in normal tissue (Mann-Whitney U test, P = 2.18*10−17 and 2.01*10−11 for TP53-mutated GCs and TP53-wildtype GCs, respectively).
TP53-Mutated GCs Shows Significant Differences in Human Leukocyte Antigen (HLA) Gene Expression and Somatic Mutations Compared to TP53-wildtype GCs
HLA genes encode MHC proteins which are involved in the regulation of the immune system in humans [40]. Of 24 HLA genes analyzed, we found that 19 (80%) were downregulated in TP53-mutated GCs relative to TP53-wildtype GCs in at least one dataset (15 in both datasets) (Figure 2B; Supplementary Table S6). Enrichment levels of the HLA gene-set were significantly lower in TP53-mutated GCs than in TP53-wildtype GCs (Mann-Whitney U test, P = 5.0*10−4 and 2.25*10−6 for TCGA and ACRG, respectively). Compared to normal tissue, enrichment levels of the HLA gene-set were significantly higher in TP53-wildtype GCs (Mann-Whitney U test, P = .036), while showed no significant differences in TP53-mutated GCs (Mann-Whitney U test, P = .94). These results indicated that TP53 mutations might inhibit HLA expression in GC. This finding conforms to a previous study showing that p53 increased the expression of MHC proteins in cancer [41].
Gene mutations may yield neoepitopes that can be recognized by immune cells [42]. Rooney et al. [28] predicted that mutations introduced novel peptides loading in imputed HLA alleles in TCGA samples. Interestingly, we found that although TP53-mutated GCs had significantly higher total mutation counts than TP53-wildtype GCs (Mann-Whitney U test, P = .018), TP53-mutated GCs had fewer mutations that may yield predicted HLA-binding peptides than TP53-wildtype GCs (Mann-Whitney U test, P = .015). It suggests that TP53 mutations may suppress tumor immunity in GC.
TP53 Mutations Are Associated with Depressed Inflammatory Activity in GC
Inflammatory responses are significantly associated with tumor development [43]. We compared expression levels of 16 proinflammatory genes [44] between TP53-mutated and TP53-wildtype GCs. Strikingly, we found that 15 of the 16 genes had significantly lower expression levels in TP53-mutated GCs in at least one dataset (10 in both datasets) (Supplementary Figure S2B, Table S7). Notably, GZMB (granzyme B) was downregulated in TP53-mutated GCs. The product of this gene and the aforementioned cytolytic activity markers GZMA and PRF1 are mainly secreted by NK cells and cytotoxic T lymphocytes [28]. Accordingly, the decreased expression of GZMA, GZMB, and PRF1 implied the depressed immune cytolytic activity in TP53-mutated GCs. The proinflammatory gene-set showed significantly lower enrichment levels in TP53-mutated GCs than in TP53-wildtype GCs (Mann-Whitney U test, P = 7.62*10−5 and 1.21*10−4 for TCGA and ACRG, respectively). These data indicated that TP53 mutations might inhibit inflammatory and immune cytolytic activities in GC.
Parainflammation (PI) is a low-grade inflammatory reaction and is associated with carcinogenesis [45]. We compared expression levels of 40 PI gene signatures [45] between TP53-mutated and TP53-wildtype GCs. We found that the PI activity was significantly lower in TP53-mutated GCs than in TP53-wildtype GCs (Mann-Whitney U test, P = .006, 0.01 for TCGA and ACRG, respectively; Supplementary Table S8), suggesting that TP53 mutations were negatively correlated with the PI activity in GC.
TP53 Mutations Are Associated with Lower Activities of Immune-Related Pathways in GC
The GSEA showed that plentiful immune-related pathways significantly correlated with the set of genes that were downregulated in TP53-mutated GCs. These pathways included NK cell–mediated cytotoxicity, T cell receptor signaling, intestinal immune network for IgA production, antigen processing and presentation, hematopoietic cell lineage, cytokine-cytokine receptor interaction, B cell receptor signaling, leukocyte transendothelial migration, toll-like receptor signaling, chemokine signaling, and primary immunodeficiency (Figure 3). In contrast, no immune-related pathways significantly correlated with the set of genes that were upregulated in TP53-mutated GCs. These results again demonstrate that TP53-mutated GCs have lower immune activities compared to TP53-wildtype GCs.
Figure 3.
Immune-related pathways that are downregulated in TP53-mutated GCs compared to TP53-wildtype GCs by the gene-set enrichment analysis.
TP53 Mutations Suppress Tumor Immunity via Regulation of Chromosomal Stability
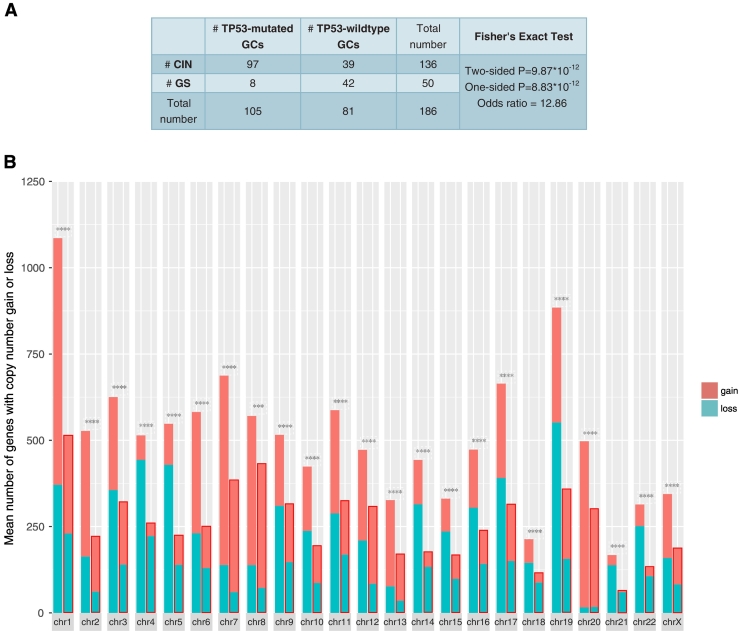
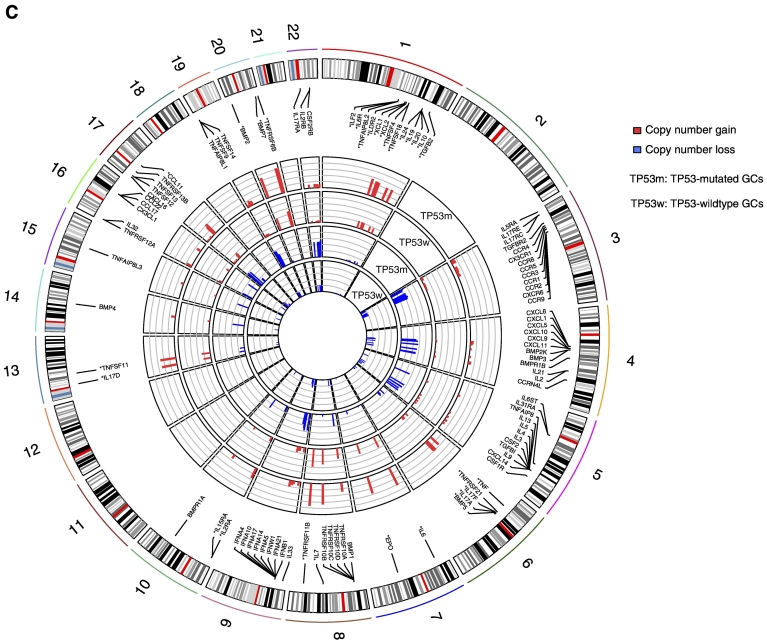
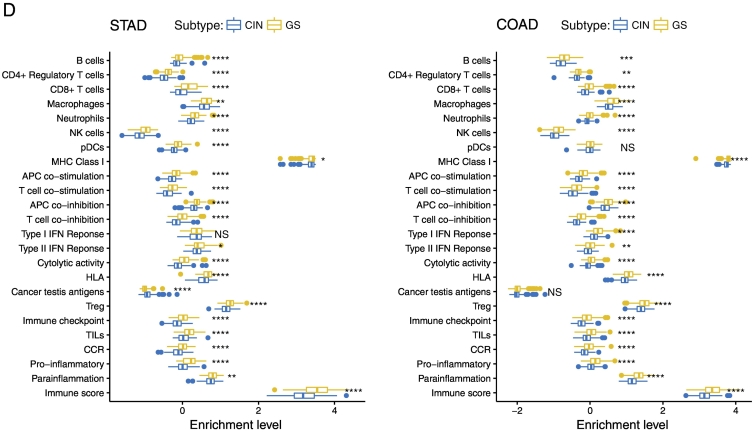
We found that TP53-mutated GCs harbored a significantly higher proportion of CIN GCs and a significantly lower proportion of GS GCs as compared to TP53-wildtype GCs (Fisher's exact test, P < .05; Figure 4A). Moreover, we found that TP53-mutated GCs had much more genes with copy number alteration (gain and loss) than TP53-wildtype GCs in each of the 23 chromosomes (Figure 4B). These results demonstrate that p53 plays a key role in restricting CIN [46]. Interestingly, most of CCR genes showed higher frequencies of copy number alteration in TP53-mutated GCs than in TP53-wildtype GCs (Fisher's exact test, P < .05; Figure 4C). Furthermore, we found that almost all 23 immune gene-sets had significantly lower enrichment levels in CIN GCs than in GS GCs except the CTA gene-set with higher enrichment levels in CIN GCs (Figure 4D). In addition, we used the ESTIMATE algorithm [25] to evaluate the levels of immune cell infiltration (immune score) in GC and found that the CIN GCs had significantly lower immune scores than the GS GCs (Figure 4D). We further analyzed another TCGA dataset for colon cancer and obtained similar results that the CIN colon cancers had lower enrichment levels of almost all the immune gene-sets and had lower immune scores than GS colon cancers (Figure 4D). These results suggest that the suppressive tumor immunity in TP53-mutated cancers may be attributed to the decreased chromosomal stability by TP53 mutations. It is in line with a recent study showing that CIN could drive tumor metastasis via regulation of immune pathways [47].
Figure 4.
TP53-mutated GCs are likely to be chromosomally instable, and chromosomal instability is associated with depressed immune activities in cancer. (A) TP53-mutated GCs harbor a significantly higher proportion of CIN samples than TP53-wildtype GCs. (B) TP53-mutated GCs had much more genes with copy number alteration than TP53-wildtype GCs. In each chromosome, the left bar is for the TP53-mutated GC, and the right bar is for the TP53-wildtype GC that is surrounded by a pane. (C) CCR genes that show higher frequencies of copy number alteration in TP53-mutated GCs than in TP53-wildtype GCs. The CCR genes with “*” ahead have higher frequencies of copy number gain, and the others have higher frequencies of copy number loss in TP53-mutated GCs than in TP53-wildtype GCs. (D) Most of the immune gene-sets show significantly lower enrichment levels in CIN cancers than in GS cancers. STAD, stomach adenocarcinoma; COAD, colon adenocarcinoma; NS, not significant. *: P < .05, **: P < .01, ***: P < .001, ****: P < .0001.
Immune Activities in GC Are Significantly Associated with Activities of p53-Regulated Pathways
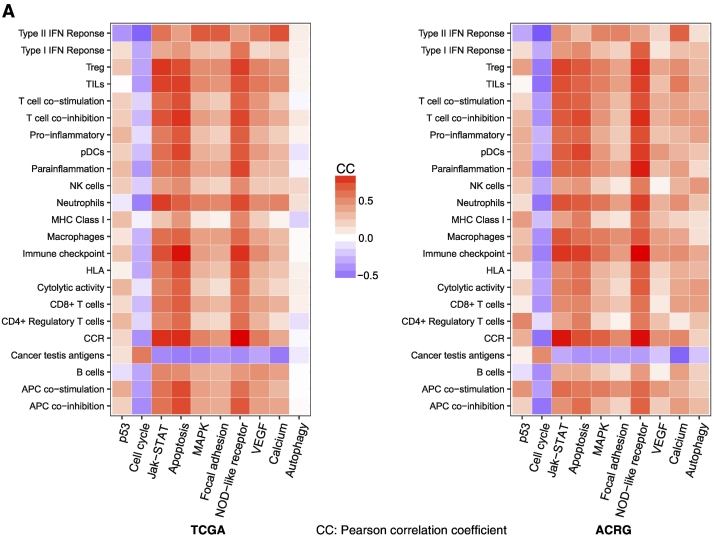
p53 plays an important role in regulating the cell cycle, and cell cycle arrest is one of the prominent functions of p53 in tumor suppression [48]. Thus, the activity of the p53 pathway would have a negative correlation with the activity of the cell cycle pathway in the tumor. Accordingly, the p53 mutation may lead to hypoactivation of the p53 pathway and hyperactivation of the cell cycle pathway in the tumor [49]. Strikingly, we found that all immune gene-sets analyzed significantly correlated with the p53 pathway in a positive direction except the CTA gene-set in a negative direction in GC (Figure 5A). In contrast, all the immune gene-sets significantly inversely correlated with the cell cycle pathway except the CTA gene-set with a positive correlation (Figure 5A). This is consistent with a recent study showing that the inhibition of cell cycle progression could increase tumor immunogenicity [50]. Besides the p53 and cell cycle pathways, p53 is importantly involved in regulation of a number of other cancer-associated pathways, including DNA damage repair, apoptosis, autophagy, metabolism, EMT, inflammation, angiogenesis, and metastasis [46]. Indeed, we found that many related pathways were downregulated in TP53-mutated GCs relative to TP53-wildtype GCs by the GSEA [24], including Jak-STAT, apoptosis, MAPK, focal adhesion, NOD-like receptor, VEGF, calcium, and autophagy pathways. Strikingly, we found that most of the immune gene-sets analyzed showed significant positive correlations with each of these pathways except the CTA gene-set with a negative correlation in GC (Figure 5A). These results suggest that TP53 mutations cause disturbances of the pathways targeted by p53, thereby contributing to the depressed immune activities in TP53-mutated GCs.
Figure 5.
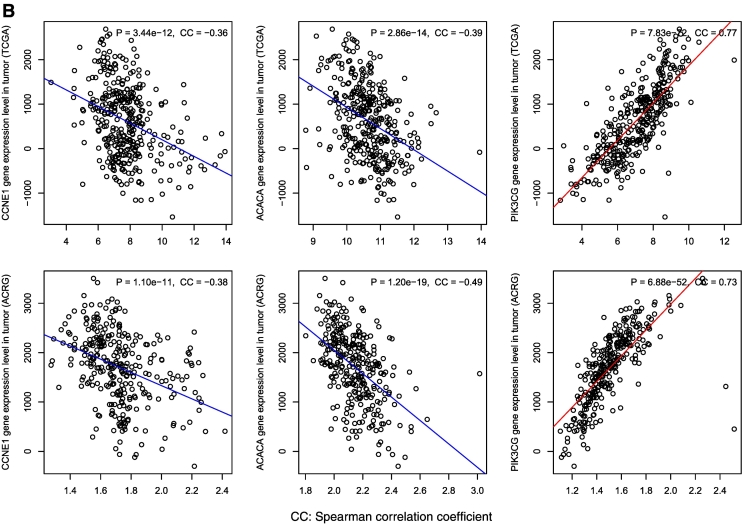
The p53-mediated pathways and proteins show significant correlations with immune activities in GC. (A) All the immune gene-sets (except cancer testis antigen) show negative correlations with the cell cycle pathway, and positive correlations with the other p53-mediated pathways. B. The differentially expressed proteins between TP53-mutated and TP53-wildtype GCs show significant expression correlations with immune infiltration scores in GC.
Identification of Proteins Differentially Expressed between TP53-Mutated and TP53-wildtype GCs That Are Significantly Correlated with Tumor Immunity in GC
Based on the TCGA protein expression profiles data, we identified two proteins (CCNE1 and ACACA) and one protein (PIK3CG) with significantly higher and lower expression levels in TP53-mutated GCs than in TP53-wildtype GCs, respectively (Student's t test, FDR < 0.05). Interestingly, both CCNE1 and ACACA had negative expression correlations with immune infiltration levels in GC, while PIK3CG had a positive expression correlation with immune infiltration levels in GC (Figure 5B). CCNE1 (cyclin E1) belongs to the cyclin family that functions as regulators of cyclin-dependent kinases. This protein is a downstream target of p53 and plays an important role in promoting cell cycle progression and CIN [51]. Thus, the elevated expression of CCNE1 may inhibit immune activities by enhancing the cell-cycle and CIN activities in TP53-mutated GCs. Another upregulated protein in TP53-mutated GCs ACACA is related to the metabolism pathway. It has been shown that p53 induces the AMP-activated protein kinase, which phosphorylates ACACA and ACACB to block fatty acid biosynthesis [52]. Our data indicate that targeting the metabolism pathway may be an approach for p53 to regulate tumor immunity. PIK3CG is involved in MAPK, VEGF, and immune-related pathways [53]. Our results have shown that these pathways are positively associated with immune activities in GC. Altogether, these data indicate that the differential protein activities may contribute to the differential immune activities between TP53-mutated and TP53-wildtype GCs.
Immune Activities Are Prone to be Positively Associated with Survival Prognosis in GC
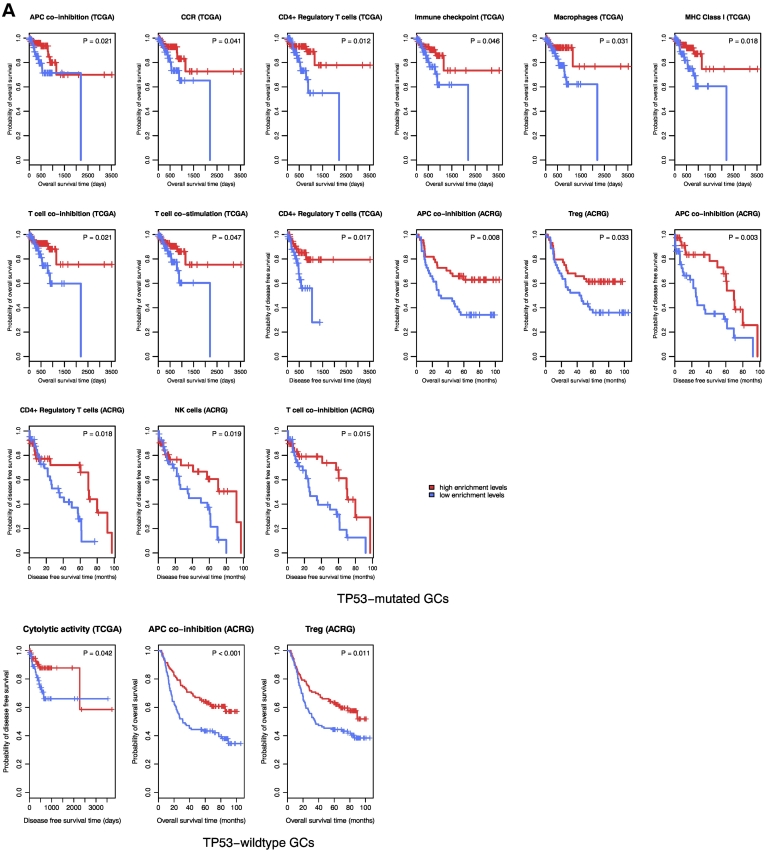
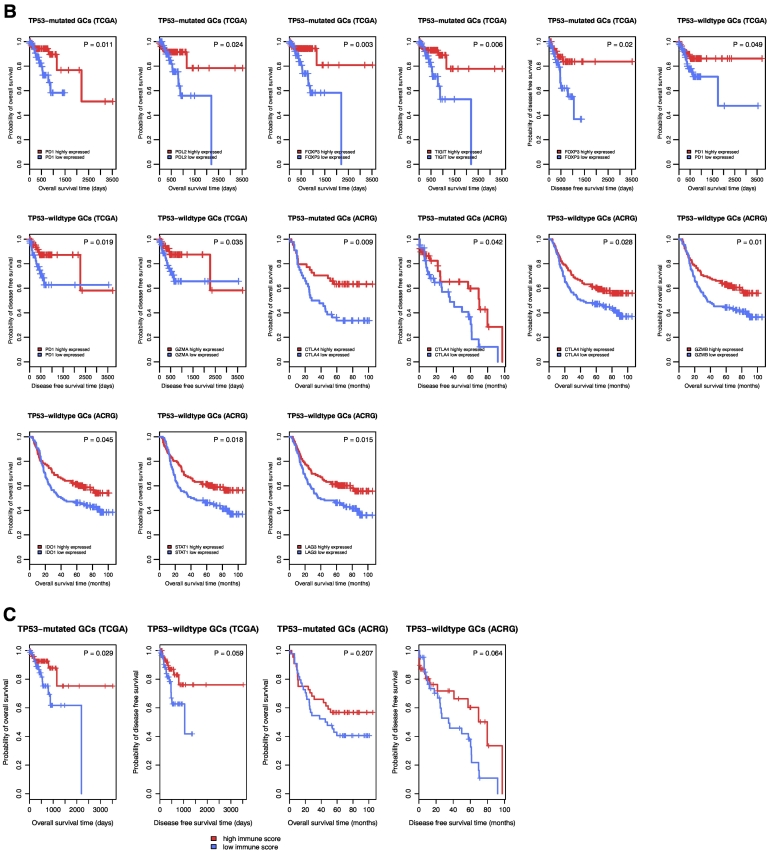
Among the 23 immune gene-sets analyzed, 10 and 3 gene-sets showed significant correlations of enrichment levels with survival prognosis in TP53-mutated and TP53-wildtype GCs, respectively. Strikingly, elevated enrichment levels of all the gene-sets were consistently associated with better OS and/or DFS prognosis in TP53-mutated or TP53-wildtype GCs (Figure 6A). Moreover, we found a number of immune genes whose elevated expression was positively associated with OS and/or DFS prognosis in TP53-mutated and/or TP53-wildtype GCs (Figure 6B; Supplementary Table S9). For example, elevated expression of immune checkpoint genes CTLA4 and PD1 was associated with better survival prognosis in both TP53-mutated and TP53-wildtype GCs; elevated expression of other three immune checkpoint genes, PD-L2, FOXP3, and TIGIT, was associated with better survival prognosis in TP53-mutated GCs; elevated expression of GZMA, GZMB, IDO1, STAT1, and LAG3 was associated with better survival prognosis in TP53-wildtype GCs. Furthermore, we found that higher immune scores were associated with better survival prognosis in TP53-mutated GCs (Figure 6C; Supplementary Table S9). Altogether, these data show that higher immune activities are likely associated with more favorable clinical outcomes in GC.
Figure 6.
Immune activities are positively associated with survival prognosis in TP53-mutated and TP53-wildtype GCs. A. Kaplan–Meier survival curves show that elevated enrichment of immune gene-sets is associated with better survival prognosis in TP53-mutated and TP53-wildtype GCs (log-rank test, unadjusted P-value <0.05). B. Kaplan–Meier survival curves show that elevated expression of immune genes is associated with better survival prognosis in TP53-mutated and TP53-wildtype GCs (log-rank test, unadjusted P-value <0.05). C. Kaplan–Meier survival curves show that a higher degree of immune cell infiltration is associated with better survival prognosis in TP53-mutated GCs (log-rank test, unadjusted P-value <0.05).
Discussion
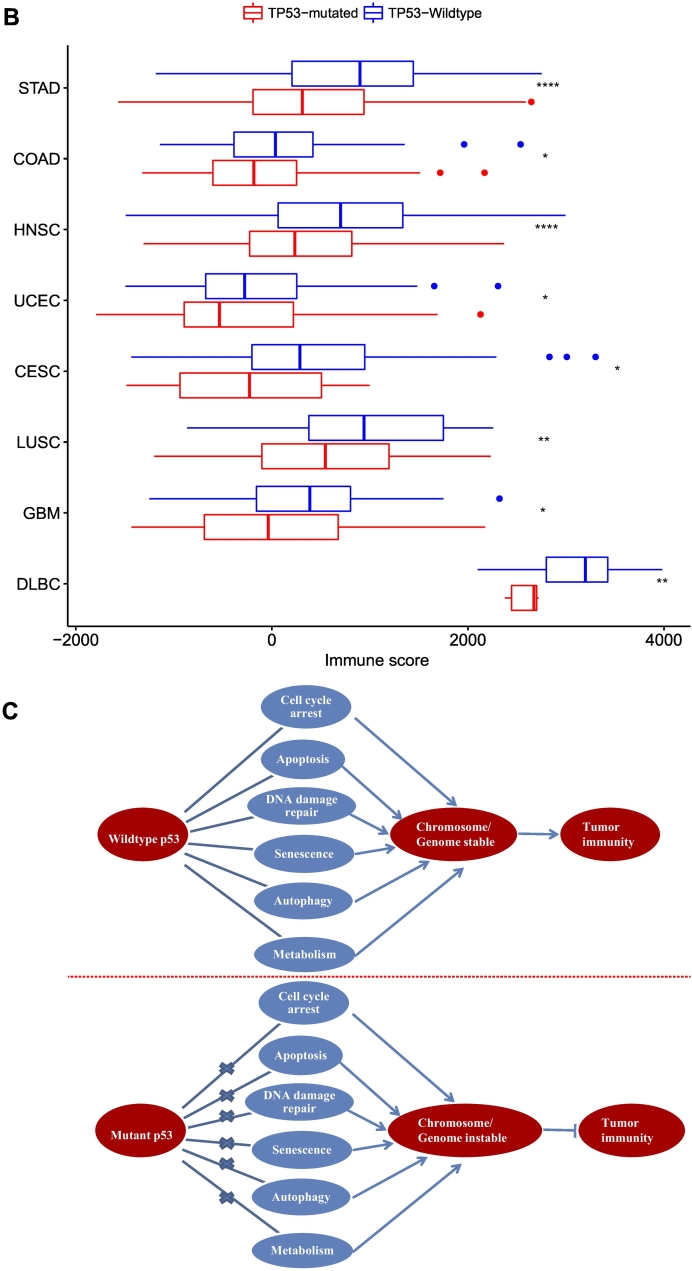
In the present study, we performed a comprehensive analysis of the association between TP53 mutations and tumor immunity in GC based on two large-scale GC genomics data. Strikingly, we found that almost all the immune-related gene-sets analyzed showed significantly lower enrichment levels (ssGSEA scores) in TP53-mutated GCs than in TP53-wildtype GCs in both datasets except that the CTA gene-set had significantly higher enrichment levels in TP53-mutated GCs (Figure 7A; Supplementary Table S10). Moreover, the ESTIMATE [25] evaluation showed that TP53-mutated GCs had significantly lower levels of immune cell infiltration than TP53-wildtype GCs in both datasets (Mann-Whitney U test, P = 4.24*10−8 and 2.63*10−5 for TCGA and ACRG, respectively) (Figure 7B), again demonstrating that TP53 mutations were associated with lower immune activities in GC. It should be noted that the association of TP53 mutations with tumor immunity is not restricted to GC but also other cancer types. Indeed, we found that the TP53-mutated subtype had the significantly lower degree of immune infiltration than the TP53-wildtype subtype in various cancer types (Figure 7B).
Figure 7.
TP53-mutated cancers likely have decreased immune activities compared to TP53-wildtype cancers. (A) All the immune gene-sets (except CTA) likely have lower enrichment levels in TP53-mutated GCs than in TP53-wildtype GCs. Lauren_class, the Lauren classification of GC; Mol_subtype, the molecular classification of GC by TCGA. (B) TP53-mutated cancers have the significantly lower degree of immune infiltration than TP53-wildtype cancers in various cancer types. (C) TP53 mutations may disrupt the functions of wildtype p53 that maintain genome stability, and result in decreased tumor immunity in cancer. HNSC, head and neck squamous cell carcinoma; UCEC, uterine corpus endometrial carcinoma; CESC, cervical squamous cell carcinoma and endocervical adenocarcinoma; LUSC, lung squamous cell carcinoma; GBM, glioblastoma multiforme; DLBC, lymphoid neoplasm diffuse large B-cell lymphoma.
The MSI genomic feature has been associated with high immunogenic activity in cancer [14]. We found that TP53-mutated GCs involved a lower proportion of MSI samples compared to TP53-wildtyped GCs (Fisher's exact test, P = .004, OR = 0.45 for TCGA, P = .006, OR = 0.38 for ACRG). This result may partially explain the lower immunogenic activity in TP53-mutated GCs than in TP53-wildtype GCs. However, in comparisons of the enrichment levels of the 23 immune-related gene-sets between TP53-mutated and TP53-wildtyped GCs within the MSS subtype of GC, we found that almost all 23 gene-sets had significantly lower enrichment levels in TP53-mutated MSS GCs than in TP53-wildtype MSS GCs in both datasets (Supplementary Table S11). It indicates that MSI is not the essential factor explaining the differential immunogenic activity between TP53-mutated and TP53-wildtype GCs. On the other hand, GCs are often associated with infectious agents, including the bacterium Helicobacter pylori and EBV. It has been observed that EBV+ GCs have increased immune activities versus EBV− GCs [28]. We found that EBV+ GCs had a much lower TP53 mutation rate compared to EBV− GCs (Fisher's exact test, P = 2.66*10−6, OR = 0.04 for TCGA, P = .002, OR = 0 for ACRG). Thus, the lower immunogenic activity in TP53-mutated GCs may be attributed to the rare EBV infection in the GC subtype. However, we found that most of the immune gene-sets had significantly lower enrichment levels in TP53-mutated EBV− GCs than in TP53-wildtype EBV− GCs in both datasets (Supplementary Table S12). It indicates that the differential immunogenic activity between TP53-mutated and TP53-wildtype GCs cannot be attributed to the EBV infection status. In fact, when we compared enrichment levels of the immune-related gene-sets between TP53− (nonfunctional TP53) and TP53+ (functional TP53) GCs in ACRG [19], we found that almost all 23 gene-sets had significantly lower enrichment levels in TP53− GCs than in TP53+ GCs (the CTA gene-set had elevated expression levels in TP53− GCs) (Supplementary Tables S1-8). Moreover, a substantial number of immune-related genes showed significantly lower expression levels in TP53- GCs than in TP53+ GCs (Supplementary Tables S1-8). These results confirm that TP53 dysfunction itself represses immunogenic activity in GC.
We have identified a number of p53-mediated pathways whose activities were significantly associated with immune activities in GC (Figure 5A). These pathways included p53, cell cycle, Jak-STAT, apoptosis, MAPK, focal adhesion, NOD-like receptor, VEGF, calcium, and autophagy pathways. We have also demonstrated that CIN was associated with depressed tumor immunity (Figure 4B). Since p53 plays a crucial role in maintaining chromosomal stability [46], mutant p53 may result in CIN that inhibits antitumor immunity. Thus, we argue that CIN is a key clue that explains the depressed tumor immunity in TP53-mutated cancers (Figure 7C).
In [54], Smyth et al. listed 26 immunotherapeutic targets currently used in the clinic or in clinical trials, 18 of which were downregulated in TP53-mutated GCs versus TP53-wildtype GCs in both datasets (Supplementary Table S13). In addition, 9 of 12 targets for immunotherapy agents in preclinical development [54] were downregulated in TP53-mutated GCs (Supplementary Table S13). These data indicate that most of the promising immunotherapy agents may be less effective against TP53-mutated GCs than TP53-wildtype GCs.
Conclusions
Our findings suggest that p53 may play an important role in activating tumor immunity in GC and other cancer types and that the TP53 mutation status could be used for predicting cancer patients responsive to a certain immunotherapy.
The following are the supplementary data related to this article.
Table S1. Comparison of expression levels of the immune cell types and functional marker genes and gene-sets between two classes of samples
Table S2. Comparison of expression levels of the TILs genes and gene-set between two classes of samples
Table S3. Comparison of expression levels of the Treg and immune checkpoint genes and gene-set between two classes of samples
Table S4. Comparison of expression levels of the cytokine and cytokine receptor genes and gene-set between two classes of samples
Table S5. Comparison of expression levels of the CTA genes and gene-set between two classes of samples
Table S6. Comparison of expression levels of the HLA genes and gene-set between two classes of samples
Table S7. Comparison of expression levels of the proinflammatory genes and gene-set between two classes of samples
Table S8. Comparison of expression levels of the PI genes and gene-set between two classes of samples
Table S9. Comparisons of expression levels of immune genes between TP53-mutated and TP53-wildtype GCs, and their associations with survival prognosis in GC
Table S10. Comparisons of ssGSEA scores of immune gene-sets between TP53-mutated and TP53-wildtype GCs, and their associations with survival prognosis in GC
Comparisons of expression levels of immune genes and gene-sets between TP53-mutated and TP53-wildtyped GCs within the MSS GC subtype
Comparisons of enrichment levels of immune gene-sets between TP53-mutated and TP53-wildtyped GCs within the EBV− GC subtype
Comparisons of expression levels of the genes targeted by immunotherapy agents in clinical use or trials or in preclinical development between TP53-mutated and TP53-wildtyped GCs
Comparisons of enrichment levels of immune cell types and function, TILs, and immune checkpoint gene-sets and genes between TP53-mutated and TP53-wildtype GCs. (A) Most of the immune cell types and functional gene-sets show significantly lower enrichment levels in TP53-mutated GCs than in TP53-wildtype GCs. *: P < 0.05; **: P < 0.01; ***: P < 0.001, and it applies to all the following box charts. (B) The TILs gene-set shows significantly lower enrichment levels in TP53-mutated GCs than in TP53-wildtype GCs. (C) Heat map for expression levels of immune checkpoint genes in TP53-mutated and TP53-wildtype GCs. (D) A number of important immune checkpoint genes show significantly lower expression levels in TP53-mutated GCs than in TP53-wildtype GCs in ACRG.
Comparisons of expression levels of CCR and proinflammatory genes between TP53-mutated and TP53-wildtype GCs. (A) Heat map for expression levels of CCR genes in TP53-mutated and TP53-wildtype GCs. (B) Heat map for expression levels of proinflammatory genes in TP53-mutated and TP53-wildtype GCs. CCR: cytokine and cytokine receptor.
Authors' Contributions
ZJ performed the major data analyses, and helped prepare for the manuscript. ZL performed data analyses. ML performed data analyses. CC performed data analyses. XW conceived the research, designed the analyses strategies, and wrote the manuscript. All the authors read and approved the final manuscript.
Conflicts of Interest
The authors declare that they have no conflicts of interest.
Acknowledgements
Not applicable.
Footnotes
Funding: This work was supported by the China Pharmaceutical University [Grant number 3150120001, 2632018YX01].
References
- 1.Wang X, Sun Q. TP53 mutations, expression and interaction networks in human cancers. Oncotarget. 2017;8(1):624–643. doi: 10.18632/oncotarget.13483. [DOI] [PMC free article] [PubMed] [Google Scholar]
- 2.Munoz-Fontela C, Mandinova A, Aaronson SA, Lee SW. Emerging roles of p53 and other tumour-suppressor genes in immune regulation. Nat Rev Immunol. 2016;16(12):741–750. doi: 10.1038/nri.2016.99. [DOI] [PMC free article] [PubMed] [Google Scholar]
- 3.Zitvogel L, Kroemer G. CANCER. A p53-regulated immune checkpoint relevant to cancer. Science. 2015;349(6247):476–477. doi: 10.1126/science.aac8475. [DOI] [PubMed] [Google Scholar]
- 4.Textor S, Fiegler N, Arnold A, Porgador A, Hofmann TG, Cerwenka A. Human NK cells are alerted to induction of p53 in cancer cells by upregulation of the NKG2D ligands ULBP1 and ULBP2. Cancer Res. 2011;71(18):5998–6009. doi: 10.1158/0008-5472.CAN-10-3211. [DOI] [PubMed] [Google Scholar]
- 5.Shatz M, Menendez D, Resnick MA. The human TLR innate immune gene family is differentially influenced by DNA stress and p53 status in cancer cells. Cancer Res. 2012;72(16):3948–3957. doi: 10.1158/0008-5472.CAN-11-4134. [DOI] [PMC free article] [PubMed] [Google Scholar]
- 6.Guo G, Yu M, Xiao W, Celis E, Cui Y. Local activation of p53 in the tumor microenvironment overcomes immune suppression and enhances antitumor immunity. Cancer Res. 2017;77(9):2292–2305. doi: 10.1158/0008-5472.CAN-16-2832. [DOI] [PMC free article] [PubMed] [Google Scholar]
- 7.Topalian SL, Drake CG, Pardoll DM. Immune checkpoint blockade: a common denominator approach to cancer therapy. Cancer cell. 2015;27(4):450–461. doi: 10.1016/j.ccell.2015.03.001. [DOI] [PMC free article] [PubMed] [Google Scholar]
- 8.June CH, O'Connor RS, Kawalekar OU, Ghassemi S, Milone MC. CAR T cell immunotherapy for human cancer. Science. 2018;359(6382):1361–1365. doi: 10.1126/science.aar6711. [DOI] [PubMed] [Google Scholar]
- 9.Snyder A, Makarov V, Merghoub T, Yuan J, Zaretsky JM, Desrichard A, Walsh LA, Postow MA, Wong P, Ho TS. Genetic basis for clinical response to CTLA-4 blockade in melanoma. N Engl J Med. 2014;371(23):2189–2199. doi: 10.1056/NEJMoa1406498. [DOI] [PMC free article] [PubMed] [Google Scholar]
- 10.Rizvi NA, Hellmann MD, Snyder A, Kvistborg P, Makarov V, Havel JJ, Lee W, Yuan J, Wong P, Ho TS. Cancer immunology. Mutational landscape determines sensitivity to PD-1 blockade in non-small cell lung cancer. Science. 2015;348(6230):124–128. doi: 10.1126/science.aaa1348. [DOI] [PMC free article] [PubMed] [Google Scholar]
- 11.Hugo W, Zaretsky JM, Sun L, Song C, Moreno BH, Hu-Lieskovan S, Berent-Maoz B, Pang J, Chmielowski B, Cherry G. Genomic and Transcriptomic Features of Response to Anti-PD-1 Therapy in Metastatic Melanoma. Cell. 2016;165(1):35–44. doi: 10.1016/j.cell.2016.02.065. [DOI] [PMC free article] [PubMed] [Google Scholar]
- 12.Van Allen EM, Miao D, Schilling B, Shukla SA, Blank C, Zimmer L, Sucker A, Hillen U, Geukes Foppen MH, Goldinger SM. Genomic correlates of response to CTLA-4 blockade in metastatic melanoma. Science. 2015;350(6257):207–211. doi: 10.1126/science.aad0095. [DOI] [PMC free article] [PubMed] [Google Scholar]
- 13.Taube JM, Klein A, Brahmer JR, Xu H, Pan X, Kim JH, Chen L, Pardoll DM, Topalian SL, Anders RA. Association of PD-1, PD-1 ligands, and other features of the tumor immune microenvironment with response to anti-PD-1 therapy. Clin Cancer Res. 2014;20(19):5064–5074. doi: 10.1158/1078-0432.CCR-13-3271. [DOI] [PMC free article] [PubMed] [Google Scholar]
- 14.Le DT, Uram JN, Wang H, Bartlett BR, Kemberling H, Eyring AD, Skora AD, Luber BS, Azad NS, Laheru D. PD-1 Blockade in Tumors with Mismatch-Repair Deficiency. N Engl J Med. 2015;372(26):2509–2520. doi: 10.1056/NEJMoa1500596. [DOI] [PMC free article] [PubMed] [Google Scholar]
- 15.Bernstein V, Ellard S, Dent SF, Gelmon KA, Dhesy-Thind SK, Mates M, Salim M, Panasci L, Song X, Clemons M. 2017. Oncolytics Biotech® Inc.’s REOLYSIN® More than Doubles Overall Survival in Patients with Mutated p53 Metastatic Breast Cancer. [Google Scholar]
- 16.Ye XS, Yu C, Aggarwal A, Reinhard C. Genomic alterations and molecular subtypes of gastric cancers in Asians. Chin J Cancer. 2016;35:42. doi: 10.1186/s40880-016-0106-2. [DOI] [PMC free article] [PubMed] [Google Scholar]
- 17.Chen W, Zheng R, Zeng H, Zhang S. The updated incidences and mortalities of major cancers in China, 2011. Chin J Cancer. 2015;34(11):502–507. doi: 10.1186/s40880-015-0042-6. [DOI] [PMC free article] [PubMed] [Google Scholar]
- 18.Cancer Genome Atlas Research, N Comprehensive molecular characterization of gastric adenocarcinoma. Nature. 2014;513(7517):202–209. doi: 10.1038/nature13480. [DOI] [PMC free article] [PubMed] [Google Scholar]
- 19.Cristescu R, Lee J, Nebozhyn M, Kim KM, Ting JC, Wong SS, Liu J, Yue YG, Wang J, Yu K. Molecular analysis of gastric cancer identifies subtypes associated with distinct clinical outcomes. Nat Med. 2015;21(5):449–456. doi: 10.1038/nm.3850. [DOI] [PubMed] [Google Scholar]
- 20.Chen T, Xu XY, Zhou PH. Emerging molecular classifications and therapeutic implications for gastric cancer. Chin J Cancer. 2016;35:49. doi: 10.1186/s40880-016-0111-5. [DOI] [PMC free article] [PubMed] [Google Scholar]
- 21.Barbie DA, Tamayo P, Boehm JS, Kim SY, Moody SE, Dunn IF, Schinzel AC, Sandy P, Meylan E, Scholl C. Systematic RNA interference reveals that oncogenic KRAS-driven cancers require TBK1. Nature. 2009;462(7269):108–112. doi: 10.1038/nature08460. [DOI] [PMC free article] [PubMed] [Google Scholar]
- 22.Hanzelmann S, Castelo R, Guinney J. GSVA: gene set variation analysis for microarray and RNA-seq data. BMC Bioinformatics. 2013;14:7. doi: 10.1186/1471-2105-14-7. [DOI] [PMC free article] [PubMed] [Google Scholar]
- 23.Benjami Y, Hochberg Y. Controlling the false discovery rate: a practical and powerful approach to multiple testing. J R Stat Soc B. 1995;57:289–300. [Google Scholar]
- 24.Subramanian A, Tamayo P, Mootha VK, Mukherjee S, Ebert BL, Gillette MA, Paulovich A, Pomeroy SL, Golub TR, Lander ES. Gene set enrichment analysis: a knowledge-based approach for interpreting genome-wide expression profiles. Proc Natl Acad Sci U S A. 2005;102(43):15545–15550. doi: 10.1073/pnas.0506580102. [DOI] [PMC free article] [PubMed] [Google Scholar]
- 25.Yoshihara K, Shahmoradgoli M, Martinez E, Vegesna R, Kim H, Torres-Garcia W, Trevino V, Shen H, Laird PW, Levine DA. Inferring tumour purity and stromal and immune cell admixture from expression data. Nat Commun. 2013;4:2612. doi: 10.1038/ncomms3612. [DOI] [PMC free article] [PubMed] [Google Scholar]
- 26.Kanehisa M, Furumichi M, Tanabe M, Sato Y, Morishima K. KEGG: new perspectives on genomes, pathways, diseases and drugs. Nucleic Acids Res. 2017;45(D1):D353–D361. doi: 10.1093/nar/gkw1092. [DOI] [PMC free article] [PubMed] [Google Scholar]
- 27.Kim S. ppcor: An R Package for a Fast Calculation to Semi-partial Correlation Coefficients. Commun Stat Appl Methods. 2015;22(6):665–674. doi: 10.5351/CSAM.2015.22.6.665. [DOI] [PMC free article] [PubMed] [Google Scholar]
- 28.Rooney MS, Shukla SA, Wu CJ, Getz G, Hacohen N. Molecular and genetic properties of tumors associated with local immune cytolytic activity. Cell. 2015;160(1-2):48–61. doi: 10.1016/j.cell.2014.12.033. [DOI] [PMC free article] [PubMed] [Google Scholar]
- 29.Vinay DS, Ryan EP, Pawelec G, Talib WH, Stagg J, Elkord E, Lichtor T, Decker WK, Whelan RL, Kumara HM. Immune evasion in cancer: Mechanistic basis and therapeutic strategies. Semin Cancer Biol. 2015;35:S185–S198. doi: 10.1016/j.semcancer.2015.03.004. [Suppl] [DOI] [PubMed] [Google Scholar]
- 30.Rosenberg SA, Restifo NP. Adoptive cell transfer as personalized immunotherapy for human cancer. Science. 2015;348(6230):62–68. doi: 10.1126/science.aaa4967. [DOI] [PMC free article] [PubMed] [Google Scholar]
- 31.Lee HJ, Lee J-J, Song IH, Park IA, Kang J, Yu JH, Ahn J-H, Gong G. Prognostic and predictive value of NanoString-based immune-related gene signatures in a neoadjuvant setting of triple-negative breast cancer: relationship to tumor-infiltrating lymphocytes. Breast Cancer Res Treat. 2015;151(3):619–627. doi: 10.1007/s10549-015-3438-8. [DOI] [PubMed] [Google Scholar]
- 32.Massink MPG, Kooi IE, Martens JWM, Waisfisz Q, Meijers-Heijboer H. Genomic profiling of CHEK2*1100delC-mutated breast carcinomas. BMC Cancer. 2015;15:877. doi: 10.1186/s12885-015-1880-y. [DOI] [PMC free article] [PubMed] [Google Scholar]
- 33.Tanaka A, Sakaguchi S. Regulatory T cells in cancer immunotherapy. Cell Res. 2017;27(1):109–118. doi: 10.1038/cr.2016.151. [DOI] [PMC free article] [PubMed] [Google Scholar]
- 34.De Simone M, Arrigoni A, Rossetti G, Gruarin P, Ranzani V, Politano C, Bonnal RJP, Provasi E, Sarnicola ML, Panzeri I. Transcriptional Landscape of Human Tissue Lymphocytes Unveils Uniqueness of Tumor-Infiltrating T Regulatory Cells. Immunity. 2016;45(5):1135–1147. doi: 10.1016/j.immuni.2016.10.021. [DOI] [PMC free article] [PubMed] [Google Scholar]
- 35.Lippitz BE. Cytokine patterns in patients with cancer: a systematic review. Lancet Oncol. 2013;14(6):e218–e228. doi: 10.1016/S1470-2045(12)70582-X. [DOI] [PubMed] [Google Scholar]
- 36.Wong HS-C, Chang C-M, Liu X, Huang W-C, Chang W-C. Characterization of cytokinome landscape for clinical responses in human cancers. Oncoimmunology. 2016;5(11) doi: 10.1080/2162402X.2016.1214789. [DOI] [PMC free article] [PubMed] [Google Scholar]
- 37.Caballero OL, Chen Y-T. Cancer/testis (CT) antigens: potential targets for immunotherapy. Cancer Sci. 2009;100(11):2014–2021. doi: 10.1111/j.1349-7006.2009.01303.x. [DOI] [PMC free article] [PubMed] [Google Scholar]
- 38.Almeida LG, Sakabe NJ, deOliveira AR, Silva MCC, Mundstein AS, Cohen T, Chen Y-T, Chua R, Gurung S, Gnjatic S. CTdatabase: a knowledge-base of high-throughput and curated data on cancer-testis antigens. Nucleic Acids Res. 2009;37(Database issue):D816–D819. doi: 10.1093/nar/gkn673. [DOI] [PMC free article] [PubMed] [Google Scholar]
- 39.Renaud S, Pugacheva EM, Delgado MD, Braunschweig R, Abdullaev Z, Loukinov D, Benhattar J, Lobanenkov V. Expression of the CTCF-paralogous cancer-testis gene, brother of the regulator of imprinted sites (BORIS), is regulated by three alternative promoters modulated by CpG methylation and by CTCF and p53 transcription factors. Nucleic Acids Res. 2007;35(21):7372–7388. doi: 10.1093/nar/gkm896. [DOI] [PMC free article] [PubMed] [Google Scholar]
- 40.Munro A, Bright S. Products of the major histocompatibility complex and their relationship to the immune response. Nature. 1976;264(5582):145–152. doi: 10.1038/264145a0. [DOI] [PubMed] [Google Scholar]
- 41.Wang B, Niu D, Lai L, Ren EC. p53 increases MHC class I expression by upregulating the endoplasmic reticulum aminopeptidase ERAP1. Nat Commun. 2013;4:2359. doi: 10.1038/ncomms3359. [DOI] [PMC free article] [PubMed] [Google Scholar]
- 42.Fritsch EF, Hacohen N, Wu CJ. Personal neoantigen cancer vaccines: The momentum builds. Oncoimmunology. 2014;3 doi: 10.4161/onci.29311. [DOI] [PMC free article] [PubMed] [Google Scholar]
- 43.Grivennikov SI, Greten FR, Karin M. Immunity, inflammation, and cancer. Cell. 2010;140(6):883–899. doi: 10.1016/j.cell.2010.01.025. [DOI] [PMC free article] [PubMed] [Google Scholar]
- 44.Bedognetti D, Hendrickx W, Marincola FM, Miller LD. Prognostic and predictive immune gene signatures in breast cancer. Curr Opin Oncol. 2015;27(6):433–444. doi: 10.1097/CCO.0000000000000234. [DOI] [PubMed] [Google Scholar]
- 45.Aran D, Lasry A, Zinger A, Biton M, Pikarsky E, Hellman A, Butte AJ, Ben-Neriah Y. Widespread parainflammation in human cancer. Genome Biol. 2016;17(1):145. doi: 10.1186/s13059-016-0995-z. [DOI] [PMC free article] [PubMed] [Google Scholar]
- 46.Kastenhuber ER, Lowe SW. Putting p53 in Context. Cell. 2017;170(6):1062–1078. doi: 10.1016/j.cell.2017.08.028. [DOI] [PMC free article] [PubMed] [Google Scholar]
- 47.Bakhoum SF, Ngo B, Laughney AM, Cavallo JA, Murphy CJ, Ly P, Shah P, Sriram RK, Watkins TBK, Taunk NK. Chromosomal instability drives metastasis through a cytosolic DNA response. Nature. 2018;553(7689):467–472. doi: 10.1038/nature25432. [DOI] [PMC free article] [PubMed] [Google Scholar]
- 48.Chen J. The Cell-Cycle Arrest and Apoptotic Functions of p53 in Tumor Initiation and Progression. Cold Spring Harb Perspect Med. 2016;6(3):a026104. doi: 10.1101/cshperspect.a026104. [DOI] [PMC free article] [PubMed] [Google Scholar]
- 49.Wang X, Sun Q. TP53 mutations, expression and interaction networks in human cancers. Oncotarget. 2017;8(1):624–643. doi: 10.18632/oncotarget.13483. [DOI] [PMC free article] [PubMed] [Google Scholar]
- 50.Goel S., DeCristo MJ, Watt AC, BrinJones H, Sceneay J, Li BB, Khan N, Ubellacker JM, Xie S, Metzger-Filho O. CDK4/6 inhibition triggers anti-tumour immunity. Nature. 2017;548(7668):471–475. doi: 10.1038/nature23465. [DOI] [PMC free article] [PubMed] [Google Scholar]
- 51.Kawamura K, Izumi H, Ma Z, Ikeda R, Moriyama M, Tanaka T, Nojima T, Levin LS, Fujikawa-Yamamoto K, Suzuki K. Induction of centrosome amplification and chromosome instability in human bladder cancer cells by p53 mutation and cyclin E overexpression. Cancer Res. 2004;64(14):4800–4809. doi: 10.1158/0008-5472.CAN-03-3908. [DOI] [PubMed] [Google Scholar]
- 52.Floter J, Kaymak I, Schulze A. Regulation of Metabolic Activity by p53. Metabolites. 2017;7(2) doi: 10.3390/metabo7020021. [DOI] [PMC free article] [PubMed] [Google Scholar]
- 53.http://www.genecards.org/
- 54.Smyth M.J., Ngiow SF, Ribas A, Teng MWL. Combination cancer immunotherapies tailored to the tumour microenvironment. Nat Rev Clin Oncol. 2016;13(3):143–158. doi: 10.1038/nrclinonc.2015.209. [DOI] [PubMed] [Google Scholar]
Associated Data
This section collects any data citations, data availability statements, or supplementary materials included in this article.
Supplementary Materials
Table S1. Comparison of expression levels of the immune cell types and functional marker genes and gene-sets between two classes of samples
Table S2. Comparison of expression levels of the TILs genes and gene-set between two classes of samples
Table S3. Comparison of expression levels of the Treg and immune checkpoint genes and gene-set between two classes of samples
Table S4. Comparison of expression levels of the cytokine and cytokine receptor genes and gene-set between two classes of samples
Table S5. Comparison of expression levels of the CTA genes and gene-set between two classes of samples
Table S6. Comparison of expression levels of the HLA genes and gene-set between two classes of samples
Table S7. Comparison of expression levels of the proinflammatory genes and gene-set between two classes of samples
Table S8. Comparison of expression levels of the PI genes and gene-set between two classes of samples
Table S9. Comparisons of expression levels of immune genes between TP53-mutated and TP53-wildtype GCs, and their associations with survival prognosis in GC
Table S10. Comparisons of ssGSEA scores of immune gene-sets between TP53-mutated and TP53-wildtype GCs, and their associations with survival prognosis in GC
Comparisons of expression levels of immune genes and gene-sets between TP53-mutated and TP53-wildtyped GCs within the MSS GC subtype
Comparisons of enrichment levels of immune gene-sets between TP53-mutated and TP53-wildtyped GCs within the EBV− GC subtype
Comparisons of expression levels of the genes targeted by immunotherapy agents in clinical use or trials or in preclinical development between TP53-mutated and TP53-wildtyped GCs
Comparisons of enrichment levels of immune cell types and function, TILs, and immune checkpoint gene-sets and genes between TP53-mutated and TP53-wildtype GCs. (A) Most of the immune cell types and functional gene-sets show significantly lower enrichment levels in TP53-mutated GCs than in TP53-wildtype GCs. *: P < 0.05; **: P < 0.01; ***: P < 0.001, and it applies to all the following box charts. (B) The TILs gene-set shows significantly lower enrichment levels in TP53-mutated GCs than in TP53-wildtype GCs. (C) Heat map for expression levels of immune checkpoint genes in TP53-mutated and TP53-wildtype GCs. (D) A number of important immune checkpoint genes show significantly lower expression levels in TP53-mutated GCs than in TP53-wildtype GCs in ACRG.
Comparisons of expression levels of CCR and proinflammatory genes between TP53-mutated and TP53-wildtype GCs. (A) Heat map for expression levels of CCR genes in TP53-mutated and TP53-wildtype GCs. (B) Heat map for expression levels of proinflammatory genes in TP53-mutated and TP53-wildtype GCs. CCR: cytokine and cytokine receptor.


