

Abstract
Chimeric antigen receptor (CAR)-modified T cell therapy has the potential to improve the overall survival of patients with malignancies by enhancing the effectiveness of CAR T cells. Precisely predicting the effectiveness of various CAR T cells represents one of today’s key unsolved problems in immunotherapy. Here, we predict the effectiveness of CAR-modified cells by evaluating the quality of the CAR-mediated immunological synapse (IS) by quantitation of F-actin, clustering of tumor antigen, polarization of lytic granules (LGs), and distribution of key signaling molecules within the IS. Long-term killing capability, but not secretion of conventional cytokines or standard 4-hr cytotoxicity, correlates positively with the quality of the IS in two different CAR T cells that share identical antigen specificity. Xenograft model data confirm that the quality of the IS in vitro correlates positively with performance of CAR-modified immune cells in vivo. Therefore, we propose that the quality of the IS predicts the effectiveness of CAR-modified immune cells, which provides a novel strategy to guide CAR therapy.
Keywords: chimeric antigen receptor, immunological synapse, T cell, immunotherapy, 4-1BB, CD19, Kappa
Graphical Abstract
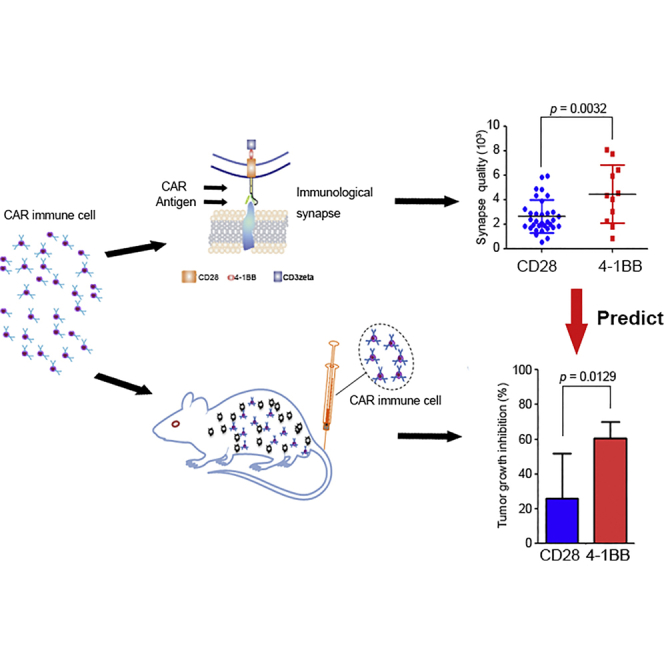
Xiong et al. developed a novel approach to predict the effectiveness of CAR-modified cells by quantifying the quality of CAR-mediated immunological synapse, which may introduce a new parameter to the field of immunotherapy.
Introduction
Progress using adoptive T cell-based therapy with chimeric antigen receptors (CARs) shows impressive success in patients with cancer by enhancing the effectiveness of CAR T cells.1, 2 A gap in our knowledge is an easy way to predict the effectiveness of CAR T cells. Specifically, many scientists from different laboratories are generating different CARs with different modifications to optimize their efficacy. However, these optimized CARs must be evaluated accurately and cost-effectively for their quality, safety, and potential effectiveness before they can enter clinical trials. The conventional tools for immunological analyses of quality and effectiveness are also time consuming, labor intensive, and costly.
The immunological synapse (IS) was originally described by imaging T cell interactions with antigen-presenting cells (APCs).3, 4 The structure, function, and signaling cascades at the synapses have been confirmed by imaging of T cell interactions with the glass-supported planar lipid bilayer containing the major histocompatibility complex (MHC)-peptide complex and other co-stimulatory molecules.5, 6, 7, 8, 9 The consensus in the field of basic immunology is that the glass-supported planar lipid bilayer system can be used for mimicking the target cells to study synapses at high resolution10, 11, 12 and can serve as a reductionist approach for studying the IS and its function.13 Although tremendous progress has been made in basic immunology research on the IS, with a focus on the structure, function, and signaling cascades, no study to date has addressed how the IS of the CAR controls CAR T cell activation and whether CAR IS quality can predict efficacy in vivo.
Herein, we have applied the glass-supported planar lipid bilayer system to study the CAR IS at high resolution. Our images have revealed several properties of the CAR IS, including both Kappa and CD19 (two distinct tumor antigens), which directly mirror the distribution of CAR proteins on CAR-modified cells, accumulated at the CAR-modified immune cell synapse. Multiple parameters, including the amount of Kappa and CD19, accumulation of F-actin, polarization of lytic granules (LGs), and distribution of key signaling molecules at the IS, predicted the effectiveness of the CAR-modified cells as measured by both tumor cell numbers and CAR-modified cell proliferation during a long-term killing assay, as well as in vivo efficacy in a mouse xenograft model.
Meanwhile, we developed a novel imaging system to study the CAR-modified cell’s IS horizontally in a high-throughput manner, which complements to the glass-supported planar lipid bilayer system. The vertical cell pairing (VCP) system enables imaging of the CAR-modified cell’s IS in a horizontal focal plane on both fixed- and live-cell imaging.14 This system can also capture more than 3,000 conjugates at a time with high loading efficiency.14 Employing this VCP system, we presented for the first time a face-to-face look at the structure and signaling of the IS of the CAR T cells with their susceptible tumor cells. Moreover, using an in vivo xenograft model, we demonstrate that the quality of IS predicts in vivo efficacy. Altogether, we propose that the quality of the IS can predict the effectiveness of CAR-modified cells, which provides the field of immunotherapy with a novel strategy to advance the development of CAR-modified immune cell therapies.
Results
Visualization of CAR T IS by Two Complementary Systems
To test whether CAR T cells can form a stable IS, both Kappa-CAR and CD19-CAR were stimulated with the glass-supported planar lipid bilayers carrying fluorescently labeled Kappa and CD19 tumor antigen, respectively. The CAR constructs were described previously.15 The construct is composed of a retroviral vector containing the single-chain antibody against the CD19 molecule or Kappa chain protein, the CD28 intracellular domain (hereinafter referred to as CD28-CAR) or CD28 intracellular domain linked with the cytoplasmic domain of 4-1BB (hereinafter referred to as 4-1BB-CAR), and the zeta chain of the T cell receptor (TCR).15, 16, 17 Kappa-CAR and CD19-CAR share the same intracellular domains (Figures 1A and 1B). The distributions of CAR were imaged by 3-dimensional (3D) confocal microscopy (Figures 1C and 1D). Images of fixed CAR T cells on lipid bilayers revealed strong accumulation of Kappa and CD19 under each CAR T cell, surrounded by F-actin staining, which is reminiscent of the central cluster of the TCR and B cell receptor (BCR) at the synapse.3, 18
Figure 1.

Visualization of the CAR T Cell IS by Two Complementary Systems
(A and B) Schematic representation of recombinant retroviral vectors encoding CAR. Both (A) Kappa- and (B) CD19-CAR constructs (CD28 and 4-1BB) contain the CD28 transmembrane domain and intracellular domain of CD3 zeta, comparing to the TM of Kappa- and CD19-CAR constructs. As a control, these TM controls do not have any intracellular domain (dash line). (C) Diagram of the lipid bilayer containing Alexa Fluor 647-labeled human Kappa IgG1 (left), and confocal images of the CAR IS on the lipid bilayer carrying Alexa Fluor 647-labeled human Kappa IgG1 (right). The lower panel shows a schematic model of the VCP system (left) and confocal images of a Kappa-CAR T cell conjugated with a Kappa chain-positive pre-stained Daudi cell (cyan) (right). (D) Diagram of the lipid bilayer containing Alexa Fluor 568-labeled CD19 (left) and confocal images of a representative CD19-CAR T cell on the lipid bilayer carrying Alexa Fluor 568-CD19 (right). The lower panel shows a schematic model of the VCP system with a CD19-CAR T cell and its susceptible Raji cell (left) and confocal images of CD19-CAR T cells conjugated with CD19-positive Raji cells (cyan) using the VCP system (right). Fixed and permeabilized CAR T cells were stained for using antibodies (Abs) against perforin (green), pZeta (cyan), and F-actin (magenta), respectively. Scale bars represent 10.0 μm.
In addition to the structure of the IS, we investigated the intracellular downstream signaling molecule pZeta (a critical molecule for CAR signaling), F-actin (an essential component for maintaining the IS stability19, 20), and perforin (a marker for LGs). To visualize the distribution of phosphorylation of the zeta chain, an antibody against the phosphorylated zeta chain at tyrosine 83 (Y83) was used to stain pZeta at the IS. As expected, most of pZeta was co-localized with the Kappa or CD19 antigen, the tumor antigens on the lipid bilayers, which can directly mirror the distribution of corresponding CAR molecules on the CAR T cells (Figures 1C and 1D, upper panels). Meanwhile, strong accumulation of F-actin and polarization of perforin were observed at the IS (Figures 1C and 1D, upper panels), indicating a functional CAR IS formation on the glass-supported planar lipid bilayer.
One potential criticism of the glass-supported planar lipid bilayer system is that it cannot fully mimic the complex surface of a tumor cell.21 To demonstrate that the IS formation we observed on the glass-supported planar lipid bilayer can be recapitulated on CAR T cells with their real susceptible tumor cells, we developed a high-throughput VCP image device.14 This device allows us to visualize the IS between the CAR T cell and its susceptible tumor cells in a vertical focal plane at high resolution. The Daudi cell line positive-expression Kappa chain was loaded into the VCP device first, followed by CAR T cells. Similarly, images of fixed CAR T cells showed accumulation of both Kappa and CD19 at the IS. Both F-actin and perforin were polarized at the CAR T IS (Figures 1C and 1D, lower panels). Thus, the CAR T cell can form a functional IS, measured by structure, signaling, and function using two complementary systems.
Superior Quality of IS Formed by 4-1BB-CAR T Cells
Different intracellular domains of CAR can mediate different anti-tumor activities.22, 23 Given the CAR IS formation described earlier in two CAR T cells, we hypothesize that the quality of the IS (e.g., quantitation of its structure, signaling, and function) built by 4-1BB-CAR is different from that of the CD28-CAR T cells.
To test this hypothesis, we quantitatively compared the structure, signaling, and function of the IS. Stronger F-actin, pZeta, and central cluster of tumor antigen staining were observed in 4-1BB-CAR T cells compared to CD28-CAR T cells derived from the same donor (Figure 2). Both 4-1BB-CAR T cells and CD28-CAR T cells can accumulate the Kappa antigen on the lipid bilayers. Although the distributions of the Kappa clusters in these two CARs were similar, the mean fluorescence intensity (MFI) of the Kappa cluster in the 4-1BB-CAR T cells was significantly higher than that of the CD28-CAR T cells (Figure 2B), indicating superior anti-tumor activity mediated by 4-1BB co-stimulatory domains. Quantitative results for Kappa-CAR IS from four other individuals were summarized (Figure S1). Significantly increased pZeta from 4-1BB-CAR T cells was observed from four of five individuals (Figure S1). The MFI of F-actin accumulation, kappa antigen clustering, and percentage of LG polarization in 4-1BB-CAR T cells were significantly higher than those of the CD28-CAR T cells from four other individuals (Figure S1). Thus, quantitative data from five individuals suggests that the quality of the IS built by 4-1BB-CAR is superior to that of the CD28-CAR T cells.
Figure 2.

Quantitative Quality of IS Formed by 4-1BB-CAR and CD28-CAR T Cells
(A) Confocal microscopy of Kappa-4-1BB-CAR T cells and Kappa-CD28-CAR T cells on a lipid bilayer carrying human Kappa IgG1-Alexa Fluor 647 (red). Fixed and permeabilized CAR T cells were stained for pZeta (cyan) and F-actin (magenta). A visual cartoon of the lipid bilayer and CAR T cells is displayed (left). Scale bars represent 25.0 μm. (B) Quantification of IS on the lipid bilayer-T cell focal plane by measuring the MFIs of F-actin, pZeta, and Kappa cluster on the lipid bilayers containing Kappa IgG1. Error bars show ±SD. The p value is for unpaired t-test. Data represent three independent experiments.
To rule out effects of transduction efficiencies and concentrations of the CAR molecules expressed on the CAR-modified T cells in terms of the quality of IS, we compared the expression of CAR molecules among truncated membrane (TM)-only control (Figure 1) and CD28- and 4-1BB-CAR-modified T cells (Figure S2). The transduction efficiency (measured by the percentage of CAR molecules) of CD28-CAR is slightly higher than that of 4-1BB-CAR in both CD19-CAR- and Kappa-CAR-modified T cells (Figure S2). In addition to the transduction efficiency, we compared the MFI of CAR molecules among five individuals, which reflects the number of CAR molecules per transduced CAR T cell. The quantitative results from the five individuals showed that the MFI of CAR molecules in 4-1BB-CAR was slightly lower than that in CD28-CAR (Figure S2). Although the transduction efficiencies and MFI of CD28-CAR are slightly higher than those of 4-1BB-CAR, the quality of IS formed by 4-1BB-CAR is superior to the quality of IS formed by CD28-CAR (Figure 2). Therefore, the differences that we observed in this study in IS quality between CD28-CAR and 4-1BB-CAR may not be caused by the transduction efficiencies and expression of CAR molecules between CD28-CAR and 4-1BB-CAR.
As a control, CAR T cells were added to the bilayers carrying fluorescently labeled lambda immunoglobulin G1 (IgG1) (Figure S3A). No cells interacted with the lipid bilayer containing lambda IgG1 (Figure S3A). No clustering in response to lambda IgG1 was observed for either 4-1BB- or CD28-CAR T cells, which suggests specific interactions and IS formations by CAR T cells on lipid bilayers carrying their susceptible tumor antigens.
In addition to pZeta (a proximal CAR signaling molecule), we investigated more distal CAR signaling pathways, pZAP-70 (zeta chain-associated protein 70) and Lck (lymphocyte-specific protein tyrosine kinase), at the CAR T synapse. As expected, the Kappa IgG1 protein on the lipid bilayer triggered activities of both pZAP-70 and Lck (Figures S3B and S3C). These two signaling molecules are involved in the long-term proliferation and differentiation of activated T lymphocytes.24, 25
Similar results were obtained from CD19-CAR (Figures S4A and S4B), which confirms a broad, potential superior effect of 4-1BB co-stimulatory domains. Altogether, the data demonstrated superior IS quality elicited by 4-1BB-CAR T cells compared to CD28-CAR T cells.
Standard 51Cr Release Assay and Cytokine Secretion Cannot Distinguish the Difference between 4-1BB-CAR- and CD28-CAR-Modified T Cells
Optimal function of T cells depends on the quality of the IS.26 Given the superior quality of the IS built by 4-1BB-CAR T cells, we postulate that 4-1BB-CAR T cells can elicit superior killing activity against their susceptible tumor cells.
To test this hypothesis, we used the gold standard 4-hr 51Cr release assay to measure the cytotoxicity of CAR T cells, as well as intracellular cytokine secretion. Upon comparing the cytotoxicity of 4-1BB-CAR T cells and CD28-CAR T cells, we observed that both 4-1BB-CAR T cells and CD28-CAR T cells efficiently killed their susceptible tumor cells at a different ratio of effector-to-target cells. The efficiency of the killing ability was dose dependent (Figure 3A). However, both CAR T cells displayed similar anti-tumor activity against Kappa chain-positive Daudi cells (Figure 3A, left), similar to CD19-CAR T cells against CD19-positive tumor Raji cells (Figure 3A, right). We confirmed this observation with multiple target cell lines to test the 4-hr cytotoxicity of both CD19-CAR and Kappa-CAR. Similar results were observed under cytotoxicity of Kappa-CAR T cells against other Kappa-positive cell lines (JeKo-1 and BJAB17) and cytotoxicity of CD19-CAR T cells against the Daudi cell line, which expresses CD19 and Kappa chain simultaneously from another two individuals (Figure S5). Although multiple tumor cell lines were used as different target cells, a significant difference in 4-hr cytotoxicity between 4-1BB-CAR and CD28-CAR cannot be detected by a conventional 51Cr release assay.
Figure 3.

Neither Standard Killing nor Intracellular Cytokine and Ratio of CD4/CD8 Can Distinguish the Difference between 4-1BB-CAR and CD28-CAR
(A) Cytotoxicity of Kappa-CAR T cells (left) and CD19-CAR T cells (right) from the same healthy donor was measured using a standard 4-hr 51Cr-release assay. Daudi cells (the Kappa-positive B cell lymphoma cell line) were used as the Kappa-CAR T cell’s target cells. Raji cells (the CD19-positive B cell lymphoma cell line) were used as the CD19-CAR T cell’s target cells. PBMCs from five individuals were transduced with 4-1BB construct (red dots) or CD28 construct (black dots) retrovirus. (B and C) Production of TNF-α and IFN-γ by (B) Kappa-CAR and (C) CD19-CAR from five healthy donors. CAR T cells were stimulated with target cells for 6 hr in the presence of GolgiStop and brefeldin A treatment. The percentages of TNF-α or IFN-γ-positive cells were measured by flow cytometry. (D and E) Ratio of CD4/CD8 by (D) Kappa-CAR and (E) CD19-CAR from five individuals. CAR T cell stimulation with corresponding target cells for 6-hr treatment is shown. Surface staining of CD4- and CD8-positive cells was measured by flow cytometry. The ratio of CD4/CD8 and CD8 MFI was calculated by FlowJo software. Error bars show ±SD. The p value is for unpaired t-test.
In addition to the standard 4-hr cytotoxicity, cytokine production is an important parameter when evaluating the function of CAR T cells.27, 28 This led us to compare the production of tumor necrosis factor alpha (TNF-α) and interferon gamma (IFN-γ) between CD28-CAR and 4-1BB-CAR on both Kappa-CAR and CD19-CAR T cells. The productions of TNF-α and IFN-γ by both Kappa-CAR and CD19-CAR from five individuals were comparable (Figures 3B and 3C). The ratios of CD4/CD8 between CD28-CAR and 4-1BB-CAR were comparable (Figures 3D and 3E, left). The MFIs of CD8 between CD28-CAR and 4-1BB-CAR was comparable (Figures 3D and 3E, right). Moreover, interleukin-2 (IL-2) expression is a significant biomarker for efficient T cell activation.29, 30 Thus, intracellular IL-2 staining was also examined. No significant difference in IL-2 expression between CD28-CAR and 4-1BB-CAR was observed from five individuals (Figure S6).
Overall, we conclude that the 4-hr standard 51Cr release and secretion of conventional cytokine assays cannot distinguish the difference in anti-tumor activity between CD28-CAR and 4-1BB-CAR in both CD19-CAR and Kappa-CAR T cells.
Enhanced Anti-tumor Activity in 4-1BB-CAR T Cells
Previous studies have shown that the anti-tumor activity of CAR T cells depends on CAR T cell activation, persistence, and proliferation.31 To further examine whether 4-1BB-CAR T cells exhibit superior anti-tumor activity, we evaluated the persistence and proliferation of CAR T cells by performing long-term killing assays (described in Materials and Methods). Specifically, we co-cultured CAR T cells with their susceptible Daudi cell expressing red fluorescent protein mCherry (Daudi-mCherry) or Raji cell expressing GFP (Raji-GFP), which can not only measure the eradication of tumor cells but also monitor the proliferation of CAR T cells. During a 1-week co-culture period, we quantified both residual tumor cell numbers (hereinafter referred to as tumor-killing activity) and expanded CAR T cell numbers (hereinafter referred to as effector cell proliferation) by flow cytometry (Figure 4A). As expected, both 4-1BB-CAR T cells and CD28-CAR T cells efficiently eliminated Daudi cells (Figure 4B) or Raji cells (Figure 4C). 4-1BB-CAR T cells eradicated their susceptible tumor cells more rapidly.
Figure 4.

Superior Anti-tumor Activity from 4-1BB CAR T Cells Was Measured by Long-Term Killing Assay
(A) Diagram of experimental design for long-term killing assay. (B and C) Anti-tumor effects of Kappa-CAR (B) and CD19-CAR (C) were measured by the decrease in tumor cell number (left) and increase in effector cell number (right). A Kappa-positive Daudi cell expressing fluorescent protein mCherry was used as a target cell. (B and C) Error bars show ± SD.
Meanwhile, the proliferation capability of CAR T cells is a critical parameter for measuring the effectiveness of CAR T cells.16 Longer persistence of CAR T cells in patients can enhance the effectiveness of CAR T cells.31 We also measured the proliferation capability of the CAR T cell by quantifying the CAR T cell numbers during co-culturing with their susceptible tumor cells. The proliferation capability of 4-1BB CAR T cells derived from different Kappa-CAR and CD19-CAR specificities increased significantly compared to that of CD28-CAR T cells and TM-control CAR T cells (Figure 4B and 4C, right). Similar results from the four other individuals for Kappa-CAR T cells (Figure S7A) and CD19-CAR T cells (Figure S7B) were obtained. Quantitative data from these individuals confirmed the presence of significantly superior anti-tumor activity in 4-1BB CAR T cells compared to CD28-CAR T cells (Figure S7).
In summary, the results showed that the 4-1BB co-stimulatory domains enhanced the anti-tumor activity in vitro through our long-term killing assay.
Quality of IS Correlates Positively with Effectiveness of CAR T Cells In Vitro
Given the higher quality of the IS (quantitation of structure and signaling molecules within the IS) observed in 4-1BB CAR T cells, we hypothesize that the quality of IS correlates positively to the effectiveness of CAR T cells, as speculated previously.32 If so, we can predict the effectiveness of Kappa-CAR T cells and CD19-CAR T cells by evaluating the quality of the IS. To test this hypothesis, we used an accumulation of pZeta and F-actin, cluster of tumor antigen, and polarization of LG to measure the quality of the IS, while we measured the anti-tumor activity of CAR T cells by long-term killing assays from the same donor. Quantitative data from five individuals showed significantly higher quality of the IS in 4-1BB-CAR T cells compared to CD28-CAR T cells (Figure S8).
To quantify the effectiveness of the CAR T cells, we used the reciprocal of the area under the curve of tumor cell numbers (hereinafter referred to as killing efficiency) and the area under the curve of T cell numbers (hereinafter referred to as proliferation efficiency) in long-term killing assays (Figure S9). Quantitative data from five individuals showed significantly higher anti-tumor activity in 4-1BB-CAR T cells compared to CD28-CAR T cells, as measured by the reciprocal of the area under the curve of tumor cell numbers and the area under the curve of T cell numbers in long-term killing assays (Figure S9).
Then, we performed the correlation analysis between IS quality and anti-tumor activity. 4-1BB-CAR T cells from the five donors showed a positive correlation between the quality of the IS and the killing efficiency (Figure 5A), as well as proliferation efficiency (Figure 5B). In conclusion, the quality of IS correlates positively with the effectiveness of CAR T cells in vitro.
Figure 5.

Positive Correlation between Anti-tumor Effects and IS Quality
(A) Correlation analysis between the quality of the IS and the killing efficiency (the reciprocal of area under the curve of tumor cell numbers). (B) Correlation analysis between the quality of the IS and the proliferation efficiency (the area under the curve of T cell numbers). The quality of the IS was measured by the intensities of F-actin, pZeta, and cluster of tumor antigen, as well as the percentage of perforin polarization. The Pearson r value was calculated. Each dot represents one donor. These data represent at least three independent experiments.
Quality of IS Correlates Positively with Effectiveness of CAR NK Cells In Vivo
To evaluate whether the quality of IS correlates positively with anti-tumor activity in vivo and determine whether IS can predict in vivo efficacy, two natural killer (NK) 92 cell lines stably expressing Kappa-CD28-CAR and Kappa-4-1BB-CAR were established. The efficiencies of CAR expression in these two NK-92 cell lines were above 95% after flow cytometry analysis (D.L. and W.X., unpublished data). First, we employed the glass-supported planar lipid bilayer system to detect the IS formed by Kappa-CAR NK-92 cells. The MFI of the Kappa cluster in the 4-1BB-CAR NK-92 cells is significantly higher than that of the CD28-CAR NK-92 cells (Figure 6A). Similar observations of F-actin accumulation and other parameters at the IS were obtained (D.L. and W.X., unpublished data).
Figure 6.

Superior Anti-tumor Activity from 4-1BB- and Kappa-CAR NK-92 Cells in a Lymphoma Xenograft Model
(A) Representative IS quality measured by quantification of Kappa antigen MFI on the glass-supported planar lipid bilayer between CD28-CAR (red) and 4-1BB-CAR (blue). (B) Diagram of the experimental design of the lymphoma xenograft model. NSG mice (n = 6) were i.v. injected with 1 × 10⁶ FFLuc-Daudi cells (Day −7). At day 1, mice were injected (i.v.) with one dose of 1 × 10⁷ effector CAR NK-92 cells (CD28 and 4-1BB) with 2 × 10⁴ IU of IL-2, and the control group was injected with 2 × 10⁴ IU of IL-2 in PBS. At days 4 and 7, mice were injected with CAR-NK-92 cells with IL-2. (C) Representative images of the tumor burden at the indicated time points. The fluorescence intensity range is displayed (right). (D) Quantification of the tumor burden. Mice were imaged at the indicated days to evaluate the tumor burden expressed as bioluminescence (in photons per second). (*p < 0.05, **p < 0.01, unpaired two-tailed Student’s t test analysis). Tumor growth was quantified via luciferin signal (average light intensity) and plotted. (E) Tumor growth inhibition (TGI, as a percentage) was calculated at the indicated time points. (D and E) Error bars show ± SD.
Furthermore, we compared anti-tumor activities between Kappa-CD28-CAR and Kappa-4-1BB-CAR using a lymphoma xenograft model in NOD.Cg-Prkdcscid Il2rgtm1Wjl/SzJ mice (NSG) mice. FireFly luciferase (FFLuc)-tagged Daudi (FFLuc-Daudi) cells were implanted by intravenous (i.v.) tail vein injection. Tumor burden was assessed at indicated points by measuring tumor-derived bioluminescence followed by CAR-NK-92 infusion (Figure 6B). Mice treated with 4-1BB-CAR NK-92 cells show superior anti-tumor activities compared with mice with CD28-CAR NK-92 after treatment (Figures 6C and 6D). Similar results on tumor growth inhibition (TGI) were obtained (Figure 6E).
To validate this observation, we mimicked a solid tumor xenograft model by implanting the luciferase-tagged Daudi cell line subcutaneously. As expected, mice treated with 4-1BB-CAR NK-92 cells showed superior anti-tumor activities compared with those treated with CD28-CAR NK-92 in this solid tumor xenograft model (Figure S10). Thus, the quality of the IS correlates positively with the effectiveness of CAR-modified cells.
In conclusion, we propose that the quality of the IS can predict the effectiveness of CAR-modified immune cells.
Discussion
Cancer immunotherapy has been investigated for more than 126 years, since surgeon Dr. William Coley began treating cancer patients with bacteria (Streptococcus pyogenes) in 1891.33 Progress in CAR T cell-mediated immunotherapy delivers the promise of treating various cancers.34, 35, 36, 37, 38, 39 The mechanisms proposed for explaining the effectiveness of the CAR T cell focus mainly on the capabilities of cytokine secretion, cytotoxicity, proliferation, and homing to the tumor site.40 However, the exact molecular mechanisms at the level of the single cell remain unclear. Specifically, the IS between CAR-modified cells and susceptible target cells has not been extensively explored, although the IS has been studied for more than three decades in the field of basic immunology.3
In this study, we documented detailed information about the CAR IS. Both CD19-CAR and Kappa-CAR T cells formed a stable IS on the glass-supported planar lipid bilayer carrying the corresponding tumor antigens such as CD19 and Kappa molecules, as well as their susceptible target cells in a newly developed VCP imaging device.14 The quality of the IS can be used to predict the effectiveness of the CAR-modified cells in vitro and in vivo, which provides a novel strategy for clinicians to cost-effectively assess the CAR-modified immune cells.
The commonality between the CAR IS and the TCR-mediated IS is intriguing. TCR can accumulate at the center of the IS in the presence of integrin and other co-stimulatory molecules, because classic IS is a concentric structure of the central region, surrounded by an outer ring of adhesion molecules (LFA-1/ICAM-1) in the periphery.3, 41 In this study, we focused on the CAR molecule only, without other co-stimulatory molecules (e.g., integrin) on the glass-supported lipid bilayer system. This allows investigators to determine the influence of individual receptor and ligand interactions on CAR IS formation.10, 13 Similarly, CD19-CAR and Kappa-CAR molecules accumulated at the CAR IS upon stimulation of the CAR by the corresponding tumor antigens, surrounded by F-actin (an essential component for maintaining IS stability and defining the periphery of the synapse42, 43, 44, 45, 46). After accumulation of the surface artificial receptors expressed on CAR T cells, these CAR microclusters can trigger downstream signaling cascades. Strong accumulation of key signaling molecules such as pZeta was observed, which is reminiscent of the accumulation of proximal TCR signaling molecules,47, 48 a hallmark feature of T cell activation.
Accumulation of F-actin at the IS plays an important role in T cell IS formation46, 49 and was observed at the CAR IS in this study. One of the critical outcomes of accumulation of F-actin at the IS is the polarization of LG toward target cells.50 Similarly, the polarization of LG has been observed in activated CAR-modified immune cells in the two complementary systems (the glass-supported planar lipid bilayer system and the VCP system) in this study. Both CAR and TCR induce an F-actin ring at the IS, but F-actin was not completely depleted at the center of the IS, which is consistent with previous observations in human NK cells.10, 51, 52 Therefore, we have demonstrated that CAR-modified immune cells use a mechanism similar to that of the cytotoxic lymphocytes for cytotoxicity.
One of the contributions of this study is that we compared the quality of the IS between CD28-CAR and 4-1BB-CAR. We evaluated the quality of the IS by quantifying the MFI of tumor antigens on lipid bilayers (structure of the CAR IS), the MFI of key signaling molecules (signaling cascades at the CAR IS), accumulation of F-actin, and polarization of LG (function of the CAR IS). The quality of the IS, measured by structure, signaling, and function, built by 4-1BB-CAR is superior to that built by CD28-CAR, which could explain the superior tumor control from 4-1BB-CAR immunotherapy.53 The superior IS quality built by 4-1BB-CAR is due to neither the expression level of CAR molecules on each immune cell nor the transduction efficiency. Moreover, there are no significant differences in ratio of CD4/CD8 and IL-2 expression between CD28-CAR and 4-1BB-CAR. The transduction efficiencies of CD28-CAR are slightly higher than those of 4-1BB-CAR from five individuals; however, the quality of the IS formed by 4-1BB-CAR is superior to the quality of that formed by CD28-CAR.
In vivo persistence and expansion of adoptively transferred CAR-modified immune cells are crucial to obtain sustained clinical response.54, 55, 56 Precisely predicting and evaluating the quality and effectiveness of CAR T cells represents a major effect in the field of immunotherapy. The 4-hr 51Cr release assay is a gold-standard approach for measuring cytotoxicity of lymphocytes that has been widely used to evaluate the cytotoxicity of lymphocytes.57 This assay, however, could not effectively distinguish the difference in effectiveness between CD28- and 4-1BB-CAR T cells employing both Kappa-CAR and CD19-CAR in this study.
We propose that the long-term killing assay serves as a superior method to evaluate the effectiveness and proliferation of CAR-modified immune cells compared to 4-hr 51Cr release assay. Significant differences between CD28- and 4-1BB-CAR in both controlling the numbers of tumor cells and T cell expansion have been observed by the long-term killing assay (but not the 4-hr standard 51Cr release assay), which correlates positively with the quality of the stable IS formed by both CD19-CAR and Kappa-CAR. However, the long-term killing assay is (1) time consuming, taking 1–2 weeks; (2) requires the fluorescently labeled tumor cells; (3) does not have the potential role to perform high-throughput evaluation; and (4) cannot reach the high-resolution evaluation at the level of a single cell. We confirmed the anti-tumor activities between Kappa-CD28-CAR and Kappa-4-1BB-CAR using a lymphoma xenograft model in NSG mice, which suggests that IS quality in vitro can predict in vivo CAR-modified immune cell efficacy. However, the differences we observed at the CAR IS may underscore the importance of both not generalizing a finding from any single series of receptors and not comparing side-by-side the receptors generated by different investigators.58
In this study, we demonstrate that the proposed approach has a number of distinct advantages. The role of 4-1BB co-stimulation in other CAR constructs, including CD20-CAR, CD30-CAR, EGFR-CAR, and GD2-CAR, has not been documented and may be either functionally beneficial or deleterious for certain CAR constructs.59 No clinical direct comparisons between 4-1BB-CAR and CD28-CAR efficacy exist, but phase I and II data suggest similar complete response rates in acute lymphoblastic leukemia (ALL), for example, 90% with CD19-4-1BB-CAR60 and 88% with CD19-CD28-CAR.61 Therefore, not all CARs linked to the 4-1BB signaling domain may be superior to those linked to the CD28 co-stimulatory domain. Investigation to measure all CARs is beyond the scope of this study, which is designed to address a significant, unanswered question by developing an easy-to-use, high-throughput, cost-effective approach to evaluate the quality of the CAR T IS.
The approach we propose in this study could provide a novel tool to predict the effectiveness of a CAR T cell by quantifying IS quality, which may introduce a new parameter to the field of immunotherapy. At present, no single parameter can predict the efficacy of a CAR T cell’s clinical outcome. The IS quality could be used in conjunction with other parameters such as long-term killing assay and other conventional parameters as a composite clinical predictor. To this end, the technology and knowledge generated in this study may allow clinically applicable, high-throughput analysis of these single-cell high-resolution assays.
In summary, we provide a novel tool to predict the effectiveness of CAR-modified immune cells, especially the CAR T cell, by quantifying the quality of the IS. Using IS quality to predict the efficacy of immunotherapy and side effects of CAR-modified immune cells will introduce a tool or parameter into the field of immunotherapy.
Materials and Methods
Cell Lines
The following cell lines were used: Daudi, JeKo-1, BJAB, Raji (CD19+ Burkitt’s lymphoma cell lines), HEK293T, and NK-92. All cell lines were purchased from the American Type Culture Collection (ATCC, Manassas, VA, USA). Daudi and Raji cell lines were maintained in RPMI-1640 (Gibco, San Francisco, CA, USA) supplied with 10% fetal bovine serum (HyClone, Waltham, MA, USA) and 2 mM L-glutamine (Gibco). HEK293T cells were maintained in DMEM (Gibco) supplied with 10% fetal bovine serum (HyClone) and 2 mM L-glutamine (Gibco). NK-92 cells were maintained and passaged according to ATCC official recommendations.
Plasmid Construction and Retrovirus Production
The Kappa-CAR and CD19-CAR constructs used in this study were described previously.15 Both Kappa and CD19 single-chain variable fragment (scFv) sequences were cloned in a SFG retroviral backbone in frame with the hinge of the human IgG1 and the ζ chain of the human TCR/CD3 complex. All constructs contain a transmembrane domain of CD28 to ensure equal expression of the CAR constructs. Retroviral supernatants were produced by transfecting HEK293T cells with a combination of plasmid containing CD19-specific scFv or Kappa-specific scFv, RDF plasmid encoding the RD114 envelope, and PegPam3 plasmid encoding MoMLV gag-pol, as previously described.15
Generation of CAR-Modified T Cells
Peripheral blood mononuclear cells (PBMCs) were obtained from healthy donors according to the approved protocols. To transduce the PBMCs, cells were activated with 1 μg/mL anti-CD3 (clone, OKT3, Ortho Biotech, Bridgewater, NJ, USA) and 1 μg/mL anti-CD28 with 100 U/mL recombinant human IL-2 (Proleukin; Chiron, Emeryville, CA, USA) in 10% fetal bovine serum (FBS) RPMI-1640 media. Activated T cells were transduced with retroviral supernatants on day 3 in plates coated with recombinant fibronectin fragment (FN CH-296; Retronectin; Takara Shuzo, Otsu, Japan). After transduction, T cells were expanded using IL-2 and then used for assays.
51Cr Release Assay
To evaluate the cytotoxic activity of CAR T lymphocytes, standard 4-hr 51Cr release assay was used.17 Target cells were labeled with 51Cr at 37°C for 1 hr and then re-suspended at 1 × 10⁵/mL in RPMI medium with 10% FBS. 1 × 10⁴ target cells were incubated with serial-diluted CAR T cells at 37°C for 4 hr. After centrifugation, the supernatants were collected and the released 51Cr was measured with a gamma counter (Wallac, Turku, Finland). The cytotoxicity (as a percentage) was calculated as follows: [(sample − spontaneous release) / (maximum release − spontaneous release)] × 100.
Intracellular Cytokine Staining
The CAR T cells were suspended with pre-warmed R10 medium containing brefeldin A (20 μL/mL, Sigma-Aldrich) and GolgiStop (1.4 μL/mL, BD). The target cells were added into the wells to stimulate the CAR T cells for 6 hr in the incubator. After stimulation, the cells were stained with the viability dye followed by surface staining with CD3 (Clone OKT3), CD4 (Clone OKT4), and CD8 (Clone RPA-T8) antibodies (BioLegend, San Diego, CA, USA). After washing with PBS, the cells were permeabilized with Cytofix/Ctyoperm buffer (BD Biosciences) for 20 min at room temperature and then washed with 1 × BD Perm/Wash buffer twice. Next, the cells were stained with the intracellular antibodies, including TNF-α (Clone MAb11) and IFN-γ (Clone B27; both BioLegend).
Long-Term Killing Assay
To evaluate the long-term anti-tumor activity of CAR T cells, a long-term killing assay was used.16, 17 CAR T cells were co-cultured with the Kappa light-chain-positive Daudi cell expressing fluorescent protein mCherry or CD19+ Raji-GFP with an effector-to-target (E:T) ratio of 1:2. Specifically, 50,000 target cells and 25,000 CAR T effector cells were mixed with 10% counting beads (Cat. No. 01-1234-42, eBioscience) per well and plated into 96-well plates. After the indicated days of mixture, cells were analyzed by flow cytometry. The numbers of CAR T cells and target cells were calculated by the following equation: absolute count (cells per microliter) = [(cell count × eBead volume) / (eBead count × cell volume)] × eBead concentration.
Glass-Supported Planar Lipid Bilayer
Planar lipid bilayers were prepared by fusing small liposome droplets with clean glass coverslips as described.62 The liposome was trapped in a μ-Slide VI 0.4 chamber (Ibidi, Germany). Lipid bilayers were first blocked with 5% casein for 30 min and then incubated with 6.3 nM streptavidin (Life Technologies) for 20 min. After being washed extensively with imaging buffer (HEPES-buffered saline), bilayers were incubated with biotinylated antibodies conjugated with Alexa Fluor dyes at room temperature for 30 min. After a second wash with imaging buffer, bilayers were blocked with 2.5 μM D-biotin to saturate the streptavidin-binding sites. Cells were activated on the lipids for 60 min.
Confocal Imaging on the Planar Lipid Bilayer
CAR T cells were stimulated on lipid bilayers containing either fluorescently labeled Kappa or CD19 proteins. Cells were stained by fluorescently conjugated antibodies against perforin (deltaG9, Thermo Scientific), pZeta (phosphor-Y83, Abcam), LCK (3A5, Santa Cruz), and pZAP-70 (Tyr 319, Cell Signal), as described previously.63 F-actin was stained by Alexa Fluor 532-conjugated phalloidin (Life Technologies). A Leica TCS SP8 microscope (Leica, Germany) was used to obtain confocal image data.
Conjugation Experiment on the Device
The VCP device is composed of two polydimethylsiloxane (PDMS)-layer micropit and microtrap arrays, as described previously.14 Before seeding the cell, the VCP device was pre-coated with 2% BSA in PBS. Then, R10 medium was used to replace the BSA solution in the device. 10 μL of the effector cell suspension with a concentration range of 106–107 cells/mL was added into the inlet. 20 μL of R10 medium was withdrawn by a 1-mL syringe to generate flow. After 30 s of seeding, the remainder of the cell suspension was washed with medium. The microfluidic device was centrifuged at 2,000 rpm for 10 min to spin down the cells into a micropit array. Target cells were stained with eFluor 450 (65-0842-85, eBioscience) and were added into the inlet. The parameters for seeding the second cell suspension were the same as those for the first cell suspension.
For fixed-cell imaging, the device was incubated for 1 hr at 37°C to form a stable IS. The cell-cell conjugates were fixed by 4% formaldehyde solution in PBS for 15 min and then washed with PBS for 5 min. Permeabilization buffer containing 5% of normal donkey serum (NDS) and 0.5% Triton X-100 in PBS was flowed into the device for 1 hr. The permeabilization buffer was washed with PBS for 5 min. Next, primary antibodies in buffer containing 3% NDS and 0.5% Triton X-100 in PBS were pumped into the device. The device was incubated in 4°C overnight. The antibody buffer was washed with PBS for 5 min. Cells were then stained with fluorescently labeled secondary antibodies for 1 hr at room temperature. The antibody buffer was washed with PBS for 5 min, and finally, a drop of ProLong Gold antifade reagent mounting medium (Life Technologies) was added into the device.
Animal Studies
All animal experiments were approved by the Houston Methodist Research Institute Institutional Animal Care and Use Committee (IACUC). Eight-week-old male and female NSG mice (Jackson Laboratory) weighing 18–20 g were used. To establish the in vivo tumor model, CD19-positive Daudi cells were transduced with the lentiviral vector encoding FFLuc, as previously described.17 Kappa-positive cells of FFLuc-Daudi were sorted using a fluorescence-activated cell sorting (FACS) Aria II cell sorter (BD Biosciences) by mlgG1 anti-human Kappa (SB81a) biotinylated-Alexa 568 and were designated as FFLuc-Daudi cells. The NSG mice were i.v. injected with 1 × 10⁶ FFLuc-Daudi cells in 150 μL of PBS via tail vein to establish a human lymphoma xenograft model (n = 6). Beginning on day 1, the mice were injected (i.v.) with 1 × 10⁷ CAR-modified effector cells, including CD28-CAR NK-92 and 4-1BB-CAR NK*-92, in 150 μL of PBS at days 1, 4, and 7. Isoflurane-anesthetized animals were imaged using the IVIS system (IVIS-200, PerkinElmer, Waltham, MA, USA) 10 min after 150 mg/kg D-luciferin (Gold Biotechnology, St. Louis, MO, USA) per mouse administered intraperitoneally (i.p.). The photons emitted from the luciferase-expressing tumor cells were quantified using Living Image software 64 (Caliper Life Sciences, Hopkinton, MA, USA). A pseudo-color image representing light intensity (blue least intense and red most intense) was generated and superimposed over the grayscale reference image. A constant region of interest (ROI) was drawn over the whole animal, excluding the tail, and the intensity of the signal was measured as total photons per second. After effector NK-92 cell injections, animals were imaged twice or three times a week for tumor cell tracking at the preclinical imaging core of the Houston Methodist Research Institute. TGI was determined as indicated by the formula64 %TGI = (1 − [Tt/T0 / Ct/C0] / 1 − [C0/Ct]) × 100, where Tt is the median tumor volume of treated at time t, T0 is the median tumor volume of treated at time 0, Ct is the median tumor volume of control at time t, and C0 is the median tumor volume of control at time 0.
Statistical Analysis
Unpaired or paired two-tailed t tests were performed using the Prism software (GraphPad Software, La Jolla, CA, USA). The correlation between quality of IS and anti-tumor activity was analyzed by a linear regression correlation analysis (GraphPad).
Author Contributions
D.L. and W.X. designed the research. D.L., W.X., Y.C., X.K., Z.C., P.Z., Y.-H.H., and J.H.J. performed the experiments. D.L., W.X., G.D., and H.L. analyzed the data. D.L. and W.X. wrote the paper.
Conflicts of Interest
The authors report no conflicts of interests related to this work.
Acknowledgments
The authors thank Malcolm K. Brenner, Helen E. Heslop, Carlos A. Ramos, and Jordan S. Orange (Baylor College of Medicine) for helpful discussions and John M. Jerome, Nicole Weber, and Casey Schroeder for critical reading of the manuscript. This work was supported in part by HL125018 from NHLBI (to D.L.), AI124769 from NIAID (to D.L.), AI129594 from NIAID (to D.L.), AI130197 from NIAID (to D.L.), the Houston Methodist Career Cornerstone Award, the Houston Methodist Research Institute for Academic Medicine NIH Competitiveness Initiative Award, the Baylor-UT Houston Center for AIDS Research Core Support Grant (AI036211) from the National Institute of Allergy and Infectious Diseases, the Caroline Wiess Law Fund for Research in Molecular Medicine, the Texas Children’s Hospital Pediatric Pilot Research Fund, the Lymphoma SPORE Developmental Research Program from Baylor College of Medicine and the Methodist Research Institute (P50 CA126752), and Celgene research funding.
Footnotes
Supplemental Information includes ten figures and can be found with this article on line at https://doi.org/10.1016/j.ymthe.2018.01.020.
Supplemental Information
References
- 1.Anurathapan U., Leen A.M., Brenner M.K., Vera J.F. Engineered T cells for cancer treatment. Cytotherapy. 2014;16:713–733. doi: 10.1016/j.jcyt.2013.10.002. [DOI] [PMC free article] [PubMed] [Google Scholar]
- 2.Dotti G., Gottschalk S., Savoldo B., Brenner M.K. Design and development of therapies using chimeric antigen receptor-expressing T cells. Immunol. Rev. 2014;257:107–126. doi: 10.1111/imr.12131. [DOI] [PMC free article] [PubMed] [Google Scholar]
- 3.Fooksman D.R., Vardhana S., Vasiliver-Shamis G., Liese J., Blair D.A., Waite J., Sacristán C., Victora G.D., Zanin-Zhorov A., Dustin M.L. Functional anatomy of T cell activation and synapse formation. Annu. Rev. Immunol. 2010;28:79–105. doi: 10.1146/annurev-immunol-030409-101308. [DOI] [PMC free article] [PubMed] [Google Scholar]
- 4.Monks C.R., Freiberg B.A., Kupfer H., Sciaky N., Kupfer A. Three-dimensional segregation of supramolecular activation clusters in T cells. Nature. 1998;395:82–86. doi: 10.1038/25764. [DOI] [PubMed] [Google Scholar]
- 5.Tözeren A., Sung K.L., Sung L.A., Dustin M.L., Chan P.Y., Springer T.A., Chien S. Micromanipulation of adhesion of a Jurkat cell to a planar bilayer membrane containing lymphocyte function-associated antigen 3 molecules. J. Cell Biol. 1992;116:997–1006. doi: 10.1083/jcb.116.4.997. [DOI] [PMC free article] [PubMed] [Google Scholar]
- 6.Mossman K.D., Campi G., Groves J.T., Dustin M.L. Altered TCR signaling from geometrically repatterned immunological synapses. Science. 2005;310:1191–1193. doi: 10.1126/science.1119238. [DOI] [PubMed] [Google Scholar]
- 7.Lee K.H., Dinner A.R., Tu C., Campi G., Raychaudhuri S., Varma R., Sims T.N., Burack W.R., Wu H., Wang J. The immunological synapse balances T cell receptor signaling and degradation. Science. 2003;302:1218–1222. doi: 10.1126/science.1086507. [DOI] [PubMed] [Google Scholar]
- 8.Lee K.H., Holdorf A.D., Dustin M.L., Chan A.C., Allen P.M., Shaw A.S. T cell receptor signaling precedes immunological synapse formation. Science. 2002;295:1539–1542. doi: 10.1126/science.1067710. [DOI] [PubMed] [Google Scholar]
- 9.Grakoui A., Bromley S.K., Sumen C., Davis M.M., Shaw A.S., Allen P.M., Dustin M.L. The immunological synapse: a molecular machine controlling T cell activation. Science. 1999;285:221–227. doi: 10.1126/science.285.5425.221. [DOI] [PubMed] [Google Scholar]
- 10.Zheng P., Bertolet G., Chen Y., Huang S., Liu D. Super-resolution imaging of the natural killer cell immunological synapse on a glass-supported planar lipid bilayer. J. Vis. Exp. 2015;96:52502. doi: 10.3791/52502. [DOI] [PMC free article] [PubMed] [Google Scholar]
- 11.Dustin M.L., Starr T., Varma R., Thomas V.K. Supported planar bilayers for study of the immunological synapse. Curr. Protoc. Immunol. 2007;76:18.13.1–18.13.35. doi: 10.1002/0471142735.im1813s76. [DOI] [PubMed] [Google Scholar]
- 12.Choudhuri K., Llodrá J., Roth E.W., Tsai J., Gordo S., Wucherpfennig K.W., Kam L.C., Stokes D.L., Dustin M.L. Polarized release of T-cell-receptor-enriched microvesicles at the immunological synapse. Nature. 2014;507:118–123. doi: 10.1038/nature12951. [DOI] [PMC free article] [PubMed] [Google Scholar]
- 13.Bertolet G., Liu D. The planar lipid bilayer system serves as a reductionist approach for studying NK cell immunological synapses and their functions. Methods Mol. Biol. 2016;1441:151–165. doi: 10.1007/978-1-4939-3684-7_13. [DOI] [PMC free article] [PubMed] [Google Scholar]
- 14.Jang J.H., Huang Y., Zheng P., Jo M.C., Bertolet G., Zhu M.X., Qin L., Liu D. Imaging of cell-cell communication in a vertical orientation reveals high-resolution structure of immunological synapse and novel PD-1 dynamics. J. Immunol. 2015;195:1320–1330. doi: 10.4049/jimmunol.1403143. [DOI] [PMC free article] [PubMed] [Google Scholar]
- 15.Loskog A., Giandomenico V., Rossig C., Pule M., Dotti G., Brenner M.K. Addition of the CD28 signaling domain to chimeric T-cell receptors enhances chimeric T-cell resistance to T regulatory cells. Leukemia. 2006;20:1819–1828. doi: 10.1038/sj.leu.2404366. [DOI] [PubMed] [Google Scholar]
- 16.Hoyos V., Savoldo B., Quintarelli C., Mahendravada A., Zhang M., Vera J., Heslop H.E., Rooney C.M., Brenner M.K., Dotti G. Engineering CD19-specific T lymphocytes with interleukin-15 and a suicide gene to enhance their anti-lymphoma/leukemia effects and safety. Leukemia. 2010;24:1160–1170. doi: 10.1038/leu.2010.75. [DOI] [PMC free article] [PubMed] [Google Scholar]
- 17.Vera J., Savoldo B., Vigouroux S., Biagi E., Pule M., Rossig C., Wu J., Heslop H.E., Rooney C.M., Brenner M.K., Dotti G. T lymphocytes redirected against the kappa light chain of human immunoglobulin efficiently kill mature B lymphocyte-derived malignant cells. Blood. 2006;108:3890–3897. doi: 10.1182/blood-2006-04-017061. [DOI] [PMC free article] [PubMed] [Google Scholar]
- 18.Harwood N.E., Batista F.D. Early events in B cell activation. Annu. Rev. Immunol. 2010;28:185–210. doi: 10.1146/annurev-immunol-030409-101216. [DOI] [PubMed] [Google Scholar]
- 19.Comrie W.A., Burkhardt J.K. Action and traction: cytoskeletal control of receptor triggering at the immunological synapse. Front. Immunol. 2016;7:68. doi: 10.3389/fimmu.2016.00068. [DOI] [PMC free article] [PubMed] [Google Scholar]
- 20.Dustin M.L., Depoil D. New insights into the T cell synapse from single molecule techniques. Nat. Rev. Immunol. 2011;11:672–684. doi: 10.1038/nri3066. [DOI] [PMC free article] [PubMed] [Google Scholar]
- 21.Dustin M.L. Insights into function of the immunological synapse from studies with supported planar bilayers. Curr. Top. Microbiol. Immunol. 2010;340:1–24. doi: 10.1007/978-3-642-03858-7_1. [DOI] [PubMed] [Google Scholar]
- 22.Dotti G., Savoldo B., Brenner M. Fifteen years of gene therapy based on chimeric antigen receptors: “are we nearly there yet?”. Hum. Gene Ther. 2009;20:1229–1239. doi: 10.1089/hum.2009.142. [DOI] [PMC free article] [PubMed] [Google Scholar]
- 23.Ramos C.A., Savoldo B., Dotti G. CD19-CAR trials. Cancer J. 2014;20:112–118. doi: 10.1097/PPO.0000000000000031. [DOI] [PMC free article] [PubMed] [Google Scholar]
- 24.Clements J.L., Boerth N.J., Lee J.R., Koretzky G.A. Integration of T cell receptor-dependent signaling pathways by adapter proteins. Annu. Rev. Immunol. 1999;17:89–108. doi: 10.1146/annurev.immunol.17.1.89. [DOI] [PubMed] [Google Scholar]
- 25.Germain R.N., Stefanová I. The dynamics of T cell receptor signaling: complex orchestration and the key roles of tempo and cooperation. Annu. Rev. Immunol. 1999;17:467–522. doi: 10.1146/annurev.immunol.17.1.467. [DOI] [PubMed] [Google Scholar]
- 26.Dustin M.L., Chakraborty A.K., Shaw A.S. Understanding the structure and function of the immunological synapse. Cold Spring Harb. Perspect. Biol. 2010;2:a002311. doi: 10.1101/cshperspect.a002311. [DOI] [PMC free article] [PubMed] [Google Scholar]
- 27.Pulè M.A., Straathof K.C., Dotti G., Heslop H.E., Rooney C.M., Brenner M.K. A chimeric T cell antigen receptor that augments cytokine release and supports clonal expansion of primary human T cells. Mol. Ther. 2005;12:933–941. doi: 10.1016/j.ymthe.2005.04.016. [DOI] [PubMed] [Google Scholar]
- 28.Zhong X.S., Matsushita M., Plotkin J., Riviere I., Sadelain M. Chimeric antigen receptors combining 4-1BB and CD28 signaling domains augment PI3kinase/AKT/Bcl-XL activation and CD8+ T cell-mediated tumor eradication. Mol. Ther. 2010;18:413–420. doi: 10.1038/mt.2009.210. [DOI] [PMC free article] [PubMed] [Google Scholar]
- 29.Bachmann M.F., Oxenius A. Interleukin 2: from immunostimulation to immunoregulation and back again. EMBO Rep. 2007;8:1142–1148. doi: 10.1038/sj.embor.7401099. [DOI] [PMC free article] [PubMed] [Google Scholar]
- 30.Liao W., Lin J.X., Leonard W.J. Interleukin-2 at the crossroads of effector responses, tolerance, and immunotherapy. Immunity. 2013;38:13–25. doi: 10.1016/j.immuni.2013.01.004. [DOI] [PMC free article] [PubMed] [Google Scholar]
- 31.Jena B., Dotti G., Cooper L.J. Redirecting T-cell specificity by introducing a tumor-specific chimeric antigen receptor. Blood. 2010;116:1035–1044. doi: 10.1182/blood-2010-01-043737. [DOI] [PMC free article] [PubMed] [Google Scholar]
- 32.Liu D., Tian S., Zhang K., Xiong W., Lubaki N.M., Chen Z., Han W. Chimeric antigen receptor (CAR)-modified natural killer cell-based immunotherapy and immunological synapse formation in cancer and HIV. Protein Cell. 2017;8:861–877. doi: 10.1007/s13238-017-0415-5. [DOI] [PMC free article] [PubMed] [Google Scholar]
- 33.DeWeerdt S. Bacteriology: a caring culture. Nature. 2013;504:S4–S5. doi: 10.1038/504S4a. [DOI] [PubMed] [Google Scholar]
- 34.Wang M., Yin B., Wang H.Y., Wang R.F. Current advances in T-cell-based cancer immunotherapy. Immunotherapy. 2014;6:1265–1278. doi: 10.2217/imt.14.86. [DOI] [PMC free article] [PubMed] [Google Scholar]
- 35.Ertl H.C., Zaia J., Rosenberg S.A., June C.H., Dotti G., Kahn J., Cooper L.J., Corrigan-Curay J., Strome S.E. Considerations for the clinical application of chimeric antigen receptor T cells: observations from a recombinant DNA Advisory Committee Symposium held June 15, 2010. Cancer Res. 2011;71:3175–3181. doi: 10.1158/0008-5472.CAN-10-4035. [DOI] [PMC free article] [PubMed] [Google Scholar]
- 36.Hinrichs C.S., Rosenberg S.A. Exploiting the curative potential of adoptive T-cell therapy for cancer. Immunol. Rev. 2014;257:56–71. doi: 10.1111/imr.12132. [DOI] [PMC free article] [PubMed] [Google Scholar]
- 37.Kochenderfer J.N., Rosenberg S.A. Treating B-cell cancer with T cells expressing anti-CD19 chimeric antigen receptors. Nat. Rev. Clin. Oncol. 2013;10:267–276. doi: 10.1038/nrclinonc.2013.46. [DOI] [PMC free article] [PubMed] [Google Scholar]
- 38.Park T.S., Rosenberg S.A., Morgan R.A. Treating cancer with genetically engineered T cells. Trends Biotechnol. 2011;29:550–557. doi: 10.1016/j.tibtech.2011.04.009. [DOI] [PMC free article] [PubMed] [Google Scholar]
- 39.Restifo N.P., Dudley M.E., Rosenberg S.A. Adoptive immunotherapy for cancer: harnessing the T cell response. Nat. Rev. Immunol. 2012;12:269–281. doi: 10.1038/nri3191. [DOI] [PMC free article] [PubMed] [Google Scholar]
- 40.Vera J.F., Brenner M.K., Dotti G. Immunotherapy of human cancers using gene modified T lymphocytes. Curr. Gene Ther. 2009;9:396–408. doi: 10.2174/156652309789753338. [DOI] [PMC free article] [PubMed] [Google Scholar]
- 41.Springer T.A., Dustin M.L. Integrin inside-out signaling and the immunological synapse. Curr. Opin. Cell Biol. 2012;24:107–115. doi: 10.1016/j.ceb.2011.10.004. [DOI] [PMC free article] [PubMed] [Google Scholar]
- 42.Das V., Nal B., Roumier A., Meas-Yedid V., Zimmer C., Olivo-Marin J.C., Roux P., Ferrier P., Dautry-Varsat A., Alcover A. Membrane-cytoskeleton interactions during the formation of the immunological synapse and subsequent T-cell activation. Immunol. Rev. 2002;189:123–135. doi: 10.1034/j.1600-065x.2002.18911.x. [DOI] [PubMed] [Google Scholar]
- 43.Dillon C., Goda Y. The actin cytoskeleton: integrating form and function at the synapse. Annu. Rev. Neurosci. 2005;28:25–55. doi: 10.1146/annurev.neuro.28.061604.135757. [DOI] [PubMed] [Google Scholar]
- 44.Dustin M.L., Cooper J.A. The immunological synapse and the actin cytoskeleton: molecular hardware for T cell signaling. Nat. Immunol. 2000;1:23–29. doi: 10.1038/76877. [DOI] [PubMed] [Google Scholar]
- 45.Lagrue K., Carisey A., Oszmiana A., Kennedy P.R., Williamson D.J., Cartwright A., Barthen C., Davis D.M. The central role of the cytoskeleton in mechanisms and functions of the NK cell immune synapse. Immunol. Rev. 2013;256:203–221. doi: 10.1111/imr.12107. [DOI] [PubMed] [Google Scholar]
- 46.Ritter A.T., Angus K.L., Griffiths G.M. The role of the cytoskeleton at the immunological synapse. Immunol. Rev. 2013;256:107–117. doi: 10.1111/imr.12117. [DOI] [PMC free article] [PubMed] [Google Scholar]
- 47.Alarcón B., Mestre D., Martínez-Martín N. The immunological synapse: a cause or consequence of T-cell receptor triggering? Immunology. 2011;133:420–425. doi: 10.1111/j.1365-2567.2011.03458.x. [DOI] [PMC free article] [PubMed] [Google Scholar]
- 48.Yokosuka T., Saito T. Dynamic regulation of T-cell costimulation through TCR-CD28 microclusters. Immunol. Rev. 2009;229:27–40. doi: 10.1111/j.1600-065X.2009.00779.x. [DOI] [PubMed] [Google Scholar]
- 49.Babich A., Burkhardt J.K. Coordinate control of cytoskeletal remodeling and calcium mobilization during T-cell activation. Immunol. Rev. 2013;256:80–94. doi: 10.1111/imr.12123. [DOI] [PMC free article] [PubMed] [Google Scholar]
- 50.Dustin M.L., Long E.O. Cytotoxic immunological synapses. Immunol. Rev. 2010;235:24–34. doi: 10.1111/j.0105-2896.2010.00904.x. [DOI] [PMC free article] [PubMed] [Google Scholar]
- 51.Brown A.C., Oddos S., Dobbie I.M., Alakoskela J.M., Parton R.M., Eissmann P., Neil M.A., Dunsby C., French P.M., Davis I., Davis D.M. Remodelling of cortical actin where lytic granules dock at natural killer cell immune synapses revealed by super-resolution microscopy. PLoS Biol. 2011;9:e1001152. doi: 10.1371/journal.pbio.1001152. [DOI] [PMC free article] [PubMed] [Google Scholar]
- 52.Rak G.D., Mace E.M., Banerjee P.P., Svitkina T., Orange J.S. Natural killer cell lytic granule secretion occurs through a pervasive actin network at the immune synapse. PLoS Biol. 2011;9:e1001151. doi: 10.1371/journal.pbio.1001151. [DOI] [PMC free article] [PubMed] [Google Scholar]
- 53.Zhang H., Snyder K.M., Suhoski M.M., Maus M.V., Kapoor V., June C.H., Mackall C.L. 4-1BB is superior to CD28 costimulation for generating CD8+ cytotoxic lymphocytes for adoptive immunotherapy. J. Immunol. 2007;179:4910–4918. doi: 10.4049/jimmunol.179.7.4910. [DOI] [PMC free article] [PubMed] [Google Scholar]
- 54.Porter D.L., Hwang W.T., Frey N.V., Lacey S.F., Shaw P.A., Loren A.W., Bagg A., Marcucci K.T., Shen A., Gonzalez V. Chimeric antigen receptor T cells persist and induce sustained remissions in relapsed refractory chronic lymphocytic leukemia. Sci. Transl. Med. 2015;7:303ra139. doi: 10.1126/scitranslmed.aac5415. [DOI] [PMC free article] [PubMed] [Google Scholar]
- 55.Kowolik C.M., Topp M.S., Gonzalez S., Pfeiffer T., Olivares S., Gonzalez N., Smith D.D., Forman S.J., Jensen M.C., Cooper L.J. CD28 costimulation provided through a CD19-specific chimeric antigen receptor enhances in vivo persistence and antitumor efficacy of adoptively transferred T cells. Cancer Res. 2006;66:10995–11004. doi: 10.1158/0008-5472.CAN-06-0160. [DOI] [PubMed] [Google Scholar]
- 56.Brentjens R.J., Latouche J.B., Santos E., Marti F., Gong M.C., Lyddane C., King P.D., Larson S., Weiss M., Rivière I., Sadelain M. Eradication of systemic B-cell tumors by genetically targeted human T lymphocytes co-stimulated by CD80 and interleukin-15. Nat. Med. 2003;9:279–286. doi: 10.1038/nm827. [DOI] [PubMed] [Google Scholar]
- 57.Karimi M.A., Lee E., Bachmann M.H., Salicioni A.M., Behrens E.M., Kambayashi T., Baldwin C.L. Measuring cytotoxicity by bioluminescence imaging outperforms the standard chromium-51 release assay. PLoS ONE. 2014;9:e89357. doi: 10.1371/journal.pone.0089357. [DOI] [PMC free article] [PubMed] [Google Scholar]
- 58.Sadelain M., Brentjens R., Rivière I. The promise and potential pitfalls of chimeric antigen receptors. Curr. Opin. Immunol. 2009;21:215–223. doi: 10.1016/j.coi.2009.02.009. [DOI] [PMC free article] [PubMed] [Google Scholar]
- 59.Long A.H., Haso W.M., Shern J.F., Wanhainen K.M., Murgai M., Ingaramo M., Smith J.P., Walker A.J., Kohler M.E., Venkateshwara V.R. 4-1BB costimulation ameliorates T cell exhaustion induced by tonic signaling of chimeric antigen receptors. Nat. Med. 2015;21:581–590. doi: 10.1038/nm.3838. [DOI] [PMC free article] [PubMed] [Google Scholar]
- 60.Maude S.L., Frey N., Shaw P.A., Aplenc R., Barrett D.M., Bunin N.J., Chew A., Gonzalez V.E., Zheng Z., Lacey S.F. Chimeric antigen receptor T cells for sustained remissions in leukemia. N. Engl. J. Med. 2014;371:1507–1517. doi: 10.1056/NEJMoa1407222. [DOI] [PMC free article] [PubMed] [Google Scholar]
- 61.Davila M.L., Riviere I., Wang X., Bartido S., Park J., Curran K., Chung S.S., Stefanski J., Borquez-Ojeda O., Olszewska M. Efficacy and toxicity management of 19-28z CAR T cell therapy in B cell acute lymphoblastic leukemia. Sci. Transl. Med. 2014;6:224ra25. doi: 10.1126/scitranslmed.3008226. [DOI] [PMC free article] [PubMed] [Google Scholar]
- 62.Liu D., Bryceson Y.T., Meckel T., Vasiliver-Shamis G., Dustin M.L., Long E.O. Integrin-dependent organization and bidirectional vesicular traffic at cytotoxic immune synapses. Immunity. 2009;31:99–109. doi: 10.1016/j.immuni.2009.05.009. [DOI] [PMC free article] [PubMed] [Google Scholar]
- 63.Liu D., Peterson M.E., Long E.O. The adaptor protein Crk controls activation and inhibition of natural killer cells. Immunity. 2012;36:600–611. doi: 10.1016/j.immuni.2012.03.007. [DOI] [PMC free article] [PubMed] [Google Scholar]
- 64.Ji Q.S., Mulvihill M.J., Rosenfeld-Franklin M., Cooke A., Feng L., Mak G., O’Connor M., Yao Y., Pirritt C., Buck E. A novel, potent, and selective insulin-like growth factor-I receptor kinase inhibitor blocks insulin-like growth factor-I receptor signaling in vitro and inhibits insulin-like growth factor-I receptor dependent tumor growth in vivo. Mol. Cancer Ther. 2007;6:2158–2167. doi: 10.1158/1535-7163.MCT-07-0070. [DOI] [PubMed] [Google Scholar]
Associated Data
This section collects any data citations, data availability statements, or supplementary materials included in this article.