Abstract
Mammalian genomes are spatially organized by CCCTC-binding factor (CTCF) and cohesin into chromatin loops1,2 and topologically associated domains (TADs3–6), which have important roles in gene regulation1,2,4,5,7 and recombination7–9. By binding to specific sequences10, CTCF defines contact points for cohesin-mediated long-range chromosomal cis-interactions1,2,4–7,11. Cohesin is also present at these sites12,13, but has been proposed to be loaded onto DNA elsewhere14,15 and to extrude chromatin loops until it encounters CTCF bound to DNA16–19. How cohesin is recruited to CTCF sites, according to this or other models, is unknown. Here we show that the distribution of cohesin in the mouse genome depends on transcription, CTCF and the cohesin release-factor Wapl. In CTCF-depleted fibroblasts, cohesin cannot be properly recruited to CTCF sites but instead accumulates at transcription start sites (TSSs) of active genes, where the cohesin loading complex is located14,15. In the absence of both CTCF and Wapl, cohesin accumulates in up to 70 kb-long regions at 3’-ends of active genes, in particular if these converge on each other. Changing gene expression modulates the position of these “cohesin islands”. These findings indicate that transcription can re-locate mammalian cohesin over long distances on DNA, as previously reported for yeast cohesin20–23, that this translocation contributes to positioning cohesin at CTCF sites, and that active genes can be freed from cohesin either by transcription-mediated translocation or by Wapl-mediated release.
Keywords: Cohesin movement, cohesin island, genome architecture, transcription, CTCF, Wapl, Nipbl
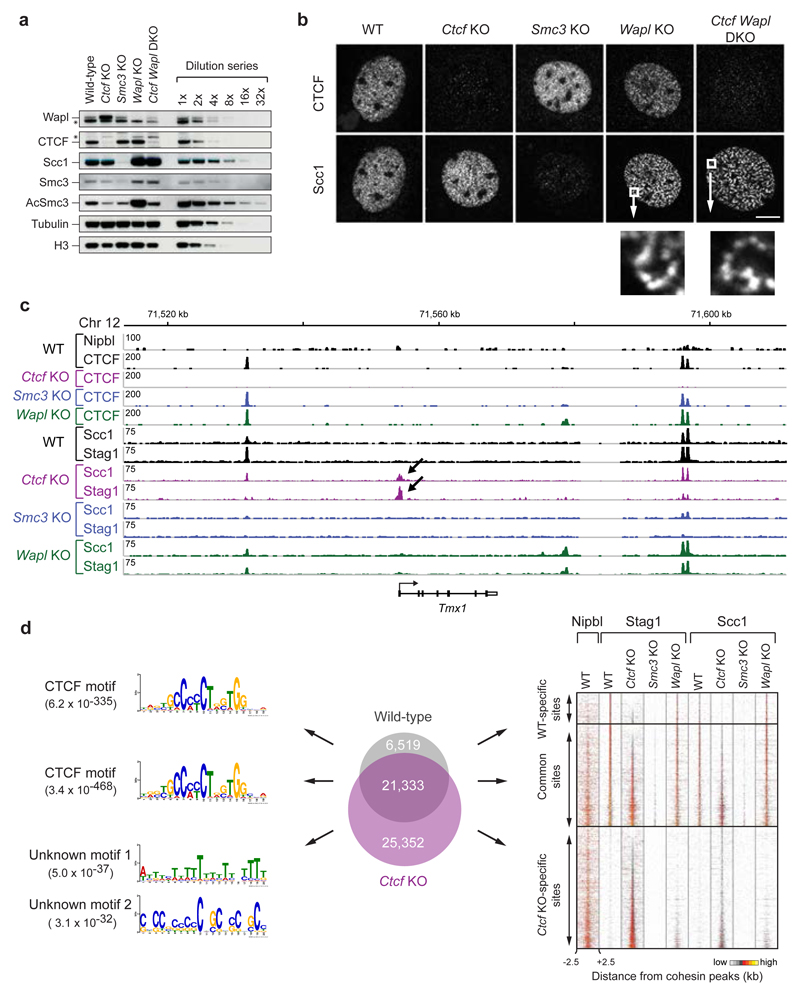
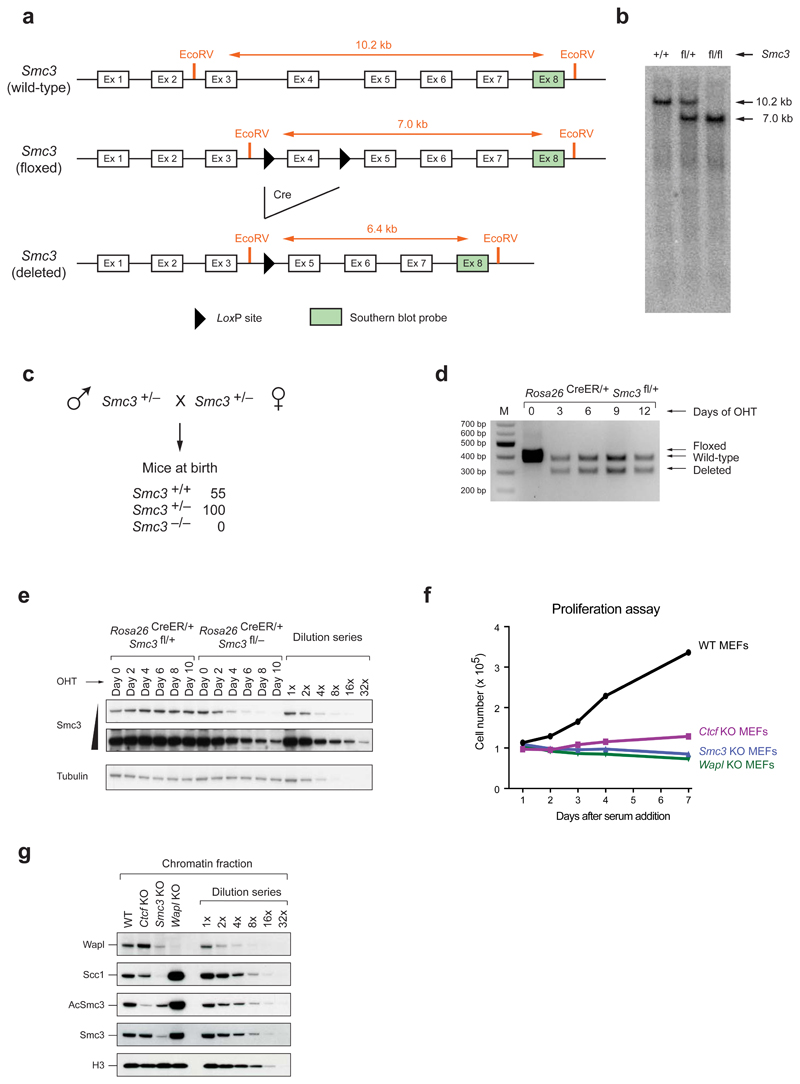
To address if, as proposed12,13, the genomic distribution of cohesin depends on CTCF, we performed cohesin chromatin immunoprecipitation-sequencing (ChIP-Seq) experiments using primary mouse embryonic fibroblasts (MEFs), in which Ctcf gene deletion could be induced by Cre recombinase24. For comparison, we analyzed MEFs depleted of Wapl25 or the cohesin subunit Smc3 (Extended Data Fig. 1a-e). To avoid cell cycle effects caused by CTCF, Wapl and Smc3 depletion25 (Extended Data Fig. 1f), MEFs were arrested in a quiescent state by serum starvation before Cre expression. Immunoblotting (Fig. 1a; Extended Data Fig. 1g) and immunofluorescence microscopy (Fig. 1b) revealed that most CTCF, Wapl and Smc3 were depleted ten days after Cre expression and confirmed that Wapl depletion caused cohesin localization in axial structures (“vermicelli”), which have been proposed to form the base of chromatin loops25.
Figure 1. Cohesin distribution in wild-type, Ctcf, Smc3 and Wapl knockout MEFs.
a, Immunoblot analysis of whole cell extracts of quiescent knockout MEFs including dilution series of wild-type sample. b, Fluorescence microscopy with Scc1 and CTCF antibodies. Size bar, 10 μm. Below: higher magnification of Scc1 staining. c, Binding of CTCF, Nipbl, Stag1 and Scc1 at the Tmx1 locus, as determined by ChIP-seq. d, Analysis of cohesin-binding site distribution in wild-type and Ctcf KO cells (Venn diagram). Left: DNA-binding motif prediction with indicated E-value. Right: heat maps of cohesin and Nipbl binding in different KO cells (sorted according to Stag1 binding in Ctcf KO cells).
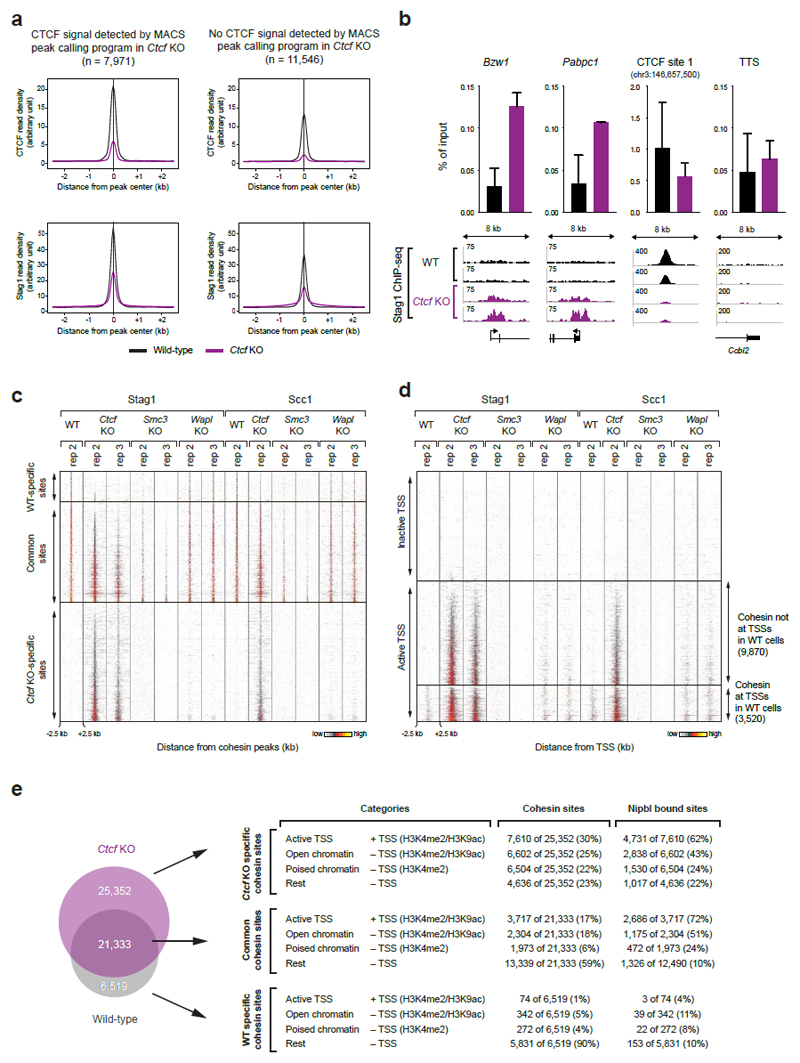
In wild-type MEFs, ChIP-seq experiments with antibodies to the cohesin subunits Scc1 and Stag1 identified 28,335 cohesin sites (Fig. 1c; Extended Data Fig. 2; Supplementary Table 1). Most of these (91.1%) were also bound by CTCF and contained the CTCF-binding site consensus, as found by de novo sequence motif prediction (Fig. 1d, left). However, in CTCF-depleted cells, cohesin became undetectable at 6,519 of these sites, was reduced at many others (Extended Data Fig. 3a), and instead was identified at 25,352 sites, which were absent in wild-type cells (Fig. 1d, middle and right). ChIP-quantitative polymerase chain reaction (ChIP-qPCR) experiments confirmed these observations (Extended Data Fig. 3b). Among the Ctcf “knockout” (KO)-specific cohesin sites, only uncharacterized sequence motifs were enriched with low significance, but not the CTCF motif (Fig. 1d, left). The Ctcf KO-specific cohesin sites were not detectable in cells depleted of Smc3, ruling out ChIP artifacts, and were also largely absent in cells lacking Wapl (Fig. 1d, right; Extended Data Fig. 3c).
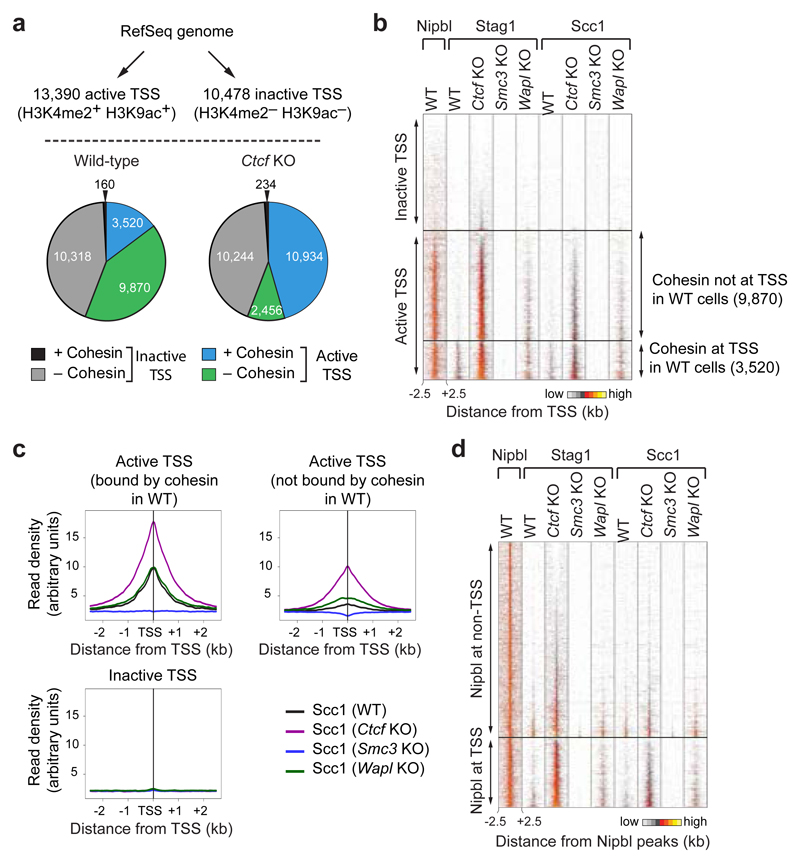
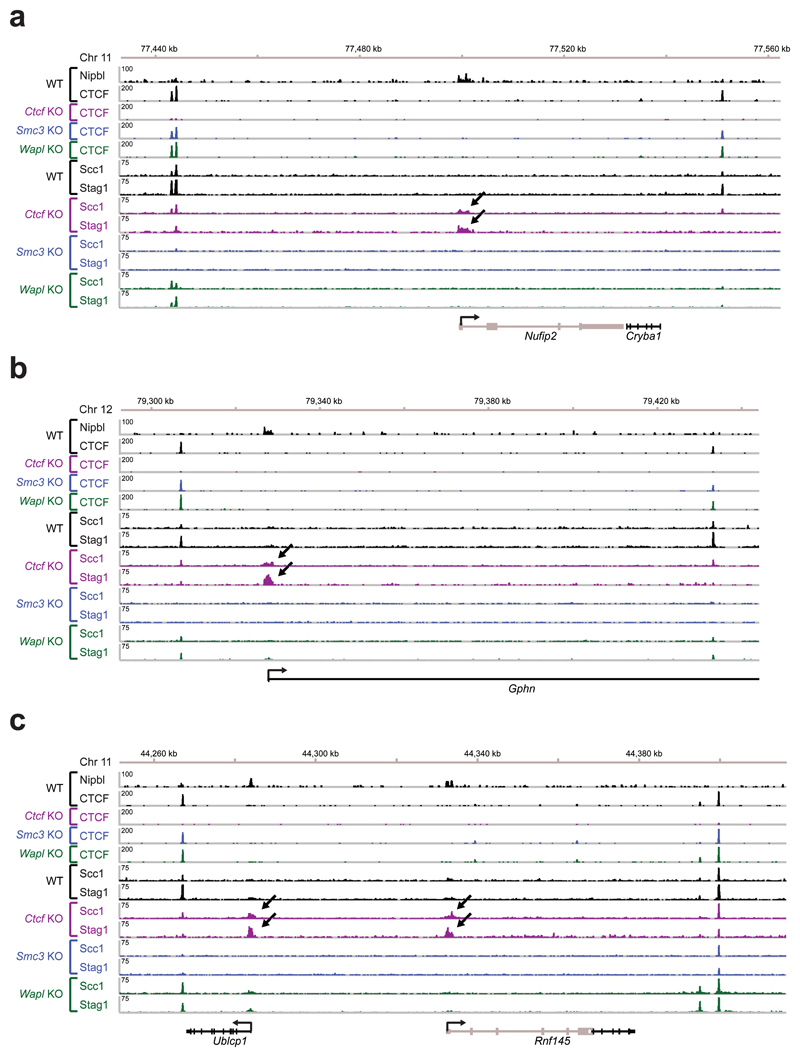
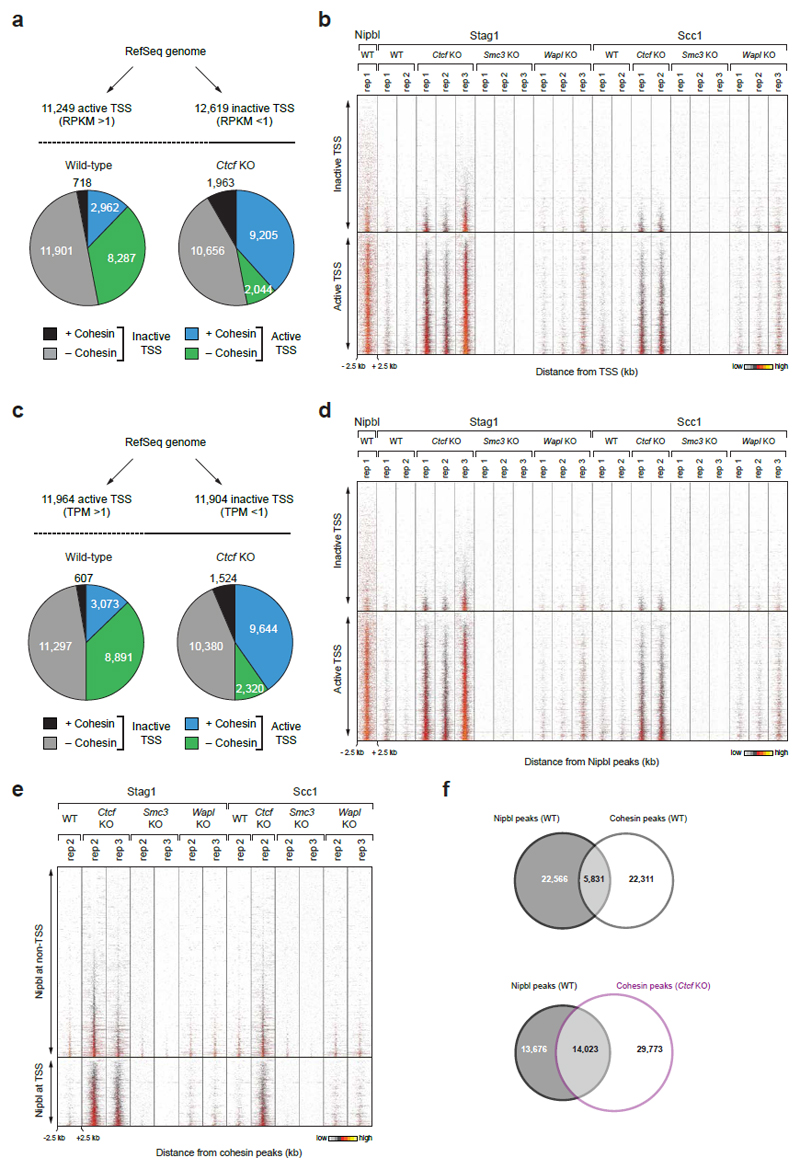
Many Ctcf KO-specific sites (30.0%; 7,610 sites) were located at transcription start sites (TSSs; Fig. 1c, CTCF KO-specific cohesin sites are indicated with arrows; Extended Data Figs. 2 and 3b). As judged by the co-occurrence of histone H3 di-methylated on lysine 4 (H3K4me2) and of H3 acetylated on lysine 9 (H3K9ac)26, wild-type MEFs contained 13,390 active and 10,478 inactive TSSs (Fig. 2a). In wild-type cells, only 3,520 (26.3%) of these were occupied by cohesin, but in CTCF-depleted cells most active TSSs (10,934; 81.7%) contained cohesin. Analyses of cohesin-binding sites by aligning cohesin ChIP-seq reads in “heat” maps (Fig. 2b, Extended Data Fig. 3d) and density profile plots (Fig. 2c) indicated that in Ctcf KO MEFs cohesin binding was also further increased at active TSSs, at which cohesin could already be detected in wild-type MEFs. In contrast, only few inactive TSSs were occupied by cohesin in either wild-type or Ctcf KO cells (160 and 234, respectively; Fig. 2a). Similar results were obtained when we identified TSS activity not by the presence of histone “marks” but by analyzing transcript levels by RNA-sequencing (RNA-seq; Extended Data Fig. 4a,b) or by measuring the transcription strength of the TSS-associated gene by “global run-on”-sequencing (GRO-seq) experiments (Extended Data Fig. 4c,d). CTCF depletion therefore decreases cohesin levels at CTCF sites and increases cohesin at other sites, many of which are active TSSs. This scenario is reminiscent of the situation in Drosophila, where cohesin does not associate with CTCF, but instead co-localizes with Nipbl at active genes27.
Figure 2. Cohesin redistribution to transcriptional start sites in Ctcf KO MEFs.
a, Cohesin binding at active (H3K4me2+ H3K9ac+) and inactive (H3K4me2– H3K9ac–) TSSs. Pie charts indicate cohesin binding at all annotated TSSs in wild-type and Ctcf KO cells. b, Density heat map of Stag1, Scc1 and Nipbl binding at active and inactive TSSs, data sorted by Stag1 binding in Ctcf KO MEFs. Active TSSs were subdivided based on cohesin binding in wild-type cells (right). c, Density profiles of Scc1 binding at active TSSs, subdivided as in b, and at inactive TSSs in MEFs of the indicated genotypes. d, Density heat map of Nipbl, Stag1 and Scc1 binding at Nipbl sites, which are grouped by TSS localization. Reads sorted according to Stag1 binding in Ctcf KO cells.
To test if the Ctcf KO-specific cohesin sites could be regions at which cohesin is loaded onto DNA, we analyzed the distribution of the Nipbl subunit of the cohesin-loading complex by ChIP-seq. We identified 28,830 sites in immortalized wild-type MEFs (Supplementary Table 1). As reported for mouse embryonic stem cells14 and HeLa cells15, many Nipbl sites (26.4 %) were located at TSSs (Fig. 2d, Extended Data Fig. 4d), corresponding to 61.7% of all active TSSs (Fig. 2b). Interestingly, of all Nipbl sites only 20.5% (5,831 sites) co-localized with cohesin in wild-type cells, whereas 50.6% (14,023 sites) overlapped with cohesin sites found in Ctcf KO cells (Extended Data Fig. 4f), in particular at active TSSs (Fig. 2b,d). In most cases, changes in cohesin abundance at active promoters did not correlate with changes in gene expression (Extended Data Fig. 5). The accumulation of cohesin at TSSs in CTCF-depleted cells may therefore not reflect a gene-regulatory function of cohesin, but may reveal where cohesin is normally loaded onto DNA by Nipbl. According to this hypothesis, cohesin would be translocated away from loading sites and accumulate at CTCF sites in wild-type cells, but fail to do so in the absence of CTCF.
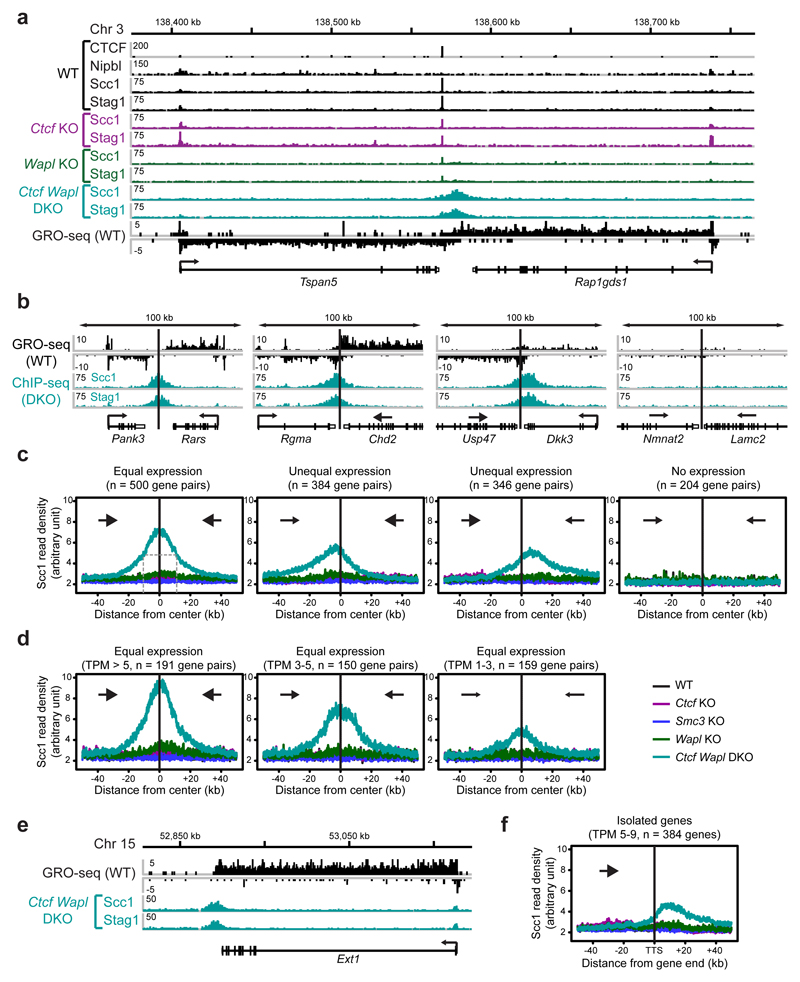
Because the genomic localization of cohesin is also altered to some extent in Wapl KO cells25 (Extended Data Fig. 6), we also analyzed the distribution of cohesin in Ctcf Wapl “double knockout” (DKO) MEFs (Fig. 1a,b). As in Wapl KO cells25, cohesin accumulated in axial structures (“vermicelli”) in Ctcf Wapl DKO cells (Fig. 1b), but unexpectedly ChIP-seq experiments revealed that the genomic localization of cohesin in these cells was very different (Fig. 3a; Extended Data Fig. 7). Unlike in Ctcf KO MEFs, cohesin did not accumulate at the majority of active TSSs in Ctcf Wapl DKO cells (Fig. 3a; Extended Data Fig. 7). This difference could not be explained by changes in transcriptional activities, as determined by GRO-seq (Extended Data Fig. 8a). Overall, Ctcf Wapl DKO cells contained fewer canonical cohesin-binding sites (14,174 sites, 400-1000 bp in length) compared to Ctcf KO (46,914 sites), Wapl KO (31,601 sites) and wild-type MEFs (28,334 sites; Supplementary Table 1), and these sites had a lower cohesin ChIP-seq read density (Extended Data Fig. 8b). Instead, Ctcf Wapl DKO cells contained much larger cohesin-bound areas, up to 70 kb in length. Because of their characteristic shape, we call these areas “cohesin islands”. All of these were located “downstream” of genes which are actively transcribed, as measured by GRO-seq. Interestingly, many cohesin islands were located at 3’-ends of convergently transcribed genes (Fig. 3a; 347 with cohesin islands > 5 kb; Extended Data Fig. 7), reminiscent of the situation in yeast20,21,23. These observations indicate that CTCF and Wapl are important determinants of cohesin’s distribution in the mouse genome, and indicate that transcription contributes to positioning cohesin.
Figure 3. Cohesin accumulation at sites of convergent transcription in Ctcf Wapl DKO MEFs.
a, Cohesin accumulation in the 3’ region of Tspan5 and Rap1gds1. Binding of CTCF, Nipbl, Stag1 and Scc1 was determined by ChIP-seq, and the transcriptional activity was measured by GRO-seq in wild-type MEFs. b, c, Cohesin island formation in Ctcf Wapl DKO cells at convergent gene pairs with different transcriptional activity. Individual example (b) and Scc1 density plots (c) for each category is shown. d, Density profiles of Scc1 binding for equally transcribed gene pairs with different transcriptional activity (TPM > 5, 3-5 and 1-3). e, Presence of cohesin islands at the actively transcribed isolated Ext1 gene. f, Scc1-binding profile for all isolated transcribed genes (TPM 5-9).
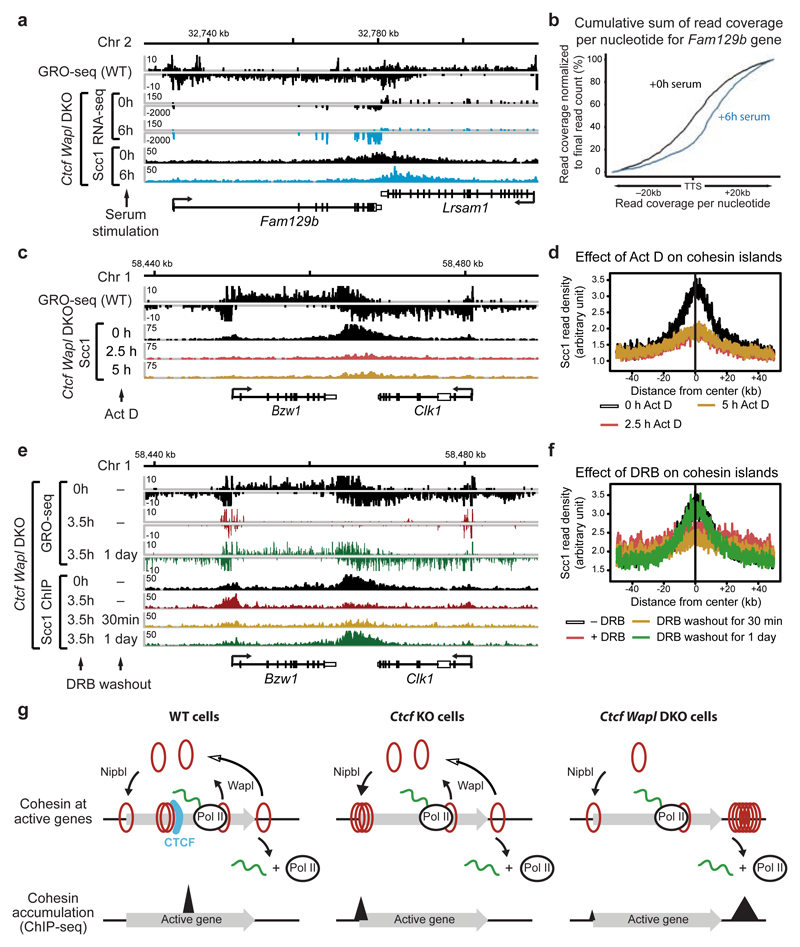
To test the latter hypothesis, we analyzed the correlations between cohesin islands and gene activity. We identified 1,434 convergent gene pairs in which 3’-ends were not further apart than 40 kb and classified them by GRO-seq analysis according to expression levels (Fig. 3b,c). If the converging genes were transcribed similarly strongly, the cohesin islands were symmetrically shaped and equidistant to both 3’-ends (Fig. 3b,c, left). However, at loci where transcript abundance between the converging genes differed > 3-fold, cohesin islands were positioned and shaped asymmetrically, as if transcription of the more active gene had pushed cohesin into the more weakly expressed gene (Fig. 3b,c, middle). Also at symmetrically expressed loci, ChIP-seq read densities in the cohesin islands correlated with gene expression levels (Fig. 3d), whereas no cohesin islands were observed between untranscribed convergent genes (Fig. 3b,c, right). Additionally, cohesin islands were present at some highly expressed isolated genes (Fig. 3e,f, Extended Data Fig. 8c; 229 cohesin islands > 5 kb were found at genes > 15 kb in length). Interestingly, when we used similar bioinformatic approaches to reanalyze the distribution of cohesin in Wapl-depleted cells, cohesin islands could also be observed in these, although to a much lesser extent than in Ctcf Wapl DKO cells (Extended Data Fig. 8d,e). To test experimentally if cohesin islands are generated by transcription, we induced gene expression changes in serum-starved Ctcf Wapl DKO cells by addition of 20% fetal bovine serum, analyzed cohesin distribution by ChIP-seq and transcription by RNA-seq, and compared the position of cohesin islands. At at least 37 loci, these were shifted in position, in 26 cases in a manner that correlated with gene expression changes (Extended Data Fig. 9). For example, serum had opposing effects on the convergently transcribed genes Fam129b and Lrsam1, with their mRNA being 3-fold increased and 2.5-fold reduced, respectively (Fig 4a), and shifted the cohesin island towards Lrsam1, i.e. away from the upregulated and towards the downregulated gene (Fig. 4a,b). We also analyzed cohesin distribution in Ctcf Wapl DKO cells treated for 2.5 or 5 hours with 5 μg/ml actinomycin D, a DNA-intercalating agent that irreversibly blocks transcription. This treatment rapidly reduced cohesin accumulation in both islands and at canonical binding sites (Fig. 4c,d; Extended Data Fig. 10a,c). Similar but not identical results were obtained in Ctcf Wapl DKO cells treated with 5,6-dichloro-1-β-D-ribofuranosylbenzimidazole (DRB), a reversible inhibitor of transcriptional elongation. DRB also caused a rapid reduction of cohesin in islands, which was reversed after removal of DRB. Additionally, DRB led to a reversible increase of cohesin at TSSs (Fig. 4e,f; Extended Data Fig. 10b,d). Because intercalation of DNA by actinomycin D prevents RNA polymerase II (RNAPII) binding, whereas DRB stalls RNAPII at promoters, RNAPII-cohesin interactions28 may promote cohesin accumulation at these sites.
Figure 4. Transcription is required for the generation of cohesin islands.
a, Binding of Scc1 and mRNA profiling in DKO cells upon serum stimulation at the Fam129b/Lrsam1 gene pair. b, Shift in cohesin island positioning is visualized by the cumulative sum of reads per nucleotide (see Online Methods). c, Loss of cohesin island at the Bzw1/Clk1 gene pair upon transcriptional inhibition by actinomycin D in DKO cells. d. Density profiles of Scc1 accumulation at convergently transcribed genes in response to actinomycin D treatment. e. Dis- and re-apperance of a cohesin island upon temporal inhibition of RNA polymerase II by DRB at the Bzw1/Clk1 gene pair in DKO cells. f. Density profiles of Scc1 accumulation at convergently transcribed genes in response to DRB treatment. g, Model of cohesin movement and accumulation at transcribed genes. Cohesin rings are indicated by red circles and cohesin peaks as determined by ChIP-seq by black triangles.
These results indicate that transcription can relocate cohesin over long distances in mammalian genomes, and are consistent with the following scenario (Fig. 4g): Cohesin is normally loaded onto DNA at sites occupied by Nipbl, many of which are located at active TSSs, but is translocated away from these in a transcription-dependent manner. Recent in vitro single-molecule experiments imply that this translocation may be caused by passive diffusion29,30 combined with pushing of cohesin by RNA polymerases29. Other enzymes that move processively along DNA may similarly be able to move cohesin along DNA in transcriptionally inactive regions of the genome, where cohesin accumulation at CTCF sites is also observed (unpublished data). Our observation that cohesin islands can only clearly be detected in Ctcf Wapl DKO cells and to a lesser extent in Wapl-depleted cells implies that cohesin may normally be translocated by transcription until it either encounters CTCF bound to DNA, or until Wapl releases cohesin. We observed in ChIP-seq experiments that Wapl co-localizes with cohesin at many genomic sites (Extended Data Fig. 6c-e), implying that Wapl may be able to translocate with cohesin and, unless protected by sororin31, release cohesin at any site. In yeast, cohesin accumulation at convergent transcription sites may be detectable also in wild-type cells20,21,23 because CTCF is not known to exist and Wapl may be less active in this species.
Cohesin translocation may have several important functions. It may enable transcription without release of cohesin from DNA, a process that would destroy cohesin mediated chromosomal interactions. Cohesin translocation may be particularly important in cells that have completed DNA replication in which cohesin cannot establish sister chromatid cohesion again32,33 and where transcription must therefore occur while cohesive cohesin complexes permanently remain associated with DNA. Furthermore, our observations indicate that cohesin translocation contributes to positioning cohesin at CTCF sites, where it mediates long-range chromosomal cis-interactions. If, as proposed16–19, cohesin connects converging CTCF motifs by loop extrusion, transcription-mediated cohesin translocation could contribute to the relative movement of cohesin versus DNA that has been postulated to form chromatin loops (Extended Data Fig. 10e,f).
Online Methods
Mice
Ctcffl/fl mice24, Smc3fl/fl mice (EUCOMM), Waplfl/fl mice25, Rosa26CreER/CreER mice34 and transgenic FLPe mice35 were maintained on the C57BL/6 genetic background. All animal experiments were carried out according to valid project licenses, which were approved and regularly controlled by the Austrian Veterinary Authorities.
Validation of the Smc3 allele
The neomycin resistance gene was removed from the germline transmitting Smc3fl/+ mice, which were obtained from the EUCOMM consortium, by crossing with the transgenic FLPe mouse. The correct genotype was confirmed by Southern blot analysis (Extended Data Fig. 1a, b). The following primers were used with WT DNA as a template to generate the Southern blot probe: 5’- GGAGTGGGTGTAGTCAATAG -3’ and 5’- TGCTTTATTCGGTATGCAGG -3’.
PCR genotyping
DNA from mouse tail biopsies was isolated by overnight incubation at 56 °C in 500 μl of lysis buffer (100 mM Tris pH 8.0, 200 mM NaCl, 5 mM EDTA, 0.2% SDS) containing 100 μg/ml Proteinase K. DNA was purified by ethanol precipitation and used for PCR analysis with a primer combination amplifying the wild-type, floxed and deleted alleles (Supplementary Table S3).
Southern blot analysis
EcoRV-digested DNA from tails of Smc3fl/+ mice was separated on a 0.7% agarose, fragmented by partial acid hydrolysis and transferred overnight onto a Hybond N+ nylon membrane (GE Health Care, Amersham, RPN303B) followed by crosslinking of the DNA to the membrane using a Stratalinker. The radioactively labeled probe was prepared by PCR amplification in the presence of 32P-dCTP (Perkin Elmer) and by subsequent purification with the QIAquick Nucleotide Removal kit (Qiagen). The denatured probe was hybridized to the DNA on the membrane overnight at 56 °C in Church buffer (1% (w/v) BSA, 1 mM EDTA, 0.5 M Na-phosphate pH 7.2, 7% (w/v) SDS) followed by washing in 0.1x SSC, 0.1% SDS. Radioactive signals were detected by phosphorimager analysis.
Antibodies
The following antibodies were used for immunblot analysis: mouse anti-AcSmc3 (gift from K. Shirahige), rabbit anti-CTCF (Peters laboratory ID A992), goat anti-H3 (Santa Cruz sc-8654), mouse anti-Scc1 (Upstate 05-908), rabbit anti-Smc3 (Bethyl A300-060A), mouse anti-tubulin (Sigma B512) and rabbit anti-Wapl (Peters laboratory ID A960). The following antibodies were used for immunofluorescence microscopy: rabbit anti-CTCF (Peters laboratory ID A992) and mouse anti-Scc1 (Upstate 05-908). The following antibodies were used for ChIP experiments: rabbit anti-CTCF (Upstate 07-729), rabbit anti-Scc1 (Abcam AB992), rabbit anti-Stag1 (Peters laboratory ID A823), rabbit anti-Nipbl (Sanova A301-779A), rabbit anti-H3K4me2 (Millipore 07-030) and rabbit anti-H3K9ac (Millipore 07-352).
Generation and culturing of MEFs
Primary MEFs were generated from E13.5 embryos and cultured in full medium (DMEM supplemented with 10% FBS, 0.2 mM L-glutamine, 100 U/ml penicillin, 100 μg/ml streptomycin, 1 mM sodium pyruvate, 0.1 mM 2-mercaptoethanol and non-essential amino acids). All experiments were performed in quiescent MEFs unless otherwise stated. For this, MEFs were first grown until confluence before the full medium was exchanged by resting medium (DMEM, 2% FBS, 100 U/ml penicillin and 100 μg/ml streptomycin).
For conditional deletion of the floxed Smc3 and Wapl alleles, we used the inducible CreERT2 recombinase expressed from the Rosa26 locus (Rosa26CreER)34. The cells were cultured in Optimem (Invitrogen) supplemented with 2% charcoal-treated FBS, 100 U/ml penicillin, 100 μg/ml streptomycin and 0.5 μM 4-hydroxytamoxifen (Sigma) for at least 2 days. Thereafter, the Optimem medium was replaced by resting medium. For conditional deletion of the floxed Ctcf allele, we infected cells with an Adeno-Cre virus (Penn Vector Core). MEFs were cultured for 4-6 hours in DMEM supplemented with 2% FBS, 4 μg/ml of polybrene and Adeno-Cre virus (1 μl for 1 million cells). The medium was thereafter exchanged to resting medium.
Serum stimulation experiments were performed by replacing the resting medium with full medium containing 20% FBS. In order to block transcription, a final concentration of 5 μg/ml actinomycin D or 100 μM 5,6-dichlorobenzimidazole 1-β-D-ribofuranoside (DRB) was added to the resting medium. For the DRB washout experiments, the cells were washed twice with PBS after DRB treatment and pre-warmed resting media was added back to the cells for 30 min or 1 day respectively.
Whole cell extract
Cells were re-suspended in modified RIPA buffer (50 mM Tris pH 7.5, 500 mM NaCl, 1 mM EDTA, 1% NP-40, 0.5% Na-deoxycholate and 0.1% SDS), which additionally contained pepstatin, leupeptin and chymostatin (20 μg/ml each) and PMSF (1 mM). The lysate was sonicated for 5 min using the Biorupter with a setting of 7.5 sec on and 30 sec off. The protein concentration was determined with the BCA Protein Assay kit (Thermo Fisher Scientific). SDS-PAGE and standard Western blot techniques36 were applied to detect individual protein with specific antibodies.
Chromatin fractionation
Cells were re-suspended in 120 μl of extraction buffer (25 mM Tris pH 7.5, 100 mM NaCl, 5mM MgCl2, 0.2% NP-40, 10% glycerol) supplemented with an EDTA-free protease inhibitor tablet (Roche) and PMSF (1 mM). The lysate was passed 15 times through a 0.4 mm needle on ice. The cytoplasm was separated from the chromatin by centrifugation at 1,300g at 4 °C for 10 min. The chromatin pellet was washed four times with 300 μl of extraction buffer and subsequently processed as described above for the whole cell extract.
Immunofluorescence analysis
MEFs were grown on coverslips, washed once in PBS and then fixed for 20 min in 4% paraformaldehyde solution. The cells were permeabilized by 0.1% Triton X-100 in PBS for 5 min. Cells were treated with 3% BSA in PBS-TX (0.01% Triton X-100 in PBS) for at least 30 min before the primary antibody was added for at least 1 h. After washing with PBS-TX, the secondary antibody was added for 1 h, and nuclei were stained with DAPI (0.4 μg/ml) for 5 min. The coverslips were mounted with ProLong Gold Antifade Reagent (Invitrogen) on a microscopy slide and analyzed by confocal microscopy.
cDNA preparation for RNA-sequencing
One 15-cm tissue culture dish containing 1-2 x 10⁶ MEF cells was used for one RNA-seq experiment. The cells were processed for cDNA preparation as described26. Cells were lysed using a QIAshredder column (Qiagen), and total RNA was extracted by the RNeasy Plus Mini kit (Invitrogen) using the gDNA Eliminator column. The purity of total RNA was analyzed with the Agilent RNA 6000 Nano kit (Agilent).
mRNA was purified in two rounds using the Dynabeads mRNA purification kit (Invitrogen), and the purified mRNA was fragmented for exactly 3 min at 94 °C in fragmentation buffer (8 mM Tris pH 8.2, 50 mM KAc and 4.5 mM MgAc) and thereafter purified over an RNeasy column. The quality of mRNA isolation and fragmentation was analyzed with the Agilent RNA 6000 Pico kit (Agilent). The fragmented mRNA was used as template for first-strand cDNA synthesis with random hexamers using the Superscript III First-Strand Synthesis kit (Invitrogen) followed by purification on a Mini Quick Spin column (Roche). The second-strand cDNA was synthesized by using random hexamers and 200 μM dATP, dCTP, dGTP and dUTP in the presence of RNase H, E. coli DNA polymerase I and DNA ligase (Invitrogen). The cDNA samples were purified with the MinElute Reaction Cleanup kit (Qiagen), and > 5 ng of cDNA were submitted for library preparation and Illumina deep sequencing to the Campus Science Support Facility.
ChIP-seq experiments
Except for the Nipbl and Wapl ChIP experiments, which were performed according to the Young laboratory protocol14, all others were done as described below.
Six 15-cm dishes or two 24-cm trays were used for one ChIP experiment. The cells were cross-linked by adding X-link solution (10% FBS, 1% formaldehyde in PBS) for 10 min at room temperature. The cells were subsequently washed with 0.15 M glycine in PBS and collected by mechanical scrapping off the plate followed by centrifugation at ~600g for 5 min at 4 °C.
For nuclei isolation, cells were first incubated for 10 min at 4 °C in 25 ml ice-cold buffer A (10 mM HEPES pH 8.0, 10 mM EDTA pH 8.0, 0.5 mM EGTA, 0.25% Triton X-100 and protease inhibitors) and for another 10 min at 4 °C in ice-cold buffer B (10 mM HEPES pH 8.0, 200 mM NaCl, 1 mM EDTA, 0.5 mM EGTA, 0.01% Trition X-100 and protease inhibitors). The nuclei were then lysed in chromatin lysis buffer (50 mM Tris-HCl pH 8.0, 10 mM EDTA, 0.25% SDS and protease inhibitors) and stored overnight at 4 °C. The DNA was sonicated by 8-12 cycles (30 sec on/off) using the Biorupter, the chromatin concentration was measured by NanoDrop analysis, and 1.5 volumes of 2.5x dilution buffer (250 mM NaCl, 1.67% Triton X-100 and protease inhibitors) was added to the lysate. Pre-clearing of the lysate, antibody immunoprecipitation and DNA eluation was performed as described13. DNA was re-suspended in 50 μl of Tris pH 8.0, and the ChIP efficiency was quantified by qPCR. Primers used for ChIP-qPCR are listed in Supplementary Table 3. The DNA samples (> 5 ng) were submitted for library preparation and Illumina deep sequencing to the Campus Science Support Facility.
GRO-seq experiments
MEFs (5 x 10⁶) were washed once with PBS and then scraped off the plates using ice-cold PBS. The cells were thereafter processed as described37. The cDNA was amplified with the KAPA HiFi Library Amp Real Time kit (Kapa Biosystems) and subsequently submitted for Illumina deep sequencing. Primers used for cDNA synthesis and library preparation are listed in Supplementary Table 3.
Illumina sequencing
Approximately 5 ng of ChIP-precipitated DNA (ChIP-seq) or synthesized cDNA (RNA-seq) were submitted for library preparation to the NGS Unit of the Campus Science Support Facility (www.vbcf.ac.at). For GRO-seq experiments, the amplified PCR products were submitted. All libraries were quantified using the Bioanalyzer (Agilent) system, and the data were sequenced on a HiSeqV4 Illumina system with a read length of 50 nucleotides. All Illumina sequencing was performed by the VBCF NGS Unit. Supplementary Tables 1 and 2 provide further information about all sequencing experiments of this study.
Sequence alignments
Reads that passed the Illumina quality filtering were considered for alignment. The remaining reads were aligned to the mouse genome assembly version July 2007 (NCBI37/mm9) using the Bowtie program (version 1)38, allowing up to two mismatches and ignoring any read that would match more than once.
Analysis of RNA-seq data
For all samples, the six most 5' bases of each read were trimmed. In cases where 36 bp and 50 bp read samples were to be analyzed together, the longer reads were additionally cut to achieve a shared read length (30bp). The TopHat program (version 1.3.1)39 was used to map the reads to mouse genome assembly mm9. Reads that could be uniquely mapped with no more than two mismatches were extracted and used for analysis. The number of reads mapped per gene was counted using HTSeq version 0.5.4 (http://www-huber.embl.de/users/anders/HTSeq). Reads, which overlapped at least partially with one gene uniquely, were counted (overlap resolution mode option set to “union”).
All samples were RLE normalized40 to adjust for the differences in the library sizes. The dispersions (best described as biological variances) were sequentially estimated by the EdgeR package (version 2.6.5)41 using the default settings. First a common dispersion for the gene set was estimated, the tagwise dispersion values were then shrunken towards this dispersion trend42. The EdgeR package41 was also used for the statistical modeling and analysis steps. The paired-sample design, the different genotypes as well as the treatments were taken into account, and a model was constructed.
For each knockout genotype, the contrasts between complete knockout (no functional allele) and the wild-type (two functional alleles) were estimated and tested for significance. The P values were corrected for multiple testing, using the Benjamini-Hochberg adjustment43. Genes with an adjusted P value of < 0.1 were called as statistically significant. Further, for each contrast and analysis, a moderated fold change was estimated using the variance stabilizing function of the DESeq package (version 1.8.3)40.
Peak calling and peak overlaps
Peaks were called by the MACS program (version 1.4.2)44 with a P value of 10-5 by using sample and input read files. Peak overlaps were calculated by using the BEDTools Suite45. Since occasionally more than one peak from one dataset can overlap with a single peak in a second dataset, the default output of such an overlap was displayed as one single entry (“union”). Consequently, the overall peak numbers drop slightly if displayed in overlaps (Fig. 1d, Extended Data Figs. 3e, 5a and 7a, c; Supplementary Table 1).
Combining ChIP replica experiments
The BAM files of replica ChIP-seq experiments obtained for the same genotype were combined into one file by merging with the SAMtools program (http://samtools.sourceforge.net/). MACS peak calling with an input file of the appropriate size was performed for CTCF, H3K4me2, H3K9ac, Scc1 and Stag1 ChIP-seq data (Supplementary Table 1).
Identification of cohesin peaks
ChIP-seq experiments were performed with anti-Stag1 and anti-Scc1 antibody in wild-type and KO cells (Supplementary Table 1). Since Scc1 and Stag1 are both components of the cohesin complex, their peaks were additively combined using the Multovl software46 and referred to as cohesin peaks.
Identification of cohesin islands
The MACS program generally identified cohesin islands as areas of clustered peaks. For easier filtering of cohesin islands in Ctcf Wapl DKO cells, each peak was enlarged by half of its own size and if neighboring peaks now overlapped, they were merged into one. Thereafter, merged and unmerged peaks were filtered based on their size (> 2 kb or > 5 kb) and the regions that were common in wild-type and DKO cells were removed from DKO dataset using the subtract function of BEDTools Suite45. The remaining sites were termed island-like sites (> 2 kb: 2,754 sites, > 5 kb: 1,245 sites). By visual inspection, some cohesin islands still consisted of several island-like sites. To determine how many convergent gene pairs or isolated genes had a cohesin island downstream of their transcription termination site, we overlapped the island-like sites with the convergent gene list (see below) or isolated genes (see below). Analysis of the > 2 kb or > 5 kb island-like sites revealed cohesin islands at 410 or 347 convergent gene pairs as well as at 325 or 229 isolated genes, respectively.
Genome-wide identification of ‘isolated’ genes
The mouse genome assembly version July 2007 (NCBI37/mm9) was used to annotate the transcription termination site (TTS) of each gene, which was then extended by 50 kb downstream of the TTS (downstream region). If no other gene was found to either start or end within this downstream region, the gene was considered to be isolated. In our initial analysis of highly transcribed isolated genes with the sitepro program47, we observed a high cohesin signal at a short distance upstream of the TTS in the Ctcf Wapl DKO MEFs. This signal originated from the localization of cohesin at the transcription start sites of short genes (< 15 kb in length). In order to eliminate this confounding cohesin signal at the TSS, we restricted the cohesin-binding analysis of the downstream regions to isolated genes that were > 15 kb in size. Moreover, short genes did generally not contain a cohesin island at their 3’ end (data not shown). Finally, we grouped the isolated genes according to their transcriptional activity (TPM value) as measured by GRO-seq (Fig. 3f; Extended Data Fig. 9c).
Convergent gene pair calculation
The mouse genome assembly version July 2007 (NCBI37/mm9) was used to extend the transcription termination sites (TTSs) of each gene by 40 kb in both directions (convergent region). If another annotated gene on the opposite strand ended within the “convergent region” and the transcription start sites was located downstream of the TTS, the two genes were classified as convergent. Based on this algorithm, one gene could have several convergently transcribed genes. The dataset was simplified by combining the plus and minus strand calculations into one dataset of 4,224 convergently transcribed gene pairs. Consequently, the following outcomes for convergent gene pairs were possible: single gene on the plus and minus strands, several genes on the plus strand and one gene on the minus strand or vice versa or several genes on the plus and minus strands. The coordinates of the convergently transcribed gene pairs were thereafter adjusted according to the TTS of the first gene on the plus strand and the TTS of the last gene on the minus strand. Since we observed an enrichment of cohesin islands at isolated genes that were > 15 kb in gene length (see above), we further restricted the convergent gene list to gene pairs with gene sizes of > 15 kb on both the plus and minus strands. This resulted in a final convergent gene pair list of 1,434 entries, which was then subdivided according to their transcriptional activity (TPM value), as measured by GRO-seq. Gene pairs with a transcription difference of < 3-fold were considered as equally expressed. Gene pairs with a transcription difference of > 3-fold were classified as unequally expressed, whereas gene pairs with a transcription value of < 1 TMP were considered as not expressed (Fig. 3c). The equally expressed gene pairs were further subdivided based on their TPM values into different subgroups (TPM 1-3, TPM 3-5 and TPM >5; Fig. 3d).
Identification of active and inactive TSSs
The mouse genome assembly version July 2007 (NCBI37/mm9) was used to extend the annotated transcription start site (TSS) by 250 bp on either side. These TSS regions were subdivided based on the presence or absence of active histone marks into active TSSs (H3K4me2+ H3K9ac+) or inactive TSSs (H3K4me2– H3K9ac–; Fig. 2a, b). Alternatively, active and inactive TSSs were defined by the RPKM value (determined by RNA-seq) of the corresponding gene (active TSS with RPKM > 1; inactive TSS with RPKM < 1; Extended Data Fig. 5b, c) or the TPM value of the respective gene as measured by GRO-seq (active TSS with TPM > 1; inactive TSS with TPM < 1; Extended Data Fig. 5d, e).
Motif prediction
Common, WT- and Ctcf KO-specific cohesin peaks were calculated by using the overlap and subtract function of the BEDTools suite45. For each category, the top 300 peaks with the highest peak calling scores were selected and the corresponding peak summits were isolated. After expanding the peak summits by 150 bp in both directions, the DNA sequence was extracted using the twoBitToFa program (UCSC Genome Bioinformatics, http://genome.ucsc.edu), and the repetitive sequences were masked (cat file | tr agtc N > output). These masked sequences were used as inputs for de novo motif prediction by the MEME-ChIP suite (version 4.9.1)48.
Read density heat maps
Read densities were calculated using the JNOMICSS program (I. Tamir, unpublished). Associated heat map visualizations were implemented using R (http://www.R-project.org) and were wrapped with customized bash scripts for command line usage.
Read density plots
Read density was calculated by the sitepro program of the CEAS package47. In order to compare datasets with each other, the uniquely aligned reads of all datasets (aligned bed files) were down-sampled to the size of the dataset with the lowest read number. Wiggle files were calculated by the MACS peak-calling program with a fixed shiftsize of 55. These wiggle files were then used for read density visualization with the sitepro program.
Cumulative sum of read coverage per nucleotide (serum stimulation experiments)
The mouse genome assembly version July 2007 (NCBI37/mm9) was used to increase the annotated transcription termination (TTS) sites by 20 kb in both directions. The read coverage for each nucleotide within this window was then determined by the coverage function of the BEDTools suite45. The reads were then cumulatively summed up starting from 20 kb upstream to 20 kb downstream of a given TTS and were then normalized according to the final cumulative sum. The percentage values were then plotted in Fig. 4b and Extended Data Fig. 11b,d,f,h,j.
Extended Data
Extended Data Figure 1. Characterization of conditional Smc3 knockout cells.
a, Schematic representation of the wild-type, floxed (fl) and deleted (Δ) Smc3 alleles (after elimination of the neomycin resistance gene). EcoRV fragments, which were used for allele identification by Southern blot analysis with the indicated exon 8 probe, are shown together with their length (in kb). b, Southern blot analysis of tail DNA from wild-type, Smc3fl/+ and Smc3fl/fl mice. c, Absence of Smc3–/– offspring at birth. The genotype of newborn mice from intercrosses of Smc3+/– mice was determined by PCR genotyping. d, Deletion of the floxed Smc3 allele was detected by PCR genotyping in primary Rosa26CreER/+ Smc3fl/+ MEFs at the indicated days after 4-hydroxytamoxifen (OHT) addition. e, The level of Smc3 protein depletion in primary Rosa26CreER/+ Smc3fl/– MEFs was analyzed every second day after OHT addition by immunoblot analysis of whole cell extracts. Control Rosa26CreER/+ Smc3fl/+ MEFs were additionally analyzed together with a dilution series of the day-0 sample. A long and short exposure of the Smc3 immunoblot is shown. f, The efficiency of protein depletion was analyzed by immunoblot analysis of chromatin extracts from starved MEFs at day 10 after OHT treatment (Smc3 and Wapl KO cells) or Adeno-Cre virus infection (Ctcf KO cells). The wild-type chromatin sample was diluted up to 1:32 in order to estimate the relative reduction in protein levels (CTCF: > 4x, Wapl: > 8x and Smc3: > 16x). g, Proliferation capacity of WT MEFs and Ctcf, Smc3 and Wapl KO MEFs. The indicated serum-starved cells were stimulated with 10% fetal calf serum, and cell numbers were measured every day using the Casy counter. All three KO cells failed to respond to proliferate in contrast to wild-type MEFs.
Extended Data Figure 2. Cohesin relocation in Ctcf KO MEFs.
Binding of Nipbl, CTCF and cohesin (Stag1 and Scc1) at the Nufip2 (a), Gphn (b) and Ublcp1/Rnf145 (c) genes was determined by ChIP-seq analysis in WT MEFs and Ctcf, Smc3 and Wapl KO MEFs.
Extended Data Figure 3. Analysis of Ctcf KO-specific cohesin sites.
a, Density profiles of CTCF and Stag1 binding at cohesin sites that are commonly found in WT and Ctcf KO cells. The cohesin sites were subdivided based on the detection or absence of a CTCF peak in Ctcf KO cells as determined by the MACS peak-calling program. b, The enrichment of Stag1 binding (n=2) relative to input is shown for WT (black) and Ctcf KO cells (purple) at two TSSs, one CTCF sites and one transcription termination site (TTS). Two independent biological experiments were performed and normalized values with the corresponding standard deviations were plotted. c-d, Cohesin (Stag1 and Scc1) ChIP-seq data of replica (rep) experiments are shown as density heat maps for (c) active and inactive TSSs and (d) TSS- and non-TSS-associated Nipbl-binding sites. Binding data are shown for a region extending from -2.5 kb to +2.5 kb relative to the cohesin peak summit. Heat maps were sorted according to the density of Stag1 binding in Ctcf KO cells (rep 2). A density scale from low (grey) to high (yellow) is shown. e, Categorization of WT-specific, Ctcf KO-specific and commonly found cohesin sites according to their location at active TSSs (H3K4me2+ H3K9ac+) or non-TSS regions with open chromatin (H3K4me2+ H3K9ac+), poised chromatin (H3K4me2+) and no active chromatin marks (rest). Note that one TSS can bind several cohesin sites. Therefore the number of cohesin-bound TSSs and TSS-bound cohesin sites are not necessarily identical.
Extended Data Figure 4. Cohesin redistribution to transcriptional start sites in Ctcf KO MEFs.
a, Binding of cohesin at transcription start sites (TSSs) of active and inactive genes, which were defined by RNA-seq analysis. Genes with an RPKM > 1 were considered as active, whereas genes with an RPKM < 1 were classified as inactive. Pie charts indicate the relative binding of cohesin at all annotated TSSs of the RefSeq genome (mm9) in WT and Ctcf KO MEFs. b, Density heat map of cohesin and Nipbl binding at active and inactive TSSs as defined in a. Active and inactive TSSs were sorted according to the read density of Stag1 binding in Ctcf KO cells (replica 3). c, Binding of cohesin at TSSs of active and inactive genes, which were defined by GRO-seq analysis. Genes with a TPM > 1 were considered as active, whereas genes with an TPM < 1 were classified as inactive. Pie charts indicate the relative binding of cohesin at all annotated TSSs of the RefSeq genome (mm9) in WT and Ctcf KO cells. d, Density heat map of cohesin and Nipbl binding at active and inactive TSSs as defined in c. Active and inactive TSSs were sorted according to the read density of Stag1 binding in Ctcf KO (replica 3). A density scale from low (grey) to high (yellow) is shown (b,d). e, Heat map of Nipbl and cohesin binding at Nipbl peaks in MEFs of the indicated genotypes. The Nipbl peaks were subdivided according to their TSS localization. Peaks were sorted according to the Stag1 binding density in Ctcf KO cells (replica 3). f, Venn diagram indicating the overlap between Nipbl and cohesin peaks in WT or Ctcf KO MEFs.
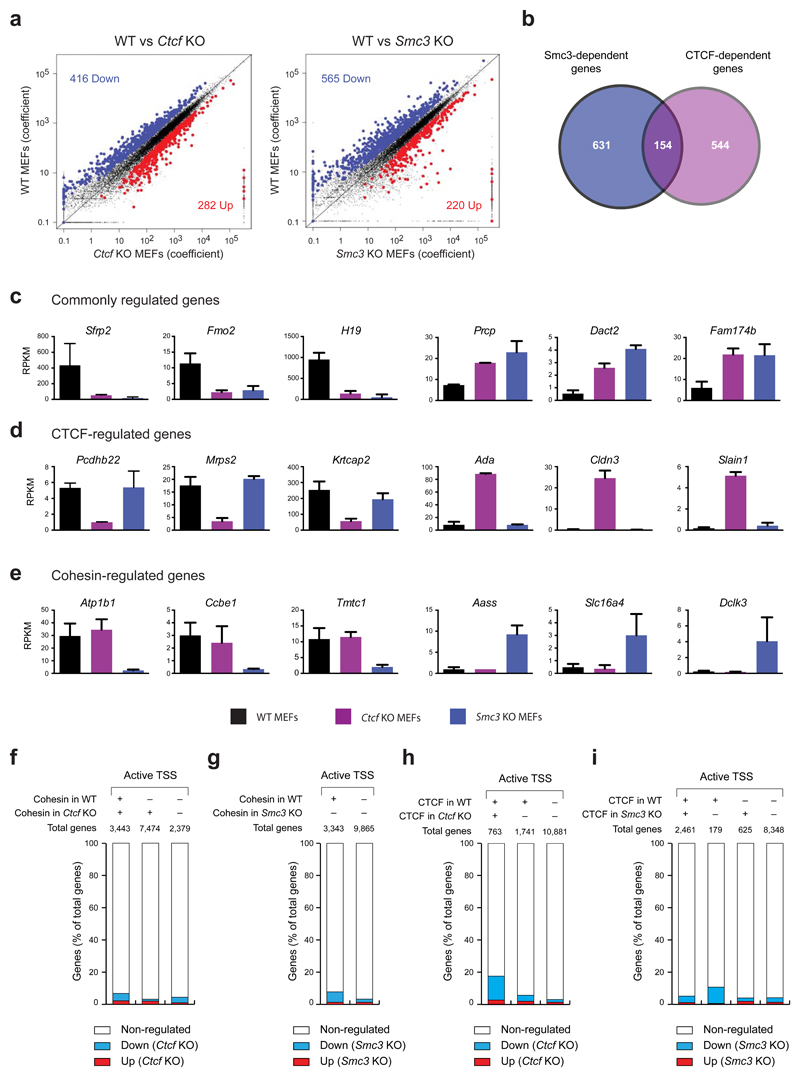
Extended Data Figure 5. Identification of CTCF- and cohesin-regulated genes.
a, Scatter plot of gene expression differences between WT and Ctcf KO or Smc3 KO MEFs, based on 2 and 4 independent RNA-seq experiments, respectively. The normalized expression data of individual genes in the two cell types are plotted as coefficient value. Each symbol represents one gene. Genes with an expression difference of > 2-fold, an adjusted P value of < 0.1 and an RPKM value of > 1 in WT or KO cells are colored in blue or red, corresponding to down- or up-regulated genes in the indicated KO MEFs, respectively. For evaluation of the RNA-seq data, see Online Methods. b, Overlap between CTCF- and cohesin-regulated genes, shown as a Venn diagram. c-e, Expression of selected regulated genes in WT (black), Ctcf KO (purple) and Smc3 KO (blue) MEFs. The expression of genes, which are commonly regulated by CTCF and cohesin (c), by CTCF alone (d) or by cohesin alone (e), is shown as normalized expression value (RPKM) based on 10 (WT), 2 (Ctcf KO) or 4 (Smc3 KO) independent RNA-seq experiments. RPKM, reads per kilobase of exon per million mapped sequence reads. f,h, Minimal correlation between CTCF-dependent gene regulation and cohesin (f) or CTCF (h) binding at active promoters. Genes that were down- or up-regulated in Ctcf KO MEFs are shown as percentage of all genes present in the three indicated gene groups that were defined by the presence or absence of cohesin binding at active TSSs in WT and/or Ctcf KO cells. g,i, Little correlation between Smc3-dependent gene regulation and cohesin (g) or CTCF (i) binding at active promoters. Genes that were down- or up-regulated in Smc3 KO MEFs are shown as percentage of all genes that were defined by the presence or absence of cohesin binding at active TSSs in WT cells.
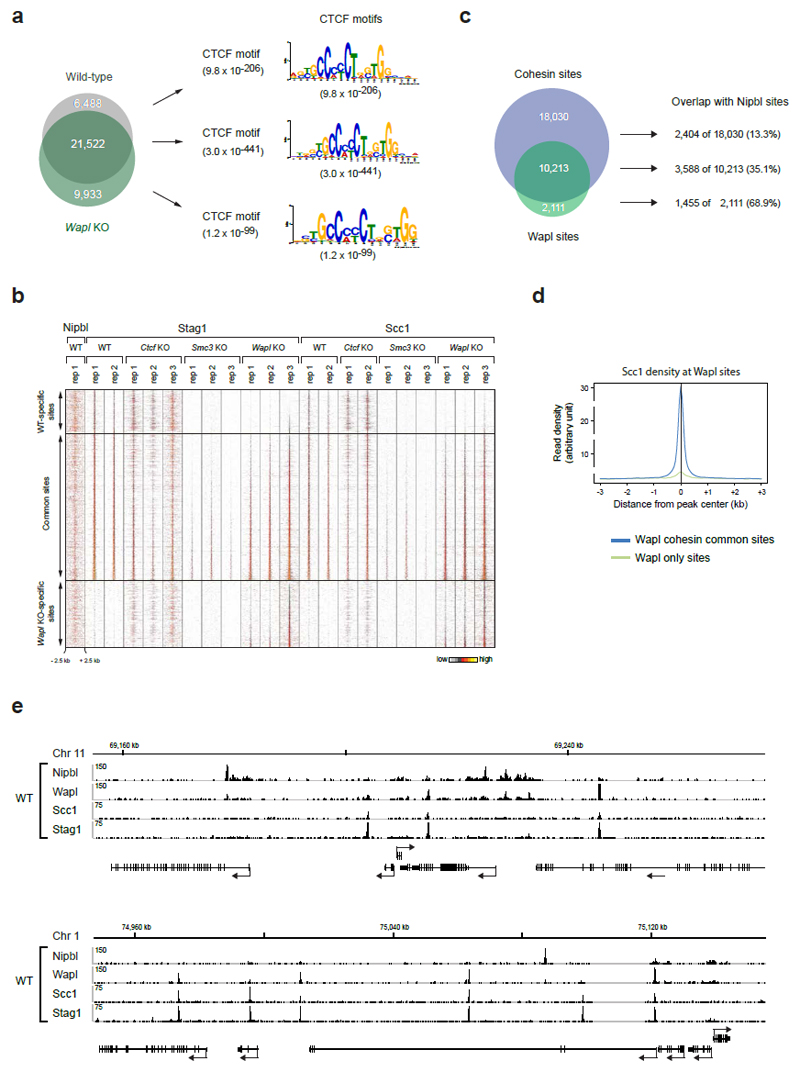
Extended Data Figure 6. Genomic localization of cohesin in Wapl KO cells.
a. The cohesin-binding sites detected in wild-type and Wapl KO cells were subdivided into WT-specific, Wapl KO-specific and common peaks, as indicated by the Venn diagram. For each subgroup, the most significant DNA-binding motif is shown. The different motifs were detected with the E-value indicated in brackets. b. Heat maps of Nipbl and cohesin binding for the different subgroups. Cohesin peaks were blotted on the vertical axis for a region extending from -2.5 kb to +2.5 kb relative to the cohesin peak summit (horizontal axis) and were sorted in each subgroup according to the density of Stag1 binding in Wapl KO cells (replica 3). A density scale from low (grey) to high (yellow) is shown. c, Venn diagram of Wapl and cohesin peaks in WT MEFs. The individual subgroups were further overlapped with Nipbl sites. d, Density profiles of Scc1 binding are shown for Wapl only sites (green) and cohesin/Wapl common sites (blue). Note that cohesin is also enriched (even though at low level, which is not detected by the peak calling algorithm we used) at "Wapl only" sites, consistent with our observation that the association of Wapl with chromatin depends on cohesin49 and Extended Data 1f). e, Examples of the distribution of Nipbl, Wapl, and cohesin (Stag1 and Scc1) at two genomic regions, one on chromosome 11 and the other on chromosome 1, as determined by ChIP-seq analysis in WT MEFs.
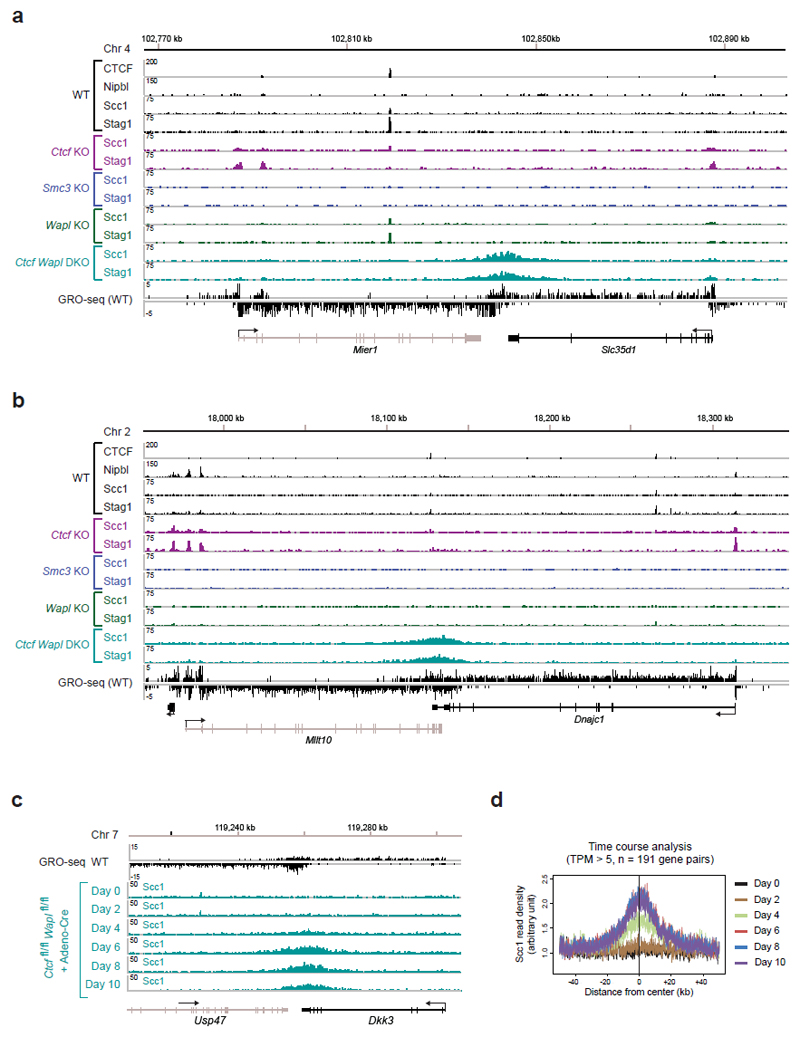
Extended Data Figure 7. Cohesin islands in Ctcf Wapl DKO MEFs.
Binding of CTCF, Nipbl and cohesin (Stag1 and Scc1) at the convergently transcribed genes Mier1 and Slc35d1 (a) and Mllt1 and Dnajc1 (b) was determined by ChIP-seq analysis in WT MEFs, Ctcf, Smc3 and Wapl KO MEFs and Ctcf Wapl DKO MEFs. c,d. Time course analysis of the appearance of cohesin islands upon Ctcf and Wapl deletion in Adeno-Cre infected MEFs. c, Scc1 accumulation in the 3’ region of the convergently transcribed Usp47 and Dkk3 genes at the indicated days after Adeno-Cre infection. d, Density profiles of Scc1 accumulation at convergently transcribed genes in response to Adeno-Cre infection. Scc1 binding was centered in the middle of the intervening region between gene pairs with a similarly strong transcription activity (TPM > 5).
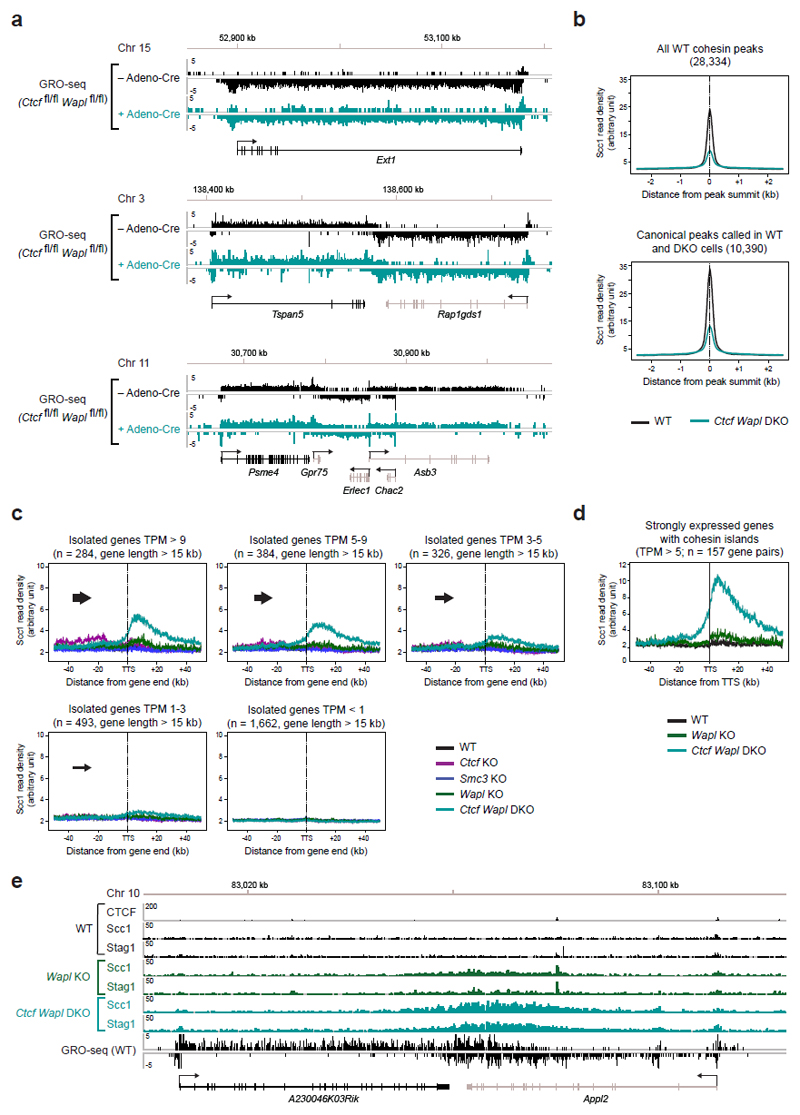
Extended Data Figure 8. Cohesin islands at isolated genes depend on gene transcription.
a, Similar transcriptional activity of individual genes in WT and Ctcf Wapl DKO MEFs. GRO-seq data are shown for three different gene regions in Ctcf fl/fl Wapl fl/fl MEFs before and after Adeno-Cre infection. b. Density profiles of Scc1 accumulation in wild-type and Ctcf Wapl DKO cells at all wild-type cohesin peaks (28,334) or at overlapping canonical peaks (10,390) identified by peak calling in WT and Ctcf Wapl DKO cells. c, The transcriptional activity determines the amount of cohesin accumulation in the 3’ region of isolated genes lacking a neighboring downstream gene. Density profiles of Scc1 binding are shown for 5 groups of genes with decreasing GRO-seq signals (TPM value of > 9, 5-9, 3-5, 1-3 and < 1). d, For better visualization of cohesin islands in Wapl KO cells, we restricted our analysis on genes that were > 15kb in length and highly expressed (TPM > 5). The genes were further filtered based on the presence of a cohesin island in Ctcf Wapl KO cells and based on the absence of any intragenic CTCF site (assuming that a CTCF site might prevent proper cohesin pushing along the DNA). Density profiles of Scc1 in wild-type (WT, black), Wapl KO (green) and Ctcf Wapl KO (turquoise) cells are shown. e, Examples of cohesin islands formation in Wapl KO cells is shown for the A230046K03Rik/Appl2 locus.
Extended Data Figure 9. Transcriptional changes induced by serum stimulation affect positioning of cohesin islands.
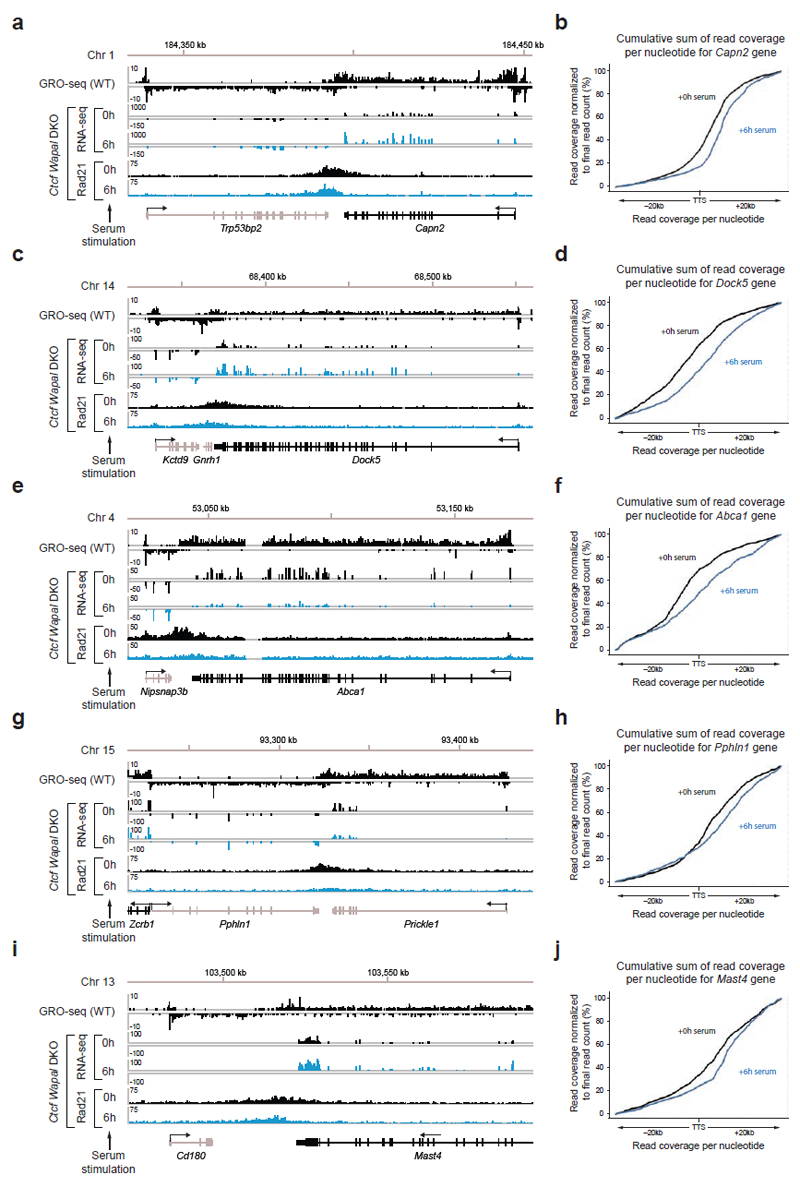
a,c,e,g,i. Binding of Scc1 and mRNA profiling upon serum stimulation (20% fetal bovine serum) at five genomic regions. The observed differences in cohesin island positioning correlate with increased or decreased mRNA levels of the respective genes as measured by their RPKM value (a, Capn2: 104.88 → 248.32; c, Dock5: 4.89 → 14.06; e, Abca1: 11.51 → 2.27; g, Pphln1: 5.13 → 8.00 and Prickle1: 14.19 → 7.86; i, Mast4: 7.70 →16.68). b,d,f.h,j Visualization of the altered shape of cohesin islands by plotting the cumulative sum of reads per nucleotide starting from -20 kb to + 20 kb after the transcription termination sites of Capn2 (b), Dock5 (d), Abca1 (f), Pphln1 (h) and Mast4 (j) gene (see Online Methods).
Extended Data Figure 10. Transcriptional inhibition and disappearance of cohesin islands.
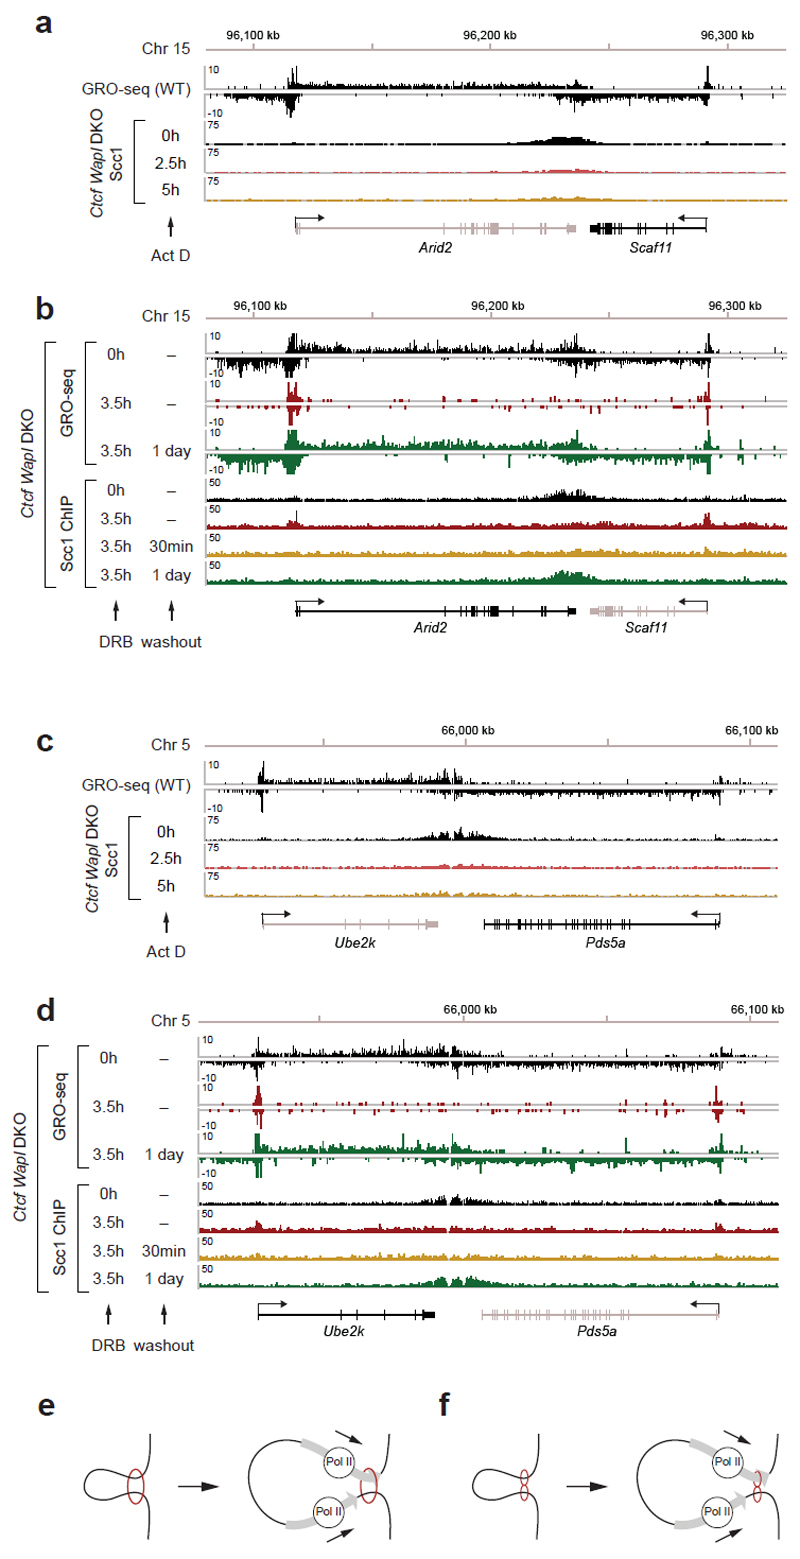
a,c. Loss of cohesin islands in response to transcriptional inhibition by actinomycin D (Act D; 5 μg/ml) for 2.5 and 5 h followed by Scc1 profiling in Ctcf Wapl DKO cells. b,d. Dis- and reapperance of cohesin islands in response to inhibition of RNA polymerase II elongation by 5,6-dichlorobenzimidazole 1-β-D-ribofuranoside (DRB; 100 μM) and its subsequent removal in Ctcf Wapl DKO cells, respectively. The same convergently transcribed gene pairs are shown for the Act D and DRB experiments (a,b Arid2 and Scaf11 and c,d Ube2k and Pds5a). Please note that Nipbl localization in Drosophila is not affected by transcriptional inhibitors50, implying that Nipbl-cohesin interactions may not be sufficient to explain cohesin accumulation at TSSs in DRB treated cells. e,f, Speculative models of how transcription could move one19 (e) or two18 (f) cohesin rings to mediate loop extrusion.
Supplementary Material
Supplementary Information is available in the online version of the paper.
Acknowledgements
We thank D. Cisneros for help with confocal microscopy, A. Sommer and colleagues at Vienna Biocenter Core Facilities (VBCF) for Illumina sequencing and Markus Jaritz for generating the density heat map program. Research in the laboratory of J.-M.P. is supported by Boehringer Ingelheim, the Austrian Science Fund (SFB-F34 and Wittgenstein award Z196-B20) and the Austrian Research Promotion Agency (Headquarter grants FFG-834223 and FFG-852936, Laura Bassi Centre for Optimized Structural Studies grant FFG-840283).
Footnotes
Author Contributions
G.A.B did most experiments; P.vdL. performed ChIP-qPCR and the Nipbl and the Wapl ChIP-seq experiments; G.A.B and R.S. performed bioinformatic analyses of ChIP-seq data; R.S. bioinformatically analyzed GRO-seq data; E.A. analyzed the RNA-seq data; A.T. generated the conditional Wapl mouse; N.G. provided the conditional Ctcf mouse; G.A.B and J.-M.P. planned the project, designed experiments and wrote the manuscript.
Competing Financial Interests
The authors declare no competing financial interests.
Accession numbers
The RNA-seq, ChIP-seq and GRO-seq data are available at the Gene Expression Omnibus (GEO) repository under the accession number GSE76303.
References
- 1.Hadjur S, et al. Cohesins form chromosomal cis-interactions at the developmentally regulated IFNG locus. Nature. 2009;460:410–413. doi: 10.1038/nature08079. [DOI] [PMC free article] [PubMed] [Google Scholar]
- 2.Nativio R, et al. Cohesin is required for higher-order chromatin conformation at the imprinted IGF2-H19 locus. PLoS Genet. 2009;5:e1000739. doi: 10.1371/journal.pgen.1000739. [DOI] [PMC free article] [PubMed] [Google Scholar]
- 3.Dixon JR, et al. Topological domains in mammalian genomes identified by analysis of chromatin interactions. Nature. 2012;485:376–380. doi: 10.1038/nature11082. [DOI] [PMC free article] [PubMed] [Google Scholar]
- 4.Zuin J, et al. Cohesin and CTCF differentially affect chromatin architecture and gene expression in human cells. Proc Natl Acad Sci USA. 2014;111:996–1001. doi: 10.1073/pnas.1317788111. [DOI] [PMC free article] [PubMed] [Google Scholar]
- 5.Sofueva S, et al. Cohesin-mediated interactions organize chromosomal domain architecture. EMBO J. 2013;32:3119–3129. doi: 10.1038/emboj.2013.237. [DOI] [PMC free article] [PubMed] [Google Scholar]
- 6.Rao SSP, et al. A 3D map of the human genome at kilobase resolution reveals principles of chromatin looping. Cell. 2014;159:1665–1680. doi: 10.1016/j.cell.2014.11.021. [DOI] [PMC free article] [PubMed] [Google Scholar]
- 7.Seitan VC, et al. A role for cohesin in T-cell-receptor rearrangement and thymocyte differentiation. Nature. 2011;476:467–471. doi: 10.1038/nature10312. [DOI] [PMC free article] [PubMed] [Google Scholar]
- 8.Guo C, et al. CTCF-binding elements mediate control of V(D)J recombination. Nature. 2011;477:424–430. doi: 10.1038/nature10495. [DOI] [PMC free article] [PubMed] [Google Scholar]
- 9.Medvedovic J, et al. Flexible Long-Range Loops in the VH Gene Region of the Igh Locus Facilitate the Generation of a Diverse Antibody Repertoire. Immunity. 2013;39:229–244. doi: 10.1016/j.immuni.2013.08.011. [DOI] [PMC free article] [PubMed] [Google Scholar]
- 10.Kim TH, et al. Analysis of the vertebrate insulator protein CTCF-binding sites in the human genome. Cell. 2007;128:1231–1245. doi: 10.1016/j.cell.2006.12.048. [DOI] [PMC free article] [PubMed] [Google Scholar]
- 11.Phillips-Cremins JE, et al. Architectural protein subclasses shape 3D organization of genomes during lineage commitment. Cell. 2013;153:1281–1295. doi: 10.1016/j.cell.2013.04.053. [DOI] [PMC free article] [PubMed] [Google Scholar]
- 12.Parelho V, et al. Cohesins functionally associate with CTCF on mammalian chromosome arms. Cell. 2008;132:422–433. doi: 10.1016/j.cell.2008.01.011. [DOI] [PubMed] [Google Scholar]
- 13.Wendt KS, et al. Cohesin mediates transcriptional insulation by CCCTC-binding factor. Nature. 2008;451:796–801. doi: 10.1038/nature06634. [DOI] [PubMed] [Google Scholar]
- 14.Kagey MH, et al. Mediator and cohesin connect gene expression and chromatin architecture. Nature. 2010;467:430–435. doi: 10.1038/nature09380. [DOI] [PMC free article] [PubMed] [Google Scholar]
- 15.Zuin J, et al. A cohesin-independent role for NIPBL at promoters provides insights in CdLS. PLoS Genet. 2014;10:e1004153. doi: 10.1371/journal.pgen.1004153. [DOI] [PMC free article] [PubMed] [Google Scholar]
- 16.Nasmyth K. Disseminating the genome: joining, resolving, and separating sister chromatids during mitosis and meiosis. Annu Rev Genet. 2001;35:673–745. doi: 10.1146/annurev.genet.35.102401.091334. [DOI] [PubMed] [Google Scholar]
- 17.Nichols MH, Corces VG. A CTCF Code for 3D Genome Architecture. Cell. 2015;162:703–705. doi: 10.1016/j.cell.2015.07.053. [DOI] [PMC free article] [PubMed] [Google Scholar]
- 18.Sanborn AL, et al. Chromatin extrusion explains key features of loop and domain formation in wild-type and engineered genomes. Proc Natl Acad Sci USA. 2015;112:E6456–65. doi: 10.1073/pnas.1518552112. [DOI] [PMC free article] [PubMed] [Google Scholar]
- 19.Fudenberg G, et al. Formation of Chromosomal Domains by Loop Extrusion. Cell Rep. 2016;15:2038–2049. doi: 10.1016/j.celrep.2016.04.085. [DOI] [PMC free article] [PubMed] [Google Scholar]
- 20.Glynn EF, et al. Genome-wide mapping of the cohesin complex in the yeast Saccharomyces cerevisiae. PLoS Biol. 2004;2:E259. doi: 10.1371/journal.pbio.0020259. [DOI] [PMC free article] [PubMed] [Google Scholar]
- 21.Lengronne A, et al. Cohesin relocation from sites of chromosomal loading to places of convergent transcription. Nature. 2004;430:573–578. doi: 10.1038/nature02742. [DOI] [PMC free article] [PubMed] [Google Scholar]
- 22.Hu B, et al. Biological chromodynamics: a general method for measuring protein occupancy across the genome by calibrating ChIP-seq. Nucleic Acids Res. 2015;43:e132. doi: 10.1093/nar/gkv670. [DOI] [PMC free article] [PubMed] [Google Scholar]
- 23.Gullerova M, Proudfoot NJ. Cohesin complex promotes transcriptional termination between convergent genes in S. pombe. Cell. 2008;132:983–995. doi: 10.1016/j.cell.2008.02.040. [DOI] [PubMed] [Google Scholar]
- 24.Heath H, et al. CTCF regulates cell cycle progression of alphabeta T cells in the thymus. EMBO J. 2008;27:2839–2850. doi: 10.1038/emboj.2008.214. [DOI] [PMC free article] [PubMed] [Google Scholar]
- 25.Tedeschi A, et al. Wapl is an essential regulator of chromatin structure and chromosome segregation. Nature. 2013;501:564–568. doi: 10.1038/nature12471. [DOI] [PMC free article] [PubMed] [Google Scholar]
- 26.Revilla-I-Domingo R, et al. The B-cell identity factor Pax5 regulates distinct transcriptional programmes in early and late B lymphopoiesis. EMBO J. 2012;31:3130–3146. doi: 10.1038/emboj.2012.155. [DOI] [PMC free article] [PubMed] [Google Scholar]
- 27.Schaaf CA, et al. Genome-wide control of RNA polymerase II activity by cohesin. PLoS Genet. 2013;9:e1003382. doi: 10.1371/journal.pgen.1003382. [DOI] [PMC free article] [PubMed] [Google Scholar]
- 28.Izumi K, et al. Germline gain-of-function mutations in AFF4 cause a developmental syndrome functionally linking the super elongation complex and cohesin. Nat Genet. 2015;47:338–344. doi: 10.1038/ng.3229. [DOI] [PMC free article] [PubMed] [Google Scholar]
- 29.Davidson IF, et al. Rapid movement and transcriptional re-localization of human cohesin on DNA. EMBO J. 2016;35:2671–2685. doi: 10.15252/embj.201695402. [DOI] [PMC free article] [PubMed] [Google Scholar]
- 30.Stigler J, Çamdere GÖ, Koshland DE, Greene EC. Single-Molecule Imaging Reveals a Collapsed Conformational State for DNA-Bound Cohesin. Cell Rep. 2016;15:988–998. doi: 10.1016/j.celrep.2016.04.003. [DOI] [PMC free article] [PubMed] [Google Scholar]
- 31.Nishiyama T, et al. Sororin mediates sister chromatid cohesion by antagonizing Wapl. Cell. 2010;143:737–749. doi: 10.1016/j.cell.2010.10.031. [DOI] [PubMed] [Google Scholar]
- 32.Uhlmann F, Nasmyth K. Cohesion between sister chromatids must be established during DNA replication. Curr Biol. 1998;8:1095–1101. doi: 10.1016/s0960-9822(98)70463-4. [DOI] [PubMed] [Google Scholar]
- 33.Tachibana-Konwalski K, et al. Rec8-containing cohesin maintains bivalents without turnover during the growing phase of mouse oocytes. Genes & Development. 2010;24:2505–2516. doi: 10.1101/gad.605910. [DOI] [PMC free article] [PubMed] [Google Scholar]
- 34.Seibler J, et al. Rapid generation of inducible mouse mutants. Nucleic Acids Res. 2003;31:e12. doi: 10.1093/nar/gng012. [DOI] [PMC free article] [PubMed] [Google Scholar]
- 35.Rodríguez CI, et al. High-efficiency deleter mice show that FLPe is an alternative to Cre-loxP. Nat Genet. 2000;25:139–140. doi: 10.1038/75973. [DOI] [PubMed] [Google Scholar]
- 36.Sambrook J, Russell DW. Molecular Cloning: A Laboratory Manual. Cold Spring Harbor Laboratory Press; 2001. [Google Scholar]
- 37.Core LJ, Waterfall JJ, Lis JT. Nascent RNA sequencing reveals widespread pausing and divergent initiation at human promoters. Science. 2008;322:1845–1848. doi: 10.1126/science.1162228. [DOI] [PMC free article] [PubMed] [Google Scholar]
- 38.Langmead B, Trapnell C, Pop M, Salzberg SL. Ultrafast and memory-efficient alignment of short DNA sequences to the human genome. Genome Biol. 2009;10:R25. doi: 10.1186/gb-2009-10-3-r25. [DOI] [PMC free article] [PubMed] [Google Scholar]
- 39.Trapnell C, Pachter L, Salzberg SL. TopHat: discovering splice junctions with RNA-Seq. Bioinformatics. 2009;25:1105–1111. doi: 10.1093/bioinformatics/btp120. [DOI] [PMC free article] [PubMed] [Google Scholar]
- 40.Anders S, Huber W. Differential expression analysis for sequence count data. Genome Biol. 2010;11:R106. doi: 10.1186/gb-2010-11-10-r106. [DOI] [PMC free article] [PubMed] [Google Scholar]
- 41.Robinson MD, McCarthy DJ, Smyth GK. edgeR: a Bioconductor package for differential expression analysis of digital gene expression data. Bioinformatics. 2010;26:139–140. doi: 10.1093/bioinformatics/btp616. [DOI] [PMC free article] [PubMed] [Google Scholar]
- 42.McCarthy DJ, Chen Y, Smyth GK. Differential expression analysis of multifactor RNA-Seq experiments with respect to biological variation. Nucleic Acids Res. 2012;40:4288–4297. doi: 10.1093/nar/gks042. [DOI] [PMC free article] [PubMed] [Google Scholar]
- 43.Benjamini Y, Hochberg Y. Controlling the False Discovery Rate: A Practical and Powerful Approach to Multiple Testing. Journal of the Royal Statistical Society Series B (Methodological) 1995;57:289–300. [Google Scholar]
- 44.Zhang Y, et al. Model-based Analysis of ChIP-Seq (MACS) Genome Biol. 2008;9:R137. doi: 10.1186/gb-2008-9-9-r137. [DOI] [PMC free article] [PubMed] [Google Scholar]
- 45.Quinlan AR, Hall IM. BEDTools: a flexible suite of utilities for comparing genomic features. Bioinformatics. 2010;26:841–842. doi: 10.1093/bioinformatics/btq033. [DOI] [PMC free article] [PubMed] [Google Scholar]
- 46.Aszódi A. MULTOVL: fast multiple overlaps of genomic regions. Bioinformatics. 2012;28:3318–3319. doi: 10.1093/bioinformatics/bts607. [DOI] [PubMed] [Google Scholar]
- 47.Shin H, Liu T, Manrai AK, Liu XS. CEAS: cis-regulatory element annotation system. Bioinformatics. 2009;25:2605–2606. doi: 10.1093/bioinformatics/btp479. [DOI] [PubMed] [Google Scholar]
- 48.Machanick P, Bailey TL. MEME-ChIP: motif analysis of large DNA datasets. Bioinformatics. 2011;27:1696–1697. doi: 10.1093/bioinformatics/btr189. [DOI] [PMC free article] [PubMed] [Google Scholar]
- 49.Kueng S, et al. Wapl controls the dynamic association of cohesin with chromatin. Cell. 2006;127:955–967. doi: 10.1016/j.cell.2006.09.040. [DOI] [PubMed] [Google Scholar]
- 50.Swain A, et al. Drosophila TDP-43 RNA-Binding Protein Facilitates Association of Sister Chromatid Cohesion Proteins with Genes, Enhancers and Polycomb Response Elements. PLoS Genet. 2016;12:e1006331. doi: 10.1371/journal.pgen.1006331. [DOI] [PMC free article] [PubMed] [Google Scholar]
Associated Data
This section collects any data citations, data availability statements, or supplementary materials included in this article.


