

ABSTRACT
Cancer-derived extracellular vesicles (EVs) are membrane-enclosed structures of highly variable size. EVs contain a myriad of substances (proteins, lipid, RNA, DNA) that provide a reservoir of circulating molecules, thus offering a good source of biomarkers. We demonstrate here that large EVs (L-EV) (large oncosomes) isolated from prostate cancer (PCa) cells and patient plasma are an EV population that is enriched in chromosomal DNA, including large fragments up to 2 million base pair long. While L-EVs and small EVs (S-EV) (exosomes) isolated from the same cells contained similar amounts of protein, the DNA was more abundant in L-EV, despite S-EVs being more numerous. Consistent with in vitro observations, the abundance of DNA in L-EV obtained from PCa patient plasma was variable but frequently high. Conversely, negligible amounts of DNA were present in the S-EVs from the same patients. Controlled experimental conditions, with spike-ins of L-EVs and S-EVs from cancer cells in human plasma from healthy subjects, showed that circulating DNA is almost exclusively enclosed in L-EVs. Whole genome sequencing revealed that the DNA in L-EVs reflects genetic aberrations of the cell of origin, including copy number variations of genes frequently altered in metastatic PCa (i.e. MYC, AKT1, PTK2, KLF10 and PTEN). These results demonstrate that L-EV-derived DNA reflects the genomic make-up of the tumour of origin. They also support the conclusion that L-EVs are the fraction of plasma EVs with DNA content that should be interrogated for tumour-derived genomic alterations.
KEYWORDS: DNA, L-EVs, S-EVs, plasma, prostate cancer, liquid biopsy
Introduction
Extracellular vesicles (EVs) are membrane-enclosed structures that are released from all cells in the body [1]. EVs vary in size, biogenesis, membrane composition, cargo and function [2,3]. While it remains challenging to separate EV subpopulations [4,5], we have successfully isolated unusually large (1–10 μm diameter) EVs (L-EVs), referred to as large oncosomes (LO) [6–9], from tumour cells with high migratory and invasive abilities. LO have been identified in tumour tissue and plasma of patients with prostate cancer (PCa) but not in cancer-free individuals and their abundance increases in patients with metastatic castration-resistant prostate cancer (mCRPC) [7,9].
EV cargo is sensitive to disease-induced cellular changes. Consequently, tumour cell-specific EVs are emerging as a potent source of cancer biomarkers because they carry bioactive molecules (proteins, lipids and RNA) that reflect the malignant behaviour of the cells they originate from [10]. Some studies have also reported the presence of double stranded genomic DNA (gDNA) in diverse types of EVs [11]. Results from one of the first studies on DNA in EVs demonstrated that different EV populations (apoptotic bodies, microvesicles and exosomes) harbour either TP53 or PTEN mutations [12], suggesting specific EV types might package different parts of the genome. EVs can also carry mitochondrial DNA, retrotransposons and oncogenes (i.e. c-Myc) [13–15]. Additional studies indicated that the release of small EVs (S-EVs) containing gDNA is driven by specific oncogenes, which are functionally transferred to target cells via EVs [16]. Later reports discovered that exosomes (Exo) contain entire genomes with large fragments (<10,000 bp [base pair]) of dsDNA and carry mutations of parental tumour cells [11,17,18]. These data suggest diagnostic and prognostic value for EV DNA. However, a detailed comparison of gDNA content, quality and distribution in S-EVs and L-EVs derived from cultured tumour cells or patient plasma has never been performed.
Liquid biopsies offer minimally invasive and practical clinical tools [19,20]. Advancements in sequencing technologies have enabled the analysis of the genomic landscape of cancer using circulating cell-free DNA (cfDNA) and circulating tumour cells (CTCs). Furthermore, liquid biopsies may overcome the limitation of tissue biopsies to capture the tumour heterogeneity and the dynamic evolution of cancer genomes. cfDNA has been used for non-invasive screening of chromosomal alterations in the circulation [21,22]. However, CTCs are rare in most cancer types and cfDNA is fragmented (~160 bp). Moreover, cfDNA in early stage PCa and during treatment response might underrepresent the cancer genome thus limiting the sensitivity of standard DNA analyses for detection of tumour-specific genomic alterations.
Given the increasing interest in the heterogeneity of EVs, and our identification of LO, we hypothesized that they might have distinct advantages as a source of cancer-derived DNA. Importantly, LO are 1000 times the size of Exo by volume, harbour distinct molecular cargo when compared to Exo and are tumour-specific [23]. In this study, we purified and characterized the DNA in L-EVs (surrogate of LO) and S-EVs (surrogate of Exo) from the same cancer cell source as well as from PCa mouse and patient plasma. L-EVs emerged as the EV subpopulation containing most of the circulating DNA. We then quantified high molecular weight, chromatinized DNA in EVs. Using whole genome sequencing (WGS), we analysed the genomic make-up of L-EVs. We then established recovery efficiency of the EV DNA from human plasma. Finally, we quantified genomic aberrations in L-EVs from plasma collected from a mouse model and from patients with mCRPC.
Material and methods
Cell lines
All cell lines were obtained from American Type Culture Collection. Cell lines were incubated at 37°C in 5% CO2. PC3 cells were maintained in Dulbecco’s Modified Eagle Medium, with 1% PenStrep and 1% l-glutamine. U87 cells were maintained in Minimum Essential Medium supplemented with 10% FBS, 1% PenStrep and 1% l-glutamine. U2OS cells expressing histone H2B conjugated to green fluorescent protein (GFP (U2OS-H2B-GFP)) were generated using plasmid #11680 H2B-GFP (Addgene). The plasmid was transfected into U2OS cells and stably transfected cells were selected using 400 μg/ml Geneticin (G-418) (Gibco). U2OS-H2B-GFP cells were maintained in McCoy’s 5A Modified Media supplemented with 10% FBS and 400 μg/ml Geneticin.
Isolation and characterization of EVs from cell media
L-EVs and S-EVs were isolated from conditioned cell media of 25.5 × 10⁷ cells (234 ml) by differential centrifugation. Briefly, cells and debris were eliminated by centrifugation at 2800g for 10 min. For isolation of L-EVs, the supernatant was then centrifuged at 10,000g for 30 min. For isolation of S-EVs, the supernatant obtained after the 10,000g spin was subjected to additional centrifugation at 100,000g for 60 min. In select experiments, L-EV and S-EV preparations were further subjected to density gradient centrifugation using discontinuous iodixanol density gradient (Optiprep™), following deposition of EVs at the bottom of the tubes, as described previously [24]. Briefly, 60%, 50%, 40%, 30%, 25%, 15%, 10% and 5% solutions were made by diluting the stock solution of Optiprep™ (60% aqueous iodixanol, Sigma) in 0.25 M sucrose/0.9 M NaCl/120 mM HEPES, pH 7.4. L-EVs or S-EVs were mixed in the bottom layer before adding iodixanol solutions of decreasing density. Centrifugation was performed at 100,000g for 3 h 50 min at 4°C. EV-containing fractions corresponding to 1.10–1.15 g/ml densities were collected and washed in PBS. Resulting purified EVs were pelleted by centrifugation at 100,000g for 1 h at 4°C. In this case, the purified L- and S-EVs are referred to as LO and Exo, respectively.
Isolation and characterization of EVs from human plasma
L-EVs and S-EVs were isolated from human plasma samples (1 ml) by differential centrifugation as described above and previously reported [24]. The blood samples were collected in BD Vacutainer™ ACD tubes and processed within 2 h of phlebotomy. Plasma was prepared from blood by centrifugation at 2000g, 4°C, for 5 min, followed by another spin at 2000g, 4°C, for 5 min. All human subject research was performed under the IRB study #PRO00033050, approved by the Cedars Sinai Medical Center ethics review board. Informed consent was obtained from all subjects.
Tunable Resistive Pulse Sensing measurements
EV preparations derived from PC-3 cells were submitted to Tunable Resistive Pulse Sensing (TRPS) analysis using a qNano instrument (IZON Science, New Zealand) as described previously [25]. First, serial dilutions were prepared from each EV preparation. Subsequently, particle numbers were counted for 5 min using 5 mbar pressure and NP200 and NP4000 nanopore membranes stretched between 45 and 47 mm. Voltage was set in between 0.1 and 0.4 V in order to achieve a stable 120 nA current. Particle size histograms were recorded when root mean square noise was below 12 pA, particle rate in time was linear and at least 500 events were counted. Calibration was performed using known concentration of beads CPC100B (mode diameter: 110 nm), CPC200B (mode diameter: 203 nm) or CPC400E (mode diameter: 340 nm) and CPC2000C (mode diameter: 1900 nm) (all from IZON) diluted 1:1000 in 0.2 μm filtered PBS.
Western blotting
EVs were lysed and analysed by Western blotting using the following antibodies: rabbit monoclonal HSPA5 (BiP [C50B12], #3177, Cell Signaling, 1:1000 dilution), rabbit monoclonal CK18 [SP69] (ab93741, Abcam, 1:1000 dilution); mouse monoclonal CD81 (TAPA1 [M38], ab79559, Abcam, 1:1000 dilution).
DNA extraction and characterization
L- and S-EVs were treated with rDNase I (2 U/μl, DNA-Free Kit, Ambion) and Exonuclease III (200 U/μl, Thermofisher). For detergent pre-treatment (prior to treatment with nucleases), EVs were incubated at 55°C for 10 min in 2% Triton X-100. DNA digestion was performed according to manufacturer’s recommendations. EVs were incubated with RNase A (QIAGEN) and then resuspended in Buffer AL (DNeasy Blood and Tissue kit from QIAGEN) for DNA extraction. DNA quantity was measured using the High Sensitivity dsDNA Qubit Assay or ssDNA Qubit Assay (Invitrogen). DNA quality was assessed using the Bioanalyzer DNA High Sensitivity Chip Kit (Agilent). A volume of 100 ng of extracted DNA was evaluated by electrophoresis in 1% agarose gel; ethidium bromide stained gels were digitally acquired with a ChemiDoc MP Imaging system and analysed by Image Lab software.
Pulse field gel electrophoresis
EVs (or indicated number of donor cells) were resuspended in PBS, mixed with the equal volume of 1% low melting agarose and embedded into Plug Mold (BIO-RAD) as previously described [26]. Agarose plugs were then incubated in lysis buffer containing 1% SDS and 1 mg/ml proteinase K at 37°C for 24, 48 or 72 h and washed with TE buffer, before the plugs were treated with 1 mg/ml RNase A at 37°C for 1 h. Pulse field gel electrophoresis (PFGE) was carried out in 1% agarose gel with 0.5× TBE buffer using CHEF Mapper XA System (BIO-RAD). Optimal separation conditions, either between 4 kb and 2 Mb (Figures 1(a) and 5(c)) or between 1 kb and 200 kb (Figure 1(c)), were determined using auto-algorithm function. Gels were stained using SYBR-Gold Gel Stain (Invitrogen). Gel images were taken using ChemiDoc Touch Imaging System (BIO-RAD). Relative amounts of nucleic acids stain within a lane were quantified using Image Lab software (BIO-RAD).
Figure 1.
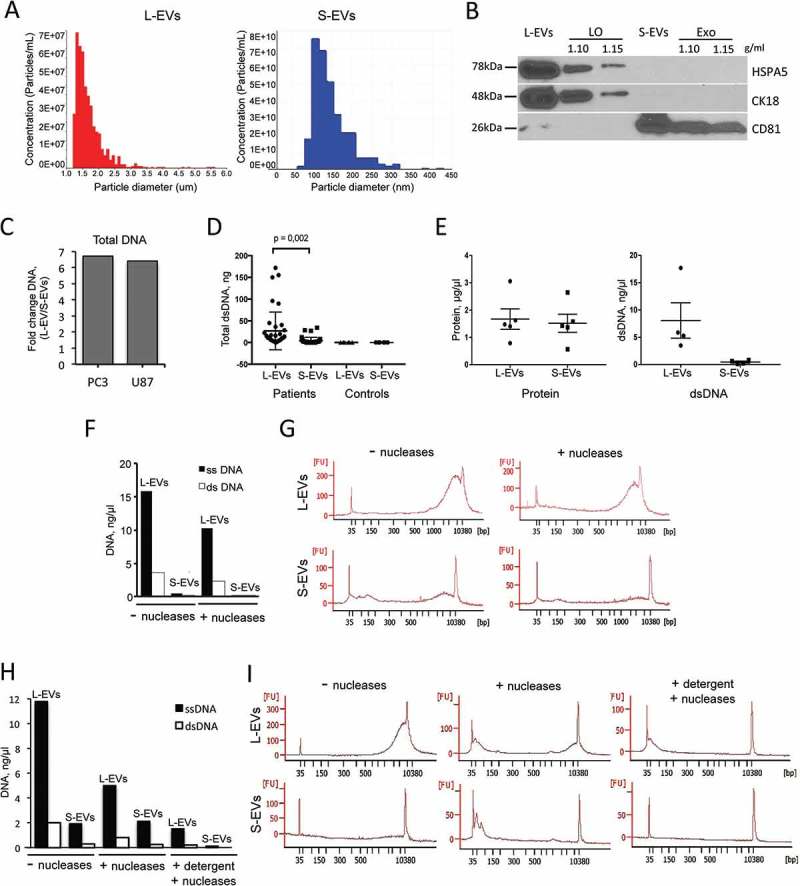
Most extracellular DNA is packaged into L-EVs. (a) Tunable resistive pulse sensing (TRPS, qNano) using two different pore membranes (NP4000 and NP200) identified as L-EVs (left) and S-EVs (right) derived from PC3 cells. NP4000 membrane, which can detect particles with a diameter between 1.0 and 6.0 μm, was used for quantitation of L-EVs, while NP200 membrane, which can detect particles with a diameter between 60 and 400 nm, was used for quantitation of S-EVs. (b) Protein lysates from L-EVs and S-EVs purified by iodixanol density gradient (at 1.10 and 1.15 g/ml) were blotted with LO markers HSPA5 and CK18, and with Exo marker CD81. (c) Total DNA was quantified by Qubit Fluorometer in L-EVs and S-EVs isolated from PC3 and U87 cell lines. The plot shows the DNA ratio between L-EVs and S-EVs. (d) Double stranded (ds)DNA was quantified by High Sensitivity (HS) dsDNA Qubit Assay in L-EVs and S-EVs isolated from 1 ml of plasma from patients with mCRPC (n = 40) and cancer-free individuals (n = 6). (e) Quantification of both protein and DNA content in L-EVs and S-EVs isolated from conditioned media of 12.6 × 10⁷ PC3 cells. (f) Single stranded (ss) and dsDNA in PC3-derived L-EVs and S-EVs, with or without treatment with DNase I and Exonuclease III, were quantified by Qubit. (g) Chip-based capillary electrophoresis (Bioanalyzer) showing the presence of dsDNA in PC3-derived L-EVs and S-EVs, with or without treatment with DNase I and Endonuclease III. L-EVs contain abundant DNA with a large peak around 10 kbp. Conversely, the amount of DNA in S-EVs is negligible. (h) ss- and dsDNA in PC3-derived L-EVs and S-EVs were quantified by Qubit after treatment with nucleases (DNase I and Exonuclease III) with or without addition of a detergent (Triton X-100) prior to nuclease treatment. (i) Chip-based capillary electrophoresis (Bioanalyzer) showing that only miniscule amounts of dsDNA could be detected after EV lysis using a detergent prior to treatment with nucleases.
Figure 2.
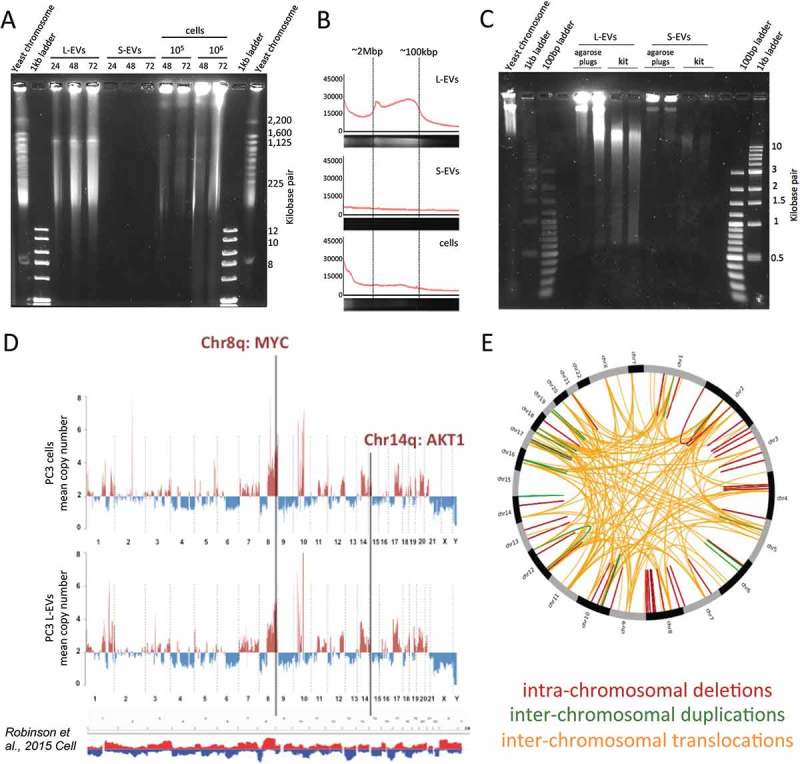
The DNA contained in L-EVs is of high molecular weight and mirrors the genetic make-up of their cells of origin. (a) PC3 L-EV and S-EV DNA were extracted in agarose plugs by incubation in lysis buffer for 24, 48 or 72 h, and high molecular weight DNA was resolved by pulse field gel electrophoresis (PFGE), which revealed that L-EVs contain large DNA fragments (100 kbp–2 Mbp). (b) Representative fluorescence intensity profiles of the gel lanes in G (48 h) containing L-EV DNA, S-EV DNA and cell DNA. (c) PC3 EV DNA was extracted in agarose plugs or using a commercially available kit (DNeasy Blood and Tissue kit, QIAGEN). Lower molecular weight DNA was resolved by PFGE, showing that EVs, and L-EVs in particular, contain mostly high molecular weight DNA, which is fragmented when it is extracted using a commercial kit. (d) DNA from PC3 cells and PC3-derived L-EVs was analysed by whole genome sequencing (WGS), which showed that somatic copy number variations (SCNV) detected in PC3 cells were accurately reflected in PC3-derived L-EVs. The profiles demonstrate copy number gains (above two copies, red) and losses (below two copies, blue) across all chromosomes. SCNVs were identified using read depth-based algorithm BIC-seq.; bin size 0.5 Mbp. The density of the reads was normalized using chromosome 2, which resulted to be the least aberrant chromosome. SCNV summary track at the bottom was obtained by Integrative Genomic Viewer (IGV) of 150 human mCRPC genomes [35] and shows that SCNV detected in PC3 cell line largely overlaps with SCNV detected in mCRPC patients. Copy number gains are marked in red and losses are marked in blue. (e) CIRCOS circular visualization of the indicated genomic rearrangements detected in both PC3 cells and PC3-derived L-EVs.
DNA staining and fluorescence microscopy
Hoechst staining
L-EVs were fixed and then incubated with Hoechst 33342 Working Solution (2.5 μg/ml) at room temperature for 5–10 min. After washing, L-EVs were imaged by a 40× objective with Olympus 1 × 51 using QCapture Pro6.0 software.
BrdU staining
U2OS-H2B-GFP cells, seeded in a 175-cm2 flask at 70% confluence and grown overnight, were stained with 5-bromo-2′-deoxy-uridine labelling and detection Kit II (Roche) for 24 h. The media was then collected and L-EVs extracted and resuspended in 100 µl filtered 1× PBS. After 30 min permeabilization with 0.02% Triton, the L-EVs sample was placed on a glass slide and incubated with anti-BrdU antibody overnight, prior to incubation with an anti-mouse secondary antibody (Invitrogen Alexa 568 goat anti-mouse 1:50 in PBS). After washing, the slide was imaged with a 40× objective on Olympus 1 × 51 using QCapture Pro6.0 software.
Whole Genome Sequencing (WGS)
DNA sequencing was performed at The Center for Cancer Computational Biology at Dana-Farber Cancer Institute. Additional quality control of gDNA was performed using the DNA Broad Range Qubit Assay (Invitrogen) and the Bioanalyzer DNA High Sensitivity Chip Kit (Agilent). Samples were sheared to 250 bp using the Covaris E220 instrument (Covaris) according to the manufacturer’s protocol. Library construction was performed using the NEB Next Ultra DNA Library Prep Kit for Illumina (NEB), with 50–100 ng of sheared DNA as input for each sample. Final library quality control was performed using the DNA High Sensitivity Qubit Kit (Invitrogen), the Bioanalyzer High Sensitivity Chip Kit (Agilent) and the 7900HT Fast qPCR machine (Applied Biosystems). qPCR was performed using the Illumina Universal Library Quantification Kit from KAPA Biosystems. DNA libraries were then normalized to 2 nM, pooled for multiplexing in equal volumes and sequenced at 10 pM on the Illumina HiSeq 2000. After alignment to the human genome (build version hg19/GRCh37), we used a clustering-based approach [27] to detect rearrangements. Within a sample, mapping densities were normalized to reads per million mapped reads to facilitate comparison between sets. To detect other structural variations, in particular somatic copy number variation (SCNV), bedGraph files were generated from the read mappings, and mean coverage was found in staggered windows across the genome. Human chromosome 2 (the least aberrant chromosome in PC3) [28] was taken as “normal” coverage, and the mean coverage for each window across the genome was found relative to the coverage of chromosome 2. Delly [29] was used to identify genomic rearrangements in the LO data using default parameter settings. We used Rcircos [30] to visualize the genomic rearrangements in a Circos plot.
DNA quantitation by digital PCR
The copy numbers (CNs) of MYC, AKT1, PTEN, PTK2 and KLF10 were measured in each gDNA sample using the QuantStudio™ 3D Digital PCR System (Life Technologies). The following Taqman probe assays were used: MYC (Hs00834648_cn), AKT1 (Hs02893205_cn), PTEN (Hs05128032_cn or Hs05149004_cn), PTK2 (Hs02817040_cn) and KLF10 (Hs02688075_cn). Digital PCR (dPCR) reactions were prepared and loaded into a QuantStudio™ 3D Digital PCR 20K chip according to manufacturer’s directions. The chips were then loaded onto the Dual Flat Block GeneAmp™ PCR System 7900 and PCR was performed using the following conditions: 10 min at 96°C followed by 45 cycles of 2 min at 60°C, and 30 s at 98°C followed by 2 min at 60°C. FAM and VIC images from each chip were then taken with the QuantStudio™ 3D Instrument and the raw data were analysed using the QuantStudio™ 3D AnalysisSuite Cloud Software. The CN of MYC, AKT1, PTEN, PTK2 and KLF10 was calculated using the following equation: TARGET GENE CN = (TARGET GENE copies/RNase P copies). The MYC/PTEN CN imbalance (ratio) was calculated as follows: MYC/PTEN CN imbalance = (MYC copies/PTEN copies).
In vivo mouse model of metastatic PC for plasma L-EV analyses
PC3 cells were engineered to stably overexpress luciferase (pCCL6-c-MNDU3c-LUC-PGK-EGFP lentiviral luciferase vector). The vector was a kind gift from Dr. H. Phillip Koeffler, Cedars Sinai Medical Center. PC3 cells stably overexpressing luciferase were isolated by GFP sorting using flow cytometry and intracardially injected into athymic nude mice (1x10⁷ cells/injection/mouse). For the control group, mice were injected with PBS. In order to weekly monitor tumour uptake and extension, mice underwent intraperitoneal injection of d-luciferin (3.2 mg/injection/mouse) and were subjected to bioluminescence imaging using IVIS Luminar XR (Caliper Lifesciences, Perkin Elmer, Waltham, MA) [31]. Bone localization of the tumour was also monitored by X-ray imaging. At week 8, all mice were sacrificed and the blood was collected as a terminal procedure from axillary vessels. All samples were collected in EDTA containing tubes and immediately centrifuged at 3000 rpm for 10 min at 4°C to obtain plasma, which was stored at −80°C for further experiments. Major organs as well as bones showing macroscopic signs of metastasis were harvested, formalin-fixed and embedded into paraffin blocks. Hematoxylin and eosin (H&E) tissue staining was performed at the Biobank & Translational Research Core at Cedars Sinai Medical Center.
Statistical analysis
Spearman’s correlation analysis (r) was used to determine the correlation between the numbers of reads mapping to regions of the human genome in L-EVs and donor cell DNAs. Two-tailed unpaired t-test was used to calculate statistical significance between MYC/PTEN copy number ratios in normal DNA versus patient L-EV DNA.
Results
Most extracellular DNA is packaged into L-EVs and is chromatinized
L-EVs and S-EVs from PC3 cells were analysed by TRPS, which showed a size range of ~1.0–5.5 μm for L-EVs and a size range of ~100–400 nm for S-EVs (Figure 3(a)). In order to determine if we could use L-EVs and S-EVs as surrogates for LO and Exo, we tested expression of specific markers of LO and Exo, obtained by floatation of L-EVs and S-EVs in discontinuous density gradients [24]. L-EVs expressed LO markers CK18 and HSPA5 [24], and S-EVs expressed CD81, which is typically enriched in Exo [3], suggesting that we can use L- and S-EVs as surrogates for LO and Exo (Figure 3(b)).
Figure 3.
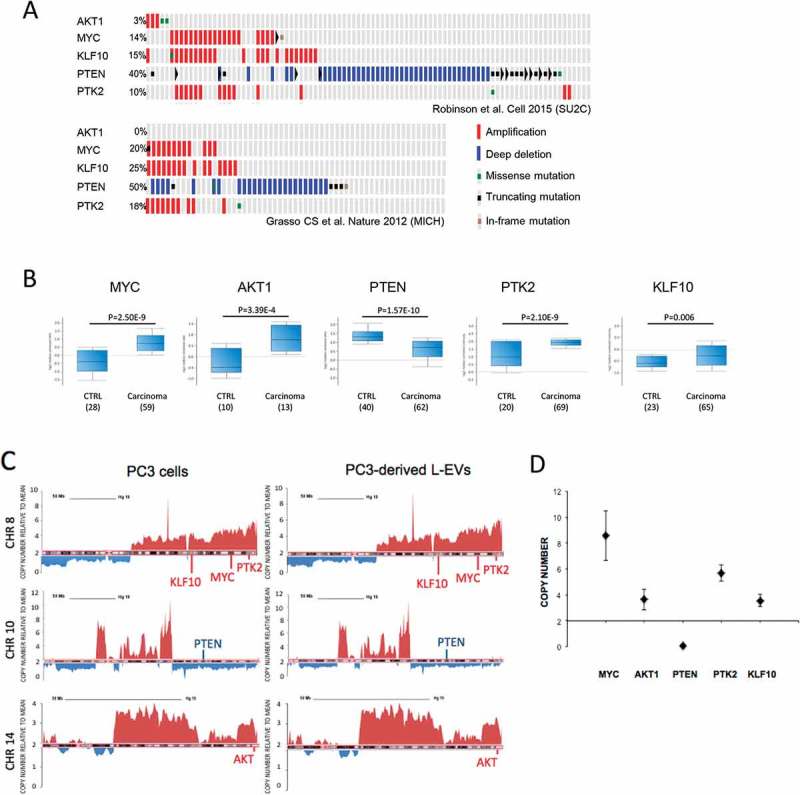
The DNA in PC3-derived L-EVs reports mCRCP-specific SCNV. (a) A subset of genes that are frequently amplified (MYC, AKT1, PTK2, KLF10) or deleted (PTEN) in patients with mCRPC, as identified by two independent studies [35,36] and in PC3 cells and derived L-EVs (Table 1). (b) mRNA levels of MYC, AKT1, PTK2 and KLF10 are upregulated in mCRPC patients versus controls except PTEN is downregulated, in line with genomic data. Analysis performed using Oncomine software. (c) Snapshots of linear profiles of chromosomes 8, 10 and 14 in PC3 cells and PC3-derived L-EVs showing the same large-scale amplifications or deletions. Spikes above 2, as indicated on Y-axis, represent chromosome amplifications, spikes below 2 – chromosome deletions. (d) SCNV of MYC, AKT1, PTEN, PTK2 and KLF10 was validated in PC3-derived L-EVs by dPCR. Copy number of each target gene was normalized to gene reference RNAse P. N = 3 for each data point.
DNA was extracted from L-EVs and S-EVs isolated from two different cancer cell lines: PC3 (PCa) and U87 (glioblastoma). L-EVs contained 6–7 times more DNA than S-EVs (Figure 3(c)). A similar pattern was observed in L-EVs and S-EVs isolated from plasma of mCRPC patients (n = 40). In fact, despite a pronounced inter-patient variability in the amount of EV DNA, L-EVs contained significantly more abundant DNA than S-EVs (Figure 3(d)). This result indicates that L-EVs represent the EV population containing most DNA not only when obtained from in vitro cultured tumour cells but also from patient plasma. Even though L-EVs are produced by cancer cells and we did not expect to find them in plasma of control subjects, we quantified the amount of DNA in L-EVs from plasma of cancer-free individuals. Our results showed complete absence of DNA not only in L-EVs from normal plasma but also in S-EVs (Figure 3(d)), corroborating previous findings that circulating L-EVs are cancer-specific and they are the EV population carrying most of the DNA [7,8].
We further characterized the DNA enclosed in PC3 cell-derived EVs. First, we found that differences in DNA content of L-EVs and S-EVs were not due to differences in total amount of cargo in L-EVs and S-EVs. Although L-EVs and S-EVs isolated from the same PC3 cells contained nearly equal amounts of protein, L-EVs contained consistently more DNA than S-EVs (Figure 3(e)), confirming that the DNA is included mostly in the L-EV fraction. Additionally, PC3 cell-derived EVs contained both single stranded (ss) and double stranded (ds) DNA at a 5:1 ratio, and the total amount of DNA was markedly higher in L-EVs (Figure 3(f)). To determine if EV DNA was enclosed within EVs or co-precipitated with them during the centrifugation, EVs were treated with DNAse I and Exonuclease III prior to lysis to digest extravesicular DNA. Following this treatment, the total amount of EV DNA was reduced by 35% in L-EVs and by 51% in S-EVs; however, the ssDNA:dsDNA ratio remained the same.
Chip-based capillary electrophoresis of the dsDNA extracted from L-EVs showed mostly large size dsDNA (~10,000 bp) (Figure 3(g), left upper panel). S-EVs contained small amounts of dsDNA and considerably lower amount of large-size dsDNA in comparison to L-EVs (Figure 3(g), left lower panel). As expected, treatment of both L-EVs and S-EVs with DNase prior to lysis resulted in decreased amount of DNA (Figure 3(g), right panels). These findings confirm that the majority of DNA enclosed in EVs is packaged in L-EVs.
To confirm that the DNA detected after treatment with nucleases was indeed protected by EV membranes and was not a result of incomplete digestion, L- and S-EVs were incubated with a detergent to lyse the EV membranes prior to nuclease treatment. In these conditions, only small residual amounts of DNA could be detected by the Qubit assay (Figure 3(h)). Chip-based capillary electrophoresis demonstrated that the DNA detected was highly fragmented, suggesting almost complete digestion of EV-associated DNA in these conditions (Figure 3(i)). They also suggest that a considerable amount of EV-associated DNA is attached to the EV surface, possibly due to electrostatic forces (Figure 3(f,h)).
The presence of large size DNA in L-EVs prompted us to determine if L-EV DNA is chromatinized. First, we checked if the DNA in L-EVs is associated with histones. L-EVs were isolated from U2OS cells (osteosarcoma cell line) stably transfected with a GFP-conjugated histone H2B (U2OS-H2B-GFP). GFP signal was detected in purified L-EVs (Figure S1A, B) in line with previous identification of histones in EVs [24,32]. In L-EVs stained with Hoechst, a fluorescent dye that binds to the minor groove of dsDNA (Fig. S1A), the GFP signal co-localized with Hoechst. Additionally, L-EVs obtained from U2OS-H2B-GFP cells labelled with 5-bromo-2-deoxyuridine (BrdU), a synthetic nucleoside that is incorporated in newly synthesized DNA, exhibited double positivity for BrdU and GFP (Fig. S1B). Finally, the presence of GFP DNA sequence in L-EVs was confirmed by PCR. A single band of the expected size was readily detectable in L-EVs, as well as in donor cells (Fig. S1C). qPCR showed that L-EVs contained about 60% of the GFP DNA compared to donor cells (Fig. S1D). Taken together, these results indicate that L-EVs contain histone-bound, chromatinized, large size gDNA.
DNA contained in L-EVs is of high molecular weight and mirrors the genetic make-up of their cells of origin
We were aware that DNA may be fragmented during DNA extraction [33] and that the working range of the Bioanalyzer chip used in the above experiments is limited in measuring DNA fragments larger than 10,000 bp. Therefore, in order to determine the size of un-sheared vesicular DNA, we lysed EVs directly in agarose plugs and resolved EV DNA by PFGE [26]. Resolution of high molecular weight DNA, which was possible with this method, revealed that L-EVs contain DNA fragments up to 2 Mega base pair (Mbp) (Figure 1(a)). In addition, DNA fragments in the size range of 100 Kbp–2 Mbp were enriched in L-EVs compared to whole cells and were undetectable in S-EVs (Figure 1(a,b)). This suggests a distinct process of DNA packaging in L-EVs. Resolution of lower molecular weight DNA using the same method demonstrated that the DNA extracted with the kit exhibited significantly smaller size (~10 kbp) than the un-sheared DNA extracted in agarose plugs, suggesting that the use of a commercial kit for DNA extraction shreds the DNA (Figure 1(c)).
Our results demonstrating that the DNA contained in L-EVs is chromatinized and has an unusually high molecular weight indicated that it is likely to derive from the gDNA of the cell of origin. Therefore, we performed WGS to compare the genomes of the L-EVs with the genome of the donor cancer cells. We obtained 83.9 million mapped reads (≥50 bp of length) from L-EV DNA which provides ~1.4× coverage. This is compatible with low-pass sequencing used to call large somatic aberrations in cfDNA [34] and enabled us to call somatic genomic alterations at a genome-wide scale. A strong correlation between the numbers of reads mapping to the human genome in L-EVs and donor cell DNA (r = 0.808, Spearman rank correlation, bin size 0.5 Mbp) indicated similar genome coverage in L-EVs and donor cells. The reads obtained using L-EV DNA covered the entire reference genome of their donor cells, spanning all chromosomes, with gene coding and intergenic regions (data not shown), suggesting that the L-EV genome is representative of the cell genome (Figure 1(d)). Moreover, SCNV, including amplifications and deletions, as well as all translocations detected in DNA isolated from L-EVs recapitulated the landscape of genomic alterations of their donor cells (Figure 1(d,e)). Large-scale chromosome amplifications were identified within chromosomes 7, 8, 14, 17 and 20, while chromosomes 4, 6, 9 and 21 had mostly large-scale deletions (Figure 1(d)). Notably, the genomes of PC3 cells and PC3 cell-derived L-EVs are similar to the summary of the genomic profiles of 150 patients with mCRPCs [35] (Figure 1(d)). These results demonstrate that (1) L-EV genomes can be analysed using low coverage sequencing, (2) the DNA included in L-EVs is a bona fide representation of the genome of the tumour cells that produced them.
DNA in PC3-derived L-EVs reports mCRPC-specific SCNV
We next investigated if SCNV observed in mCRPCs could be detected in L-EV DNA, using the PC3-derived L-EVs as a model. First, we compared PC3 whole genomes with the whole genomes of patients with mCRPC [35,36]. Of 31 genes that have been found altered in mCRPC (Fig. S2 A, B), 22 exhibited amplifications or deletions in both PC3 cells and PC3-derived L-EVs (Table 1). We focused on genes (MYC, PTEN, KLF10, PTK2 and AKT1 [Figure 4(a)]) that exhibit aberrations in 3–50% of mCRPC patients. These genomic aberrations result in altered mRNA expression levels in tumour versus normal tissues (Figure 4(b)). Additionally, three of these genes (MYC, KLF10 and PTK2) are located in a region of genomic instability on chromosome 8, which is associated with poor prognosis [37–39]. A detailed analysis of the chromosomal loci 8q, 10q and 14q, which harbour these genes, confirmed the presence of gross CN aberrations in both PC3 cells and L-EVs (Figure 4(c)). Moreover, discrete amplifications or deletions were detected at chromosomal loci 8q22.2, 8q24, 8q24.3, 10q23 and 14q32.32 – corresponding to chromosomal locations of these genes. Cancer-specific SCNV for the selected five genes was further validated by dPCR. MYC, KLF10, PTK2 and AKT1 were confirmed to be amplified, whereas PTEN was deleted (Figure 4(d)). Taken together, these results suggest that L-EV DNA reports cell-specific SCNV.
Table 1.
Genes commonly altered in mCRPC were equally amplified or deleted in both PC3 cells and PC3-derived L-EVs.
| Gene name | Location | Copy number in PC3 cell line | Copy number in PC3-LO |
|---|---|---|---|
| GPR39 | Chr 2 | 9.29 | 9.48 |
| REST | Chr 4 | 3.00 | 2.57 |
| SMAD1 | Chr 4 | 2.65 | 2.38 |
| PPARGC1B | Chr 5 | 3.90 | 3.89 |
| SKP2 | Chr 5 | 3.97 | 4.05 |
| CYP11B1 | Chr 8 | 5.82 | 5.95 |
| PTK2 | Chr 8 | 4.77 | 4.87 |
| KLF10 | Chr 8 | 4.53 | 4.63 |
| MYC | Chr 8 | 4.99 | 5.10 |
| WISP1 | Chr 8 | 5.37 | 5.48 |
| ZEB1 | Chr 10 | 1.29 | 1.31 |
| PTEN | Chr 10 | 0.43 | 0.42 |
| CUL5 | Chr 11 | 3.13 | 3.20 |
| FAR2 | Chr 12 | 4.17 | 4.25 |
| KRAS | Chr 12 | 1.37 | 1.40 |
| SMRT | Chr 12 | 3.23 | 3.30 |
| UBE3B | Chr 12 | 2.93 | 3.00 |
| AKT1 | Chr 14 | 3.26 | 3.33 |
| TIMM9 | Chr 14 | 3.47 | 3.55 |
| TP53BP1 | Chr 15 | 2.80 | 2.81 |
| UBE3A | Chr 15 | 2.90 | 2.90 |
| CDC27 | Chr 17 | 4.51 | 4.10 |
| MAP3K3 | Chr 17 | 3.70 | 3.78 |
| SP6 | Chr 17 | 4.02 | 4.10 |
| WNT3 | Chr 17 | 2.56 | 2.61 |
| THOC1 | Chr 18 | 2.55 | 2.61 |
| USP14 | Chr 18 | 2.55 | 2.61 |
| ROCK1 | Chr 18 | 2.45 | 2.50 |
| MUC16 | Chr 19 | 3.66 | 3.74 |
| KLK4 | Chr 19 | 3.13 | 3.20 |
| ACPT | Chr 19 | 3.13 | 3.20 |
Figure 4.
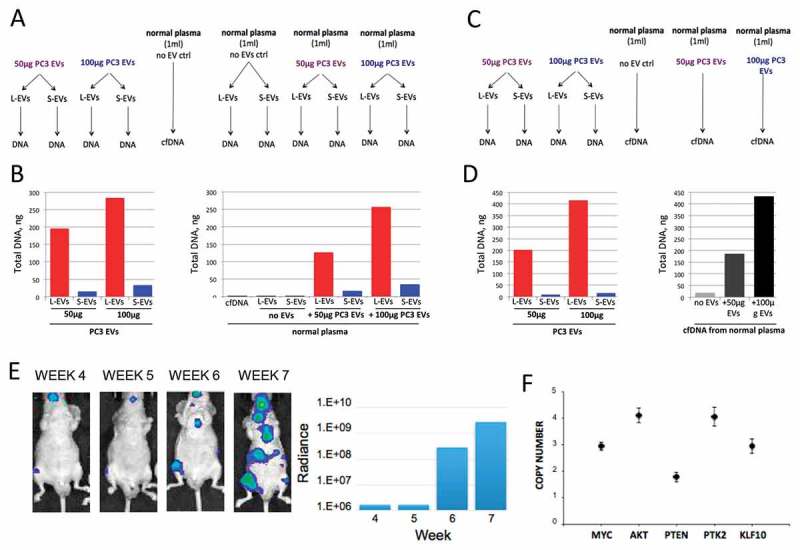
Extracellular DNA is enclosed mostly in L-EVs in plasma. (a) 50 or 100 μg of PC3 EVs was spiked in 1 ml of normal plasma. Plasma EVs were isolated, EV DNA was extracted and (b) quantified using HS dsDNA Qubit Assay. (c) 50 or 100 μg of PC3 EVs was spiked in 1 ml of normal plasma. Plasma cell-free (cf)DNA was extracted and (d) quantified using HS dsDNA Qubit Assay. (e) Representative bioluminescent images showing progressive bone and visceral metastasis following intracardial injection of 1 × 10⁷ luciferase-labelled PC3 cells in NOD/SCID mice (left). The bioluminescent signal was quantified weekly and was measured as radiance in p/sec/cm2/sr (right). (f) SCNV of MYC, AKT1, PTEN, PTK2 and KLF10 in plasma-derived L-EVs was assessed by dPCR, demonstrating that L-EVs in the plasma of a mouse model of bone metastases report tumour-specific SCNV. Copy number of each target gene was normalized to gene reference RNAse P. N = 3 for each data point.
Most of the extracellular DNA is recovered from the L-EV fraction in human and mouse plasma
The observation that L-EVs contain abundant gDNA from cancer cells prompted us to test if L-EV DNA can be efficiently recovered from the plasma of mCRPC patients, in an attempt to find clinically relevant information. To explore this possibility, and aware of the fact that our EV preps may also contain circulating material originating from benign cells, we first examined the efficiency of EV DNA recovery from human plasma under controlled experimental conditions.
Known amounts of L-EVs and S-EVs (equivalent to 50 and 100 μg of EV protein) were spiked into plasma (1 ml) of cancer-free individuals prior to L-EVs and S-EVs isolation or direct cfDNA extraction (Figure 5(a,c)). Comparison of DNA obtained from L-EVs and S-EVs before and after spiking them into the plasma demonstrated that plasma-derived EV DNA is efficiently recovered and its amount is proportional to the amount of spiked in DNA (Figure 5(b)). Recovery efficiency for plasma-derived EV DNA was found to be equivalent to recovery efficiency for total cfDNA extracted from the spiked plasma samples (Figure 5(b,d)), suggesting that most of the extracellular DNA is recovered from L-EV fraction. Additionally, the amount of DNA in L-EVs from cancer-free individuals was negligible.
Figure 5.
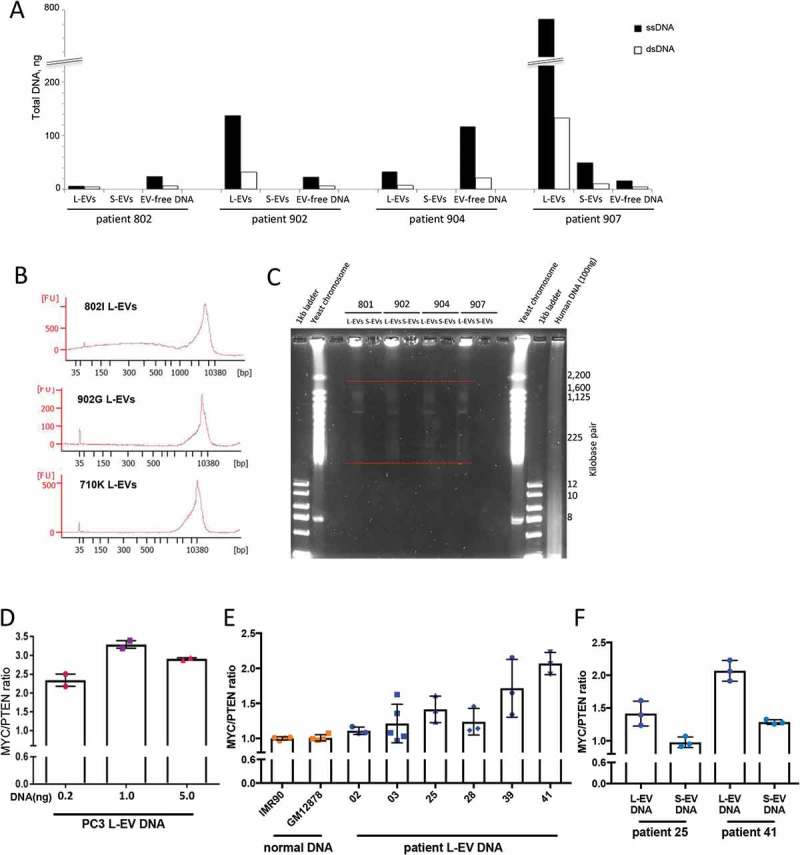
L-EVs isolated from plasma of mCRPC patients contain large size DNA with tumour aberrations. (a) DNA quantitation in plasma-derived L-EVs and S-EVs, as well as EV-free DNA obtained from mCRPC patients (n = 4) indicates that a significant portion of circulating DNA is enclosed in L-EVs. The EV-free DNA was extracted from EV-depleted plasma. (b) Chip-based capillary electrophoresis (Bioanalyzer) showing that L-EVs isolated from 1 ml of mCRPC patient plasma (n = 3) contain high-quality, large size DNA. (c) EVs were isolated from 1 ml of plasma obtained from mCRPC patients (n = 4), EV DNA was extracted in agarose plugs by incubation in lysis buffer for 48 h, and high molecular weight DNA was resolved by PFGE. Similar to L-EVs in vitro, patient plasma-derived L-EVs contain high molecular weight DNA (100 kbp–2 Mbp) (indicated by red dashed lines). (d) MYC/PTEN copy number imbalance in PC3 L-EVs was analysed by digital PCR (dPCR) using different amounts of DNA template. (e) MYC/PTEN copy number imbalance was evaluated in L-EVs isolated from 1 ml of mCRPC patient plasma (n = 6) and compared to MYC/PTEN copy number in normal DNA extracted from the indicated benign cell lines. *p < 0.05; **p < 0.01; ***p < 0.001. (f) MYC/PTEN copy number imbalance was evaluated in S-EVs matching selected L-EVs (patients 25 and 41). The copy number imbalance was undetectable (patient 25) or significantly lower (patient 41) in S-EVs compared to L-EVs.
Finally, we examined if tumour-derived EV DNA could be recovered from mouse plasma. We used plasma from a mouse model of PCa metastatic to the lung and shedding L-EVs [8,24]. Circulating L-EVs and S-EVs were isolated from mouse plasma and DNA extracted from both EVs and from the supernatants remaining after EV isolation (EV-free DNA). L-EVs contained several fold more ssDNA and dsDNA than S-EVs or EV-free DNA, indicating that most of the extracellular DNA in the circulation of mice with metastasis is enclosed in L-EVs (Fig. S3A) – in agreement with the above in vitro data (Figure 3). Also in line with our in vitro data, a ssDNA:dsDNA ratio of 5:1 was observed in these plasma EVs (Figure 3(e) and S3A). These results confirm that most of the extracellular DNA is in L-EVs and that circulating EV DNA can be readily recovered from plasma.
L-EVs in plasma of mice with PCa bone metastasis report tumour-specific SCNV
Having demonstrated that EV DNA can be efficiently and reproducibly recovered from human and mouse plasma, we next set out to identify tumour-specific SCNV in L-EVs in vivo. Because our WGS data showed a striking similarity of SCNV in PC3 cells and PC3-derived L-EVs, we used this model to determine whether select PC3 SCNV can be found in L-EVs isolated from mouse plasma. NOD/SCID mice (n = 6) were intracardially injected with luciferase-labelled PC3 cells. From week 4 onward, metastasis rate was assessed by weekly measurements of luciferin signal, which showed a gradual increase in the number and size of visceral and bone metastases (Figure 5(e), S3B). At 7–8 weeks, animals were sacrificed and 0.5 ml plasma obtained from each mouse. H&E staining of the bone metastasis tissue displayed large extracellular vacuoles morphologically reminiscent of L-EVs (Fig. S3C), suggesting that they can be shed as L-EVs from the tumour into the plasma.
L-EVs and S-EVs were isolated from the plasma of these mice, and L-EV DNA tested by dPCR for the specific SCNV that had been found in both PC3 cells and derived L-EVs: MYC, AKT1, PTEN, PTK2 and KLF10. MYC, AKT1, PTK2 and KLF10 were amplified, as expected (Figure 5(f)); however, their CN in vivo appeared to be generally lower compared to their respective CN in vitro (Figure 4(d)). Surprisingly, we could not detect PTEN deletion in plasma-derived L-EVs. This might be due to non-specific binding of the human-specific dPCR probes to mouse sequences, which would “dilute” the tumour signal for the amplified genes (MYC, AKT1, PTK2 and KLF10) and generate a “false-positive” signal for the deletion (PTEN). These results, collectively, suggest that gene amplifications of the tumour cells are reported in L-EVs in vivo even if the signal is diluted. Furthermore, circulating L-EVs might report tumour-specific SCNV in patients with mCRPC.
L-EVs isolated from plasma of mCRPC patients contain large size DNA with tumour aberrations
Circulating L-EVs and S-EVs were isolated from 1 ml of mCRPC patient plasma (n = 4), prior to DNA extraction from both fractions. DNA was also extracted from the EV supernatants (EV-free DNA). Quantification of the DNA in each fraction confirmed inter-patient variability, but nevertheless, L-EVs consistently contained more DNA than S-EVs (Figure 2(a)), corroborating our findings in this study (Figure 3(d)) and previous reports [7,8]. Also in line with our in vitro and in vivo results, the ssDNA:dsDNA ratio was 5:1 in three out of four patients (Figure 2(a)). Interestingly, the amount of EV-free DNA was comparable to or higher than the amount of DNA in L-EVs in 2 patients (Figure 2(a), patients 802 and 904, respectively). A number of physiological and pathological conditions apart from cancer are known to elevate circulating cfDNA levels in plasma [40]. Therefore, a higher amount of EV-free DNA in the two mCRPC patients could result from any other clinical/physiological condition they had at the time of the blood draw.
We further characterized plasma-derived L-EV dsDNA by chip-based capillary electrophoresis, which revealed that L-EVs contain large-size DNA (Figure 2(b)), – in line with our in vitro results (Figure 3(f)). We next analysed the high molecular weight DNA contained in plasma-derived EVs using PFGE. Even though the amount of EV DNA obtained from 1 ml of plasma was significantly lower than the amount of DNA in our in vitro system, the size of the intact DNA in plasma-derived L-EVs was in the size range of 100 kbp–2 Mbp (Figure 2(c)), replicating our in vitro findings (Figure 3(g)). The amount of DNA in S-EVs was, again, undetectable (Figure 2(c)).
Finally, we analysed cancer-specific SCNV in L-EVs using dPCR. To be able to detect tumour-specific SCNV in L-EVs from patient plasma, we modified our dPCR strategy. We reasoned that analysing the CN ratio between the amplified versus deleted genes rather than absolute numbers would increase the signal-to-noise ratio and enable us to detect tumour-specific SCNV in plasma L-EVs. To explore this possibility, we quantified the CN ratio of MYC and PTEN, which are most frequently amplified (MYC) and deleted (PTEN) in mCRPC. In normal DNA, this ratio equals 1, as both genes are present in two copies. In contrast, in tumour DNA, this ratio is expected to be above 1 due to CN imbalance: MYC amplification or/and PTEN deletion. Such an assay, if successfully developed, could potentially detect SCNV in a wide range of PCa.
We first evaluated the MYC/PTEN CN imbalance in PC3 L-EVs. In PC3 cells, MYC is amplified and PTEN is homozygously deleted from inside the intron 2 and onward (towards the telomere) but retains the part of the gene covering exons 1 and 2, and intron 1 (Fig. S4A). Therefore, using a PTEN probe designed for intron 1, the MYC/PTEN ratio could be quantified in PC3 L-EVs. Because the amount of L-EV DNA that can be obtained from 1 ml of patient plasma is often limited, in order to check accuracy of detecting the CN imbalance using low amounts of DNA template, we used different amounts of PC3 L-EV DNA to test the MYC/PTEN imbalance. The MYC/PTEN ratio was consistent between duplicates with 5 and 1 ng template DNA (Figure 2(d)). However, the ratio was significantly lower when 0.2 ng of template DNA was used, suggesting that the MYC/PTEN CN imbalance might not be detected reliably if less than 1 ng of L-EV DNA is used for the assay.
We then analysed the MYC/PTEN CN imbalance in circulating EVs obtained from mCRPC patients (n = 6). In four out of six S-EV samples, the amount of DNA was undetectable (not shown), corroborating our findings that most of the DNA is contained in L-EVs. We quantified MYC/PTEN ratio in L-EV DNA and compared it to DNA obtained from benign cells (Fig. S4B). As expected, the MYC/PTEN ratio equalled 1 in normal DNA; in contrast, it was found to be above 1 in all patient samples (Figure 2(e)). While the CN ratio was very consistent among the normal DNA replicates, there was a noticeable variation among the replicates in most patient-derived L-EV samples (Figure 2(e)).
In addition, we analysed the MYC/PTEN imbalance in the two S-EV DNA samples in which DNA was measurable, and for which we had matching L-EV DNA samples. Importantly, the representation of the CN imbalance in the DNA in S-EVs was insignificant compared to L-EVs (Figure 2(f)). This could be due to a lower amount of DNA in S-EVs versus L-EVs. Taken together, these results indicate that circulating L-EVs report tumour-specific SCNV in patients with mCRPC and represent a source of tumour DNA that could be further analysed and clinically investigated.
Discussion
Extracellular DNA is present in the circulation both in free form and enclosed in EVs [11,17–19]. In this study, we demonstrate that, in comparison with S-EVs, L-EVs are the subpopulation of vesicles enriched in large size dsDNA. The pronounced discrepancy in the DNA content of L-EVs and S-EVs was even more obvious when the amount of DNA in L-EVs and S-EVs was compared to the relative amount of protein, which was very similar. Our data further indicate that the size of intact DNA in EVs is up to >2 Mbp and is associated with histones (H2B), suggesting the presence of intact chromosomal DNA in L-EVs. Our experiments identify L-EVs as the EV population that contains most of the extracellular DNA not only in vitro but also in the patient plasma and that these L-EVs contain the entire genome of the cell of origin and report cancer-specific genomic alterations (MYC/PTEN imbalance).
This is the first study that analyses EV-associated DNA in L-EVs and S-EVs and compares its abundance with the EV-free DNA in plasma. Our results indicate that the amount of DNA enclosed in EVs is largely variable. Additionally, L-EV-associated DNA cannot be detected in plasma from healthy subjects, suggesting that L-EV DNA does not derive from platelets or other blood cellular component.
In our study, which is the first, to the best of our knowledge, that compares the amount of ssDNA and dsDNA in EVs, we found that the ssDNA is consistently more represented than dsDNA in all plasma fractions, as well as in vitro. We suspect that this result might have biological significance, and its nature might be investigated in future studies. However, given a remarkable consistency of the ssDNA:dsDNA ratio, the relative abundance of ssDNA may be also due to denaturation of dsDNA during DNA extraction by high temperature, alkaline conditions, high salt concentrations and mechanical shearing [41].
Using an approach that allows to estimate the size of the intact DNA fragments in EVs, we showed that L-EVs contain unusually high molecular weight DNA. This is the first DNA evaluation directly in intact EVs. Similar size DNA has been reported to derive from DNA damage and likely chromosomal fragmentation that occurs in micronuclei, which can induce chromothripsis [42]. Chromothripsis consists of massive clustered chromosomal rearrangements usually involving one chromosome. This process can induce the formation of double minute chromosomes, which are extrachromosomal circular DNA structures harbouring amplified oncogenes [43–46]. Given the size of L-EVs and their tumour-specific origin, it seems plausible that the extrachromosomal DNA from the cytosol of cancer cells is loaded in L-EVs forming at the plasma membrane. This hypothesis, although speculative, is supported by our data showing that L-EV DNA is chromatinized. However, the molecular mechanisms of DNA loading into EVs are largely unknown and need to be further explored. The nature of L-EV DNA could be interrogated by sequencing the high molecular weight DNA strands, which are uniquely present in L-EVs, to investigate if they are enriched in particular sequences (e.g. amplified oncogenes). In addition, this might also provide some cues to L-EV biogenesis.
We questioned whether the amount of DNA in circulating L-EVs is proportional to disease progression in patients. We observed a pronounced variability in the amount of L-EV DNA from mCRPC patient plasma, with no correlation with disease progression. This might be due to technical limitations or intra-individual variability or to the small number of patient specimens examined in our study. This result is in apparent contrast with previous reports indicating that the number of L-EVs correlates with tumour progression [7]. However, an increased number of circulating L-EVs does not necessarily correspond to an increased DNA content, because perhaps not all L-EVs contain DNA. Furthermore, factors such as genomic instability [47,48], rather than EV number, might have a bigger impact on the amount of DNA in circulating EVs. Highly unstable tumour genomes would provide extrachromosomal DNA, which can then be loaded into L-EVs, ultimately resulting in a subpopulation highly enriched in DNA.
In this work, we were able to detect MYC/PTEN CN imbalance in L-EVs isolated from 1 ml of patient plasma. For two patients (#02 and #28), tissue biopsy sequencing data confirmed MYC amplification and PTEN deletion. Although we did find MYC/PTEN imbalance in these two patients, CN ratio between the two genes was low compared to other samples in our subset of patients. This suggests the presence of both MYC amplification and PTEN deletion or the presence of a higher number of MYC copies in patients with higher ratios. Comparing MYC/PTEN CN ratio in matched plasma and tissue samples, or detection of MYC/PTEN CN ratio in plasma of patients with known mutational status for those two genes, would provide invaluable information on whether genomic profiling of DNA in circulating L-EVs is a viable alternative to tissue biopsy. Targeted sequencing could be employed to determine if candidate genes/oncogenes can be detected in L-EVs obtained from low amounts of plasma.
Our study adds a new dimension to liquid biopsy, which suggests clinical use of extracellular DNA circulating in L-EVs from patients with mCRPC. Moreover, resistance and treatment-induced lineage crisis of PCa tumours might impact L-EV profiles, increasing their potential use as liquid biopsies to monitor the progression of PCa patients with advanced cancer. It should be mentioned that the variability in the amount of circulating DNA can be even higher in patients with early stage disease [49], as well as in patients undergoing radiotherapy [50]. Further investigation is necessary to shed light on the relationship between disease progression and the composition of the DNA cargo in L-EVs.
Despite growing interest and the recognized relevance of circulating DNA for liquid biopsy-based diagnostics, the molecular mechanisms by which DNA is exported into extracellular environment remain obscure. Our results consistently suggest that L-EVs are a significant source of extracellular DNA, at least in PCa and that these particles could provide intact DNA shed by the tumour cells in the blood. Future studies are needed to elucidate the mechanism by which the DNA is packaged into the vesicles.
Funding Statement
This work was supported by the Foundation for the National Institutes of Health: [R01CA218526, Development Project from P50 CA092131] (to DDV); National Institutes of Health: [Cancer Center Support Grant P30 CA072720] (to SD); U.S. Department of Defense [BCRP Breakthrough Award W81XWH-18-1-0058] (to HT); US Department of Defense [PCRP Award PC150836] (to DDV).
Acknowledgements
We are grateful to Drs. Dhong Hyun Lee, Umberto Foresta, and Chia-Yi Chu for technical assistance with the animal experiment and Kyle Smith for technical assistance with computation, to Izon Science (Anoop Pal) for the TRPS. We are also grateful to Drs. David Lyden, Janusz Rak, Mariana Reis-Sobreiro and Mirja Rotinen for helpful discussions.
Disclosure statement
No potential conflict of interest was reported by the authors.
Geolocation
Cedars-Sinai Medical Center, Los Angeles, California.
Supplementary material
Supplemental data for this article can be accessed here.
References
- [1].Colombo M, Raposo G, Théry C.. Biogenesis, secretion, and intercellular interactions of exosomes and other extracellular vesicles. Annu Rev Cell Dev Biol. 2014;30:255–16. PubMed PMID: 25288114; eng. [DOI] [PubMed] [Google Scholar]
- [2].Raposo G, Stoorvogel W. Extracellular vesicles: exosomes, microvesicles, and friends. J Cell Biol. 2013February18;200(4):373–383. . PubMed PMID: 23420871; PubMed Central PMCID: PMCPMC3575529. [DOI] [PMC free article] [PubMed] [Google Scholar]
- [3].Kowal J, Arras G, Colombo M, et al. Proteomic comparison defines novel markers to characterize heterogeneous populations of extracellular vesicle subtypes. Proc Natl Acad Sci U S A. 2016February23;113(8):E968–77. PubMed PMID: 26858453; PubMed Central PMCID: PMCPMC4776515. [DOI] [PMC free article] [PubMed] [Google Scholar]
- [4].Lotvall J, Hill AF, Hochberg F, et al. Minimal experimental requirements for definition of extracellular vesicles and their functions: a position statement from the International Society for Extracellular Vesicles. J Extracell Vesicles. 2014;3:26913 PubMed PMID: 25536934; PubMed Central PMCID: PMCPMC4275645. [DOI] [PMC free article] [PubMed] [Google Scholar]
- [5].Witwer KW, Buzas EI, Bemis LT, et al. Standardization of sample collection, isolation and analysis methods in extracellular vesicle research. J Extracell Vesicles. 2013;2 PubMed PMID: 24009894; PubMed Central PMCID: PMCPMC3760646 DOI: 10.3402/jev.v2i0.20360 [DOI] [PMC free article] [PubMed] [Google Scholar]
- [6].Di Vizio D, Kim J, Hager MH, et al. Oncosome formation in prostate cancer: association with a region of frequent chromosomal deletion in metastatic disease. Cancer Res. 2009July1;69(13):5601–5609. PubMed PMID: 19549916; PubMed Central PMCID: PMCPMC2853876. [DOI] [PMC free article] [PubMed] [Google Scholar]
- [7].Di Vizio D, Morello M, Dudley AC, et al. Large oncosomes in human prostate cancer tissues and in the circulation of mice with metastatic disease. Am J Pathol. 2012November;181(5):1573–1584. PubMed PMID: 23022210; PubMed Central PMCID: PMCPMC3483805. [DOI] [PMC free article] [PubMed] [Google Scholar]
- [8].Hager MH, Morley S, Bielenberg DR, et al. DIAPH3 governs the cellular transition to the amoeboid tumour phenotype. EMBO Mol Med. 2012August;4(8):743–760. PubMed PMID: 22593025; PubMed Central PMCID: PMCPMC3494074. [DOI] [PMC free article] [PubMed] [Google Scholar]
- [9].Morello M, Minciacchi VR, De Candia P, et al. Large oncosomes mediate intercellular transfer of functional microRNA. Cell Cycle. 2013November15;12(22):3526–3536. PubMed PMID: 24091630; PubMed Central PMCID: PMCPMC3906338. [DOI] [PMC free article] [PubMed] [Google Scholar]
- [10].Ciardiello C, Cavallini L, Spinelli C, et al. Focus on extracellular vesicles: new frontiers of cell-to-cell communication in cancer. Int J Mol Sci. 2016February6;17(2):175 PubMed PMID: 26861306; PubMed Central PMCID: PMCPMC4783909. [DOI] [PMC free article] [PubMed] [Google Scholar]
- [11].Thakur BK, Zhang H, Becker A, et al. Double-stranded DNA in exosomes: a novel biomarker in cancer detection. Cell Res. 2014June;24(6):766–769. PubMed PMID: 24710597; PubMed Central PMCID: PMCPMC4042169. [DOI] [PMC free article] [PubMed] [Google Scholar]
- [12].Lazaro-Ibanez E, Sanz-Garcia A, Visakorpi T, et al. Different gDNA content in the subpopulations of prostate cancer extracellular vesicles: apoptotic bodies, microvesicles, and exosomes. Prostate. 2014October;74(14):1379–1390. PubMed PMID: 25111183; PubMed Central PMCID: PMCPMC4312964. [DOI] [PMC free article] [PubMed] [Google Scholar]
- [13].Balaj L, Lessard R, Dai L, et al. Tumour microvesicles contain retrotransposon elements and amplified oncogene sequences. Nat Commun. 2011February1;2:180 PubMed PMID: 21285958; PubMed Central PMCID: PMCPMC3040683. [DOI] [PMC free article] [PubMed] [Google Scholar]
- [14].Guescini M, Genedani S, Stocchi V, et al. Astrocytes and Glioblastoma cells release exosomes carrying mtDNA. J Neural Transm (Vienna). 2010January;117(1):1–4. PubMed PMID: 19680595. [DOI] [PubMed] [Google Scholar]
- [15].Skog J, Wurdinger T, Van Rijn S, et al. Glioblastoma microvesicles transport RNA and proteins that promote tumour growth and provide diagnostic biomarkers. Nat Cell Biol. 2008December;10(12):1470–1476. PubMed PMID: 19011622; PubMed Central PMCID: PMCPMC3423894. [DOI] [PMC free article] [PubMed] [Google Scholar]
- [16].Lee TH, Chennakrishnaiah S, Audemard E, et al. Oncogenic ras-driven cancer cell vesiculation leads to emission of double-stranded DNA capable of interacting with target cells. Biochem Biophys Res Commun. 2014August22;451(2):295–301. PubMed PMID: 25086355. [DOI] [PubMed] [Google Scholar]
- [17].Kahlert C, Melo SA, Protopopov A, et al. Identification of double-stranded genomic DNA spanning all chromosomes with mutated KRAS and p53 DNA in the serum exosomes of patients with pancreatic cancer. J Biol Chem. 2014February14;289(7):3869–3875. PubMed PMID: 24398677; PubMed Central PMCID: PMCPMC3924256. [DOI] [PMC free article] [PubMed] [Google Scholar]
- [18].Lee TH, Chennakrishnaiah S, Meehan B, et al. Barriers to horizontal cell transformation by extracellular vesicles containing oncogenic H-ras. Oncotarget. 2016August9;7(32):51991–52002. PubMed PMID: 27437771; PubMed Central PMCID: PMCPMC5239530. [DOI] [PMC free article] [PubMed] [Google Scholar]
- [19].Wyatt AW, Annala M, Aggarwal R, et al. Concordance of circulating tumor DNA and matched metastatic tissue biopsy in prostate cancer. J Natl Cancer Inst. 2017December1;109(12):78–86. PubMed PMID: 29206995. [DOI] [PMC free article] [PubMed] [Google Scholar]
- [20].Romanel A, Gasi Tandefelt D, Conteduca V, et al. Plasma AR and abiraterone-resistant prostate cancer. Sci Transl Med. 2015November4;7(312):312re10 PubMed PMID: 26537258. [DOI] [PMC free article] [PubMed] [Google Scholar]
- [21].Chiu EKL, Hui WWI, Chiu RWK. cfDNA screening and diagnosis of monogenic disorders - where are we heading? Prenat Diagn. 2018Jan5. doi: 10.1002/pd.5207 PubMed PMID: 29314147 [DOI] [PMC free article] [PubMed] [Google Scholar]
- [22].Cohen JD, Li L, Wang Y, et al. Detection and localization of surgically resectable cancers with a multi-analyte blood test. Science. 2018January18PubMed PMID: 29348365 DOI: 10.1126/science.aar3247. [DOI] [PMC free article] [PubMed] [Google Scholar]
- [23].Minciacchi VR, Spinelli C, Reis-Sobreiro M, et al. MYC mediates large oncosome-induced fibroblast reprogramming in prostate cancer. Cancer Res. 2017May1;77(9):2306–2317. PubMed PMID: 28202510. [DOI] [PubMed] [Google Scholar]
- [24].Minciacchi VR, You S, Spinelli C, et al. Large oncosomes contain distinct protein cargo and represent a separate functional class of tumor-derived extracellular vesicles. Oncotarget. 2015May10;6(13):11327–11341. PubMed PMID: 25857301; PubMed Central PMCID: PMCPMC4484459. [DOI] [PMC free article] [PubMed] [Google Scholar]
- [25].Vogel R, Willmott G, Kozak D, et al. Quantitative sizing of nano/microparticles with a tunable elastomeric pore sensor. Anal Chem. 2011May1;83(9):3499–3506. PubMed PMID: 21434639. [DOI] [PubMed] [Google Scholar]
- [26].Smith CL, Klco SR, Cantor C. Pulsed-field gel electrophoresis and the technology of large DNA molecules In: Dacis KE. editors In genome analysis, agris.fao.org; 1998. pp. 41–112. [Google Scholar]
- [27].Chen K, Wallis JW, McLellan MD, et al. BreakDancer: an algorithm for high-resolution mapping of genomic structural variation. Nat Methods. 2009September;6(9):677–681. PubMed PMID: 19668202; PubMed Central PMCID: PMCPMC3661775. [DOI] [PMC free article] [PubMed] [Google Scholar]
- [28].Aurich-Costa J, Vannier A, Gregoire E, et al. IPM-FISH, a new M-FISH approach using IRS-PCR painting probes: application to the analysis of seven human prostate cell lines. Genes Chromosomes Cancer. 2001February;30(2):143–160. PubMed PMID: 11135431. [PubMed] [Google Scholar]
- [29].Rausch T, Zichner T, Schlattl A, et al. DELLY: structural variant discovery by integrated paired-end and split-read analysis. Bioinformatics. 2012September15;28(18):i333–i339. PubMed PMID: 22962449; PubMed Central PMCID: PMCPMC3436805. [DOI] [PMC free article] [PubMed] [Google Scholar]
- [30].Zhang H, Meltzer P, Davis S. RCircos: an R package for Circos 2D track plots. BMC Bioinformatics. 2013August10;14:244. [DOI] [PMC free article] [PubMed] [Google Scholar]
- [31].Nanjo S, Nakagawa T, Takeuchi S, et al. In vivo imaging models of bone and brain metastases and pleural carcinomatosis with a novel human EML4-ALK lung cancer cell line. Cancer Sci. 2015March;106(3):244–252. PubMed PMID: 25581823; PubMed Central PMCID: PMCPMC4376432. [DOI] [PMC free article] [PubMed] [Google Scholar]
- [32].Kruger S, Abd Elmageed ZY, Hawke DH, et al. Molecular characterization of exosome-like vesicles from breast cancer cells. BMC Cancer. 2014January27;14:44 PubMed PMID: 24468161; PubMed Central PMCID: PMCPMC3936808. [DOI] [PMC free article] [PubMed] [Google Scholar]
- [33].Denham J, Marques FZ, Charchar FJ. Leukocyte telomere length variation due to DNA extraction method. BMC Res Notes. 2014December4;7:877. [DOI] [PMC free article] [PubMed] [Google Scholar]
- [34].Mohan S, Heitzer E, Ulz P, et al. Changes in colorectal carcinoma genomes under anti-EGFR therapy identified by whole-genome plasma DNA sequencing. PLoS Genet. 2014March;10(3):e1004271 PubMed PMID: 24676216; PubMed Central PMCID: PMCPMC3967949. [DOI] [PMC free article] [PubMed] [Google Scholar]
- [35].Robinson D, Van Allen EM, Wu YM, et al. Integrative clinical genomics of advanced prostate cancer. Cell. 2015May21;161(5):1215–1228. PubMed PMID: 26000489; PubMed Central PMCID: PMCPMC4484602. [DOI] [PMC free article] [PubMed] [Google Scholar]
- [36].Grasso CS, Wu YM, Robinson DR, et al. The mutational landscape of lethal castration-resistant prostate cancer. Nature. 2012July12;487(7406):239–243. PubMed PMID: 22722839; PubMed Central PMCID: PMCPMC3396711. [DOI] [PMC free article] [PubMed] [Google Scholar]
- [37].El Gammal AT, Bruchmann M, Zustin J, et al. Chromosome 8p deletions and 8q gains are associated with tumor progression and poor prognosis in prostate cancer. Clin Cancer Res. 2010January1;16(1):56–64. doi: 10.1158/1078-0432.CCR-09-1423 PubMed PMID: 20028754. [DOI] [PubMed] [Google Scholar]
- [38].Fromont G, Godet J, Peyret A, et al. 8q24 amplification is associated with Myc expression and prostate cancer progression and is an independent predictor of recurrence after radical prostatectomy. Hum Pathol. 2013August;44(8):1617–1623. PubMed PMID: 23574779. [DOI] [PubMed] [Google Scholar]
- [39].Reinhardt D, Helfand BT, Cooper PR, et al. Prostate cancer risk alleles are associated with prostate cancer volume and prostate size. J Urol. 2014June;191(6):1733–1736. PubMed PMID: 24345439; PubMed Central PMCID: PMCPMC4107200. [DOI] [PMC free article] [PubMed] [Google Scholar]
- [40].Tong Y-K, Lo YM. Diagnostic developments involving cell-free (circulating) nucleic acids. Clin Chim Acta. 2006January;363(1–2):187–196. . PubMed PMID: 16126188. [DOI] [PubMed] [Google Scholar]
- [41].Wang X, Lim HJ, Son A. Characterization of denaturation and renaturation of DNA for DNA hybridization. Environ Health Toxicol. 2014;29:e2014007 PubMed PMID: 25234413; PubMed Central PMCID: PMCPMC4168728. [DOI] [PMC free article] [PubMed] [Google Scholar]
- [42].Zhang CZ, Spektor A, Cornils H, et al. Chromothripsis from DNA damage in micronuclei. Nature. 2015June11;522(7555):179–184. PubMed PMID: 26017310; PubMed Central PMCID: PMCPMC4742237. [DOI] [PMC free article] [PubMed] [Google Scholar]
- [43].Garsed DW, Marshall OJ, Corbin VD, et al. The architecture and evolution of cancer neochromosomes. Cancer Cell. 2014November10;26(5):653–667. PubMed PMID: 25517748. [DOI] [PubMed] [Google Scholar]
- [44].Rausch T, Jones DT, Zapatka M, et al. Genome sequencing of pediatric medulloblastoma links catastrophic DNA rearrangements with TP53 mutations. Cell. 2012January20;148(1–2):59–71. PubMed PMID: 22265402; PubMed Central PMCID: PMCPMC3332216. [DOI] [PMC free article] [PubMed] [Google Scholar]
- [45].Stephens PJ, Greenman CD, Fu B, et al. Massive genomic rearrangement acquired in a single catastrophic event during cancer development. Cell. 2011January7;144(1):27–40. PubMed PMID: 21215367; PubMed Central PMCID: PMCPMC3065307. [DOI] [PMC free article] [PubMed] [Google Scholar]
- [46].Von Hoff DD, Needham-VanDevanter DR, Yucel J, et al. Amplified human MYC oncogenes localized to replicating submicroscopic circular DNA molecules. Proc Natl Acad Sci U S A. 1988July;85(13):4804–4808. PubMed PMID: 3164477; PubMed Central PMCID: PMCPMC280524. [DOI] [PMC free article] [PubMed] [Google Scholar]
- [47].Gillies RJ, Verduzco D, Gatenby RA. Evolutionary dynamics of carcinogenesis and why targeted therapy does not work. Nat Rev Cancer. 2012June14;12(7):487–493. . PubMed PMID: 22695393; PubMed Central PMCID: PMCPMC4122506. [DOI] [PMC free article] [PubMed] [Google Scholar]
- [48].Cancer Genome Atlas Research N The molecular taxonomy of primary prostate cancer. Cell. 2015November5;163(4):1011–1025. PubMed PMID: 26544944; PubMed Central PMCID: PMCPMC4695400. [DOI] [PMC free article] [PubMed] [Google Scholar]
- [49].Allenson K, Castillo J, San Lucas FA, et al. High prevalence of mutant KRAS in circulating exosome-derived DNA from early-stage pancreatic cancer patients. Ann Oncol. 2017April1;28(4):741–747. PubMed PMID: 28104621. [DOI] [PMC free article] [PubMed] [Google Scholar]
- [50].Jelonek K, Widlak P, Pietrowska M. The influence of ionizing radiation on exosome composition, secretion and intercellular communication. Protein Pept Lett. 2016;23(7): 656–663. PubMed PMID: 27117741; PubMed Central PMCID: PMCPMC5029112. [DOI] [PMC free article] [PubMed] [Google Scholar]
Associated Data
This section collects any data citations, data availability statements, or supplementary materials included in this article.