

SUMMARY
In the small intestine, type 2 responses are regulated by a signaling circuit that involves tuft cells and group 2 innate lymphoid cells (ILC2). Here we identified the microbial metabolite succinate as an activating ligand for small intestinal (SI) tuft cells. Sequencing analyses of tuft cells isolated from the small intestine, gall bladder, colon, thymus, and trachea revealed that expression of tuft cell chemosensory receptors is tissue-specific. SI tuft cells expressed the succinate receptor (SUCNR1), and providing succinate in drinking water was sufficient to induce a multifaceted type 2 immune response via the tuft-ILC2 circuit. The helminth Nippostrongylus brasiliensis and a tritrichomonad protist both secreted succinate as a metabolite. In vivo sensing of the tritrichomonad required SUCNR1, whereas N. brasiliensis was SUCNR1-independent. These findings define a paradigm wherein tuft cells monitor microbial metabolites to initiate type 2 immunity, and suggest the existence of other sensing pathways triggering the response to helminths.
eTOC Blurb
Tuft cells have been proposed to act as immune sentinels in multiple tissues. Nadjsombati, McGinty et al. now show that detection of the microbial metabolite succinate by tuft cells in the small intestine is sufficient to induce a type 2 immune response, suggesting that tuft cells monitor microbial metabolites to initiate type 2 immunity.
INTRODUCTION
Innate immune sensing, involving the binding of microbially derived ligands to host receptors, is the fundamental first step in initiation of immune responses to microbes. This ligand-receptor paradigm was first proposed by Charles Janeway (Janeway, 1989), and soon borne out experimentally by the discovery of toll-like receptor 4, which binds bacterial lipopolysaccharide. In the last two decades, many more innate immune receptors have been discovered, virtually all of which recognize conserved ligands derived from viruses, bacteria, or fungi. As a result, our understanding of innate immune detection for these classes of pathogens is quite advanced. Much less is known about innate immune sensing of helminths, intestinal protists, and allergens, all of which can induce a type 2 immune response
Recently, we and others demonstrated that IL-25, which is critical for worm clearance (Fallon et al., 2006), is made exclusively by epithelial tuft cells (Gerbe et al., 2016; Howitt et al., 2016; von Moltke et al., 2016). Tuft cells initiate and drive a feed-forward immune signaling circuit that is required for innate and perhaps adaptive type 2 responses in the small intestine. In this circuit, tuft cell-derived IL-25 induces IL-13 production by group 2 innate lymphoid cells (ILC2s) in the lamina propria. IL-13 then signals in undifferentiated epithelial progenitors, biasing their lineage commitment towards goblet and tuft cells, the latter of which further promote ILC2 activation, resulting in the feed-forward loop that we will refer to as the tuft-ILC2 circuit. Since the entire intestinal epithelium is replaced every 5–7 days (Barker, 2014), the induction of IL-13 leads to rapid epithelial remodeling marked by goblet and tuft cell hyperplasia. Furthermore, production of IL-13, -5, and -9 by ILC2s promotes eosinophilia and other hallmarks of a type 2 immune response.
In most specific pathogen-free mice, activation of the tuft-ILC2 circuit is restrained and tuft cells are rare, representing <1% of all epithelial cells (Gerbe et al., 2016). However, flagellated protists of the Tritrichomonas genus are found in the intestinal flora of mice in many vivariums (Chudnovskiy et al., 2016; Escalante et al., 2016; Howitt et al., 2016), and at least one species of Tritrichomonas is known to activate the tuft-ILC2 circuit (Howitt et al., 2016). In addition, infection with helminths such as the hookworm Nippostrongylus brasiliensis leads to even greater activation of the circuit, and in this context tuft cell frequency increases about 10 fold within 7–9 days, corresponding to the time frame in which worms are cleared (von Moltke et al., 2016). However, while several lines of evidence support a role for tuft cells as drivers of a signaling circuit that initiates the intestinal type 2 immune response, how the circuit is activated, is unknown.
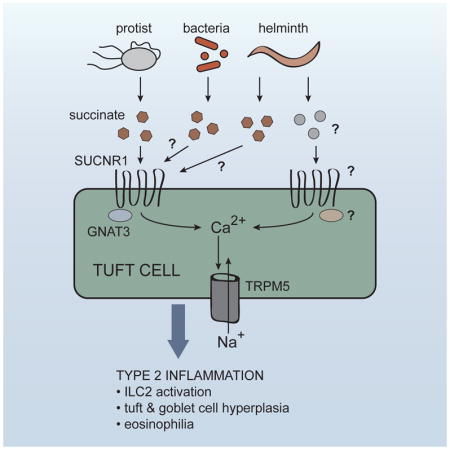
In 2008, Damak and colleagues analyzed the transcriptome of murine intestinal tuft cells, and confirmed earlier evidence that tuft cells encode a chemosensing pathway similar to the one that mediates taste sensation (Bezençon et al., 2008; Höfer et al., 1996). In taste buds, surface-expressed G protein-coupled taste receptors bind their ligands and activate a specialized alpha subunit called α-gustducin, encoded by the gene Gnat3. Gustducin in turn activates phospholipase C beta 2 (PLCB2) leading to release of intracellular Ca2+ stores, and sodium influx via the calcium-gated membrane channel TRPM5 (transient receptor potential cation channel subfamily M member 5). In taste cells, the resulting depolarization of the cell drives release of neuromediators that activate nearby nerve terminals (Chaudhari and Roper, 2010). How the effector functions of tuft cells are coordinated remains unclear, but components of this chemosensing pathway have been identified in tuft cells of numerous tissues. In particular, a Trpm5-GFP reporter mouse demonstrated that expression of Trpm5 in the intestinal tract is restricted to tuft cells (Bezençon et al., 2008).
Since expression of the TRPM5-dependent chemosensing pathway was first noted, evidence of a sensing function for tuft cells has mounted. Tuft cells of the airways and urethra express a subset of canonical taste receptors and have been shown to regulate smooth muscle contractions in response to bitter ligands and bacterial quorum-sensing molecules (Deckmann et al., 2014; Krasteva et al., 2011; Tizzano et al., 2010). In the intestine, tuft cell hyperplasia induced by a tritrichomonad was shown to require Trpm5 and Gnat3 (Howitt et al., 2016). Therefore, it has been widely postulated that tuft cells are immune sentinels, but a ligand(s) and receptor(s) that activate intestinal tuft cells and the tuft-ILC2 circuit remain unknown.
Here we found that sensing of the microbial metabolite succinate by tuft cells was sufficient to induce a type 2 immune response in vivo, and that succinate receptor-deficient mice fail to detect protist colonization. These findings define a paradigm of metabolite sensing in the initiation of type 2 immunity.
RESULTS
mRNA sequencing identifies a transcriptional tuft cell signature
To identify both unique and shared features of tuft cells in different tissues, we used IL-25 reporter mice (Flare25) to sort-purify CD45lo EPCAM+ Flare25+ tuft cells from the small intestine, gall bladder, colon, thymus, and trachea for mRNA sequencing. We also sorted CD45lo EPCAM+ Flare25− cells from the small intestine to serve as a non-tuft epithelial reference. Principal component analysis (PCA) of normalized mRNA sequencing reads clustered tuft cells from each tissue separately and also identified related features in tuft cells from the intestinal tract (gall bladder, small intestine, and colon) compared to those from the thymus and trachea (Figure 1A). The tissue-specific signature of each tuft cell population was also identifiable following hierarchical clustering of all differentially expressed genes (FDR < 0.01; absolute fold change > 8) (Figure 1B, Figure S1, and Table S1). Tuft cells from the thymus had the greatest number of differentially expressed genes and clustered farthest from other tuft cells by PCA, suggesting unique functions for this subset of tuft cells. Indeed, a recent study identified a role for thymic tuft cells in shaping T cell development (Miller et al., 2018).
Figure 1. RNA-Seq identifies a transcriptional tuft cell signature and a tissue-specific chemosensory receptor repertoire.

(A–I) Tuft cells (CD45lo EPCAM+ Flare25+) were sorted from small intestine (SI), gall bladder (Gall), colon (Col), trachea (Tra), and thymus (Thy) of naïve B6.Il25Flare25/Flare25 mice for mRNA sequencing. Non-tuft epithelial cells of the small intestine (SI Epi; CD45lo EPCAM+ Flare25−) were sorted as a negative control. (A) Principle component analysis of gene expression. (B) Hierarchical clustering of differentially expressed genes (fold change > 8; FDR < 0.01) among tuft cell subsets. (C) Ranked list of a tuft cell transcriptional signature (Log2 fold-change >4 in all tuft cells relative to SI Epi). (D–F) Normalized read count of indicated genes. G) Heat map of normalized read count of all taste receptors. (H–I) Normalized read count of indicated genes. (J) Indicated genes analyzed by RT-qPCR in small intestinal tuft cells (Flare25+) and non-tuft epithelial cells (Flare25−). A–I: biological replicates from one mRNA sequencing experiment. J: biological replicates pooled from three experiments. In A–I *, FDR < .05; ***, FDR < .001 by statistical analysis in RNAseq pipeline. In J *, p < 0.05; ***, p < 0.001 by multiple t-tests. n.s., not significant; n.d., not detectable. Graphs show mean + SEM. Also see Figure S1.
Next we used the mRNA sequencing data to define a transcriptional signature that is common to tuft cells across all tissues analyzed (Figure 1C and Item S2). As expected, this signature included Il25 and Pou2f3, the transcriptional regulator required for specification of the tuft cell lineage (Gerbe et al., 2016). Other tuft cell markers that were previously characterized in individual tissues, such as Dclk1, Ptgs1, Alox5, Ptprc (CD45), and Chat, were also included in our global tuft cell signature. To analyze this signature further, we performed GO Term and KEGG pathway enrichment analysis. The only significantly enriched GO Term among tuft cell signature genes was “intracellular signal transduction” (FDR < 0.05; Item S3), which includes genes like Plcb2, Plcg2, Nrgn, and Dclk1. KEGG pathway analysis further underscored the signaling capacity of tuft cells, identifying “Fc gamma R-mediated phagocytosis”, “Phosphatidylinositol signaling system”, and “B cell receptor signaling pathway” as significantly (FDR < 0.05) enriched in the tuft cell signature (Item S4); however, only the intracellular components and not the upstream receptors of these pathways were expressed in tuft cells.
The receptor repertoire of tuft cells is tissue-specific
Next, we specifically interrogated expression of the TRPM5-dependent chemosensing pathway that has been implicated in tuft cell function. Downstream intracellular components of the chemosensing pathway, such as Plcb2 and Trpm5, were included in the global tuft cell signature and were expressed across all tuft cell subsets (Figures 1C–E). Gnat3, the G alpha subunit that couples to taste receptors, also appeared in the global signature but its expression was more variable across tissues (Figures 1C, F). Canonical taste receptors, meanwhile, were completely absent in the tuft cell signature, suggesting tissue specific expression of receptors. As has been previously reported, a subset of canonical taste receptors (TasR) was expressed in tracheal tuft cells (Krasteva et al., 2011 and Figure 1G). We also detected expression of taste receptors in thymic tuft cells, but they were absent in intestinal tuft cells, especially those of the small intestine.
Since the immune function of tuft cells is best characterized in the small intestine, we sought to identify the receptors required for chemosensing in these cells. Taste receptors are GPCRs and TRPM5 activation is Ca2+-dependent; therefore we began by searching for cell surface GPCRs that might induce Ca2+ flux and that are enriched in small intestinal tuft cells compared to all other intestinal epithelial cells. Two metabolite sensors matched these criteria. FFAR3 is the receptor for the short chain fatty acids (SCFA) propionate and butyrate, and has been implicated in sensing these bacterial metabolites in the intestine (Trompette et al., 2014). SUCNR1 is the extracellular receptor for the citric acid cycle intermediate succinate and is best characterized in the kidney, where it helps to regulate blood pressure (Ariza et al., 2012). RNA-seq revealed that Ffar3 was enriched in tuft cells throughout the intestinal tract, while Sucnr1 expression was highest in tuft cells of the small intestine and trachea (Figure 1H, I). To validate these sequencing results, we again sorted tuft cells and non-tuft epithelial cells from the small intestine and performed qPCR to confirm that both Ffar3 and Sucnr1 were enriched in small intestinal tuft cells (Figure 1J). Other members of the SCFA receptor family were either undetectable (Ffar1, Ffar2) or expressed equally in tuft cells and non-tuft epithelium (Ffar4). SUCNR1 and FFAR3 therefore particularly warranted further analysis as candidate immune receptors in tuft cells.
Succinate is sufficient to induce a type 2 immune response in the small intestine
To test whether tuft cells can sense lumenal SCFA and/or succinate, we supplemented mouse drinking water with 150 mM (Na+)2-succinate, Na+-propionate, Na+-acetate, or Na+-butyrate, or 300 mM NaCl, and measured tuft cell hyperplasia as a marker for intestinal type 2 inflammation. Succinate, but not SCFAs or NaCl, was sufficient to induce a >5-fold increase in tuft cells in the small intestine (Figure 2A, B). Although tuft cell hyperplasia was detectable throughout the small intestine, it was most pronounced in the distal segment (terminal 10 cm), which we used for further characterization (Figure 2C). We did not detect any changes in tuft cell numbers in the cecum or colon following succinate treatment (Figure S2A). The succinate-induced tuft cell hyperplasia was maximal at a concentration of 150 mM given ad libitum in drinking water. Concentrations of 75 mM and 300 mM both elicited less tuft cell hyperplasia, the latter likely due to reduced water consumption at such high sodium concentrations (Figure 2D). Kinetically, an increase in tuft cell numbers was detectable just two days after administering succinate, but continued to rise until day 7–8 (Figure 2E). We noted a downward trend in tuft cell numbers at later timepoints, perhaps due to regulatory feedback mechanisms, but tuft cell frequency remained well above background throughout the time course. Unless otherwise noted, further experiments were performed by analyzing the distal small intestine after 7 days of 150 mM succinate administration. Dietary succinate was sufficient to induce multiple additional components of the canonical innate type 2 immune response, including goblet cell hyperplasia and hypertrophy (Figure 2F–H) and accumulation of ILC2s and eosinophils in the mesenteric lymph nodes (MLN; Figure 2I–J and Figure S2B–D). Dietary succinate also accelerated clearance of N. brasiliensis, further demonstrating that succinate is sufficient to induce a bona fide intestinal type 2 immune response (Figure 2K).
Figure 2. Succinate is sufficient to induce a type 2 immune response in the small intestine.

(A–J) Unless otherwise indicated, wild-type mice were given 150 mM succinate or control water for 7 d. (A) Representative images of distal (last 10 cm) small intestine (SI). DCLK1 marks tuft cells. Scale bar = 50 μm (B) Quantification of tuft cells in A. (C) Tuft cell quantification by microscopy in the proximal (first 10 cm) and distal SI (D–E) Tuft cell quantification in the distal SI at indicated (D) succinate concetrations and (E) timepoints. (F) Representative images of middle (10–20 cm from cecum) SI stained with periodic acid-Schiff to visualize goblet cells. Scale bar = 50 μm. (G–H) Quantification of goblet cell (G) numbers and (H) hypertrophy. (I–J) Absolute numbers of (I) ILC2s and (J) eosinophils quantified in MLN by flow cytometry. (K) Total worm burden in wild-type mice that received 7 d treatment with 150mM succinate or water control prior to and during infection with N. brasiliensis. Worm burden represented as relative to median of control within each experiment. (L) Tuft cell quantification in distal SI of germ-free mice treated as in A–J. In B–D, G–L each symbol represents an individual mouse from at least three pooled experiments. In E, each symbol represents the average of 3–9 mice pooled from three experiments. *, p < 0.05; **, p < 0.01; ***, p < 0.001 by one-way ANOVA with comparison to control (B, D), by Mann-Whitney (G–J, L), or by multiple t-test (C, K). Graphs depict mean + SEM. Also see Figure S2.
Since commensal bacteria both produce and consume succinate (Ferreyra et al., 2014; De Vadder et al., 2016), it was possible that dietary succinate supplementation activated type 2 immune responses indirectly by altering the composition of the intestinal microbiome; however, succinate-induced tuft cell hyperplasia was equivalent in germ-free and SPF mice (Figure 2L). Taken together, our data demonstrate that succinate is an innate immune ligand that is sufficient to induce a multifactorial innate type 2 immune response in the small intestine.
Succinate signals via the tuft cell-ILC2 circuit
To further characterize the signaling cascade through which dietary succinate is sensed and induces tuft cell hyperplasia, we employed mice deficient in various components of the tuft-ILC2 circuit that regulates innate type 2 immunity in the small intestine (Figure 3A). As in helminth infection, succinate-induced tuft cell hyperplasia was completely dependent on IL-4 receptor alpha (Il4ra), likely due to the established requirement for IL-13 signaling in epithelial stem cells to induce tuft and goblet cell hyperplasia (Figure 3B, C). ILC2s are the dominant innate source of IL-13; accordingly, Il2rg−/− mice, which lack both innate and adaptive lymphocytes, completely failed to induce tuft cell hyperplasia in response to succinate, while the response was largely intact, although still significantly reduced, in Rag1−/− mice lacking only adaptive lymphocytes. Tuft cells are the exclusive source of the ILC2-activating cytokine IL-25 in the small intestine, and tuft cell hyperplasia was completely absent in Il25−/− mice treated with succinate. IL-33, another ILC2-activating cytokine that signals through ST2 but is not expressed in tuft cells (von Moltke et al., 2016), was not required for this response. Tuft cells themselves were required, however, as goblet cell hyperplasia and hypertrophy were absent in tuft cell-deficient Pou2f3−/− mice given succinate (Figure 3D–F). Tuft cell hyperplasia as well as ILC2 and eosinophil accumulation in the MLN of succinate-treated mice was TRPM5- and SUCNR1-dependent (Figure 3B–C, G–H and Figure S3A). Tuft cell hyperplasia was also significantly reduced in Sucnr1+/− mice, suggesting SUCNR1 is partially haploinsufficient. Succinate-induced IL-13 production (measured using the Smart13 reporter) was also nearly absent in MLN ILC2s of Trpm5−/− mice (Figure 3I–J and Figure S3B–C). Indeed, IL-13 was induced in lamina propria ILC2s just 36 hours after succinate administration, and this was also TRPM5-dependent (Figure 3K–L and Figure S3D), suggesting that induction of this type 2 immune response occurs immediately downstream of signaling in tuft cells.
Figure 3. Succinate signals via the tuft cell-ILC2 circuit in a TRPM5 and SUCNR1-dependent manner.

(A) Schematic of cells and proteins in the tuft-ILC2 circuit. (B–J Mice of indicated genotypes were given 150 mM succinate for 7 d. (B) Representative images of distal (last 10 cm) small intestine (SI). DCLK1 marks tuft cells. Scale bar = 50 μm. (C) Quantification of tuft cells in B. (D) Representative images of middle (10–20 cm from cecum) SI stained with Alcian blue to visualize goblet cells. Scale bar = 100 μm. (E–F) Quantification of goblet cell (E) numbers and (F) hypertrophy in D. (G–J) MLN analyzed by flow cytometry to quantify (G) ILC2s, (H) eosinophils, and (I–J) IL-13 production by ILC2s. Smart13: IL-13 reporter. (K–L) Lamina propria cells from mice of indicated genotypes given 150 mM succinate for 36 hours and analyzed as in I–J. In C–H, J–L each symbol represents one mouse from at least two pooled independent experiments. *, p < 0.05; **, p < 0.01; ***, p < 0.001 by one-way ANOVA (C, G–H, J, L) with comparison to Wt(B6) or untreated Smart13 control, or by Mann-Whitney (E–F). n.s., not significant. Graphs depict mean + SEM. Also see Figure S3.
To further confirm that succinate sensing occurs in tuft cells and is amplified through the tuft-ILC2 circuit, we stimulated sort-purified lamina propria ILC2s and analyzed IL-13 production after succinate stimulation. We also separately stimulated intestinal epithelial organoids with succinate and looked for tuft cell hyperplasia. Although recombinant IL-25-activated ILC2s and recombinant IL-13 induced tuft cell hyperplasia in organoids, succinate had no effect in either assay (Figure S3E–F), confirming that ILC2s do not directly sense succinate and that succinate signaling in epithelial cells is not sufficient to induce tuft cell hyperplasia. Taken together, these results strongly support a model in which succinate sensing occurs directly in tuft cells and activates the feed-forward tuft-ILC2 circuit, likely downstream of SUCNR1-induced Ca2+ flux.
N. brasiliensis and a tritrichomonad secrete succinate
Given the link between tuft cells and the type 2 immune response to microbes, we hypothesized that succinate sensing is a mechanism for monitoring microbial metabolism in the intestinal lumen. Unlike land vertebrates, which principally generate lactic acid under anaerobic conditions, the anaerobic metabolites of helminths, protists, and bacteria are far more diverse and include hydrogen, ethanol, acetate, propionate, lactate, and other metabolites (Müller et al., 2012). Numerous bacterial species, some protists (e.g. Tritrichomonas foetus), and some helminths are also known to use fumarate as a terminal electron acceptor during fermentation, resulting in production and release of succinate (Müller et al., 2012; Tielens, 1994).
Given the ability of succinate to induce an intestinal immune response with all the hallmarks of a helminth infection, we wondered if succinate sensing by tuft cells might contribute to the immune response to N. brasiliensis. A previous study reported that N. brasiliensis does indeed secrete succinate, but this has not been further investigated (Saz et al., 1971). To more fully characterize N. brasiliensis metabolites, we analyzed N. brasiliensis excretory-secretory product (NES) using nuclear magnetic resonance (NMR), and found that acetate, propionate, lactate, and succinate, but not butyrate, were all produced (Figure 4A). Furthermore, NES induced Ca2+ flux in mouse embryonic fibroblasts transduced with Sucnr1, but not in untransduced cells (Figure 4B–C). We also attempted to measure succinate levels in the small intestine of N. brasiliensis-infected mice, but even in mice given 150 mM succinate in the drinking water we could not reliably detect increased succinate levels in the small intestine (data not shown), likely because succinate absorption is very rapid in this organ (De Vadder et al., 2016; Wolffram et al., 1994). Thus, our data show that N. brasiliensis can secrete succinate to activate SUCNR1 in vitro.
Figure 4. Immune sensing of T. rainier but not N. brasiliensis requires SUCNR1.

(A) Concentration of indicated molecules measured in N. brasiliensis excretory-secretory product (NES) or media control by NMR. (B) Representative calcium fluxes in wild-type (B6) or SUCNR1-transduced MEFs treated as indicated. (C) Quantification of B. (D) Concentrations of indicated molecules measured in T. rainier conditioned media or media alone by NMR. (E–I) Mice of indicated genotypes were infected with N. brasiliensis. (E) Tuft cell quantification in the distal (last 10 cm) small intestine (SI), and (F) total worm burden at indicated times. (G) Tuft cell quantification in the distal SI 7 d post infection. (H) Tuft cell quantification in the distal SI and (I) total worm burden 8 d post infection. (J–M) Mice of indicated genotypes were colonized with T. rainier for 7 d or left untreated. (J) Representative images of distal SI. DCLK1 marks tuft cells. Scale bar = 50 μm. (K) Quantification of tuft cells in J. (L–M) MLN analyzed by flow cytometry to quantify (L) ILC2s and (M) eosinophils. A–B, D show representative data from at least two independent experiments. In C, each symbol represents one technical replicate. In G–I, K–M each symbol represents one mouse from at least two pooled experiments. In E–F each symbol represents the average of 3–10 mice from three pooled experiments. *, p < 0.05; **, p < 0.01; ***, p < 0.001 by one-way ANOVA (H–I, K–M) with comparison to Wt(B6) control, by Mann-Whitney (G), or using multiple t-tests (C, E, F). n.s., not significant. Graphs depict mean + SEM. Also see Figure S4.
We also identified a mouse colony in the University of Washington vivarium that harbored abundant (>100 million/cecum) protists with Tritrichomonas-like morphology (Figure S4A). Internal transcribed spacer (ITS) sequencing identified this protist as a previously undescribed tritrichomonad with >97% and >86% homology to the ITS of T. musculis and T. muris, respectively (Figure S4B). Although the precise taxonomic relationship of these tritrichomonads remains to be determined, for clarity we hereafter refer to the University of Washington isolate as T. rainier. Like N. brasiliensis, T. rainier secreted succinate upon anaerobic culture (Figure 4D).
Sensing of T. rainier but not N. brasiliensis requires Sucnr1
Immune sensing of tritrichomonads requires TRPM5 and GNAT3, but these have not been tested in sensing of N. brasiliensis. We therefore first confirmed that both worm clearance and tuft cell hyperplasia following N. brasiliensis infection are TRPM5-dependent, although compensatory mechanisms appeared to emerge about 10 days post infection (Figure 4E–F). By contrast, tuft cell hyperplasia developed normally in N. brasiliensis-infected Gnat3−/− mice, suggesting distinct sensing mechanisms for helminths and protists upstream of TRPM5 (Figure 4G and Figure S4C–D). Accordingly, the immune response to N. brasiliensis was largely SUCNR1-independent (Figure 4H–I), whereas sensing of T. rainier was completely SUCNR1-dependent, with both tuft cell hyperplasia and MLN infiltrates absent in Sucnr1−/− mice despite equivalent colonization with T. rainier (Figure 4J–M and Figure S4E–G). In the context of T. rainier colonization, where succinate levels may be limiting, the haploinsufficiency of SUCNR1 was evident relative to both littermate and non-littermate wild-type controls. In sum, tuft cells sense T. rainier via SUCNR1, but SUCNR1-signaling is redundant or perhaps absent during N. brasiliensis infection.
DISCUSSION
Since the identification of a role for tuft cells in type 2 immunity, the mechanisms of immune sensing by intestinal tuft cells have been of great interest. In this study we found that succinate is an intestinal tuft cell ligand, as two other groups also recently reported (Lei et al., 2018; Schneider et al., 2018). Our RNA-sequencing also highlighted the ways in which chemosensing by tuft cells is tissue specific. Tuft cells in the small intestine were activated by succinate and perhaps by additional taste receptor-independent ligands. For example, it remains to be determined whether and how FFAR3 regulates intestinal tuft cell function. In the trachea and thymus, on the other hand, tuft cells express canonical taste receptors (Figure 1G) and, at least in the trachea, can respond to bitter ligands (Krasteva et al., 2011; Miller et al., 2018; Tizzano et al., 2010). Tracheal tuft cells also appear to express Sucnr1 (Figure 1I), although further studies are needed to validate this functionally. It is unclear what the physiologic source of succinate might be in the trachea. Perhaps tuft cells sense helminths like N. brasiliensis that transit through the trachea, or bacteria that colonize the trachea in disease states. It remains to be determined how tuft cells in the gall bladder and colon, which lacked expression of both taste receptors and Sucnr1, are activated. Lastly, it is likely that our bulk RNA sequencing underestimated the diversity of tuft cell receptor expression. Single cell sequencing has revealed two subsets of intestinal tuft cells (Haber et al., 2017), and diverse taste receptor expression among individual thymic tuft cells (Miller et al., 2018). Further studies may demonstrate that tuft cell sensing is tuned to microenvironments both within and between tissues.
Our discovery that sensing of T. rainier colonization requires SUCNR1 defines a paradigm in which the intestinal type 2 immune response can be activated by sensing of microbial metabolism. Helminths, protists, and both commensal and pathogenic bacteria have evolved diverse metabolic strategies to thrive in the nutrient-rich but oxygen-poor intestinal lumen, often involving the production and secretion of succinate. Whether tuft cell sensing of succinate underlies detection of microbes besides tritrichomonads remains to be determined. The low frequency of tuft cells in Tritrichomonas- and specific pathogen-free mice suggests that bacterial succinate is not sensed at homeostasis, but this may change in states of dysbiosis, especially if bacterial species that secrete succinate are expanded. Indeed, Lei and colleagues recently reported SUCNR1-dependent expansion of tuft cells when mice are given PEG3350 or streptomycin to alter the intestinal flora (Lei et al., 2018). It should be noted, however, that the Tritrichomonas colonization status of these mice was not reported; therefore it remains possible that PEG3350 and streptomycin administration induced tuft cell hyperplasia by allowing commensal tritrichomonads to expand. Conversely, the tuft cell hyperplasia induced by our T. rainier colonization may have resulted from alterations in the bacterial flora. Further studies will be needed to disentangle the sensing of bacterial- and protist-derived succinate.
We and others did not observe a significant defect in tuft cell hyperplasia and worm clearance 7–8 days after N. brasiliensis infection in Sucnr1−/− mice (Figure 4H–I and Lei et al., 2018). We did, however, note slightly more worms in Sucnr1−/− mice, and more detailed analyses may yet reveal a partial immune defect. Nonetheless, it is clear that in the context of helminth infection Sucnr1 deficiency does not phenocopy the loss of Trpm5. We must therefore conclude that either tuft cells do not sense helminth-derived succinate or that the sensing is redundant. Further studies are needed to identify one or more additional sensors that signal upstream of TRPM5 during helminth infection.
We must also consider the possibility that tuft cells detect endogenous or dietary succinate, although our data suggest it is difficult to globally increase the concentration of succinate in the intestinal lumen, likely due to rapid uptake of succinate by the intestinal epithelium (De Vadder et al., 2016; Wolffram et al., 1994). Accordingly, even 75 mM succinate in drinking water, a dose much higher than would be found in any standard diet, was insufficient to induce maximal tuft cell hyperplasia (Figure 2D). We favor the model that microbes that gain access to the intestinal epithelium are uniquely able to deliver succinate locally at levels that are high enough to activate SUCNR1 in tuft cells. Whether succinate released from dying epithelial cells can similarly activate tuft cells remains to be determined.
Regardless of its physiologic source, succinate is an unusual innate immune ligand. As classically defined, an innate immune ligand should be unique to microbes and difficult to mutate without incurring fitness costs. Succinate, it would seem, meets neither of these criteria. First, although normally sequestered inside cells, succinate is abundant in host tissue. Furthermore, although succinate itself is highly conserved, the diversity of metabolic pathways found among helminth species alone suggests that it would not be difficult to evolve away from succinate secretion and thereby to evade detection by tuft cells. Therefore, we must consider the possibility that intestinal microbes can tolerate detection via succinate, and indeed tritrichomonads are not cleared or even reduced in number by a type 2 immune response. We speculate that some microbes, such as those that can consume mucus or otherwise benefit from a type 2 immune response, may in some circumstances even target the succinate receptor.
It is also interesting to note that all previous studies linking succinate to immune responses have characterized this molecule as an enhancer of type 1 immunity. Signaling through SUCNR1 on dendritic cells and macrophages or intracellular sensing of succinate all potentiate classical type 1 inflammatory pathways (Littlewood-Evans et al., 2016; Rubic et al., 2008; Rubić-Schneider et al., 2017; Tannahill et al., 2013). In the intestine, however, sensing of succinate seems to be wired differently, leading to a type 2 immune response that is well-tolerated even when activated chronically (Schneider et al., 2018). Virtually all wild animals and many humans are chronically parasitized with helminths, and while high worm burdens are undoubtedly detrimental to host fitness, lower burdens are well tolerated. Indeed, there is growing evidence that helminth infection can provide therapeutic relief of inflammatory bowel disease and allergies (Helmby, 2015), and a type 2 immune response in adipose tissue protects against metabolic disease (Odegaard and Chawla, 2015). Our findings may therefore also have important therapeutic applications. While systemic manipulation of SUCNR1 signaling is not advisable given its role in physiologic processes such as blood pressure regulation (Ariza et al., 2012), tissue-specific targeting of SUCNR1 with agents that are restricted to the intestinal lumen might provide access to an immune rheostat that can either enhance anti-helminth immunity or dampen inflammatory disease.
In sum, we have defined a paradigm in which metabolite sensing by tuft cells drives an innate type 2 immune response. This finding has important implications for our understanding of intestinal immunity and homeostasis, and suggests novel strategies for therapeutic intervention.
STAR Methods
Contact for Reagent and Resource Sharing
Further information and requests for resources and reagents should be directed to and will be fulfilled by the Lead Contact, Jakob von Moltke (jmoltke@uw.edu).
Experimental Model and Subject Details
Experimental Animals
Mice aged 6 weeks and older were used for all experiments. Mice were age-matched within each experiment, but pooled results include both male and female mice of varying ages. C57BL/6J mice were bred in house or purchased from Jackson Laboratories. B6.Rag1−/− (B6.129S7-Rag1tm1Mom/J), B6.Il2rg−/− (B6.129S4-Il12rgtm1Wjhl/J), and B6.Trpm5−/− (B6.129P2-Trpm5tm1Dgen/J) mice were purchased from Jackson Laboratories. B6.Il25Flare25/Flare25 and B6.Il13Smart13/Smart13 mice were generated as previously described (Liang et al., 2012; von Moltke et al., 2016). Il25−/− mice were generated as previously described (Fallon et al., 2006), generously provided by A. McKenzie, and backcrossed at least 8 generations to C57BL/6J. IL4ra−/− mice were generated as previously described (Mohrs et al., 1999), generously provided by F. Brombacher, and backcrossed at least 8 generations to C57BL/6J. B6.Pou2f3−/− (Pou2f3 tm1.1(KOMP)Vlcg, Project ID #VG18280) were generously provided by M. Anderson. B6.Gnat3−/− mice were generated by pronuclear injection of Cas9 mRNA and two sgRNA (Guide 1: GCTTCAGGAGGATGCTGAGCGGG, Guide 2: CTCCAGTTCTTTGGACCTTCTGG) into fertilized C57BL/6J zygotes at the Gladstone Institutes (San Francisco, CA). B6.Sucnr1−/− mice were generated by pronuclear injection of Cas9 mRNA and two sgRNA (Guide 1: CGATTGCATAAAATGCAGAGAGG; Guide 2: AGAGTTATGCCAATGATAAGGGG) into fertilized C57BL/6J zygotes at the Gene Targeting Facility of the Cancer Research Laboratory at UC Berkeley (Berkeley, CA). Founder Gnat3 and Sucnr1 mice were genotyped by Sanger sequencing and founders carrying mutations were backcrossed once to C57BL/6J before intercrossing to generate homozygous mutant mice. All mice not purchased from Jackson Laboratories or newly generated were rederived into the University of Washington vivarium. Lewis rats were purchased from Envigo (LEW/SsNHsd). Except mice noted below, all mice and rats were maintained in specific pathogen-free conditions at the University of Washington and were confirmed to be tritrichomonas-free by qPCR. Germ free mice were housed and treated in the University of Washington Gnotobiotic Animal Core. All experimental procedures (with exceptions noted below) were approved by the Institutional Animal Care and Use Committee at the University of Washington. B6.Il25Flare25/Flare25 mice used to sort cells for mRNA sequencing and B6.Gnat3−/− mice were maintained in specific pathogen-free conditions at the University of California, San Francisco and experimental procedures were approved by the Institutional Animal Care and Use Committee at the University of California, San Francisco. B6.Il25Flare25/Flare25 were retrospectively found to be colonized with a tritrichomonad of unknown identity.
Germ Free Mice
C57BL/6J mice were raised under standard germ free conditions in the University of Washington Gnotobiotic Animal Core. For succinate administration, mice were transferred to hermetically-sealed positive pressure isocages as described (Paik et al., 2015) and given autoclaved drinking water supplemented with 150 mM sodium succinate hexahydrate ad libitum for 7 days.
Cell culture and transduction
Immortalized C57BL/6J mouse embryonic fibroblasts (MEFs; kindly provided by Dr. D. Stetson) and HEK293T were cultured in DMEM supplemented with 10% fetal calf serum (VWR), L-glutamine, penicillin/streptomycin, sodium pyruvate, HEPES and β-mercaptoethanol. For lentiviral transduction, the ORF for mouse Sucnr1 was obtained directly from prepared cDNA from sorted small intestinal tuft cells (described above). After sequencing verification, mSucnr1 was cloned into the pRRL-MND-MCS-2A-Puro lentiviral vector downstream of an MND promoter as previously described (Gray et al., 2016). VSV-G pseudotyped, self-inactivating lentivirus was prepared by transfecting HEK293T cells with 1.5 μg pVSV-G, 3 μg psPAX-2, and 6 μg pRRL lentiviral vector, and viral supernatant collected and filtered before use. MEFs were incubated with viral supernatant overnight, and media was replaced with fresh culture media. Puromycin (5ug mL−1) selection was added 72 hours post transduction and continued for 7 days.
Method Details
Short Chain Fatty Acid and Succinate Administration
Mice were provided with sodium succinate hexahydrate (Alfa Aesar), sodium propionate (Arcos Organics), sodium acetate trihydrate (Fisher Chemical), or sodium butyrate (Alfa Aesar) ad libitum in drinking water. Unless otherwise noted, mice were treated for 7 days with 150 mM agonist, except NaCl, which was given at 300 mM to match sodium molarity with succinate treatment.
Mouse Infection/Colonization
Infectious third-stage N. brasiliensis larvae (L3) were raised and maintained as described (Liang et al., 2012). Mice were infected subcutaneously at the base of the tail with 500 N. brasiliensis L3 and were euthanized at the indicated time points to collect tissues for staining or to count worm burden. Worm burden was enumerated across the entire small intestine. Wild-type mice naturally colonized with T. rainier were used as a source of protists for colonization studies. T. rainier colonization status was determined by microscopy and confirmed by qPCR and ITS sequencing. To transfer T. rainier to naïve mice, cecal contents of colonized mice were isolated and washed in PBS, filtered through a 70 μm strainer, and spun down. Contents were washed a second time in PBS and total protists enumerated using a hemocytometer. Mice received a single oral gavage of 20–30 × 106 protists in a volume of 150 μl PBS. After 7 days mice were sacrificed for analysis. Successful colonization was again determined by microscopy and confirmed by qPCR.
Tissue fixation and staining
For tuft cell staining, intestinal tissues were flushed with PBS and fixed in 4% paraformaldehyde for 4 h at 4° C. Tissues were washed with PBS and incubated in 30% (w/v) sucrose overnight at 4° C. Small intestine and colon samples were then coiled into “Swiss rolls” and embedded in Optimal Cutting Temperature Compound (Tissue-Tek) and sectioned at 8 μm on a Microm HM550 cryostat (Thermo Scientific). Immunofluorescent staining was performed in Tris/NaCl blocking buffer (0.1 M Tris-HCL, 0.15 M NaCl, 5μg ml−1 TSA blocking reagents (Perkin Elmer), pH 7.5) as follows: 1 h 5% goat serum, 1 h primary antibody (αDCLK1, Abcam ab31704), 40 min goat anti-rabbit IgG F(ab′)2-AF594 secondary antibody (Life Technologies) and mounted with Vectashield plus DAPI (Vector Laboratories). Tuft cell frequency was calculated using ImageJ software to manually quantify DCLK1+ cells per millimeter of crypt-villus axis. Four 10x images were analyzed for each replicate and at least 30 total villi were counted.
For goblet cell staining, tissues were flushed with PBS, fixed in 10% buffered formalin at 4° C for 3 h, coiled into “Swiss rolls” and returned to formalin. After 24 h tissues were moved to 70% ethanol for storage. Tissue processing, paraffin embedding, sectioning, and staining were performed by the Pathology Research Services Laboratory at the University of Washington. Periodic acid Schiff (PAS) or Alcian blue staining was used to identify goblet cells. Goblet cell frequency was calculated as described above for tuft cells. Hypertrophy was quantified using ImageJ software to measure the area of at least 80 goblet cells for each biological replicate. Brightfield and fluorescent images were acquired on an Axio Observer.A1 inverted microscope (Zeiss).
Single-cell tissue preparation
For single cell epithelial preparations from small intestines, gall bladder, and colon, tissues were flushed with PBS, opened, and rinsed with PBS to remove intestinal contents. Intestinal tissue was cut into 2–5 cm pieces and incubated rocking at 37° C in 15 mL HBSS (Ca+2/Mg+2-free) supplemented with 5mM dithiothreitol (DTT, Sigma-Aldrich), 5% fetal calf serum (FCS, VWR), and 10mM HEPES (Gibco). Tissues were vortexed vigorously and supernatant was discarded. Tissues were then incubated rocking at 37° C in 15 mL HBSS (Ca+2/Mg+2-free) supplemented with 5mM EDTA (Invitrogen), 5% FCS, and 10mM HEPES. Tissues were vortexed thoroughly and released epithelial cells were passed through a 70 μm filter. Tissues were then incubated in fresh EDTA/HBSS solution for 15 minutes, vortexed, and filtered. Supernatants were pooled and washed once before staining for flow cytometry.
For lamina propria preparations small intestinal tissue was processed as above to remove the epithelial fraction. Tissues were then rinsed in 20 mL HBSS (with Ca+2/Mg+2) supplemented with 5% FCS and 10mM HEPES, shaking at 37° C for 20 minutes. Supernatants were discarded and tissues were incubated in 5 mL HBSS (with Ca+2/Mg+2) supplemented with 3% FCS, 10mM HEPES, 30 μg mL−1 DNase I (Sigma Aldrich), and 0.1 Wunsch mL−1 Liberase TM (Sigma Aldrich), shaking at 37° C for 30 minutes. Tissues were vortexed and cells were passed through a 70 μm filter and washed. The resulting pellet was resuspended in 40% Percoll (Sigma Aldrich), centrifuged for 5 minutes at 1500 rpm, and supernatant discarded. Pelleted cells were then washed and stained for flow cytometry.
For mesenteric lymph node preparations, MLN were harvested into RPMI + 5% FBS on ice. Tissues were incubated 30 minutes at 37° C in 5 mL RPMI supplemented with 2 mg mL−1 collagenase VIII (Sigma-Aldrich) and 7.5 μg mL−1 DNase I (Sigma-Aldrich). Digested MLN were passed through a 70 μM filter and remaining tissue was mashed through filter. Cells were washed once and stained for flow cytometry.
For tracheal epithelium, the trachea was dissected from mice, stored in DMEM + 5% FBS and cleaned of stroma using a dissecting microscope. Tissue was cut into 6 pieces and incubated at room temperature in 16U mL−1 Dispase (Corning) in DPBS without Ca2+/Mg2+. Incubation was monitored carefully and stopped by transfer into DMEM + 5% FBS when epithelium began to lift away from stroma (23–28 minutes). Epithelium was then peeled off under a dissecting microscope and collected in DMEM + 5% FBS on ice. Harvested epithelium was digested in 0.5% Trypsin + EDTA for 20 minutes at 37° C. After digest, cells were vortexed briefly and trypsin was quenched with DMEM + 5% FBS. Cells were washed once and stained for flow cytometry.
For thymic epithelium, thymi were isolated, cleaned of fat and transferred to DMEM + 2% FBS on ice. Thymi were minced with a razor blade and tissue pieces were moved with a glass Pasteur pipette to 15 ml tubes and vortexed briefly in 10 ml of media. Fragments were allowed to settle before removing the media and replacing it with 4 ml of digestion media containing 2% FBS, 100 μg mL−1 DNase I (Roche), and 100 μg mL−1 Liberase TM (Sigma-Aldrich) in DMEM. Tubes were moved to a 37° C water bath and fragments were triturated through a glass Pasteur pipette at 0 min and 6 min to mechanically aid digestion. At 12 min, tubes were spun briefly to pellet undigested fragments and the supernatant was moved to 20 ml of 0.5% BSA (Sigma-Aldrich), 2 mM EDTA (TekNova), in PBS (MACS buffer) on ice to stop the enzymatic digestion. This was repeated twice for a total of three 12 min digestion cycles, or until there were no remaining tissue fragments. The single cell suspension was then pelleted and washed once in MACS Buffer. Density-gradient centrifugation using a three-layer Percoll gradient (GE Healthcare) with specific gravities of 1.115, 1.065, and 1.0 was used to enrich for stromal cells. Cells isolated from the Percoll-light fraction, between the 1.065 and 1.0 layers, were then washed and resuspended for staining.
Flow cytometry and cell sorting
Single cell suspensions were prepared as described and stained in DPBS + 3% FBS with antibodies to surface markers for 20 min at 4° C, followed by DAPI (Roche) for dead cell exclusion. Samples were FSC-A/SSC-A gated to exclude debris, SSC-H/SSC- W gated to select single cells and gated to exclude DAPI+ dead cells. Samples were run on an LSR II (BD Biosciences) or Aurora (Cytek) and analyzed with FlowJo 10 (Tree Star). For cell sorting, single cell suspensions were prepared and stained as described and sorted into CD45lo IL25(RFP)+ EpCAM+ and CD45lo IL25(RFP−) EpCAM+ populations using a MoFlo XDP (Beckman Coulter) or an Aria II (BD Biosciences).
RNA sequencing & analysis
Single cell suspensions of epithelial cells from gall bladder, small intestine, colon, thymus, and trachea were generated as described above from Il25Flare25/Flare25 reporter mice. CD45lo RFP+ EpCAM+ tuft cells were sorted from all tissues and CD45loRFP−EpCAM+ cells were also sorted from the small intestine. With the exception of tracheal tuft cells, which were pooled from four mice for each replicate, each biological replicate represents one mouse. Four biological replicates were collected for each sample. Average sorted cells for each sample were as follows: SI_RFP+: 35,250; SI_RFP−: 55,000; Colon: 14,775; Gall: 2287, Thymus: 1612; Trachea: 255.
Cells were sorted directly into lysis buffer from the Dynabead mRNA Direct Purification Kit (ThermoFisher) and mRNA was isolated according to the manufacturer’s protocol. Amplified cDNA was prepared using the NuGen Ovation RNA-Seq system V2 kit, according to the manufacturer’s protocol (NuGen Technologies). Sequencing libraries were generated using the Nextera XT library preparation kit with multiplexing primers, according to manufacturer’s protocol (Illumina). Library fragment size distributions were assessed using the Bioanalyzer 2100 and the DNA high-sensitivity chip (Agilent Technologies). Library sequence quality was assessed by sequencing single-end 50 base pair reads using the Illumina MiSeq platform and were pooled for high-throughput sequencing on the Illumina HiSeq 4000 by using equal numbers of uniquely mapped reads (Illumina). Twelve samples per lane were multiplexed to ensure adequate depth of coverage. Sequencing yielded a median read depth of 89.2 million reads per sample. The analytic pipeline included de-multiplexing raw sequencing results, trimming adapter sequences, and aligning to the reference genome. Sequence alignment and splice junction estimation was performed using the STAR software program. For differential expression testing, the genomic alignments were restricted to those that map uniquely to the set of known Ensembl IDs (including all protein coding mRNAs and other coding and noncoding RNAs). STAR aggregated mappings on a per-gene basis were used as raw input for normalization by DESeq2 software. Replicates failing quality control at any stage were discarded. Resulting datasets were deposited in the GEO database (GSE114067).
To determine the tuft cell signature, any genes with a mean normalized read count <300 in any tuft cell subset were removed from analysis. Next, genes were ranked based on log2 fold change between the mean expression level in all tuft samples and the mean expression level in all non-tuft samples, with a cutoff of 4. GO Term and KEGG pathway analysis was performed using the Database for Annotation, Visualization, and Integrated Discovery (Huang et al., 2009a, 2009b). Visualization of taste receptor expression was generated using Morpheus (https://software.broadinstitute.org/morpheus/).
Quantitative RT-PCR
For tuft cell qPCR, CD45loRFP+EpCAM+ and CD45loRFP−EPCAM+ populations from small intestinal epithelium of Il25Flare25/Flare25 mice were sorted into Buffer RLT (Qiagen) using an Aria (BD Biosciences). To validate Gnat3−/− mice, CD45loEpCAM+ epithelial cells from the small intestine were sorted into Buffer RLT (Qiagen). RNA was isolated using the Micro Plus RNeasy kit (Qiagen) and reverse transcribed using SuperScript Vilo Master Mix (Life Technologies). For tritrichomonas quantification, total DNA was isolated from cecal contents using the QIAmp Fast DNA Stool Mini Kit (Qiagen). Cecal DNA or cDNA were used as template for quantitative PCR with Power SYBR Green reagent on a StepOnePlus cycler (Applied Biosystems). For mouse cells, transcripts were normalized to Rps17 (40S ribosomal protein S17) expression. For cecal DNA, transcripts were normalized to bacterial 16s rRNA.
Nuclear Magnetic Resonance Quantification of SCFA and Succinate
NMR analyses were made using a Bruker AVANCE III 800 MHz equipped with a 5 mm HCN cryoprobe suitable for 1H inverse detection with Z-gradients at 298 K. Samples were prepared to contain 50 μM TSP (3-(trimethylsilyl) propionic-2,2,3,3-d4 acid sodium salt) for quantitative and chemical shift reference. One-dimensional 1H NMR spectra were obtained using the CPMG (Carr-Purcell-Meiboom-Gill) pulse sequence that included residual water signal suppression from a pre-saturation pulse during the relaxation delay. For each spectrum, 32k data points were acquired using a spectral width of 9615 Hz. The raw data were processed using a spectral size of 32k points and by multiplying with an exponential window function equivalent to a line broadening of 0.3 Hz. The resulting spectra were phase and baseline corrected and referenced with respect to the internal TSP signal. Bruker Topspin version 3.5pl6 software package was used for NMR data acquisition and processing. Assignment of peaks was made based on 1H NMR chemical shifts and spin-spin couplings obtained from the spectra of standard compounds under similar experimental conditions at 800 MHz. Chenomx NMR Suite Professional Software package (version 5.1; Chenomx Inc., Edmonton, Alberta, Canada) was used to quantitate metabolites. This software allows fitting spectral lines using the standard metabolite library for 800 MHz 1H NMR spectra and the determination of concentrations. Peak fitting with reference to the internal TSP signal enabled the determination of absolute concentrations for the short chain fatty acids and other organic acids. All NMR experiments were performed in conjunction with the Northwest Metabolomics Research Center at the University of Washington.
Preparation of N. brasiliensis excretory-secretory product (NES)
Infectious third-stage N. brasiliensis larvae (L3) were raised and maintained as described. Lewis rats were infected subcutaneously with 2000 N. brasiliensis L3. Mature (L5) worms were collected from the entire small intestine 7 days post infection. Worms were washed 10 times in Wash Solution I (PBS with 200U ml−1 Pen-Strep), allowing worms to settle by gravity between each wash. Worms were allowed to equilibrate in Wash Solution II (RPMI 1640 with 200U ml−1 Pen-Strep) for 1 hour at room temperature, before being transferred to a tissue culture flask in NES culturing media (RPMI 1640, with 100U ml−1 Pen-Strep, 2mM L-Glutamine and 1% glucose) and cultured at 37° C. Supernatant was collected at 24 and 48 hours and filtered prior to use as NES. For NMR analysis, phosphate buffer prepared in deuterated water (0.1M; pH =7.4) containing TSP (3-(trimethylsilyl) propionic-2,2,3,3-d4 acid sodium salt) was added to NES to achieve a final concentration of 50uM TSP.
Tritrichomonas culture
Culture of T. rainier was performed as described (Saeki et al., 1983). Briefly, cecums of T. rainier colonized mice were flushed with PBS, passed through the 70 um cell strainers and centrifuged at 1000 rpm for 5 min. In order to enrich for tritrichomonads a 40/80% percoll gradient centrifugation step was performed at 1000 g for 15 min with brakes off. Tritrichomonads were collected at the interphase and the tritrichomonad containing fraction was washed with PBS and resuspended in tritrichomonad culture medium. Tritrichomonad culture medium was modified from the method described by (Saeki et al., 1983). To prepare medium, cecums of mice were harvested and homogenized in PBS with 25 volumes of PBS per gram cecum. In order to get homogeneous suspension, the cecal extract was stirred at 4°C for 6 h and then centrifuged at 3500rpm for 10 min and the supernatant was filtered. The filtered cecal extract was used to resuspend the BBL Trichosel™ Broth (BD Biosciences) and titrated to pH 7 with NaOH. The medium was then autoclaved for 10 minutes. After cooling media was supplemented with 10% heat-inactivated horse serum and the following antibiotics; amphotericin B (5ug/mL), ampicillin (100ug/mL), chloramphenicol (100ug/mL), gentamicin (50ug/mL), kanomycin (100ug/mL), streptomycin (100ug/mL), vanomycin (5ug/mL). The enriched tritrichomonads were resuspended in culture medium at 2 × 10⁶ protists per mL and cultured under anaerobic conditions for 24h. Media was collected and centrifuged 1750 rpm for 10 min. Supernatant was filter (0.22um PVDF filter). For NMR analysis, phosphate buffer prepared in deuterated water (0.1M; pH =7.4) containing TSP (3-(trimethylsilyl) propionic-2,2,3,3-d4 acid sodium salt) was added to tritrichomonad conditioned media to achieve a final concentration of 50uM TSP.
Tritrichomonas sequencing
Internal transcribed spacer (ITS) sequencing of the tritrichomonad identified in the University of Washington vivarium was performed as previously described (Chudnovskiy et al., 2016). Briefly, DNA was isolated from the cecal contents of colonized mice using the QIAmp Fast DNA Stool Mini Kit (Qiagen) and the ITS region was PCR-amplified using pan-parabasalid primers (Forward: AATACGTCCCCTGCCCTTTGT Reverse: TCCTCCGCTTAATGAGATGC). The resulting PCR product was sequenced by Sanger Sequencing (Genewiz). A BLASTn search identified the sequence as novel but closely related to both murine and human tritrichomonads. Alignment with the ITS sequences of T. muris (Accession: AY886843.1) and T. musculis (Accession: KX000922.1) showed >97% and >86% sequence identify, respectively. For clarity, we refer to this novel isolate as Tritrichomonas rainier, although its precise taxonomic relationship to T. muris and T. musculis remains to be determined. The ITS sequence for T. rainier is available in GenBank (Accession #: MH370486).
Organoid Culture
Small intestinal crypt-derived organoids were grown as described (Sato et al., 2013), replacing recombinant R-spondin with supernatants from R-spondin expressing L-cells and replacing recombinant Noggin with supernatants from Noggin expressing cells. Crypts were harvested from the small intestine of naive B6.Il25Flare25/Flare25 mice and plated on day 0. On day 1 and day 4, media were replaced and organoids were treated with 20 ng ml−1 recombinant IL-13 or 10mM sodium succinate. On day 7 organoids were harvested and resuspended in Accutase (Corning). Organoids were sheared with a 28G insulin syringe, incubated for 1 h at room temperature, washed, and then stained for flow cytometry as described above.
Calcium imaging
Mouse embryonic fibroblasts were plated 7 × 10⁴ cells/well in 24-well plates coated with poly-D-lysine. After overnight incubation, cells were washed with assay buffer (1X HBSS with Ca2+/Mg2+, 10mM HEPES, pH 7.4). Cells were incubated for 1 hr at 37°C in assay buffer supplemented with 2.5 mM Fluo-4AM (Invitrogen) and 0.05% pluronic-F127 (Invitrogen). Cells were washed twice with assay buffer and incubated in assay buffer with 1mM probenecid (Biotium) for 30 minutes at 37° C prior to imaging. Cells were maintained at 37° C with 5% CO2 throughout imaging. While imaging, sodium succinate was added to assay buffer at a final concentration of 150uM or 100ul NES or NES culturing media was added to 250ul assay buffer. Following addition of test agonist, ionomycin was added at a final concentration of 1ug mL−1. Fluorescence images were collected at 1.44 frames per second with a 40X extra-long working distance objective on a Nikon TiE Inverted Widefield Fluorescence Nikon microscope and analyzed with NIS Elements AR 3.2 software. For data presentation, fluorescence/background (R/R0) was quantified over time. More than 50 cells were analyzed per replicate.
ILC2 Stimulation Assay
Small intestinal lamina propria ILC2s were isolated from Smart13 reporter mice and sorted as described. Sorted cells were plated at 4000–5000 cells per well in a 96 well plate and incubated overnight in 10 ng/mL IL-7 (R&D Systems) and basal media composed of high glucose DMEM supplemented with non-essential amino acids, 10% FBS, 100 mg/mL streptomycin/penicillin, 10mM HEPES, 1mM sodium pyruvate, 100μM 2-mercaptoethanol, and 2mM L-glutamine. The next morning media was replaced with fresh media and 10 ng/mL IL-7 and cells were stimulated with the indicated agonist. After a six-hour incubation at 37 °C, cells were stained with 1 μl/well of PE-conjugated anti-hCD4 for 20 minutes at 4 °C. Cells were washed, resuspended in DAPI, and analyzed on an LSRII (BD Biosciences).
Quantification and Statistical Analysis
All experiments were performed using randomly assigned mice without investigator blinding. Statistical details of experiments can be found in the figure legends. All data points and “n” values reflect biological replicates (i.e. mice), except in 4C where they represent technical replicates. No data were excluded. Statistical analysis was performed as noted in figure legends using Prism 7 (GraphPad) software. Holm-Sidak was used to correct for multiple comparisons. Graphs show mean + SEM.
Data and Software Availability
RNA-Seq data are available at the NCBI GEO under accession number GSE114067. The ITS sequence for T. rainier is available in GenBank under accession number MH370486.
Supplementary Material
Figure S1 | Related to Figure 1
Volcano plots showing pairwise comparisons of differentially expressed genes in the cell subsets analyzed by mRNA sequencing. Y axis = log2 fold change; X axis = log2 mean read count. Red dots represent genes with FDR < 0.01. SI = small intestine; Col = colon; Gall = gall bladder; Thy = thymus; Tr = trachea
Figure S2 | Related to Figure 2
(A) Indicated tissues from control or succinate-treated (150 mM; 7 days) wild-type mice were stained for tuft cells (anti-DCLK1; red) and nuclei (DAPI; blue). (B) Gating strategy for identification of ILC2s and eosinophils in the mesenteric lymph nodes (MLN). IL-13 production was assessed by staining for human CD4 in Smart13 reporter mice. (C–D) MLN from control or succinate-treated (150 mM; 7 days) wild-type mice were analyzed by flow cytometry to assess the frequency of ILC2s (C) and eosinophils (D) among all live cells. Data in A–B are representative of at least three experiments. Data in C–D are pooled from two experiments and bar graphs depict mean + SEM. Each symbol represents an individual mouse.**, p < 0.01; ***, p < 0.001 by Mann-Whitney.
Figure S3 | Related to Figure 3
(A) Diagram depicting the location of guide RNAs used to target Sucnr1 for disruption by CRISPR/Cas9. Guide 1 failed to induce any mutations. In the founder used to establish the Sucnr1−/− line reported in this study, an 8 base-pair deletion was detected at the binding site for guide 2. The resulting frame shift inserts a premature stop codon that truncates the C-terminal 208 amino acids of SUCNR1. (B–C) Mice of indicated genotypes were treated with 150 mM succinate for 7 days and mesenteric lymph nodes were harvested to quantify the frequency of ILC2s (B) and eosinophils (C) among all live cells by flow cytometry. (D) Gating strategy to identify ILC2s in the lamina propria of the small intestine. (E) ILC2s were stimulated in vitro as indicated for 6 hours and IL-13 production was quantified by flow cytometry using Smart13 reporter expression. (F) Intestinal organoids were cultured for 7 days under indicated conditions. Succinate concentrations = 100 μM, 1mM, and 10 mM. Tuft cell frequency (CD24+SigF+EpCAM+ cells) was quantified by flow cytometry. Data in B–C are pooled from three experiments. Data in D–F are representative of two experiments. Bar graphs depict mean + SEM. Each symbol represents an individual mouse (B–C) or technical replicate (E–F). *, p < 0.05 **, p < 0.01; ***, p < 0.001 by one-way ANOVA with comparison to Wt(B6).
Figure S4 | Related to Figure 4
(A) Representative images of T. rainier (arrows) with DAPI (blue) staining of nuclei. (B) Alignment of internal transcribed spacer sequence of T. rainier with published sequences for T. muris and T. musculis. (C) Diagram depicting the location of guide RNAs used to target Gnat3 for disruption by CRISPR/Cas9. In the founder used to establish the Gnat3−/− line reported in this study, the region between guide 1 and guide 2 was deleted. (D) Functional deletion of Gnat3 was confirmed by qPCR using primer pairs spaced across the entire mRNA. (E) Tritrichomonas colonization of indicated mice was quantified by qPCR using DNA generated from cecal contents. (F–G) Mice of indicated genotypes were colonized with T. rainier for 7 days and mesenteric lymph nodes were harvested and the frequency of ILC2s (F) and eosinophils (G) among all live cells was assessed by flow cytometry. Data are representative of three (B) two (A) or one (D) experiment or pooled (E–G) from two experiments. Bar graphs depict mean + SEM. Each symbol represents an individual mouse. *, p < 0.05 by one-way ANOVA with comparison to colonized Wt(B6).
Normalized RNA sequencing results with fold-change and statistical calculations for all genes that were differentially expressed among tuft cell subsets.
Normalized RNA sequencing results with fold-change and statistical calculations for all genes included in the transcriptional tuft cell signature.
Top 43 most enriched GO terms in the transcriptional tuft cell signature.
Top 42 most enriched KEGG pathways in the transcriptional tuft cell signature.
Highlights.
Expression of receptors enabling chemosensing on tuft cells is tissue-specific
Tuft cells in the small intestine express the succinate receptor SUCNR1
Succinate is sufficient to induce a multifaceted type 2 immune response
Immune sensing of Tritrichomonas colonization by tuft cells requires SUCNR1
Acknowledgments
We thank staff at the University of Washington Gnotobiotic Core for assistance with germ free mouse experiments, H.E. Liang for assistance with Gnat3 CRISPR targeting and validation, Z. Wang for experimental assistance, N. Arpaia for guidance on NMR analysis of intestinal samples, D. Hailey and the Garvey Cell Imaging Lab in the Institute for Stem & Cell Regenerative Medicine for microscopy support, and K. Smith for mice, reagents and advice. JWM is supported by the University of Washington Immunology Training Grant (T32 AI106677). JVM is a Damon Runyon–Dale Frey Breakthrough Scientist and a Searle Scholar. This work was supported by NIH 1DP2 OD024087 (JVM) and the University of Washington. mRNA sequencing was supported by NIH R01 AI26918 (RML) and the SABRE Center at UC San Francisco.
Footnotes
DECLARATION OF INTERESTS
The authors declare no competing interests.
AUTHOR CONTRIBUTIONS
MSN and JWM designed and performed experiments, analyzed data, and wrote the paper with JVM. MRLC, JBJ, and LP assisted with experiments at the University of Washington. CNM and CS assisted with cell isolation for RNA sequencing at UC San Francisco. JLP performed bioinformatics analysis of mRNA sequencing data, with supervision by DJE. GANG performed NMR analysis, with supervision by DR. MFF helped design experiments and write the paper. MSA and RML acquired funding and provided resources for mRNA sequencing. JVM conceived of and supervised the study, performed experiments, analyzed data, and wrote the paper with MSN, JWM, and MFF. All experiments besides RNA sequencing and Gnat3−/− infection were initiated at the University of Washington.
Publisher's Disclaimer: This is a PDF file of an unedited manuscript that has been accepted for publication. As a service to our customers we are providing this early version of the manuscript. The manuscript will undergo copyediting, typesetting, and review of the resulting proof before it is published in its final citable form. Please note that during the production process errors may be discovered which could affect the content, and all legal disclaimers that apply to the journal pertain.
References
- Ariza AC, Deen PMT, Robben JH. The Succinate Receptor as a Novel Therapeutic Target for Oxidative and Metabolic Stress-Related Conditions. Front Endocrinol. 2012;3 doi: 10.3389/fendo.2012.00022. [DOI] [PMC free article] [PubMed] [Google Scholar]
- Barker N. Adult intestinal stem cells: critical drivers of epithelial homeostasis and regeneration. Nat Rev Mol Cell Biol. 2014;15:19–33. doi: 10.1038/nrm3721. [DOI] [PubMed] [Google Scholar]
- Bezençon C, Fürholz A, Raymond F, Mansourian R, Métairon S, Le Coutre J, Damak S. Murine intestinal cells expressing Trpm5 are mostly brush cells and express markers of neuronal and inflammatory cells. J Comp Neurol. 2008;509:514–525. doi: 10.1002/cne.21768. [DOI] [PubMed] [Google Scholar]
- Chaudhari N, Roper SD. The cell biology of taste. J Cell Biol. 2010;190:285–296. doi: 10.1083/jcb.201003144. [DOI] [PMC free article] [PubMed] [Google Scholar]
- Chudnovskiy A, Mortha A, Kana V, Kennard A, Ramirez JD, Rahman A, Remark R, Mogno I, Ng R, Gnjatic S, et al. Host-Protozoan Interactions Protect from Mucosal Infections through Activation of the Inflammasome. Cell. 2016;167:444–456e14. doi: 10.1016/j.cell.2016.08.076. [DOI] [PMC free article] [PubMed] [Google Scholar]
- Deckmann K, Filipski K, Krasteva-Christ G, Fronius M, Althaus M, Rafiq A, Papadakis T, Renno L, Jurastow I, Wessels L, et al. Bitter triggers acetylcholine release from polymodal urethral chemosensory cells and bladder reflexes. Proc Natl Acad Sci U S A. 2014;111:8287–8292. doi: 10.1073/pnas.1402436111. [DOI] [PMC free article] [PubMed] [Google Scholar]
- De Vadder F, Kovatcheva-Datchary P, Zitoun C, Duchampt A, Bäckhed F, Mithieux G. Microbiota-Produced Succinate Improves Glucose Homeostasis via Intestinal Gluconeogenesis. Cell Metab. 2016;24:151–157. doi: 10.1016/j.cmet.2016.06.013. [DOI] [PubMed] [Google Scholar]
- Dobin A, Davis CA, Schlesinger F, Drenkow J, Zaleski C, Jha S, Batut P, Chaisson M, Gingeras TR. STAR: ultrafast universal RNA-seq aligner. Bioinformatics. 2013;29:15–21. doi: 10.1093/bioinformatics/bts635. [DOI] [PMC free article] [PubMed] [Google Scholar]
- Escalante NK, Lemire P, Cruz Tleugabulova M, Prescott D, Mortha A, Streutker CJ, Girardin SE, Philpott DJ, Mallevaey T. The common mouse protozoa Tritrichomonas muris alters mucosal T cell homeostasis and colitis susceptibility. J Exp Med. 2016;33 doi: 10.1084/jem.20161776. jem.20161776-10. [DOI] [PMC free article] [PubMed] [Google Scholar]
- Fallon PG, Ballantyne SJ, Mangan NE, Barlow JL, Dasvarma A, Hewett DR, McIlgorm A, Jolin HE, McKenzie ANJ. Identification of an interleukin (IL)-25-dependent cell population that provides IL-4, IL-5, and IL-13 at the onset of helminth expulsion. J Exp Med. 2006;203:1105–1116. doi: 10.1084/jem.20051615. [DOI] [PMC free article] [PubMed] [Google Scholar]
- Ferreyra JA, Wu KJ, Hryckowian AJ, Bouley DM, Weimer BC, Sonnenburg JL. Gut microbiota-produced succinate promotes C. difficile infection after antibiotic treatment or motility disturbance. Cell Host Microbe. 2014;16:770–777. doi: 10.1016/j.chom.2014.11.003. [DOI] [PMC free article] [PubMed] [Google Scholar]
- Gerbe F, Sidot E, Smyth DJ, Ohmoto M, Matsumoto I, Dardalhon V, Cesses P, Garnier L, Pouzolles M, Brulin B, et al. Intestinal epithelial tuft cells initiate type 2 mucosal immunity to helminth parasites. Nature. 2016;529:226–230. doi: 10.1038/nature16527. [DOI] [PMC free article] [PubMed] [Google Scholar]
- Gray EE, Winship D, Snyder JM, Child SJ, Geballe AP, Stetson DB. The AIM2-like receptors are dispensable for the interferon response to intracellular DNA. Immunity. 2016;45:255–266. doi: 10.1016/j.immuni.2016.06.015. [DOI] [PMC free article] [PubMed] [Google Scholar]
- Haber AL, Biton M, Rogel N, Herbst RH, Shekhar K, Smillie C, Burgin G, Delorey TM, Howitt MR, Katz Y, et al. A single-cell survey of the small intestinal epithelium. Nature. 2017;551:333–339. doi: 10.1038/nature24489. [DOI] [PMC free article] [PubMed] [Google Scholar]
- Helmby H. Human helminth therapy to treat inflammatory disorders- where do we stand? BMC Immunol. 2015;16 doi: 10.1186/s12865-015-0074-3. [DOI] [PMC free article] [PubMed] [Google Scholar]
- Höfer D, Püschel B, Drenckhahn D. Taste receptor-like cells in the rat gut identified by expression of alpha-gustducin. Proc Natl Acad Sci U S A. 1996;93:6631–6634. doi: 10.1073/pnas.93.13.6631. [DOI] [PMC free article] [PubMed] [Google Scholar]
- Howitt MR, Lavoie S, Michaud M, Blum AM, Tran SV, Weinstock JV, Gallini CA, Redding K, Margolskee RF, Osborne LC, et al. Tuft cells, taste-chemosensory cells, orchestrate parasite type 2 immunity in the gut. Science. 2016;351:1329–1333. doi: 10.1126/science.aaf1648. [DOI] [PMC free article] [PubMed] [Google Scholar]
- Huang DW, Sherman BT, Lempicki RA. Bioinformatics enrichment tools: paths toward the comprehensive functional analysis of large gene lists. Nucleic Acids Res. 2009a;37:1–13. doi: 10.1093/nar/gkn923. [DOI] [PMC free article] [PubMed] [Google Scholar]
- Huang DW, Sherman BT, Lempicki RA. Systematic and integrative analysis of large gene lists using DAVID bioinformatics resources. Nat Protoc. 2009b;4:44–57. doi: 10.1038/nprot.2008.211. [DOI] [PubMed] [Google Scholar]
- Ismail AS, Severson KM, Vaishnava S, Behrendt CL, Yu X, Benjamin JL, Ruhn KA, Hou B, DeFranco AL, Yarovinsky F, et al. γδ intraepithelial lymphocytes are essential mediators of host–microbial homeostasis at the intestinal mucosal surface. Proc Natl Acad Sci U S A. 2011;108:8743–8748. doi: 10.1073/pnas.1019574108. [DOI] [PMC free article] [PubMed] [Google Scholar]
- Janeway CA. Approaching the asymptote? Evolution and revolution in immunology. Cold Spring Harb Symp Quant Biol. 1989;54(Pt 1):1–13. doi: 10.1101/sqb.1989.054.01.003. [DOI] [PubMed] [Google Scholar]
- Krasteva G, Canning BJ, Hartmann P, Veres TZ, Papadakis T, Mühlfeld C, Schliecker K, Tallini YN, Braun A, Hackstein H, et al. Cholinergic chemosensory cells in the trachea regulate breathing. Proc Natl Acad Sci U S A. 2011;108:9478–9483. doi: 10.1073/pnas.1019418108. [DOI] [PMC free article] [PubMed] [Google Scholar]
- Lei W, Ren W, Ohmoto M, Urban JF, Matsumoto I, Margolskee RF, Jiang P. Activation of intestinal tuft cell-expressed Sucnr1 triggers type 2 immunity in the mouse small intestine. Proc Natl Acad Sci. 2018 doi: 10.1073/pnas.1720758115. 201720758. [DOI] [PMC free article] [PubMed] [Google Scholar]
- Liang HE, Reinhardt RL, Bando JK, Sullivan BM, Ho IC, Locksley RM. Divergent expression patterns of IL-4 and IL-13 define unique functions in allergic immunity. Nat Immunol. 2012;13:58–66. doi: 10.1038/ni.2182. [DOI] [PMC free article] [PubMed] [Google Scholar]
- Littlewood-Evans A, Sarret S, Apfel V, Loesle P, Dawson J, Zhang J, Muller A, Tigani B, Kneuer R, Patel S, et al. GPR91 senses extracellular succinate released from inflammatory macrophages and exacerbates rheumatoid arthritis. J Exp Med. 2016;213:1655–1662. doi: 10.1084/jem.20160061. [DOI] [PMC free article] [PubMed] [Google Scholar]
- Miller CN, Proekt I, von Moltke J, Wells KL, Rajpurkar AR, Wang H, Rattay K, Khan IS, Metzger TC, Pollack JL, et al. Thymic tuft cells promote an IL4-enriched medullary microenvironment and shape thymocyte development. Nature. 2018 doi: 10.1038/s41586-018-0345-2. In press. [DOI] [PMC free article] [PubMed] [Google Scholar]
- Mohrs M, Ledermann B, Köhler G, Dorfmüller A, Gessner A, Brombacher F. Differences between IL-4- and IL-4 receptor alpha-deficient mice in chronic leishmaniasis reveal a protective role for IL-13 receptor signaling. J Immunol Baltim Md 1950. 1999;162:7302–7308. [PubMed] [Google Scholar]
- von Moltke J, Ji M, Liang HE, Locksley RM. Tuft-cell-derived IL-25 regulates an intestinal ILC2-epithelial response circuit. Nature. 2016;529:221–225. doi: 10.1038/nature16161. [DOI] [PMC free article] [PubMed] [Google Scholar]
- Müller M, Mentel M, van Hellemond JJ, Henze K, Woehle C, Gould SB, Yu RY, van der Giezen M, Tielens AGM, Martin WF. Biochemistry and evolution of anaerobic energy metabolism in eukaryotes. Microbiol Mol Biol Rev MMBR. 2012;76:444–495. doi: 10.1128/MMBR.05024-11. [DOI] [PMC free article] [PubMed] [Google Scholar]
- Odegaard JI, Chawla A. Type 2 responses at the interface between immunity and fat metabolism. Curr Opin Immunol. 2015;36:67. doi: 10.1016/j.coi.2015.07.003. [DOI] [PMC free article] [PubMed] [Google Scholar]
- Paik J, Pershutkina O, Meeker S, Yi JJ, Dowling S, Hsu C, Hajjar AM, Maggio-Price L, Beck DAC. Potential for using a hermetically-sealed, positive-pressured isocage system for studies involving germ-free mice outside a flexible-film isolator. Gut Microbes. 2015;6:255–265. doi: 10.1080/19490976.2015.1064576. [DOI] [PMC free article] [PubMed] [Google Scholar]
- Rubic T, Lametschwandtner G, Jost S, Hinteregger S, Kund J, Carballido-Perrig N, Schwärzler C, Junt T, Voshol H, Meingassner JG, et al. Triggering the succinate receptor GPR91 on dendritic cells enhances immunity. Nat Immunol. 2008;9:1261–1269. doi: 10.1038/ni.1657. [DOI] [PubMed] [Google Scholar]
- Rubić-Schneider T, Carballido-Perrig N, Regairaz C, Raad L, Jost S, Rauld C, Christen B, Wieczorek G, Kreutzer R, Dawson J, et al. GPR91 deficiency exacerbates allergic contact dermatitis while reducing arthritic disease in mice. Allergy. 2017;72:444–452. doi: 10.1111/all.13005. [DOI] [PMC free article] [PubMed] [Google Scholar]
- Saz DK, Bonner TP, Karlin M, Saz HJ. Biochemical observations on adult Nippostrongylus brasiliensis. J Parasitol. 1971;57:1159–1162. [PubMed] [Google Scholar]
- Schneider C, O’Leary CE, Moltke J, von Liang H-E, Ang QY, Turnbaugh PJ, Radhakrishnan S, Pellizzon M, Ma A, Locksley RM. A Metabolite-Triggered Tuft Cell-ILC2 Circuit Drives Small Intestinal Remodeling. Cell. 2018 doi: 10.1016/j.cell.2018.05.014. [DOI] [PMC free article] [PubMed] [Google Scholar]
- Tannahill GM, Curtis AM, Adamik J, Palsson-McDermott EM, McGettrick AF, Goel G, Frezza C, Bernard NJ, Kelly B, Foley NH, et al. Succinate is an inflammatory signal that induces IL-1β through HIF-1α. Nature. 2013;496:238–242. doi: 10.1038/nature11986. [DOI] [PMC free article] [PubMed] [Google Scholar]
- Tielens AG. Energy generation in parasitic helminths. Parasitol Today Pers Ed. 1994;10:346–352. doi: 10.1016/0169-4758(94)90245-3. [DOI] [PubMed] [Google Scholar]
- Tizzano M, Gulbransen BD, Vandenbeuch A, Clapp TR, Herman JP, Sibhatu HM, Churchill MEA, Silver WL, Kinnamon SC, Finger TE. Nasal chemosensory cells use bitter taste signaling to detect irritants and bacterial signals. Proc Natl Acad Sci U S A. 2010;107:3210–3215. doi: 10.1073/pnas.0911934107. [DOI] [PMC free article] [PubMed] [Google Scholar]
- Trompette A, Gollwitzer ES, Yadava K, Sichelstiel AK, Sprenger N, Ngom-Bru C, Blanchard C, Junt T, Nicod LP, Harris NL, et al. Gut microbiota metabolism of dietary fiber influences allergic airway disease and hematopoiesis. Nat Med. 2014;20:159–166. doi: 10.1038/nm.3444. [DOI] [PubMed] [Google Scholar]
- Wolffram S, Badertscher M, Scharrer E. Carrier-mediated transport is involved in mucosal succinate uptake by rat large intestine. Exp Physiol. 1994;79:215–226. doi: 10.1113/expphysiol.1994.sp003754. [DOI] [PubMed] [Google Scholar]
Associated Data
This section collects any data citations, data availability statements, or supplementary materials included in this article.
Supplementary Materials
Figure S1 | Related to Figure 1
Volcano plots showing pairwise comparisons of differentially expressed genes in the cell subsets analyzed by mRNA sequencing. Y axis = log2 fold change; X axis = log2 mean read count. Red dots represent genes with FDR < 0.01. SI = small intestine; Col = colon; Gall = gall bladder; Thy = thymus; Tr = trachea
Figure S2 | Related to Figure 2
(A) Indicated tissues from control or succinate-treated (150 mM; 7 days) wild-type mice were stained for tuft cells (anti-DCLK1; red) and nuclei (DAPI; blue). (B) Gating strategy for identification of ILC2s and eosinophils in the mesenteric lymph nodes (MLN). IL-13 production was assessed by staining for human CD4 in Smart13 reporter mice. (C–D) MLN from control or succinate-treated (150 mM; 7 days) wild-type mice were analyzed by flow cytometry to assess the frequency of ILC2s (C) and eosinophils (D) among all live cells. Data in A–B are representative of at least three experiments. Data in C–D are pooled from two experiments and bar graphs depict mean + SEM. Each symbol represents an individual mouse.**, p < 0.01; ***, p < 0.001 by Mann-Whitney.
Figure S3 | Related to Figure 3
(A) Diagram depicting the location of guide RNAs used to target Sucnr1 for disruption by CRISPR/Cas9. Guide 1 failed to induce any mutations. In the founder used to establish the Sucnr1−/− line reported in this study, an 8 base-pair deletion was detected at the binding site for guide 2. The resulting frame shift inserts a premature stop codon that truncates the C-terminal 208 amino acids of SUCNR1. (B–C) Mice of indicated genotypes were treated with 150 mM succinate for 7 days and mesenteric lymph nodes were harvested to quantify the frequency of ILC2s (B) and eosinophils (C) among all live cells by flow cytometry. (D) Gating strategy to identify ILC2s in the lamina propria of the small intestine. (E) ILC2s were stimulated in vitro as indicated for 6 hours and IL-13 production was quantified by flow cytometry using Smart13 reporter expression. (F) Intestinal organoids were cultured for 7 days under indicated conditions. Succinate concentrations = 100 μM, 1mM, and 10 mM. Tuft cell frequency (CD24+SigF+EpCAM+ cells) was quantified by flow cytometry. Data in B–C are pooled from three experiments. Data in D–F are representative of two experiments. Bar graphs depict mean + SEM. Each symbol represents an individual mouse (B–C) or technical replicate (E–F). *, p < 0.05 **, p < 0.01; ***, p < 0.001 by one-way ANOVA with comparison to Wt(B6).
Figure S4 | Related to Figure 4
(A) Representative images of T. rainier (arrows) with DAPI (blue) staining of nuclei. (B) Alignment of internal transcribed spacer sequence of T. rainier with published sequences for T. muris and T. musculis. (C) Diagram depicting the location of guide RNAs used to target Gnat3 for disruption by CRISPR/Cas9. In the founder used to establish the Gnat3−/− line reported in this study, the region between guide 1 and guide 2 was deleted. (D) Functional deletion of Gnat3 was confirmed by qPCR using primer pairs spaced across the entire mRNA. (E) Tritrichomonas colonization of indicated mice was quantified by qPCR using DNA generated from cecal contents. (F–G) Mice of indicated genotypes were colonized with T. rainier for 7 days and mesenteric lymph nodes were harvested and the frequency of ILC2s (F) and eosinophils (G) among all live cells was assessed by flow cytometry. Data are representative of three (B) two (A) or one (D) experiment or pooled (E–G) from two experiments. Bar graphs depict mean + SEM. Each symbol represents an individual mouse. *, p < 0.05 by one-way ANOVA with comparison to colonized Wt(B6).
Normalized RNA sequencing results with fold-change and statistical calculations for all genes that were differentially expressed among tuft cell subsets.
Normalized RNA sequencing results with fold-change and statistical calculations for all genes included in the transcriptional tuft cell signature.
Top 43 most enriched GO terms in the transcriptional tuft cell signature.
Top 42 most enriched KEGG pathways in the transcriptional tuft cell signature.