Abstract.
Anthropogenic land use change, including agriculture, can alter mosquito larval habitat quality, increase mosquito abundance, and increase incidence of vector-borne disease. Rice is a staple food crop for more than half of the world’s population, with ∼1% of global production occurring within the United States (US). Flooded rice fields provide enormous areas of larval habitat for mosquito species and may be hotspots for mosquito-borne pathogens, including West Nile virus (WNV). West Nile virus was introduced into the Americas in 1999 and causes yearly epidemics in the US with an average of approximately 1,400 neuroinvasive cases and 130 deaths per year. We examined correlations between rice cultivation and WNV disease incidence in rice-growing regions within the US. Incidence of WNV disease increased with the fraction of each county under rice cultivation in California but not in the southern US. We show that this is likely due to regional variation in the mosquitoes transmitting WNV. Culex tarsalis was an important vector of WNV in California, and its abundance increased with rice cultivation, whereas in rice-growing areas of the southern US, the dominant WNV vector was Culex quinquefasciatus, which rarely breeds in rice fields. These results illustrate how cultivation of particular crops can increase disease risk and how spatial variation in vector ecology can alter the relationship between land cover and disease.
INTRODUCTION
Human land cover change can alter the spatial and temporal risk of vector-borne disease.1–3 Anthropogenic land use changes commonly associated with increased mosquito-borne disease include deforestation, urbanization, and agricultural development.1 Agricultural cropland covers ∼12% of the earth’s surface and flooded rice fields make up ∼11% of these areas.4 Rice fields can provide an extensive larval habitat for particular mosquito species, increasing local mosquito populations and disease risk in surrounding regions.5,6
West Nile virus (WNV) is a widespread mosquito-borne pathogen that was introduced to the Americas in 1999 and causes yearly epidemics in the United States (US) with an average of ∼1,400 neuroinvasive cases and 130 deaths.7,8 In addition, WNV has caused widespread mortality and substantial declines in populations of several bird species.9–11 Culex mosquitoes are considered to be the most important vectors for WNV transmission,12,13 and the abundance of infected Culex mosquitoes is strongly correlated with the number of human WNV cases.14,15
Several studies have previously examined the effect of land use on several aspects of WNV transmission. Urbanization has been associated with higher WNV seroprevalence in wild bird and mammal populations,16,17 and higher human disease incidence on a county scale in the eastern and central regions of the US.18–21 This is thought to be due to urbanization increasing larval habitat for container-breeding vectors of WNV including Culex pipiens and Culex quinquefasciatus.22–24 In the western US, grassland and agricultural land covers have been associated with higher human WNV disease incidence.19–21,25,26 Grassland and agricultural habitats are thought to increase the abundance of another important WNV vector, Culex tarsalis.27,28 Several studies at the national scale have argued that regional differences in land covers associated with increased WNV disease incidence roughly correspond to the distributions of major Culex vectors.19–21,29 However, the broad classification of grassland and agriculture land cover encapsulates a wide diversity of crop types, each with variable effects on mosquito abundance and WNV risk.27 In addition, none of the broad-scale studies correlating land cover with WNV disease incidence include quantitative data on mosquito abundance or infection to support the different regional correlations and conclusions.
We examined the influence of a particular agricultural land cover, rice fields, that provides larval habitat for some but not all mosquito species. We tested the following hypotheses: rice cultivation would increase the abundance of C. tarsalis mosquitoes; human WNV disease incidence would increase with C. tarsalis abundance; as a result, human WNV disease incidence would increase with rice cultivation in regions where C. tarsalis was a key vector of WNV but not in areas where C. tarsalis is rare or absent and other mosquito species are the dominant WNV vectors.
MATERIALS AND METHODS
Land use, climate, and WNV disease incidence.
We obtained 30 m land cover data from the United States Department of Agriculture National Agricultural Statistics Service.30 For each county, we summed the area of several land cover classes that could potentially be important for mosquitoes (rice fields, developed areas, wetlands, open water, and forested areas). We averaged data from seven different years available with 30 m resolution (2008–2014) and calculated the percent cover of each land cover class using the area of each land cover class divided by total county area. Developed areas included a combination of low, medium, and high intensity, as well as open space developed. Wetland areas included a combination of woody and herbaceous wetlands and forested areas included all deciduous, mixed, and evergreen forest types.
We calculated the percent of each county that was “irrigated agriculture” (including rice fields) from United States Geological Survey Moderate Resolution Imaging Spectroradiometer at 250 m resolution.31 We estimated “non-rice irrigated areas” by subtracting the rice-growing areas from the total irrigated area within each county. In addition, we calculated mean annual temperature and precipitation (2003–2011) for each county using data from the North America Land Data Assimilation System.32
We compiled reported human cases of WNV for each county from Centers for Disease Control and Prevention (CDC) ArboNET program for the years 2004–2015.7 Average human WNV disease incidence was calculated as the mean number of all cases (fever and neuroinvasive cases combined) per year divided by the county’s population.33
West Nile virus vector identification.
We estimated the role of different Culex species mosquitoes in the transmission of WNV in each county using the fraction of Culex WNV-positive pools reported to the CDC from 2004 to 2009. We used the fraction of positive pools to account for differences in sampling effort among counties; as long as each pool of Culex mosquitoes is equally likely to be tested and reported to the CDC, these data should provide relatively accurate estimates of the relative abundance of infected mosquitoes of each Culex species. We also examined the importance of Culex species in human WNV disease incidence across the US, by calculating a human population–weighted average of the county values of the fraction of WNV-positive mosquito pools attributed to each species. These estimates do not take into account the differences in feeding preferences or the fraction of WNV-infected mosquitoes that transmit WNV between mosquito species.12
Mosquito abundance.
We obtained mosquito trapping data from the California Vectorborne Disease Surveillance Gateway vector-borne disease surveillance system, which includes trapping data from vector control districts across California. We used New Jersey light trap (NJLT) data from the summer months (June–September) from the years 2000–2015. This dataset consisted of > 100,000 unique site visits across 1,284 locations spanning 34 counties in California. We estimated relative summer abundance of C. tarsalis in each county by taking the mean number of mosquitoes caught per trap location and then averaging across all trap locations within each county over the period 2000–2015. We further estimated the mean summer (June–September) abundance of Culex mosquitoes at particular trap sites located within 10 km of rice fields. This distance is well above the estimated average dispersal distance for C. tarsalis.34 For these estimates, each trap site was included only if it had at least 5 years of NJLT data with at least 10 visits per year.
Statistics.
We summarized geographic data using ESRI ArcMap 10, and performed all statistical analyses using program R, version 3.1.3. We used generalized least squares (gls) to build least squares regression models to predict the mean WNV disease incidence in each county using land cover and climate data (developed, water, wetland, rice, forest, irrigated areas, mean temperature, and mean rainfall data). West Nile virus disease incidence, land cover variables, and Culex abundance data were log10 transformed to equalize leverage and maintain adequate homogeneity of variance (see Supplemental Table 1). We accounted for spatial autocorrelation in WNV disease incidence data using exponential correlation structure within the gls models. We used piecewise regression models (R package “segmented”) to examine relationships between mosquito abundance and distance to nearest rice field.35 Piecewise regression uses an iterative process to reduce the residual sum of squares by fitting linear line segments across different rice distance intervals and comparing models with multiple segments to models with fewer segments.35
RESULTS
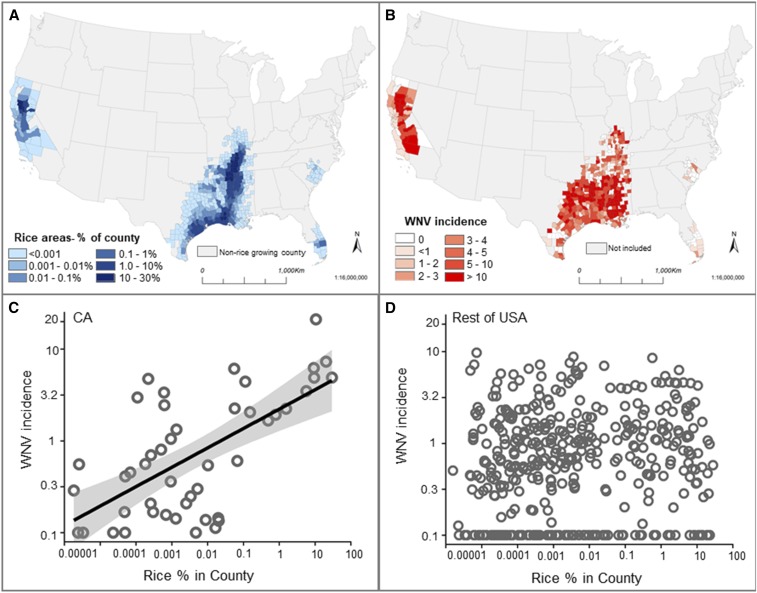
The main rice-growing regions of the US were in California, the Mississippi river delta, and southern Texas, with small additional areas in South Carolina and Florida (Figure 1A). A total of 459 counties in the US had rice-growing regions during the years 2008–2014. The amount of rice grown in each county varied widely with some rice-intensive counties having up to 30% of the county area covered in rice fields. Mean WNV disease incidence (2004–2015) in rice-growing counties was 1.25 people/100,000 per year (95% confidence interval = 1.08–1.42, standard error (SE) = 0.09) and ranged from 0 to 31 cases/100,000 people/year (Figure 1B).
Figure 1.
Rice cultivation and West Nile virus (WNV) incidence in rice-growing regions of the United States (US). (A) Average percent of each county growing rice over the period 2008–2014. (B) Average yearly human WNV incidence in reported cases per 100,000 people over the period in rice-growing counties 2004–2015. (C) Yearly average WNV incidence plotted against average rice cover in California: Log10 WNV incidence = 0.35 + 0.21 (±SE = 0.039) × Log10 percent rice cultivation; R2 = 0.41, N = 46; general least squares model including spatial autocorrelation, P = 0.04. (D) Average yearly WNV incidence plotted against average rice cover in the rest of the US: Log10 WNV incidence = −0.11 + 0.04 (±SE = 0.014) × Log10 percent rice cultivation; N = 413; R2 = 0.02; general least squares model including spatial autocorrelation, P = 0.88. For panels (C) and (D) counties with no WNV cases are shown with an incidence of 0.1. This figure appears in color at www.ajtmh.org.
In California, incidence of WNV disease increased with the percent of the county growing rice (Figure 1C). No other climate or land use variables contributed to an increase in WNV disease incidence (Supplemental Table 2). By contrast, outside California, incidence of WNV disease was uncorrelated with rice cover, and increased with developed area and decreased with open water cover (Figure 1D; Supplemental Table 3).
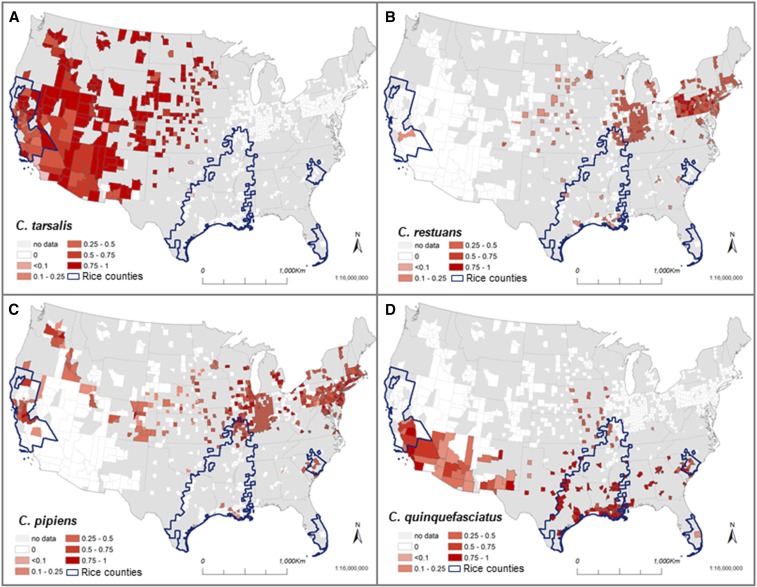
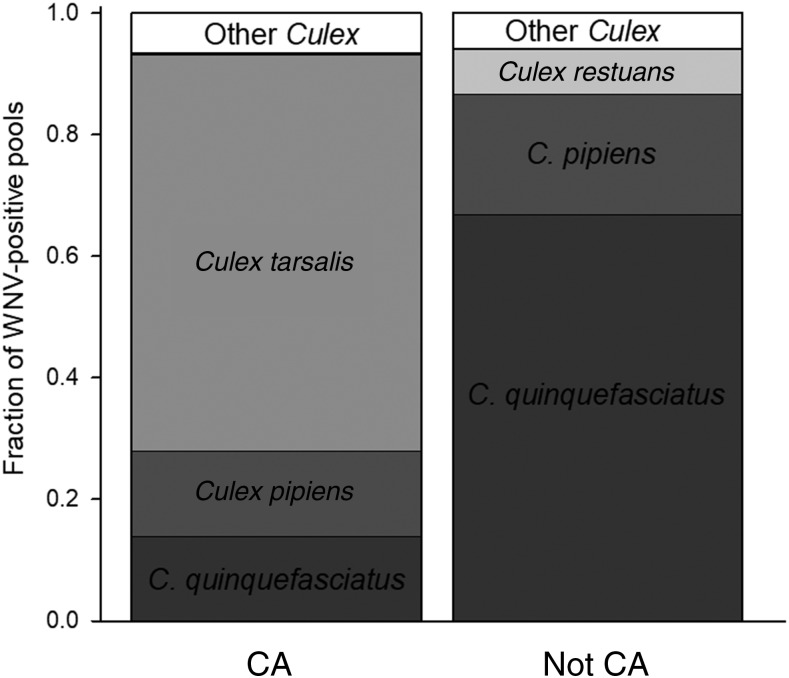
Of 13 different Culex species found to test positive for WNV across the US, the vast majority (> 93%) of WNV-positive mosquito pools came from only four species: C. pipiens (29%, SE = 1.1), C. tarsalis (28.3%, SE = 1.4), Culex restuans (18.7%, SE = 0.9), and C. quinquefasciatus (16.6%, SE = 1.2) (Supplemental Figure 1). The population weighted analysis also identified the same four species: C. pipiens (33%, SE = 0.7), C. quinquefasciatus (27%, SE = 1.5), C. restuans (17%, SE = 0.5), and C. tarsalis (15%, SE = 0.5) (Supplemental Figure 1). However, the importance of each mosquito species differed among counties and regions (Figures 2 and 3). In rice-growing regions of California, approximately 65% (SE = 5.0) of all reported WNV-positive mosquito samples were from C. tarsalis, 14% (SE = 3.6) were C. pipiens, and 14% (SE = 4.3) were C. quinquefasciatus (Figure 3). In rice-growing regions outside of California, the most important species were C. quinquefasciatus 66.8% (SE = 3.7), C. pipiens 20% (SE = 2.8), and C. restuans 7.3% (SE = 1.6), whereas C. tarsalis made up very few of the WNV pools 0.02% (SE = 0.01) (Figure 3).
Figure 2.
Spatial variation in West Nile virus (WNV) infected mosquitos. Panels show the fraction of 51,650 reported Culex WNV-positive mosquito pools (of 1–50 mosquitoes) from each of four Culex species (A = Culex tarsalis, B = Culex restuans, C = Culex pipiens, and D = Culex quinquefasciatus) for 821 counties across the United States (US) between the years 2004 and 2009. This figure appears in color at www.ajtmh.org.
Figure 3.
Relative contribution to West Nile virus (WNV)-infected Culex species in rice-growing areas across two different regions of the United States (US), 2004–2009. Columns show average fraction of WNV-positive pools attributed to each mosquito species from California counties with rice fields (CA, N = 44) and other rice field counties not in California (Not CA, N = 106).
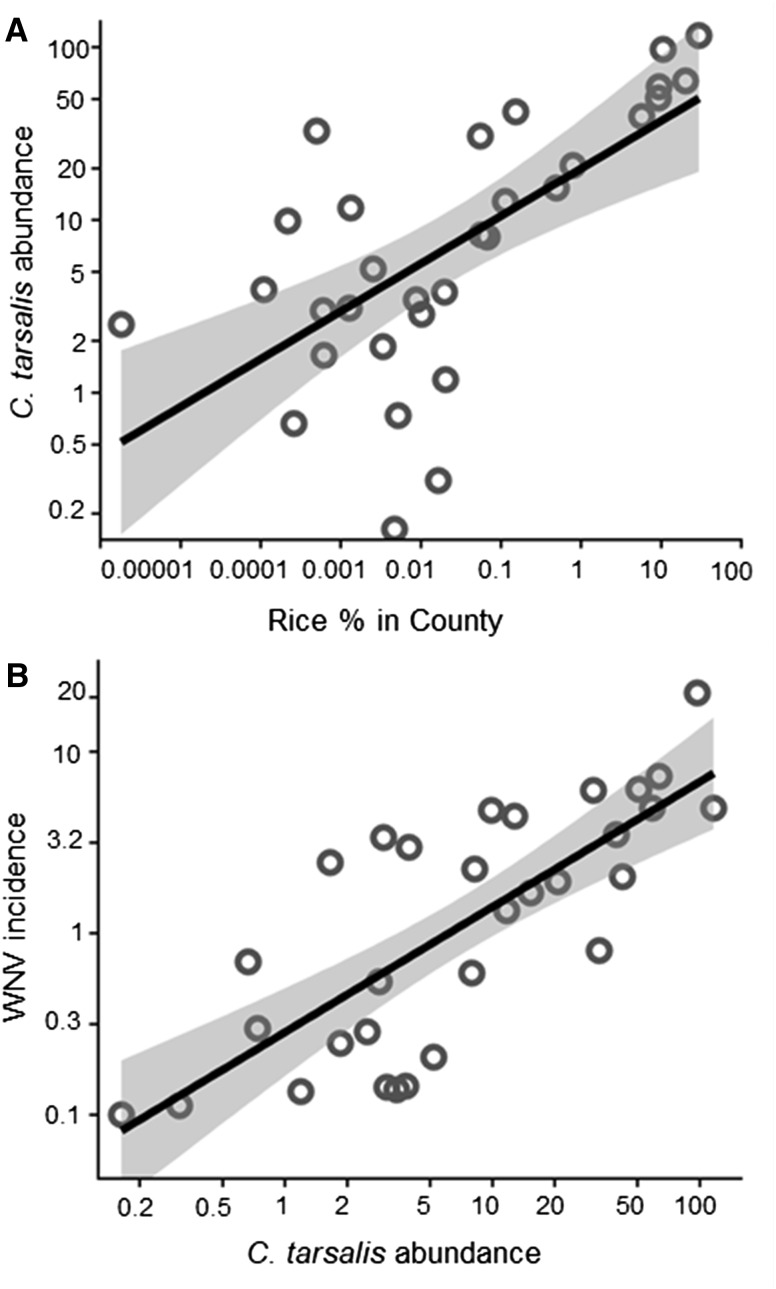
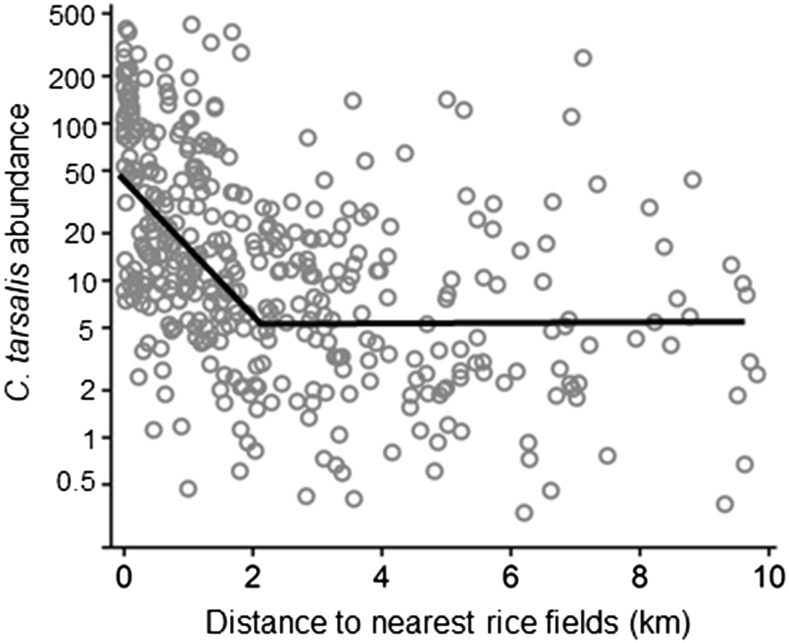
In California, rice cultivation was linked to mosquito abundance, and mosquito abundance was correlated with WNV disease incidence. The relative abundance of C. tarsalis per NJLT-week increased with rice cover (Figure 4A) and WNV disease incidence increased with C. tarsalis abundance (Figure 4B). Culex tarsalis abundance increased at trap sites (N = 388) located near rice fields (Figure 5). By contrast, we found no significant relationship between C. pipiens abundance and distance to rice fields (P = 0.74, Supplemental Figure 2). In addition, zero C. quinquefasciatus were caught in > 97% of trap sites (377/388) located within 10 km of rice fields.
Figure 4.
Rice cover, Culex tarsalis mosquito abundance, and human West Nile virus (WNV) incidence. (A) C. tarsalis abundance (New Jersey light trap mosquitoes per trap-week) in California between June and September, over the period 2000–2015 plotted against the percent rice cover in each county: Log10 C. tarsalis abundance = 1.30 + 0.28 (±SE = 0.06) × Log10 percent rice cultivation; N = 31, R2 = 0.44, general least squares model including spatial autocorrelation, P = 0.0004. (B) Average yearly human WNV incidence per 100,000 people (2004–2014) plotted against C. tarsalis abundance in each county: Log10 WNV incidence = −0.54 + 0.69 (±SE = 0.11) × Log10 C. tarsalis abundance; N = 31, R2 = 0.59, general least squares model including spatial autocorrelation, P = 0.0002. For panel (B), counties with no WNV cases are shown with an incidence of 0.1.
Figure 5.
Segmented regression analysis of Culex tarsalis mosquito abundance and distance to rice fields. Average C. tarsalis abundance (mosquitoes per New Jersey light trap-week) in California between June and September, plotted against distance to nearest rice field. Initial segment: Log10 C. tarsalis abundance = 1.7 − 0.43 (±SE = 0.067) × distance to rice field, R2 = 0.27, P < 0.0001, N = 388, estimated regression break point = 2.0 km (±SE = 0.28). Second segment slope (Slope = −0.027, ±SE = 0.021) was nonsignificant.
DISCUSSION
The larval ecology of mosquito vectors appears to play a key role in determining the effect of land use on mosquito-borne disease. Previous studies had found correlations between WNV disease incidence and agricultural land cover in the western US, and urban land cover in the eastern regions.19–21 These studies attributed these regional differences in which land cover increased WNV disease incidence to differences in the distributions of mosquito vectors. We extend these results by showing that an important agricultural crop, rice, appears to play a key role in WNV transmission in the western US by increasing the abundance of an important WNV vector in this region, C. tarsalis. We further showed that the effect of rice fields on WNV disease incidence depended on the relative importance of C. tarsalis in that region. Of the four Culex species that make more than 93% of reported WNV-positive mosquito pools in the US (C. pipiens, C. quinquefasciatus, C. restuans, and C. tarsalis), only C. tarsalis breeds in flooded agricultural fields and grasslands, whereas the other three species breed in container habitats.36 As a result, in rice-growing regions outside of California, where the dominant WNV vector was C. quinquefasciatus, WNV disease incidence was no longer correlated with rice cover and was instead correlated with urban land cover, as in other studies.37–39 These results provide a more detailed understanding of the mechanisms underlying some previous correlations with land use and land cover along with an evidentiary basis for the previously proposed hypotheses.19–21 It is worth noting that these findings are limited to rice-growing regions in California and the US. In other regions of North America, other species of mosquitoes are more important WNV vectors, including C. pipiens and C. restuans.12,14,40 Our study further shows how rice fields specifically increased C. tarsalis abundance whereas having no effects on other important WNV vectors such as C. pipiens or C. quinquefasciatus. Previous studies in California have found C. tarsalis larva to be abundant in rice fields41 and the rice-growing region of northern California to have the highest overall abundance of adult C. tarsalis of anywhere in the state.42 Other studies outside of the US have also found that the extent of rice fields was uncorrelated with the abundance of C. pipiens and C. quinquefasciatus.43,44 We also show that the increased abundance of C. tarsalis in rice field areas extended outward 2 km from rice field sites, well within the dispersal distance associated with this mosquito species.45 We observed a 7-fold increase in C. tarsalis abundance within 2 km of rice fields. This suggests that residential neighborhoods located within 2 km of rice fields are likely to have higher WNV disease risk. Although rice cultivation is clearly important for C. tarsalis, other factors, such as blood meal hosts46 and anthropogenic sources of light, also influence mosquito abundance or abundance estimates using NJLT.47
Rice fields also appear to be important for other mosquito-borne diseases. Results from this study are similar to findings in another disease system, Japanese encephalitis (JE). Japanese encephalitis is an important emerging infectious disease, endemic to many regions of Southeast Asia resulting in widespread morbidity (30,000–50,000 annual cases) and mortality (10,000–15,000 annual deaths).48,49 The abundance of one potentially important mosquito vector of JE, Culex tritaeniorhynchus, closely tracks rice-growing in space5,43,50 and time,51 and C. tritaeniorhynchus abundance is correlated with JE disease incidence.52–54
Rice is grown in more than 100 countries worldwide, with extensive cultivation in Southeast Asia (Supplemental Figure 3).55 Our results illustrate how certain crops can increase disease risk and how spatial variation in vector ecology can alter the relationship between land cover and disease. Efforts to mitigate this increased disease risk while supporting production of this key agricultural crop are needed to maximize human health and well-being.56
Supplementary Material
Supplemental Figures and Tables
Acknowledgments:
We would like to thank members of the Kilpatrick Lab at University of California Santa Cruz for feedback. Mosquito trapping data used in this study were obtained from the California Vector-borne Disease Surveillance (CalSurv) System, and we acknowledge its contributors, including the member agencies of the Mosquito and Vector Control Association of California, California Department of Public Health, and the Davis Arbovirus Research and Training (DART) laboratory at the University of California, Davis.
Note: Supplemental figures and tables appear at www.ajtmh.org.
REFERENCES
- 1.Gottdenker NL, Streicker DG, Faust CL, Carroll CR, 2014. Anthropogenic land use change and infectious diseases: a review of the evidence. Ecohealth 11: 619–632. [DOI] [PubMed] [Google Scholar]
- 2.Hassell JM, Begon M, Ward MJ, Fèvre EM, 2017. Urbanization and disease emergence: dynamics at the wildlife–livestock–human interface. Trends Ecol Evol 32: 55–67. [DOI] [PMC free article] [PubMed] [Google Scholar]
- 3.Bradley CA, Altizer S, 2007. Urbanization and the ecology of wildlife diseases. Trends Ecol Evol 22: 95–102. [DOI] [PMC free article] [PubMed] [Google Scholar]
- 4.Gong P, et al. 2013. Finer resolution observation and monitoring of global land cover: first mapping results with Landsat TM and ETM+ data. Int J Remote Sens 34: 2607–2654. [Google Scholar]
- 5.Richards EE, Masuoka P, Brett-Major D, Smith M, Klein TA, Kim HC, Anyamba A, Grieco J, 2010. The relationship between mosquito abundance and rice field density in the Republic of Korea. Int J Health Geogr 9: 32. [DOI] [PMC free article] [PubMed] [Google Scholar]
- 6.Diuk-Wasser MA, Touré MB, Dolo G, Bagayoko M, Sogoba N, Sissoko I, Traoré SF, Taylor CE, 2007. Effect of rice cultivation patterns on malaria vector abundance in rice-growing villages in Mali. Am J Trop Med Hyg 76: 869–874. [PMC free article] [PubMed] [Google Scholar]
- 7.Centers for Disease Control and Prevention (CDC) , 2016. West Nile Virus- Total Human Disease Cases Available at: https://diseasemaps.usgs.gov/mapviewer/. Accessed March 17, 2017.
- 8.Kilpatrick AM, 2011. Globalization, land use, and the invasion of West Nile virus. Science 334: 323–327. [DOI] [PMC free article] [PubMed] [Google Scholar]
- 9.LaDeau SL, Kilpatrick AM, Marra PP, 2007. West Nile virus emergence and large-scale declines of North American bird populations. Nature 447: 710–713. [DOI] [PubMed] [Google Scholar]
- 10.Kilpatrick AM, Peters RJ, Dupuis AP, 2nd, Jones MJ, Marra PP, Kramer LD, 2013. Predicted and observed mortality from vector-borne disease in small songbirds. Biol Conserv 165: 79–85. [DOI] [PMC free article] [PubMed] [Google Scholar]
- 11.Wheeler SS, Barker CM, Fang Y, Armijos MV, Carroll BD, Husted S, Johnson WO, Reisen WK, 2009. Differential impact of West Nile virus on California birds. Condor 111: 1–20. [DOI] [PMC free article] [PubMed] [Google Scholar]
- 12.Kilpatrick AM, Kramer LD, Campbell SR, Alleyne EO, Dobson AP, Daszak P, 2005. West Nile virus risk assessment and the bridge vector paradigm. Emerg Infect Dis 11: 425–429. [DOI] [PMC free article] [PubMed] [Google Scholar]
- 13.Kramer LD, Styer LM, Ebel GD, 2008. A global perspective on the epidemiology of West Nile virus. Annu Rev Entomol 53: 61–81. [DOI] [PubMed] [Google Scholar]
- 14.Kilpatrick AM, Pape WJ, 2013. Predicting human West Nile virus infections with mosquito surveillance data. Am J Epidemiol 178: 829–835. [DOI] [PMC free article] [PubMed] [Google Scholar]
- 15.Paull SH, Horton DE, Ashfaq M, Rastogi D, Kramer LD, Diffenbaugh NS, Kilpatrick AM, 2017. Drought and immunity determine the intensity of West Nile virus epidemics and climate change impacts. Proc Biol Sci 284: pii: 20162078. [DOI] [PMC free article] [PubMed] [Google Scholar]
- 16.Bradley CA, Gibbs SE, Altizer S, 2008. Urban land use predicts West Nile virus exposure in songbirds. Ecol Appl 18: 1083–1092. [DOI] [PubMed] [Google Scholar]
- 17.Gomez A, Kilpatrick A, Kramer LD, Ii APD, Maffei JG, Goetz SJ, Marra PP, Daszak P, Aguirre AA, 2008. Land use and West Nile virus seroprevalence in wild mammals. Emerg Infect Dis 14: 962–965. [DOI] [PMC free article] [PubMed] [Google Scholar]
- 18.Ruiz MO, Walker ED, Foster ES, Haramis LD, Kitron UD, 2007. Association of West Nile virus illness and urban landscapes in Chicago and Detroit. Int J Health Geogr 6: 10. [DOI] [PMC free article] [PubMed] [Google Scholar]
- 19.Bowden SE, Magori K, Drake JM, 2011. Regional differences in the association between land cover and West Nile virus disease incidence in humans in the United States. Am J Trop Med Hyg 84: 234–238. [DOI] [PMC free article] [PubMed] [Google Scholar]
- 20.Degroote J, Sugumaran R, 2012. National and regional associations between human West Nile virus incidence and demographic, landscape, and land use conditions in the coterminous United States. Vector Borne Zoonotic Dis 12: 657–665. [DOI] [PubMed] [Google Scholar]
- 21.Degroote J, Degroote JP, Sugumaran R, Ecker M, 2014. Landscape, demographic and climatic associations with human West Nile virus occurrence regionally in 2012 in the United States of America. Geospat Health 9: 153–168. [DOI] [PubMed] [Google Scholar]
- 22.Rochlin I, Faraji A, Ninivaggi DV, Barker CM, Kilpatrick AM, 2016. Anthropogenic impacts on mosquito populations in North America over the past century. Nat Commun 7: 13604. [DOI] [PMC free article] [PubMed] [Google Scholar]
- 23.Trawinski PR, Mackay DS, 2010. Identification of environmental covariates of West Nile virus vector mosquito population abundance. Vector Borne Zoonotic Dis 10: 515–526. [DOI] [PubMed] [Google Scholar]
- 24.Landau KI, van Leeuwen WJ, 2012. Fine scale spatial urban land cover factors associated with adult mosquito abundance and risk in Tucson, Arizona. J Vector Ecol 37: 407–418. [DOI] [PubMed] [Google Scholar]
- 25.Chuang T-W, Hockett CW, Kightlinger L, Wimberly M, 2012. Landscape-level spatial patterns of West Nile virus risk in the northern Great Plains. Am J Trop Med Hyg 86: 734–731. [DOI] [PMC free article] [PubMed] [Google Scholar]
- 26.Eisen L, Barker CM, Moore CG, Pape WJ, Winters AM, Cheronis N, 2010. Irrigated agriculture is an important risk factor for West Nile virus disease in the hyperendemic Larimer-Boulder-Weld area of north central Colorado. J Med Entomol 47: 939–951. [DOI] [PubMed] [Google Scholar]
- 27.Crowder DW, Dykstra EA, Brauner JM, Duffy A, Reed C, Martin E, Dutilleul P, Owen JP, Peterson W, Carrie Y, 2013. West Nile virus prevalence across landscapes is mediated by local effects of agriculture on vector and host communities. PLoS One 8: e55006. [DOI] [PMC free article] [PubMed] [Google Scholar]
- 28.Schurich JA, Kumar S, Eisen L, Moore CG, 2014. Modeling Culex tarsalis abundance on the northern Colorado front range using a landscape-level approach. J Am Mosq Control Assoc 30: 7–20. [DOI] [PubMed] [Google Scholar]
- 29.Skaff NK, Cheruvelil KS, 2016. Fine-scale wetland features mediate vector and climate- dependent macroscale patterns in human West Nile virus incidence. Landsc Ecol 31: 1615–1628. [Google Scholar]
- 30.USDA National Agricultural Statistics Service (NASS) , 2014. CropScape and Cropland Data Layer Available at: http://www.nass.usda.gov/Research_and_Science/Cropland/SARS1a.php. Accessed January 11, 2017.
- 31.USGS , 2012. Moderate Resolution Imaging Spectroradiometer (MODIS) Irrigated Agriculture Dataset for the United States Available at: http://earlywarning.usgs.gov/USirrigation. Accessed March 17, 2017.
- 32.North America Land Data Assimilation System (NLDAS) , 2011. Daily Air Temperatures and Heat Index Available at: http://wonder.cdc.gov/nasa-nldas.html. Accessed March 1, 2017.
- 33.US Census Bureau , 2010. County Human Population Available at: https://www.census.gov/2010census/data/. Accessed March 17, 2017.
- 34.Reisen WK, Lothrop HD, Lothrop B, 2003. Factors influencing the outcome of mark-release-recapture studies with Culex tarsalis (Diptera: Culicidae). J Med Entomol 40: 820–829. [DOI] [PubMed] [Google Scholar]
- 35.Muggeo MVMR, 2017. Package “segmented”. Biometrika 58: 525–534. [Google Scholar]
- 36.Reisen W, 2012. The contrasting bionomics of Culex mosquitoes in western North America. J Am Mosq Control Assoc 28: 82–91. [DOI] [PubMed] [Google Scholar]
- 37.Calhoun LM, Avery M, Jones LA, Gunarto K, King R, Roberts J, Burkot TR, Fox M, 2007. Combined sewage overflows (CSO) are major urban breeding sites for Culex quinquefasciatus in Atlanta, Georgia. Am J Trop Med Hyg 77: 478–484. [PubMed] [Google Scholar]
- 38.Chaves LF, Keogh CL, Vazquez-Prokopec GM, Kitron UD, 2009. Combined sewage overflow enhances oviposition of Culex quinquefasciatus (Diptera: Culicidae) in urban areas. J Med Entomol 46: 220–226. [DOI] [PubMed] [Google Scholar]
- 39.Deichmeister JM, Telang A, 2011. Abundance of West Nile virus mosquito vectors in relation to climate and landscape variables abundance of West Nile virus mosquito vectors in relation to climate. J Vector Ecol 36: 75–85. [DOI] [PubMed] [Google Scholar]
- 40.Andreadis TG, Anderson JF, Vossbrinck CR, Main AJ, 2004. Epidemiology of West Nile virus in Connecticut: a five-year analysis of mosquito data 1999–2003. Vector Borne Zoonotic Dis 4: 360–378. [DOI] [PubMed] [Google Scholar]
- 41.Pitcairn M, Wilson L, 1994. Spatial patterns of Anopheles freeborni and Culex tarsalis (Diptera: Culicidae) larvae in California rice fields. J Med Entomol 31: 545–553. [DOI] [PubMed] [Google Scholar]
- 42.Barker CCM, Eldridge BBF, Reisen WWK, 2010. Seasonal abundance of Culex tarsalis and Culex pipiens complex mosquitoes (Diptera: Culicidae) in California. J Med 47: 759–768. [DOI] [PMC free article] [PubMed] [Google Scholar]
- 43.Thongsripong P, Green A, Kittayapong P, Kapan D, Wilcox B, Bennett S, 2013. Mosquito vector diversity across habitats in central Thailand endemic for dengue and other arthropod-borne diseases. PLoS Negl Trop Dis 7: e2507. [DOI] [PMC free article] [PubMed] [Google Scholar]
- 44.Bisanzio D, Giacobini M, Bertolotti L, Mosca A, Balbo L, Kitron U, Vazquez-Prokopec GM, 2011. Spatio-temporal patterns of distribution of West Nile virus vectors in eastern Piedmont Region, Italy. Parasit Vectors 4: 230. [DOI] [PMC free article] [PubMed] [Google Scholar]
- 45.Reisen W, Lothrop H, 1995. Population ecology and dispersal of Culex tarsalis (Diptera: Culicidae) in the Coachella Valley of California. J Med Entomol 32: 490–502. [DOI] [PubMed] [Google Scholar]
- 46.Wood B, Washino R, Beck L, Hibbard K, 1991. Distinguishing high and low anopheline-producing rice fields using remote sensing and GIS technologies. Prev Vet Med 11: 277–288. [Google Scholar]
- 47.McDermott E, Mullens B, 2018. The dark side of light traps. J Med Entomol 55: 251–261. [DOI] [PubMed] [Google Scholar]
- 48.Erlanger TE, Weiss S, Keiser J, Utzinger J, Wiedenmayer K, 2009. Past, present, and future of Japanese encephalitis. Emerg Infect Dis 15: 1–7. [DOI] [PMC free article] [PubMed] [Google Scholar]
- 49.Keiser J, Maltese MF, Erlanger TE, Bos R, Tanner M, Singer BH, Utzinger J, 2005. Effect of irrigated rice agriculture on Japanese encephalitis, including challenges and opportunities for integrated vector management. Acta Trop 95: 40–57. [DOI] [PubMed] [Google Scholar]
- 50.Amerasinghe FP, Ariyasena TG, 1991. Survey of adult mosquitoes (Diptera: Culicidae) during irrigation development in the Mahaweli project, Sri Lanka. J Med Entomol 28: 387–393. [DOI] [PubMed] [Google Scholar]
- 51.Samuel P, Ramesh D, Thenmozhi V, Nagaraj J, Muniaraj M, Arunachalam N, 2016. Japanese encephalitis vector abundance and infection frequency in Cuddalore district, Tamil Nadu, India: a five-year longitudinal study. J Entomol Acarol Res 48: 366. [Google Scholar]
- 52.Miller RH, Masuoka P, Klein TA, Kim HC, Somer T, Grieco J, 2012. Ecological niche modeling to estimate the distribution of Japanese encephalitis virus in Asia. PLoS Negl Trop Dis 6: e1678. [DOI] [PMC free article] [PubMed] [Google Scholar]
- 53.Tian HY, et al. 2015. How environmental conditions impact mosquito ecology and Japanese encephalitis: an eco-epidemiological approach. Environ Int 79: 17–24. [DOI] [PubMed] [Google Scholar]
- 54.Guo S, Ling F, Hou J, Wang J, Fu G, Gong Z, 2014. Mosquito surveillance revealed lagged effects of mosquito abundance on mosquito-borne disease transmission: a retrospective study in Zhejiang, China. PLoS One 9: e112975. [DOI] [PMC free article] [PubMed] [Google Scholar]
- 55.FAO , 2017. Food and Agriculture Organization of the United Nations. Available at: http://www.fao.org/faostat/en/#home. Accessed March 17, 2017.
- 56.Kilpatrick AM, Salkeld DJ, Titcomb G, Hahn MB, 2017. Conservation of biodiversity as a strategy for improving human health and well-being. Philos Trans R Soc Lond B Biol Sci 372: pii: 20160131. [DOI] [PMC free article] [PubMed] [Google Scholar]
Associated Data
This section collects any data citations, data availability statements, or supplementary materials included in this article.
Supplementary Materials
Supplemental Figures and Tables


