

Abstract
The goal of chemotherapy is to induce homogeneous cell death within the population of targeted cancer cells. However, no two cells are exactly alike at the molecular level, and sensitivity to drug-induced cell death therefore varies within a population. Genetic alterations can contribute to this variability and lead to selection for drug resistant clones. However, there is a growing appreciation for the role of non-genetic variation in producing drug tolerant cellular states that exhibit reduced sensitivity to cell death for extended periods of time, from hours to weeks. These cellular states may result from individual variation in epigenetics, gene expression, metabolism and other processes that impact drug mechanism of action or the execution of cell death. Such population-level non-genetic heterogeneity may contribute to treatment failure and provide a cellular ‘substrate’ for the emergence of genetic alterations that confer frank drug resistance.
Keywords: cell death, heterogeneity, apoptosis, cancer, single-cell
Introduction
Cancer cells are often more sensitive to cell death than normal cells. Indeed, it is this heightened cell death susceptibility of cancer cells relative to normal cells that creates the windows of therapeutic vulnerability essential to the success of targeted and cytotoxic chemotherapy (Ni Chonghaile et al. 2011; Sarosiek et al. 2013; Sarosiek et al. 2017). Nevertheless, many cancer patients develop resistance to the lethal effects of front-line drugs, because of genetic alterations that alter target-drug interactions, enhance expression of drug efflux pumps, or interfere with the execution of cell death by blocking specific cell death pathways (e.g. Bcl-2 overexpression). These genetic lesions may accumulate gradually or in rapid, large-scale changes to the genome (Stephens et al. 2011), and they may be pre-existing within the population or induced by drug treatment (Stevens et al. 2013). Drug resistance arising from these types of genetic variation is well understood, at least in principle.
While cells can vary in genotype, even two cells with an identical genotype (i.e. isogenic cells) exposed to a uniform lethal stimulus can exhibit significant differences in the likelihood of dying, the timing of cell death onset, and even the mode of cell death (Gascoigne & Taylor 2008; Albeck et al. 2008; Spencer et al. 2009; Sharma et al. 2010; Thorburn et al. 2014; Wang et al. 2017). This phenotypic variation is most likely explained by stochastic, population-level heterogeneity between cells in the levels of individual biomolecules which, in sum, impact cell death phenotypes. This ‘non-genetic’ variability, leading to subpopulations of cells that are more tolerant of lethal stimuli, may provide a substrate for the evolution of genetic (mutational) resistance to a given drug (Ramirez et al. 2016; Brock et al. 2009; Altschuler & Wu 2010; Xia et al. 2014). Thus, understanding the causes and consequences of heterogeneous cell death responses could have important implications for the development of strategies to combat cancer.
Here we provide examples of heterogeneous population-level responses to lethal stimuli and discuss specific molecular and cellular processes that have been implicated in generating or regulating heterogeneous cell death responses. The emerging picture is that numerous inherently ‘noisy’ molecular processes can contribute to generating molecular differences between cells (i.e. cellular heterogeneity) that result in different responses cell-to-cell in response to lethal perturbation (Figure 1A). While we focus primarily on how lethal perturbations impact cancer cell death, it is likely that many of these mechanisms and principles are relevant to cell death induced by other lethal stresses and in other (i.e. non-cancer) cells.
Figure 1.
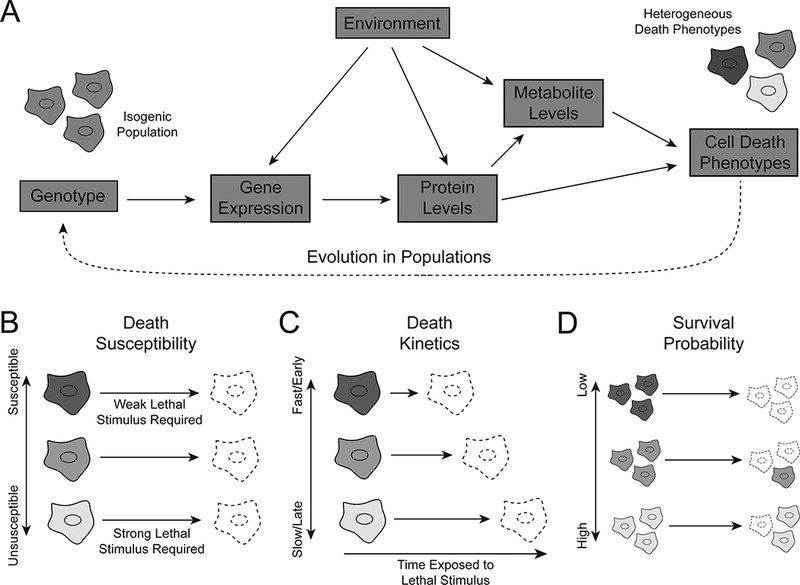
Heterogeneity arises at multiple levels between genotype and phenotype. (A) Noise, or cell-to-cell variation, in the flow of information from genotype to phenotype results in variation in cell death phenotypes that is not attributable to mutational differences between cells. (B) Death susceptibility refers to the strength of lethal stimulus required to induce death in a given cell. (C) Death kinetics refers to how long a given lethal stimulus must be applied to induce death in a given cell. (D) The probability of survival for a given cell experiencing a lethal stimulus for a given length of time depends on both death susceptibility and death kinetics.
Cellular heterogeneity and cell death
Examples of molecular and cellular heterogeneity have been described in isogenic populations of bacteria, single-celled eukaryotes, human cells in culture and other systems (Symmons & Raj 2016; Raj & van Oudenaarden 2009; Arriaga 2009; Eldar & Elowitz 2010). In 1944, studies of antibiotic-treated bacteria provided the first evidence for the existence of non-genetic heterogeneity and its contribution to variability in drug-induced cell death. These studies showed that populations of E. coli contained a small (1 in 1 × 10⁶) and variable number of drug tolerant persister (DTP) cells that did not die when exposed to an otherwise cytotoxic dose of penicillin. Penicillin tolerance was a non-genetic phenomenon distinguishable from drug resistance caused by DNA mutation, as isolated DTPs could give rise to populations of both drug sensitive and drug tolerant cells when expanded in culture (Bigger 1944). Thus, the bacterial DTP state appeared to be acquired in a stochastic and reversible fashion.
The bacterial DTP paradigm provides a conceptual foundation for understanding similar phenomena in drug-treated cancer cells (Sharma et al. 2010), but in both bacteria and mammalian systems, DTPs represent the extreme end of the spectrum of cell death heterogeneity among isogenic populations. While the DTP paradigm is a binary one (cells are either sensitive or tolerant), a more modest (and obvious) form of non-genetic heterogeneity is the response of cancer cell populations to graded doses of a lethal perturbation (e.g. a drug). It is typically possible to define a 50% inhibitory concentration (IC50) where, due to either cell death or growth inhibition, the measured viability at the IC50 dose is half that of the vehicle-treated condition (Holford & Sheiner 1981). The very possibility of defining an IC50 value for most drugs implies the existence of heterogeneous responses to lethal perturbation at the population level. Other canonical pharmacological parameters provide complementary information about heterogeneity, including variability in the maximum susceptibility of all cells in the population to death (Emax) and the range of doses over which a subset of cells in the population are killed (Hill slope) (Wolpaw et al. 2011; Xia et al. 2014; Fallahi-Sichani et al. 2013).
Another crucial factor is time. Cell death in response to a drug is typically not instantaneous, and different lethal stimuli kill cells with unique kinetics. These kinetics can be quantified using different methods, models and metrics, some of which integrate rates of death and proliferation into systematic descriptions of population dynamics (Tyson et al. 2012; Harris et al. 2016; Grootjans et al. 2016; Niepel et al. 2017; Forcina et al. 2017) (Figure 1C). Logically, the effects of time and lethal stimulus dose are not independent, and measuring cell death at different time points can result in different estimates of IC50 values (Alley et al. 1988; Harris et al. 2016). In some cases this has been linked to specific molecular mechanisms. Susceptibility to TNF-Related Apoptosis Inducing Ligand (TRAIL)-induced apoptosis in HeLa cells, for example, correlates with kinetic parameters quantifying the rate of caspase 8 substrate cleavage (Roux et al. 2015): cells with faster initial rates of caspase cleavage after TRAIL stimulus are more likely to die (Figure 1D). Below we explore in detail the molecular determinants of heterogeneous population-level responses to lethal perturbation.
Fractional killing
A clear in vivo manifestation of cell death heterogeneity is the clinical phenomenon of fractional killing, where in sequential rounds of treatment, cytotoxic chemotherapies typically kill a constant fraction of cells in a tumour rather than a constant absolute number of cells (Figure 2A) (Skeel & Khleif 2011). In cases where killing of cancer cells occurs in this manner, it follows that: (i) sensitivity of cells in the treated population to the drug applied does not vary due to mutational resistance, (ii) microenvironmental factors do not influence drug sensitivity, and (iii) drug sensitivity stays constant over all rounds of treatment (Skeel & Khleif 2011). In other cases, differential sensitivity to chemotherapy-induced death (due to the presence of a drug-resistant subpopulation, for example) can result in a declining fractional kill, with the tumour gradually becoming refractory to drug over time (Figure 2B) (Skipper 1971). A likely explanation for the fractional killing phenomenon is that heterogeneous population responses to drug treatment result in a subset of cells evading cell death within a given timeframe, similar to death observed made in tissue culture studies. Alternatively (or perhaps simultaneously) tumours in vivo could contain phenotypically distinct subpopulations of DTPs and/or cancer stem cells that are capable of regenerating a full tumour and promoting relapse even after apparently complete tumour regression (Reya et al. 2001). Whether fractional killing represents pre-existing heterogeneity among cells or the selective response of a sub-population of cells, is poorly understood. Nevertheless, studies of processes that contribute to heterogeneous population-level cell death in vitro are thought to be informative for understanding fractional killing phenomenon in vivo (Roux et al. 2015). The result of these processes is a phenotypically diverse population in which a fraction of cells survives each round of treatment (Figure 2C). The survival of this subpopulation may potentiate the development of mutational resistance to enable tumour evolution (Pisco et al. 2013; Ramirez et al. 2016) and other drug-induced changes in the surviving subpopulation may further enhance malignancy (S. Huang 2013).
Figure 2.

Fractional killing results from non-mutational heterogeneity. (A) Non-mutational heterogeneity results in a constant fraction of cancer cells in a population surviving subsequent rounds of lethal drug treatment. Recovery between treatment rounds allows the frequencies of drug sensitive and insensitive cells to return to those of the pre-treatment population. (B) If drug insensitivity is instead attributable to resistance-causing mutations, the fraction of drug resistant cells increases with each round of treatment as drug sensitive cells are removed from the population. As a result, less cell killing is achieved in each subsequent round of treatment. (C) Non-mutational heterogeneity may potentiate the development of genetic resistance. If a resistance-causing mutation is the only source of drug insensitivity phenotypes, all cells lacking the mutation will die in response to drug treatment. If non-genetic heterogeneity allows some cells to survive the initial drug treatment, some surviving cells may go on to acquire resistance-causing mutations.
Molecular processes implicated in the generation of cellular heterogeneity
Non-genetic differences in the levels of mRNA, proteins, metabolites, and other cellular components can cause some genetically identical cells to be more or less sensitive to drug-induced cell death (Figure 1A) (Lee et al. 2014; Spencer et al. 2009; Lagadinou et al. 2013). These differences arise due to random (stochastic) fluctuation between isogenic cells in gene and protein expression and reflect the noise inherent in biological systems (Arriaga 2009). The sources and consequences of this noise in various systems have been recently reviewed (Eldar & Elowitz 2010; Dueck et al. 2016). Here we focus on specific examples of molecular processes that have been linked to cellular heterogeneity impacting cell death responses.
Epigenetics
Cancer cells expressing activated oncogenes are frequently dependent upon (or “addicted to”) the continuous function of the mutated protein (Weinstein 2002; Luo et al. 2009). Direct inhibition of oncogene function, or inhibition of associated proteins in the same pathway, typically kills most cells within the population (Sharma et al. 2006). However, a small (0.1–5%) subpopulation of DTPs can often be isolated; this subpopulation tolerates drug exposure without dying for as long as several weeks and produces progeny that revert to the drug-sensitive state if the drug is subsequently removed (Sharma et al. 2010; Raha et al. 2014; Liau et al. 2017). For example, when PC9 non-small cell lung carcinoma cells harbouring an activating epidermal growth factor receptor (EGFR) mutation are treated with the EGFR inhibitor gefitinib at a dose that exceeds its IC50 by 100 fold, more than 99.5% of all cells are killed. The remaining cells (i.e. DTPs) survive, however, and a subset will even continue to proliferate (i.e. drug tolerant expanded persisters, DTEPs) (Sharma et al. 2010). Similar fractions of DTPs are observed in many other cancer cell line-drug combinations that have been tested (Sharma et al. 2010; Raha et al. 2014).
At the molecular level, gefitinib-induced PC9 DTPs are characterized by widespread alterations in histone modification, including a global decrease in histone 3 lysine acetylation (H3KAc), reduced trimethylation of H3K4 and increased H3K9 and H3K27 methylation (Guler et al. 2017). Changes in histone modifications correlate with increased expression of lysine demethylase 5A (KDM5A), which removes methyl groups from H3K4, as well as SETDB1, which promotes H3K9 methylation (Sharma et al. 2010; Guler et al. 2017). Interestingly, the lysine demethylase KDM5B is enriched in drug tolerant melanoma cells exposed to the BRAF inhibitor vemurafenib (Roesch et al. 2013), while glioblastoma stem cells tolerant of tyrosine kinase inhibitors require KDM6A/B function (Liau et al. 2017), implicating altered lysine methylation in the establishment and maintenance of the DTP state in diverse models. Indeed, a selective KDM5 inhibitor, CPI-455, which increases histone 3 lysine 4 (H3K4) methylation, can reduce the number of DTPs generated from erlotinib-treated PC9 populations, vemurafenib-treated COLO 829 melanoma populations, and other inhibitor/cell line combinations (Vinogradova et al. 2016). The development of additional inhibitors for specific KDMs and other epigenetic enzymes may further allow for the selective elimination of DTPs.
Downstream of specific histone modifications, the identity of the specific gene or genes involved in establishing or maintaining the DTP state in human cancer cells is not clear. One candidate gene overexpressed in many DTPs relative to parental cells is the metabolic enzyme aldehyde dehydrogenase 1 family member A1 (ALDH1A1). ALDHA1 converts aldehydes, including toxic lipid peroxides generated during periods of high reactive oxygen species (ROS) stress, to carboxylic acids. Expression of this protein may help mitigate ROS stress in DTPs caused by enhanced mitochondrial activity (Roesch et al. 2013; Raha et al. 2014). Indeed, as discussed below in another context, increased mitochondrial metabolism appears to be a common feature of diverse drug tolerant and/or cell death-resistant states (Roesch et al. 2013; Raha et al. 2014). Another possibility is that the epigenetic modifications observed in DTPs (e.g. H3K9 methylation) may function to globally repress the expression of long interspersed repeat elements (LINEs) (Guler et al. 2017). LINE expression is increased by drug treatment, but how repressing LINE expression contributes to the DTP state, and how LINE expression might contribute to drug induced cell death in sensitive parental cells, remains to be fully explored.
mRNA expression
mRNA transcription is an intrinsically stochastic process, with variable expression of the same gene between cells (Raj & van Oudenaarden 2008; Raj & van Oudenaarden 2009; Dalerba et al. 2011; Wagner et al. 2016; Alemu et al. 2014). Single-cell mRNA counts can vary by an order of magnitude or more; mRNA concentration (normalized to individual cell volume) is more homogenous but still highly variable (Kempe et al. 2015). As a result, pre-existing or induced variation in mRNA expression can contribute to heterogeneous drug responses. For example, paclitaxel treatment induces heterogeneous changes in mRNA expression between individual MDA-MB-231 breast cancer cells in culture (Lee et al. 2014). Although population averages of cells surviving after treatment recapitulate gene expression changes associated with DTPs described in other work, including upregulation of KDM5A and IGF1R (Sharma et al. 2010), single cell RNA-Seq reveals that individual surviving cells frequently induce expression of only a subset of DTP-associated genes. After the first round of paclitaxel treatment, removal of the drug from surviving cells resulted in the reversion of the treatment-associated transcriptional program. Despite this reversion, these surviving cells were more sensitive to a subsequent paclitaxel treatment than previously untreated counterparts, leaving open the question of how these cells retained a sensitizing “memory” of the first round of drug treatment (Lee et al. 2014).
Continued drug exposure after the initial killing phase, on the other hand, may yield different results. In patient-derived melanoma cell lines treated with the BRAF inhibitor vemurafenib, isolation of rare populations of tolerant cells allowed for identification of multiple marker genes whose expression correlates with tolerance, including cell surface markers (e.g. EGFR and NGFR) that could be used to enrich for this subpopulation by fluorescence-activated cell sorting (FACS) (Shaffer et al. 2017). When vemurafenib exposure was prolonged, this transient and reversible gene expression signature was “burned in” through changes in chromatin accessibility measured by assay for transposase-accessible chromatin by sequencing (ATAC-seq), including increased accessibility at the genomic loci encoding survival-associated genes. Although the molecular mechanisms underlying these changes in chromatin accessibility were not elucidated, the expression of KDM5A and KDM5B were unchanged in EGFR-sorted or long-term vemurafenib treated cells, suggesting a distinct mechanism from drug-tolerant populations discussed previously (Sharma et al. 2010; Roesch et al. 2013; Lee et al. 2014). Further, co-treatment with the EGFR/HER2 inhibitor lapatinib was able to abolish the stably resistant subpopulation when continually applied with vemurafenib but not when applied only during the initial killing phase, suggesting that gene expression changes associated with long term stable resistance may be distinct from transcriptional heterogeneity associated with initial heterogeneity in vemurafenib response (Shaffer et al. 2017).
Alternative mRNA splicing
The levels of alternatively spliced mRNAs can be heterogeneous between cells in a population (Waks et al. 2011), and alternatively spliced transcripts may in turn play a role in various cell death phenotypes (Gang et al. 2015; Schwerk & Schulze-Osthoff 2005). For example, alternative splicing of the BCL2 family members BCL2L1 and MCL1 can result in the production of both pro- and anti-apoptotic protein products, modulating the susceptibility of individual cells to apoptosis (Schwerk & Schulze-Osthoff 2005). If pronounced differences in the patterns of alternative splicing differed between two cells, this would therefore be expected to alter cell death responses. This splicing heterogeneity is regulated by splicing regulator proteins, whose activity may in turn be regulated by signalling pathways linked to processes like cell cycle progression (Moore et al. 2010). For example, knockdown of the mitosis regulating protein aurora kinase A (AURKA) resulted in a two-fold increase in the ratio of the pro-apoptotic to anti-apoptotic splice forms of BCL2L1 (Moore et al. 2010). Shifting this pro- to anti-apoptotic splice isoform ratio by knocking down the splicing factor SF3B1 also sensitized cells to apoptosis induced by the lethal chemotherapeutic daunorubicin (Massiello et al. 2006). Thus, while still speculative, it is plausible that stochastic variation in alternative splicing between cells could contribute to heterogeneity in cell death responses. Ultimately, such heterogeneity would most likely be generated by variations in (splicing) protein levels, as discussed next.
Protein expression
Many proteins display heterogeneous expression levels within a population, contributing to variation in cell death phenotypes. Some of this protein expression heterogeneity exists among cells in basal, untreated states. In cancer and other cells, pro- and anti-apoptotic BH3-family proteins localize at the outer mitochondrial membrane and determine the intensity of pro-death signal required to induce apoptosis (Figure 3A) (Sarosiek et al. 2013). Susceptibility to apoptosis has been linked to mitochondrial “priming,” a measure of how readily mitochondrial outer membrane permeabilization (MOMP) can be induced by lethal stimuli. Mitochondrial priming can be assessed by quantifying mitochondrial depolarization upon addition of recombinant pro-apoptotic BH3 family peptides (Figure 3B) (Ni Chonghaile et al. 2011).
Figure 3.

Methods for observation and quantification of apoptosis. (A) The intrinsic and extrinsic pathways of apoptosis are triggered by different lethal stimuli but converge on the activation of caspase-3 and caspase-7. (B) BH3 profiling measures the apoptotic priming of cells by measuring mitochondrial membrane potential after the addition of a BH3 peptide, which induces MOMP more readily in highly primed cells, resulting in decreased JC-1 fluorescence. (C) Reporters for various intermediate steps in the execution of the apoptotic pathway reveal the kinetics of these death mechanisms. For example, reporters for MOMP and effector caspase activity reveal that heterogeneity in death kinetics after application of TRAIL is attributable to cell-to-cell differences in time to MOMP, whereas time from MOMP to caspase-3 activation is highly homogeneous. Caspase activity can be measured by Förster resonance energy transfer (FRET) reporters that contain peptide sequences that are recognized and cleaved by caspases. (D) The CaspaseTracker system allows for the identification of cells that have undergone anastasis and their descendants. Caspase activity activates FLPase, which irreversibly induces the expression of GFP. All cells expressing GFP have therefore either survived caspase activation by undergoing anastasis themselves or are descended from another anastatic cell. Analysis of Drosophila expressing the CaspaseTracker reporter reveals a high frequency of anastasis in vivo over the course of development.
In acute myeloid leukaemia (AML) cell lines and patient samples, sensitivity to lethal chemotherapeutics correlates with a high degree of mitochondrial priming. This correlation is stronger for some lethal drugs than others, raising the possibility that some apoptotic stimuli may rely less completely on highly primed mitochondria to induce death (Vo et al. 2012). Using the FACS-compatible dye JC-1, mitochondrial priming can be examined at the single-cell level to assess heterogeneity within a population. Drug treatment can result in enrichment for unprimed AML blasts in patients after relapse (Vo et al. 2012). It is unclear whether the unprimed subpopulation selected in the first round of treatment is genetically or non-genetically distinct from the primed subpopulation that responds to therapy. Non-genetic heterogeneity is observed in BH3 profiles from somatic tissue from healthy mice, where variation in c-Myc expression levels modulate mitochondrial priming between tissues and over time (Sarosiek et al. 2017).
The role of BH3 family proteins in modulating apoptosis has prompted the development of BH3 mimetic therapeutics, compounds which mimic the effect of pro-apoptotic proteins at the mitochondrial outer membrane (Roberts et al. 2017). Susceptibility to one such BH3 mimetic, WEHI-539, is heterogeneous among isogenic HCT116 colorectal cancer cells and correlated with expression of anti-apoptotic BCL2L1 at the single cell level (Pécot et al. 2016). In most cases, however, mitochondrial priming does not correlate with expression of any single pro- or anti-apoptotic protein, although models that take expression levels of several BH3 family proteins as inputs can predict therapeutic response in some cases (Lindner et al. 2016).
Pioneering work on the origins of heterogeneity in susceptibility to TRAIL-induced apoptosis demonstrated that, as in the case of BH3 family proteins, no single protein can be identified for which expression levels determine apoptotic priming or death kinetics (Figure 3C) (Spencer et al. 2009). However, both the rate and degree of caspase activation determine whether a given cell will live or die in response to TRAIL stimulation. The levels of BCL-2 modulate the threshold of caspase activation, whereas levels of FLICE-like inhibitory protein (FLIP) modulate the kinetics of caspase activation, impacting the likelihood that a cell will meet the caspase activation threshold (Roux et al. 2015). As with mitochondrial priming, computational models of signalling pathways induced by TRAIL stimulation can predict susceptibility to TRAIL-induced apoptosis (Bertaux et al. 2014). In this context, heterogeneous death susceptibility is best captured by models which account not only for basal heterogeneity in protein levels, but in heterogeneous dynamics of protein translation and degradation over the course of TRAIL exposure. Thus, differences between cells in both basal protein level and the dynamics of protein expression can contribute to heterogeneous cell death responses.
The kinetics of protein accumulation may also govern heterogeneous cell death responses in certain contexts. In HCT-116 colorectal cancer cells treated with the DNA damaging agent cisplatin, cells that accumulate high levels of the canonical tumour suppressor protein p53 at an earlier timepoint are more likely to die rather than arrest (Paek et al. 2016). By contrast, cells within the population with a later accumulation of p53 are more likely to survive. Mechanistically, the gradual upregulation of inhibitors of apoptosis (IAP) family gene expression upon cisplatin administration result in a limited timeframe in which p53 accumulation can trigger cell death before high levels of IAP proteins confer protection. In addition to p53, the levels of other proteins can vary in a consistent way in response to lethal stimuli. In H1299 lung cancer cells (that lack p53 expression) survival after camptothecin treatment correlated with changes in the levels of the RNA helicase DDX5 and the replication factor RFC1 (Cohen et al. 2008). However, in this case, it is not clear whether or how DDX5 or RFC1 expression may contribute to differential cell survival. Likewise, a recently described method identifying an optimal reporter cell line for annotating compound libraries (ORACL) linked death induced by various compound classes to expression and localization of XRCC5, a protein associated with DNA double-strand break repair; treatment with lethal compound classes was linked to distinct changes in reporter expression and localization, but a mechanistic role for XRCC5 in responses to drug treatment was not identified (Kang et al. 2016). These results suggest that the determination of cell fate by protein expression dynamics is likely combinatorial and/or context-dependent.
Protein post-translational modification
Protein function, stability, localization, and other properties can be modulated by posttranslational modifications (PTMs) including phosphorylation, ubiquitination and others. In AML patient samples, FACS analysis of STAT3 and STAT5 phosphorylation reveals that subpopulations of cells from some patients can be activated by stimulation with granulocyte-colony stimulating factor (G-CSF) while the bulk of the population remains inactivated, consistent with protein PTM heterogeneity within a population (Irish et al. 2004). Although multiple combinations of applied cytokines and measured PTMs allowed for identification of heterogeneity in signalling pathway activity among AML blasts, only STAT3 and STAT5 phosphorylation after G-CSF stimulation correlated with patient response to chemotherapy, suggesting a potential role for heterogeneity of this specific PTM in drug tolerance and relapse (Irish et al. 2004). Single cell reporters of kinase activities, which allow for quantification of heterogeneous substrate phosphorylation, may provide more insight into both causes and consequences of this heterogeneity (Regot et al. 2014), but this relationship has not been explored in detail in live cells, and it remains largely unknown whether protein PTM status (as opposed to protein expression level) is sufficiently diverse to give rise to heterogeneous cell death responses at the population level.
Metabolism
Cancer cells exhibit overall altered metabolism compared to normal cells (Boroughs & DeBerardinis 2015). The cellular metabolic state represents the integrated activity of many different enzymes, and is therefore susceptible to variation in the expression or activity of these proteins (Labhsetwar et al. 2013) or, as described below, the levels of proteins that regulate metabolic flux directly or indirectly.
Specific metabolic enzymes such as lactate dehydrogenase A (LDHA) are potential targets for anti-cancer drug therapy. The novel LDHA inhibitor GNE-140 is lethal to a subset of cancer cell lines defined by a high reliance on glycolytic metabolism to maintain ATP production, and cell lines with a greater reliance on oxidative phosphorylation (OXPHOS) were less susceptible to GNE-140-induced death (Boudreau et al. 2016). Most cancer cells maintain a degree of metabolic flexibility, and acquired resistance to GNE-140 is associated with increased OXPHOS activity driven by higher 5’ AMP-activated protein kinase (AMPK)-mechanistic target of rapamycin (mTOR) pathway activity (Boudreau et al. 2016). In turn, it is possible to infer that variability in glycolysis between individual cells within a population may result in heterogeneous cell death responses to LDHA inhibition. While ATP production is somewhat unique in that the cell maintains two distinct systems capable of supplying ATP (i.e. glycolysis and OXPHOS), it is plausible that variability in other metabolic pathways may similarly result in heterogeneous responses to lethal stimuli.
Differences in metabolic state may also govern heterogeneous responses to lethal stimuli in vivo. In mouse models of pancreatic cancer driven by inducible KrasG12D expression, loss of KrasG12D (i.e. oncogene ‘ablation’) identified a pre-existing ‘surviving cell (SC)’ subpopulation that was resistant to oncogene ablation-induced apoptosis (Viale et al. 2014). SCs were defined by increased expression of mitochondrial metabolic genes, including those involved in mitochondrial electron transport chain function and mitochondrial β-oxidation, as well as enhanced autophagic gene expression. Corresponding increases in mitochondrial density and oxygen consumption were consistent with the notion that enhanced mitochondrial function, perhaps fuelled by increased autophagy or lipid breakdown (i.e. lipophagy), confers the selective ability to withstand loss of oncogenic Kras signalling (Viale et al. 2014). These results are reminiscent of drug tolerant cells isolated following inhibition of specific oncogenic proteins, which frequently exhibited increased mitochondrial function (Roesch et al. 2013; Raha et al. 2014).
Mechanistically, how enhanced mitochondrial function and/or autophagy prevent cell death in SC or DTP populations following oncogene withdrawal or inhibition is unclear. Conceivably, heightened mitochondrial function could inhibit apoptosis by altering the mitochondrial inner membrane transmembrane potential to impact MOMP, or protection from cell death could involve selective removal (i.e. via autophagy) of a pro-death protein (see below) or maintenance of a protective metabolite (e.g. ATP). Indeed, previous work established that oncogenic Kras expression causes increased glycolytic metabolism and glucose uptake in mouse pancreatic tumour cells (Ying et al. 2012). Thus, as observed in cell lines in response to LDHA inhibition, oncogene ablation-driven inhibition of Kras-dependent glucose uptake may expose the bulk of cancer cells to a catastrophic loss of ATP production, whereas cells with high levels of mitochondrial OXPHOS activity survive mutant Kras ablation due to increased activity of this alternative ATP biosynthetic process.
New genetically-encoded or synthetic chemical probes for metabolite levels (e.g. the glutathione probe RealThiol (Jiang et al. 2017)) may allow for new explorations of metabolic heterogeneity and cell death responses between cells in other populations where altered metabolism is associated with heightened resistance to cell death (Diehn et al. 2009).
Autophagy
Macroautophagy (hereafter autophagy) is a complex intracellular process that can result in self-digestion of intracellular material to restore homeostasis in response to starvation or stress (Mizushima et al. 2011; Kimmelman & White 2017). As noted above, autophagic flux may vary between cells in a population, contributing to variability in cell death sensitivity upon oncogene ablation (Viale et al. 2014). Molecular explanations for how such variability may contribute to heterogeneous cell death responses at the population level have recently emerged. For example, BJAB B-cell lymphoma cells engineered to express an mCherry-EGFP-LC3 autophagy reporter can be sorted for high or low basal levels of autophagic flux, which differ in their sensitivity to FAS ligand (but not TNF-related apoptosis-inducing ligand [TRAIL])-induced apoptosis (Gump et al. 2014). Mechanistically, high levels of autophagy lead to rapid turnover of Fas-associated phosphatase 1 (FAP1), which negatively regulates FAS receptor activity, leading to reduced sensitivity to FAS ligand-induced cell death, and accounting for the specificity towards one particular lethal stimulus (Gump et al. 2014). In BJAB cells, variation in autophagic flux rates were stable for at least 4 hours, but returned to baseline by 24 hours, indicating that such differences are transient within the population (Gump et al. 2014), perhaps in response to random variation in nutrient state between cells over time.
More generally, heterogeneous autophagy can alter the kinetics of apoptotic cell death within a population by regulating the timing of mitochondrial outer membrane permeabilization (MOMP) (Thorburn et al. 2014). In HeLa cells exposed to a uniformly lethal concentration of TRAIL, all cells will undergo MOMP, but time from TRAIL stimulus to MOMP varies from less than 1 hour to greater than 2 hours. One process that may contribute to this variability is variation between cells in basal autophagy, as induction of autophagy uniformly delays the timing of MOMP within the population by several hours (Thorburn et al. 2014). In this context, the effect of autophagy on death sensitivity is not attributable to decreased activity of the TRAIL death effector pathway (including the TNF receptor or the BH3 interacting domain death agonist, BID), but rather to decreased basal expression of the pro-death BH3 protein BCL2 binding component 3 (BBC3), also known as p53 upregulated modulator of apoptosis (PUMA) (Thorburn et al. 2014). Impressively, cells with high levels of basal autophagy and low levels of PUMA can survive exposure to TRAIL and even the induction of MOMP, ultimately regaining the ability to proliferate (Thorburn et al. 2014).
Other key cell death regulators of non-apoptotic cell death are autophagic substrates (e.g. catalase (Yu et al. 2006)). Thus, basal rates of autophagy could result in heterogeneous cell death responses in various contexts. Of note, the activity of two key regulators of autophagy, unc-51 like autophagy activating kinase (ULK) 1/2 and transcription factor EB (TFEB), are controlled via mTOR phosphorylation (Kim et al. 2011; Settembre et al. 2012). mTOR inhibitors are lethal to many different cancer cell lines, but substantial heterogeneity in mTOR inhibitor-induced cell death is observed within populations of cultured breast cancer cell lines, especially around the EC50 concentrations of these inhibitors (Fallahi-Sichani et al. 2013). Heterogeneous cell death correlates with variability in the inhibition of canonical mTOR target proteins such as eukaryotic translation initiation factor 4E binding protein 1 (4E-BP1) (Fallahi-Sichani et al. 2013) that themselves are not direct regulators of cell death. One possibility is that variable mTOR activity contributes to heterogeneous autophagic flux between cells, resulting in altered sensitivity to apoptosis through a specific molecular mechanism, such as regulation of PUMA expression. Indeed, mTOR inhibitor sensitive and tolerant populations are interconvertible within 24 hours (Fallahi-Sichani et al. 2013), which is a similar timescale to that observed for changes in autophagic flux between cells (Gump et al. 2014).
Entosis
While autophagy provides a means for one cell to digest a portion of its own cytoplasm, entosis (‘cell eating’) refers to a related process where one cell completely engulfs and kills a second cell via a microtubule associated protein 1 light chain 3 (LC3) and lysosome-dependent mechanism (Overholtzer et al. 2007; Florey et al. 2011; Krajcovic et al. 2011). Like autophagy, this mechanism may support the long-term survival of tumour cells when detached from the extracellular matrix or exposed to nutrient starvation (Overholtzer et al. 2007; Hamann et al. 2017). Entosis occurs spontaneously in certain populations of cancer cells (e.g. MCF-7 breast cancer cells) and can be further enhanced by glucose starvation (Durgan et al. 2017; Hamann et al. 2017).
The occurrence of entosis is inherently heterogeneous within a population at two levels. First, engulfment does not lead to cell death in all cases: ~10% of engulfed cells can subsequently ‘escape’ from the host cell (Overholtzer et al. 2007; Florey et al. 2011). Second, the consumption of a ‘loser’ cell by a ‘winner’ cell is not a random process (Sun et al. 2014). At the molecular level, winner cells exhibit increased mechanical deformability, a phenotype controlled by the activity of the cellular actinomyosin network (Sun et al. 2014). In response to glucose starvation, higher levels of AMPK pathway activity may inhibit the cytoskeletal regulator Ras-related C3 botulinum toxin substrate 1 (RAC1) or alter myosin contraction, leading to reduced mechanical deformability and ‘loser’ status (Hamann et al. 2017). Thus, susceptibility to entosis may be governed by fluctuations in the metabolic state of the cell, providing a link between heterogeneous glycolytic metabolism/AMPK activity within a cellular population and susceptibility to entotic cell death. Whether other metabolic perturbations, such as alterations in lipid metabolism, influence entosis remains to be determined. In the meantime, these results provide stark evidence for the existence of cellular heterogeneity in cell death responses within a single population.
Anastasis
As noted above, not all cells that are engulfed during entosis ultimately die. An even more extreme form of ‘resurrection’ can be observed in a cell autonomous fashion where cells will recover from the brink of death. Downstream of MOMP, activation of caspase 3 and DNA damage caused by caspase-activated DNAse is typically thought to be associated with an irreversible commitment to the execution of apoptosis (Figure 3A). However, in primary mouse liver and NIH 3T3 cells, over 90% of cells treated with lethal doses of ethanol can reverse canonical apoptotic hallmarks (including caspase activation, nuclear condensation, and mitochondrial fragmentation) if ethanol is removed from cells after 5 hours (Tang et al. 2012). This reversal of apoptosis, referred to as anastasis, has also been observed in vivo throughout the development and lifespan of Drosophila (Tang et al. 2015; Ding et al. 2016) (Figure 3D). Reversal of apoptosis after application of lethal ethanol doses was associated with increased expression of heat shock proteins and antiapoptotic BCL2 family members, and small molecule inhibitors of BCL2, XIAP, MDM2, and HSP90 dramatically reduced the frequency of anastasis (from 90% of cells to around 40%) (Tang et al. 2012).
These results add to a growing body of evidence suggesting that while in most cells MOMP is a point of no return (Albeck et al. 2008; Spencer et al. 2009), there also exist poorly-defined subsets of cells where incomplete MOMP (iMOMP) (Tait et al. 2010), or the expression of specific factors (e.g. PUMA mRNA) (Thorburn et al. 2014), may enable the recovery of a small number of cells following exposure to an otherwise lethal stimulus. The ability of cancer cells to exhibit biochemical and morphological features of apoptotic cell death (e.g. MOMP, caspase activation) and yet recover and ultimately continue to proliferate highlights the high degree of regulation of cell death, and represents an additional potential origin for heterogeneity in responses to lethal stimuli.
Cellular manifestations of molecular heterogeneity impacting cell death sensitivity
The molecular processes described above interact to produce cells that are more or less sensitive to a given lethal stimulus. Additionally, at the cellular level, several features or ‘states’ have been identified that are correlated with differences in sensitivity to lethal stimulation. These states do not always have a precise or comprehensive molecular definition, and mechanisms promoting the adoption of a particular state are not always clear. Nonetheless, the coexistence of cells in different states is an additional mechanism that might give rise to heterogeneous cell death responses.
Cell proliferation rate
Transit through the cell cycle is a cell-level mechanism that modulates sensitivity to lethal perturbation. Classically, rapid proliferation was thought to sensitize cancer cells to cell death triggered by chemotherapies targeting microtubule function (O’Reilly et al. 1992; Huuhtanen et al. 1999). The generalizability of this observation, however, has recently been questioned, since new measurements indicate that cancer cells in vivo do not, in fact, proliferate rapidly enough to explain the selectivity of drugs like microtubule targeting agents (Komlodi-Pasztor et al. 2011). Nonetheless, slow-cycling subpopulations of cancer cells frequently display reduced sensitivity to lethal drug treatment (Roesch et al. 2010; Roesch et al. 2013; Fallahi-Sichani et al. 2017; Sharma et al. 2010; Liau et al. 2017). In these contexts, slow-cycling phenotypes often overlap with cell stemness phenotypes, which may or may not be coincidental (Easwaran et al. 2014). Whether these states and the associated changes in gene expression, protein, and metabolite levels are intrinsically linked is unclear.
One factor that may impact drug sensitivity via cell cycle status is MYC expression. In patient-derived neuroblastoma samples, MYC expression is negatively correlated with the likelihood an individual cell will become senescent in response to doxorubicin treatment (Ryl et al. 2017). In cells with high MYC expression that did not senesce, cell fate was governed by cell cycle phase at the time of doxorubicin addition. Cells in G1 at drug addition were more likely to survive and resume proliferation, and this subpopulation was targetable by inhibition of the DNA damage sensing kinase ATM. By blocking the ability of the drug-insensitive subpopulation to sense and repair DNA damage, this combinatorial approach suggests a potential strategy to target non-genetic heterogeneity and demonstrates that cell cycle phase, in addition to the rate of cycling, is a notable source of this heterogeneity.
Transient cell states
Heterogeneous molecular processes like those described above may be further integrated into broader cell states, with variable fractions of a given population of cells existing in a particular state at any given time. The rates of transitions between states, therefore, play an important role in determining the frequency of drug sensitive and drug tolerant subpopulations and the consequent population-level sensitivity observed (Enderling 2015; S. Huang 2013). In breast cancer cell populations encompassing basal, luminal, and stem cell subpopulations, stochastic transitions between these states tend to restore the total population to equilibrium after sorting for a pure population of any single state (Gupta et al. 2011), suggesting that some cancer cell populations may inherently tend toward heterogeneity.
Indeed, the numerous sources of non-genetic heterogeneity discussed here may suggest that, rather than representing a failure of otherwise deterministic mechanisms for information flow in cells, non-genetic variability is an important tool for populations of cells to ensure robust responses to unpredictable conditions (Dueck et al. 2016). For example, analysis of the signalling pathway activated by TRAIL suggests that limits on the fidelity of information transmission through the pathway are not imposed by biological or physical limitations, but rather may be necessary to allow graded cell death responses in a population (Suderman et al. 2017).
Other subpopulations linked to drug sensitivity include cells which have undergone an epithelial-to-mesenchymal transition (Mitra et al. 2015). As observed in cancer progression, this transition has been linked to chemoresistance phenotypes; heterogeneity in epithelial versus mesenchymal state as measured by fluorescent lineage markers correlates with resistance to lethal drug treatments in lung and pancreatic cancer (Fischer et al. 2015; Zheng et al. 2015). Cells in a mesenchymal state that are less sensitive to chemotherapeutics may display other targetable sensitivities, such as a reliance on the lipid peroxide detoxifying enzyme glutathione peroxidase 4 (GPX4); this dependency can be exploited by inducing ferroptosis, an oxidative, non-apoptotic cell death pathway, in mesenchymal cells (Hangauer et al. 2017; Viswanathan et al. 2017).
Cell non-autonomous signalling
Non-genetic heterogeneity may be the result of variable inputs to each cell in a population from its microenvironment; heterogeneity in mRNA transcript levels within a given population, for example, may be driven by paracrine signalling (Shalek et al. 2014). In the context of cancer, the tumour microenvironment modulates sensitivity to drug-induced cancer cell death (W. Zhang & P. Huang 2011). Co-culturing breast cancer cells with cancer associated fibroblasts (CAFs) before treatment with the HER2 inhibitor lapatinib results in altered gene expression, decreased drug uptake, and decreased mitochondrial priming in cancer cells (Marusyk et al. 2016). This effect is mediated by hyaluronan, an extracellular matrix proteoglycan produced on the cell surface of CAFs, and is not observed when breast cancer cells are treated in conditioned media from CAFs, suggesting that CAFs must be in direct contact with tumour cells to exert a protective effect.
In addition to microenvironmental signals from the stroma, heterogeneity among cancer cells themselves may give rise to a microenvironment that affects drug sensitivity. In mouse models of small cell lung cancer (SCLC), heterogeneous activation of the Notch signalling pathway was correlated with a loss of neuroendocrine identity that was mediated by the transcriptional repressor REST (Lim et al. 2017). Cells with Notch activation and loss of neuroendocrine differentiation were resistant to the standard chemotherapy regimen used to treat SCLC; this subpopulation also secreted factors that promoted proliferation in neighbouring cells that maintained neuroendocrine differentiation. These results provide an example wherein disrupting mechanisms that give rise to heterogeneity (e.g. Notch activation) may alter cell death phenotypes for therapeutic benefit.
Future Directions
Cell death susceptibility and kinetics
Opportunities remain for a more systematic analysis of how cell death susceptibility varies over time within a population (Figure 4A). Several studies discussed here have identified markers of highly susceptible cells in response to particular lethal stimuli (Lagadinou et al. 2013; Sarosiek et al. 2017; Fallahi-Sichani et al. 2017; Shaffer et al. 2017). It remains unclear whether these markers of dose-dependent susceptibility correlate in a predictable way with time-dependent death kinetics, or if distinct factors govern each of these aspects of drug sensitivity (Figure 4B). If susceptibility and kinetics are in fact intrinsically linked, analysis of death kinetics may provide useful metrics for analysis of heterogeneity, analogous to the Hill slope and Emax parameters discussed above.
Figure 4.
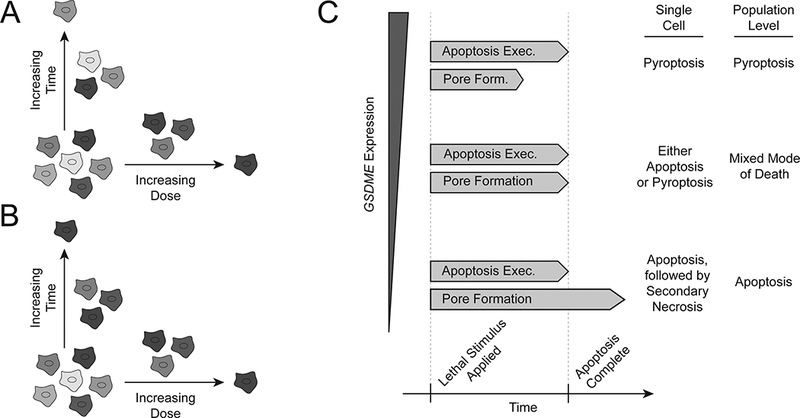
Heterogeneity in cell death susceptibility, kinetics, and mode. (A) Death susceptibility and kinetics may be governed by orthogonal factors. In this case, late-dying cells would not share characteristics with unsusceptible cells, nor would early-dying cells with highly susceptible cells. (B) On the other hand, similarities in the characteristics associated with drug sensitivity by each of these measures would indicate an intrinsic link between kinetics and susceptibility. Clonal cell lines expressing reporters for expression of death sensitivity-associated genes would allow for systematic analysis of both measures of sensitivity in a high- or low-expression subpopulation. (C) In cells with constant kinetics of apoptosis execution, variability in the time required to form GSDME pores might determine the mode of death executed. For a given clonal population, the level of GSDME expression might regulate the rate of pore formation and determine which death pathway is executed. For a population in which GSDME expression (or expression of apoptotic effectors) is heterogeneous, this heterogeneity might result in genetically identical cells executing different death pathways.
Non-genetic heterogeneity in cell death pathway selection
In addition to heterogeneity in death susceptibility and death kinetics, the death pathway that is used to execute cell death in response to a given stimulus may also be heterogeneous. Although this type of heterogeneity has not yet been demonstrated at the single cell level, expression of the protein gasdermin E (GSDME, also known as DFNA5) at the population level in cell lines is correlated with the propensity to undergo pyroptosis rather than apoptosis after treatment with chemotherapeutics (Wang et al. 2017). Pyroptosis is a non-apoptotic form of cell death that was previously characterized as involving cleavage of another gasdermin family member, gasdermin D (GSDMD), by caspase 1 (Aglietti et al. 2016; Brennan & Cookson 2000). In a similar process, GSDME is cleaved by caspase 3 after execution of the intrinsic apoptosis pathway to induce membrane permeabilization associated with secondary necrosis, a process of cell elimination that occurs when apoptotic cells are not scavenged by immune cells (Rogers et al. 2017; Silva 2010). Levels of gasdermin family proteins may therefore determine whether (i) gasdermin cleavage and pore formation precede the execution of the molecular mechanisms of apoptosis, in which case pyroptosis may occur, or (ii) the full apoptotic cascade is executed before gasdermin pore formation occurs, in which case this pore formation may result in secondary necrosis (Figure 4C). The kinetics of caspase cleavage and pore-forming protein cleavage have not been described in these contexts; the use of fluorescent cleavage reporters as in the kinetic characterization of TRAIL-induced apoptosis (Spencer et al. 2009) may elucidate the interactions between apoptosis, pyroptosis, and secondary necrosis in these contexts as well as reveal potential non-genetic heterogeneity at the single cell level.
Translational implications of non-genetic heterogeneity
The study of bacterial DTPs has yielded novel approaches to the treatment of tuberculosis (Y. Zhang et al. 2012). The drug pyrazinamide, for example, specifically targets non-proliferating M. tuberculosis persisters to reduce the required treatment time in combined treatment regimens (Y. Zhang et al. 2012). This combinatorial approach provides a model for the potential therapeutic application of new insights into non-genetic heterogeneity among cancer cells. Analysis of DTPs generated from multiple combinations of cancer cell lines and drugs, for example, showed a common dependence on GPX4 in these subpopulations (Hangauer et al. 2017). This is consistent with work discussed above showing a correlation between a mesenchymal gene signature, therapy resistance, and dependence on GPX4 (Viswanathan et al. 2017). The combination of GPX4-targeting, ferroptosis-inducing compounds with traditional chemotherapies may therefore enhance anti-tumour efficacy by specifically targeting DTPs in addition to the bulk population of cells in tumour. As understanding of non-genetic heterogeneity among cancer cells improves, similar approaches for targeting other vulnerabilities of drug insensitive subpopulations may become possible.
Acknowledgments
Disclosure of Interest
Support for this work was provided by the NSF to Z.I. and by the NIH (4R00CA166517 and 1R01GM122923) and the Damon Runyon Foundation to S.J.D.
References:
- Aglietti RA et al. , 2016. GsdmD p30 elicited by caspase-11 during pyroptosis forms pores in membranes. Proceedings of the National Academy of Sciences of the United States of America, 113(28), pp.7858–7863. [DOI] [PMC free article] [PubMed] [Google Scholar]
- Albeck JG et al. , 2008. Quantitative analysis of pathways controlling extrinsic apoptosis in single cells. Molecular cell, 30(1), pp.11–25. [DOI] [PMC free article] [PubMed] [Google Scholar]
- Alemu EY et al. , 2014. Determinants of expression variability. Nucleic acids research, 42(6), pp.3503–3514. [DOI] [PMC free article] [PubMed] [Google Scholar]
- Alley MC et al. , 1988. Feasibility of drug screening with panels of human tumor cell lines using a microculture tetrazolium assay. Cancer research, 48(3), pp.589–601. [PubMed] [Google Scholar]
- Altschuler SJ & Wu LF, 2010. Cellular heterogeneity: do differences make a difference? Cell, 141(4), pp.559–563. [DOI] [PMC free article] [PubMed] [Google Scholar]
- Arriaga EA, 2009. Determining biological noise via single cell analysis. Analytical and bioanalytical chemistry, 393(1), pp.73–80. [DOI] [PMC free article] [PubMed] [Google Scholar]
- Bertaux F et al. , 2014. Modeling dynamics of cell-to-cell variability in TRAIL-induced apoptosis explains fractional killing and predicts reversible resistance. Saucerman JJ, ed. PLoS computational biology, 10(10), p.e1003893. [DOI] [PMC free article] [PubMed] [Google Scholar]
- Bigger J, 1944. Treatment of staphylococcal infections with penicillin by intermittent sterilisation. The Lancet, 244(6320), pp.497–500. [Google Scholar]
- Boroughs LK & DeBerardinis RJ, 2015. Metabolic pathways promoting cancer cell survival and growth. Nature cell biology, 17(4), pp.351–359. [DOI] [PMC free article] [PubMed] [Google Scholar]
- Boudreau A et al. , 2016. Metabolic plasticity underpins innate and acquired resistance to LDHA inhibition. Nature chemical biology, 12(10), pp.779–786. [DOI] [PubMed] [Google Scholar]
- Brennan MA & Cookson BT, 2000. Salmonella induces macrophage death by caspase-1-dependent necrosis. Molecular microbiology, 38(1), pp.31–40. [DOI] [PubMed] [Google Scholar]
- Brock A, Chang H & Huang S, 2009. Non-genetic heterogeneity — a mutation-independent driving force for the somatic evolution of tumours. Nature Reviews Genetics, 10(5), pp.336–342. [DOI] [PubMed] [Google Scholar]
- Cohen AA et al. , 2008. Dynamic proteomics of individual cancer cells in response to a drug. Science (New York, N.Y.), 322(5907), pp.1511–1516. [DOI] [PubMed] [Google Scholar]
- Dalerba P et al. , 2011. Single-cell dissection of transcriptional heterogeneity in human colon tumors. Nature biotechnology, 29(12), pp.1120–1127. [DOI] [PMC free article] [PubMed] [Google Scholar]
- Diehn M et al. , 2009. Association of reactive oxygen species levels and radioresistance in cancer stem cells. Nature, 458(7239), pp.780–783. [DOI] [PMC free article] [PubMed] [Google Scholar]
- Ding AX et al. , 2016. CasExpress reveals widespread and diverse patterns of cell survival of caspase-3 activation during development in vivo. eLife, 5, p.9674. [DOI] [PMC free article] [PubMed] [Google Scholar]
- Dueck H, Eberwine J & Kim J, 2016. Variation is function: Are single cell differences functionally important?: Testing the hypothesis that single cell variation is required for aggregate function. BioEssays : news and reviews in molecular, cellular and developmental biology, 38(2), pp.172–180. [DOI] [PMC free article] [PubMed] [Google Scholar]
- Durgan J et al. , 2017. Mitosis can drive cell cannibalism through entosis. eLife, 6, p.304. [DOI] [PMC free article] [PubMed] [Google Scholar]
- Easwaran H, Tsai H-C & Baylin SB, 2014. Cancer epigenetics: tumor heterogeneity, plasticity of stem-like states, and drug resistance. Molecular cell, 54(5), pp.716–727. [DOI] [PMC free article] [PubMed] [Google Scholar]
- Eldar A & Elowitz MB, 2010. Functional roles for noise in genetic circuits. Nature, 467(7312), pp.167–173. [DOI] [PMC free article] [PubMed] [Google Scholar]
- Enderling H, 2015. Cancer stem cells: small subpopulation or evolving fraction? Integrative biology : quantitative biosciences from nano to macro, 7(1), pp.14–23. [DOI] [PubMed] [Google Scholar]
- Fallahi-Sichani M et al. , 2017. Adaptive resistance of melanoma cells to RAF inhibition via reversible induction of a slowly dividing de-differentiated state. Molecular systems biology, 13(1), p.905. [DOI] [PMC free article] [PubMed] [Google Scholar]
- Fallahi-Sichani M et al. , 2013. Metrics other than potency reveal systematic variation in responses to cancer drugs. Nature Chemical Biology, 9(11), pp.708–714. [DOI] [PMC free article] [PubMed] [Google Scholar]
- Fischer KR et al. , 2015. Epithelial-to-mesenchymal transition is not required for lung metastasis but contributes to chemoresistance. Nature, 527(7579), pp.472–476. [DOI] [PMC free article] [PubMed] [Google Scholar]
- Florey O et al. , 2011. Autophagy machinery mediates macroendocytic processing and entotic cell death by targeting single membranes. Nature cell biology, 13(11), pp.1335–1343. [DOI] [PMC free article] [PubMed] [Google Scholar]
- Forcina GC et al. , 2017. Systematic Quantification of Population Cell Death Kinetics in Mammalian Cells. Cell systems, 4(6), pp.600–610.e6. [DOI] [PMC free article] [PubMed] [Google Scholar]
- Gang H et al. , 2015. PDK2-mediated alternative splicing switches Bnip3 from cell death to cell survival. The Journal of cell biology, 210(7), pp.1101–1115. [DOI] [PMC free article] [PubMed] [Google Scholar]
- Gascoigne KE & Taylor SS, 2008. Cancer cells display profound intra- and interline variation following prolonged exposure to antimitotic drugs. Cancer cell, 14(2), pp.111–122. [DOI] [PubMed] [Google Scholar]
- Grootjans S et al. , 2016. A real-time fluorometric method for the simultaneous detection of cell death type and rate. Nature protocols, 11(8), pp.1444–1454. [DOI] [PubMed] [Google Scholar]
- Guler GD et al. , 2017. Repression of Stress-Induced LINE-1 Expression Protects Cancer Cell Subpopulations from Lethal Drug Exposure. Cancer cell, 32(2), pp.221–237.e13. [DOI] [PubMed] [Google Scholar]
- Gump JM et al. , 2014. Autophagy variation within a cell population determines cell fate through selective degradation of Fap-1. Nature cell biology, 16(1), pp.47–54. [DOI] [PMC free article] [PubMed] [Google Scholar]
- Gupta PB et al. , 2011. Stochastic state transitions give rise to phenotypic equilibrium in populations of cancer cells. Cell, 146(4), pp.633–644. [DOI] [PubMed] [Google Scholar]
- Hamann JC et al. , 2017. Entosis Is Induced by Glucose Starvation. Cell reports, 20(1), pp.201–210. [DOI] [PMC free article] [PubMed] [Google Scholar]
- Hangauer MJ et al. , 2017. Drug-tolerant persister cancer cells are vulnerable to GPX4 inhibition. Nature, 551(7679), pp.247–250. [DOI] [PMC free article] [PubMed] [Google Scholar]
- Harris LA et al. , 2016. An unbiased metric of antiproliferative drug effect in vitro. Nature methods, 13(6), pp.497–500. [DOI] [PMC free article] [PubMed] [Google Scholar]
- Holford NH & Sheiner LB, 1981. Understanding the dose-effect relationship: clinical application of pharmacokinetic-pharmacodynamic models. Clinical pharmacokinetics, 6(6), pp.429–453. [DOI] [PubMed] [Google Scholar]
- Huang S, 2013. Genetic and non-genetic instability in tumor progression: link between the fitness landscape and the epigenetic landscape of cancer cells. Cancer metastasis reviews, 32(3–4), pp.423–448. [DOI] [PubMed] [Google Scholar]
- Huuhtanen RL et al. , 1999. A high proliferation rate measured by cyclin A predicts a favourable chemotherapy response in soft tissue sarcoma patients. British Journal of Cancer, 81(6), pp.1017–1021. [DOI] [PMC free article] [PubMed] [Google Scholar]
- Irish JM et al. , 2004. Single Cell Profiling of Potentiated Phospho-Protein Networks in Cancer Cells. Cell, 118(2), pp.217–228. [DOI] [PubMed] [Google Scholar]
- Jiang X et al. , 2017. Quantitative real-time imaging of glutathione. Nature communications, 8, p.16087. [DOI] [PMC free article] [PubMed] [Google Scholar]
- Kang J et al. , 2016. Improving drug discovery with high-content phenotypic screens by systematic selection of reporter cell lines. Nature biotechnology, 34(1), pp.70–77. [DOI] [PMC free article] [PubMed] [Google Scholar]
- Kempe H et al. , 2015. The volumes and transcript counts of single cells reveal concentration homeostasis and capture biological noise. Molecular biology of the cell, 26(4), pp.797–804. [DOI] [PMC free article] [PubMed] [Google Scholar]
- Kim J et al. , 2011. AMPK and mTOR regulate autophagy through direct phosphorylation of Ulk1. Nature cell biology, 13(2), pp.132–141. [DOI] [PMC free article] [PubMed] [Google Scholar]
- Kimmelman AC & White E, 2017. Autophagy and Tumor Metabolism. Cell metabolism, 25(5), pp.1037–1043. [DOI] [PMC free article] [PubMed] [Google Scholar]
- Komlodi-Pasztor E et al. , 2011. Mitosis is not a key target of microtubule agents in patient tumors. Nature reviews. Clinical oncology, 8(4), pp.244–250. [DOI] [PubMed] [Google Scholar]
- Krajcovic M et al. , 2011. A non-genetic route to aneuploidy in human cancers. Nature cell biology, 13(3), pp.324–330. [DOI] [PMC free article] [PubMed] [Google Scholar]
- Labhsetwar P et al. , 2013. Heterogeneity in protein expression induces metabolic variability in a modeled Escherichia coli population. Proceedings of the National Academy of Sciences of the United States of America, 110(34), pp.14006–14011. [DOI] [PMC free article] [PubMed] [Google Scholar]
- Lagadinou ED et al. , 2013. BCL-2 inhibition targets oxidative phosphorylation and selectively eradicates quiescent human leukemia stem cells. Cell stem cell, 12(3), pp.329–341. [DOI] [PMC free article] [PubMed] [Google Scholar]
- Lee M-CW et al. , 2014. Single-cell analyses of transcriptional heterogeneity during drug tolerance transition in cancer cells by RNA sequencing. Proceedings of the National Academy of Sciences of the United States of America, 111(44), pp.E4726–35. [DOI] [PMC free article] [PubMed] [Google Scholar]
- Liau BB et al. , 2017. Adaptive Chromatin Remodeling Drives Glioblastoma Stem Cell Plasticity and Drug Tolerance. Cell stem cell, 20(2), pp.233–246.e7. [DOI] [PMC free article] [PubMed] [Google Scholar]
- Lim JS et al. , 2017. Intratumoural heterogeneity generated by Notch signalling promotes small-cell lung cancer. Nature, 545(7654), pp.360–364. [DOI] [PMC free article] [PubMed] [Google Scholar]
- Lindner AU et al. , 2016. BCL-2 system analysis identifies high-risk colorectal cancer patients. Gut, pp.gutjnl–2016–312287. [DOI] [PubMed] [Google Scholar]
- Luo J, Solimini NL & Elledge SJ, 2009. Principles of cancer therapy: oncogene and non-oncogene addiction. Cell, 136(5), pp.823–837. [DOI] [PMC free article] [PubMed] [Google Scholar]
- Marusyk A et al. , 2016. Spatial Proximity to Fibroblasts Impacts Molecular Features and Therapeutic Sensitivity of Breast Cancer Cells Influencing Clinical Outcomes. Cancer research, 76(22), pp.6495–6506. [DOI] [PMC free article] [PubMed] [Google Scholar]
- Massiello A, Roesser JR & Chalfant CE, 2006. SAP155 Binds to ceramide-responsive RNA cis-element 1 and regulates the alternative 5’ splice site selection of Bcl-x pre-mRNA. FASEB journal : official publication of the Federation of American Societies for Experimental Biology, 20(10), pp.1680–1682. [DOI] [PubMed] [Google Scholar]
- Mitra A, Mishra L & Li S, 2015. EMT, CTCs and CSCs in tumor relapse and drug-resistance. Oncotarget, 6(13), pp.10697–10711. [DOI] [PMC free article] [PubMed] [Google Scholar]
- Mizushima N, Yoshimori T & Ohsumi Y, 2011. The role of Atg proteins in autophagosome formation. Annual review of cell and developmental biology, 27(1), pp.107–132. [DOI] [PubMed] [Google Scholar]
- Moore MJ et al. , 2010. An alternative splicing network links cell-cycle control to apoptosis. Cell, 142(4), pp.625–636. [DOI] [PMC free article] [PubMed] [Google Scholar]
- Ni Chonghaile T et al. , 2011. Pretreatment mitochondrial priming correlates with clinical response to cytotoxic chemotherapy. Science (New York, N.Y.), 334(6059), pp.1129–1133. [DOI] [PMC free article] [PubMed] [Google Scholar]
- Niepel M et al. , 2017. Measuring Cancer Drug Sensitivity and Resistance in Cultured Cells. Current protocols in chemical biology, 9(2), pp.55–74. [DOI] [PMC free article] [PubMed] [Google Scholar]
- O’Reilly SM et al. , 1992. DNA flow cytometry and response to preoperative chemotherapy for primary breast cancer. European journal of cancer (Oxford, England : 1990), 28(2–3), pp.681–683. [DOI] [PubMed] [Google Scholar]
- Overholtzer M et al. , 2007. A nonapoptotic cell death process, entosis, that occurs by cell-in-cell invasion. Cell, 131(5), pp.966–979. [DOI] [PubMed] [Google Scholar]
- Paek AL et al. , 2016. Cell-to-Cell Variation in p53 Dynamics Leads to Fractional Killing. Cell, 165(3), pp.631–642. [DOI] [PMC free article] [PubMed] [Google Scholar]
- Pécot J et al. , 2016. Tight Sequestration of BH3 Proteins by BCL-xL at Subcellular Membranes Contributes to Apoptotic Resistance. Cell reports, 17(12), pp.3347–3358. [DOI] [PubMed] [Google Scholar]
- Pisco AO et al. , 2013. Non-Darwinian dynamics in therapy-induced cancer drug resistance. Nature communications, 4, p.2467. [DOI] [PMC free article] [PubMed] [Google Scholar]
- Raha D et al. , 2014. The cancer stem cell marker aldehyde dehydrogenase is required to maintain a drug-tolerant tumor cell subpopulation. Cancer research, 74(13), pp.3579–3590. [DOI] [PubMed] [Google Scholar]
- Raj A & van Oudenaarden A, 2008. Nature, nurture, or chance: stochastic gene expression and its consequences. Cell, 135(2), pp.216–226. [DOI] [PMC free article] [PubMed] [Google Scholar]
- Raj A & van Oudenaarden A, 2009. Single-Molecule Approaches to Stochastic Gene Expression. dx.doi.org, 38(1), pp.255–270. [DOI] [PMC free article] [PubMed] [Google Scholar]
- Ramirez M et al. , 2016. Diverse drug-resistance mechanisms can emerge from drug-tolerant cancer persister cells. Nature communications, 7, p.10690. [DOI] [PMC free article] [PubMed] [Google Scholar]
- Regot S et al. , 2014. High-sensitivity measurements of multiple kinase activities in live single cells. Cell, 157(7), pp.1724–1734. [DOI] [PMC free article] [PubMed] [Google Scholar]
- Reya T et al. , 2001. Stem cells, cancer, and cancer stem cells. Nature, 414(6859), pp.105–111. [DOI] [PubMed] [Google Scholar]
- Roberts AW et al. , 2017. Venetoclax in Patients with Previously Treated Chronic Lymphocytic Leukemia. Clinical Cancer Research, 23(16), pp.4527–4533. [DOI] [PubMed] [Google Scholar]
- Roesch A et al. , 2010. A temporarily distinct subpopulation of slow-cycling melanoma cells is required for continuous tumor growth. Cell, 141(4), pp.583–594. [DOI] [PMC free article] [PubMed] [Google Scholar]
- Roesch A et al. , 2013. Overcoming intrinsic multidrug resistance in melanoma by blocking the mitochondrial respiratory chain of slow-cycling JARID1B(high) cells. Cancer cell, 23(6), pp.811–825. [DOI] [PMC free article] [PubMed] [Google Scholar]
- Rogers C et al. , 2017. Cleavage of DFNA5 by caspase-3 during apoptosis mediates progression to secondary necrotic/pyroptotic cell death. Nature communications, 8, p.14128. [DOI] [PMC free article] [PubMed] [Google Scholar]
- Roux J et al. , 2015. Fractional killing arises from cell-to-cell variability in overcoming a caspase activity threshold. Molecular systems biology, 11(5), pp.803–803. [DOI] [PMC free article] [PubMed] [Google Scholar]
- Ryl T et al. , 2017. Cell-Cycle Position of Single MYC-Driven Cancer Cells Dictates Their Susceptibility to a Chemotherapeutic Drug. Cell systems, 5(3), pp.237–250.e8. [DOI] [PubMed] [Google Scholar]
- Sarosiek KA et al. , 2017. Developmental Regulation of Mitochondrial Apoptosis by c-Myc Governs Age- and Tissue-Specific Sensitivity to Cancer Therapeutics. Cancer cell, 31(1), pp.142–156. [DOI] [PMC free article] [PubMed] [Google Scholar]
- Sarosiek KA, Ni Chonghaile T & Letai A, 2013. Mitochondria: gatekeepers of response to chemotherapy. Trends in cell biology, 23(12), pp.612–619. [DOI] [PMC free article] [PubMed] [Google Scholar]
- Schwerk C & Schulze-Osthoff K, 2005. Regulation of apoptosis by alternative pre-mRNA splicing. Molecular cell, 19(1), pp.1–13. [DOI] [PubMed] [Google Scholar]
- Settembre C et al. , 2012. A lysosome-to-nucleus signalling mechanism senses and regulates the lysosome via mTOR and TFEB. The EMBO journal, 31(5), pp.1095–1108. [DOI] [PMC free article] [PubMed] [Google Scholar]
- Shaffer SM et al. , 2017. Rare cell variability and drug-induced reprogramming as a mode of cancer drug resistance. Nature, 546(7658), pp.431–435. [DOI] [PMC free article] [PubMed] [Google Scholar]
- Shalek AK et al. , 2014. Single-cell RNA-seq reveals dynamic paracrine control of cellular variation. Nature, 510(7505), pp.363–369. [DOI] [PMC free article] [PubMed] [Google Scholar]
- Sharma SV et al. , 2010. A chromatin-mediated reversible drug-tolerant state in cancer cell subpopulations. Cell, 141(1), pp.69–80. [DOI] [PMC free article] [PubMed] [Google Scholar]
- Sharma SV et al. , 2006. A common signaling cascade may underlie “addiction” to the Src, BCR-ABL, and EGF receptor oncogenes. Cancer cell, 10(5), pp.425–435. [DOI] [PMC free article] [PubMed] [Google Scholar]
- Silva MT, 2010. Secondary necrosis: the natural outcome of the complete apoptotic program. FEBS letters, 584(22), pp.4491–4499. [DOI] [PubMed] [Google Scholar]
- Skeel RT & Khleif SN, 2011. Handbook of Cancer Chemotherapy,
- Skipper HE, 1971. Kinetics of mammary tumor cell growth and implications for therapy. Cancer, 28(6), pp.1479–1499. [DOI] [PubMed] [Google Scholar]
- Spencer SL et al. , 2009. Non-genetic origins of cell-to-cell variability in TRAIL-induced apoptosis. Nature, 459(7245), pp.428–432. [DOI] [PMC free article] [PubMed] [Google Scholar]
- Stephens PJ et al. , 2011. Massive genomic rearrangement acquired in a single catastrophic event during cancer development. Cell, 144(1), pp.27–40. [DOI] [PMC free article] [PubMed] [Google Scholar]
- Stevens JB et al. , 2013. Heterogeneity of cell death. Cytogenetic and genome research, 139(3), pp.164–173. [DOI] [PubMed] [Google Scholar]
- Suderman R et al. , 2017. Fundamental trade-offs between information flow in single cells and cellular populations. Proceedings of the National Academy of Sciences of the United States of America, 114(22), pp.5755–5760. [DOI] [PMC free article] [PubMed] [Google Scholar]
- Sun Q et al. , 2014. Competition between human cells by entosis. Cell research, 24(11), pp.1299–1310. [DOI] [PMC free article] [PubMed] [Google Scholar]
- Symmons O & Raj A, 2016. What’s Luck Got to Do with It: Single Cells, Multiple Fates, and Biological Nondeterminism. Molecular cell, 62(5), pp.788–802. [DOI] [PMC free article] [PubMed] [Google Scholar]
- Tait SWG et al. , 2010. Resistance to caspase-independent cell death requires persistence of intact mitochondria. Developmental cell, 18(5), pp.802–813. [DOI] [PMC free article] [PubMed] [Google Scholar]
- Tang HL et al. , 2012. Cell survival, DNA damage, and oncogenic transformation after a transient and reversible apoptotic response. Molecular biology of the cell, 23(12), pp.2240–2252. [DOI] [PMC free article] [PubMed] [Google Scholar]
- Tang HL et al. , 2015. In vivo CaspaseTracker biosensor system for detecting anastasis and non-apoptotic caspase activity. Scientific reports, 5(1), p.9015. [DOI] [PMC free article] [PubMed] [Google Scholar]
- Thorburn J et al. , 2014. Autophagy controls the kinetics and extent of mitochondrial apoptosis by regulating PUMA levels. Cell reports, 7(1), pp.45–52. [DOI] [PMC free article] [PubMed] [Google Scholar]
- Tyson DR et al. , 2012. Fractional proliferation: a method to deconvolve cell population dynamics from single-cell data. Nature methods, 9(9), pp.923–928. [DOI] [PMC free article] [PubMed] [Google Scholar]
- Viale A et al. , 2014. Oncogene ablation-resistant pancreatic cancer cells depend on mitochondrial function. Nature, 514(7524), pp.628–632. [DOI] [PMC free article] [PubMed] [Google Scholar]
- Vinogradova M et al. , 2016. An inhibitor of KDM5 demethylases reduces survival of drug-tolerant cancer cells. Nature chemical biology, 12(7), pp.531–538. [DOI] [PubMed] [Google Scholar]
- Viswanathan VS et al. , 2017. Dependency of a therapy-resistant state of cancer cells on a lipid peroxidase pathway. Nature, 547(7664), pp.453–457. [DOI] [PMC free article] [PubMed] [Google Scholar]
- Vo T-T et al. , 2012. Relative mitochondrial priming of myeloblasts and normal HSCs determines chemotherapeutic success in AML. Cell, 151(2), pp.344–355. [DOI] [PMC free article] [PubMed] [Google Scholar]
- Wagner A, Regev A & Yosef N, 2016. Revealing the vectors of cellular identity with single-cell genomics. Nature biotechnology, 34(11), pp.1145–1160. [DOI] [PMC free article] [PubMed] [Google Scholar]
- Waks Z, Klein AM & Silver PA, 2011. Cell-to-cell variability of alternative RNA splicing. Molecular systems biology, 7(1), pp.506–506. [DOI] [PMC free article] [PubMed] [Google Scholar]
- Wang Y et al. , 2017. Chemotherapy drugs induce pyroptosis through caspase-3 cleavage of a Gasdermin. Nature, 547(7661), pp.99–103. [DOI] [PubMed] [Google Scholar]
- Weinstein IB, 2002. Cancer. Addiction to oncogenes--the Achilles heal of cancer. Science (New York, N.Y.), 297(5578), pp.63–64. [DOI] [PubMed] [Google Scholar]
- Wolpaw AJ et al. , 2011. Modulatory profiling identifies mechanisms of small molecule-induced cell death. Proceedings of the National Academy of Sciences of the United States of America, 108(39), pp.E771–80. [DOI] [PMC free article] [PubMed] [Google Scholar]
- Xia X et al. , 2014. Cell-to-cell variability in cell death: can systems biology help us make sense of it all? Cell death & disease, 5(5), p.e1261. [DOI] [PMC free article] [PubMed] [Google Scholar]
- Ying H et al. , 2012. Oncogenic Kras maintains pancreatic tumors through regulation of anabolic glucose metabolism. Cell, 149(3), pp.656–670. [DOI] [PMC free article] [PubMed] [Google Scholar]
- Yu L et al. , 2006. Autophagic programmed cell death by selective catalase degradation. Proceedings of the National Academy of Sciences of the United States of America, 103(13), pp.4952–4957. [DOI] [PMC free article] [PubMed] [Google Scholar]
- Zhang W & Huang P, 2011. Cancer-stromal interactions: role in cell survival, metabolism and drug sensitivity. Cancer biology & therapy, 11(2), pp.150–156. [DOI] [PMC free article] [PubMed] [Google Scholar]
- Zhang Y, Yew WW & Barer MR, 2012. Targeting persisters for tuberculosis control. Antimicrobial agents and chemotherapy, 56(5), pp.2223–2230. [DOI] [PMC free article] [PubMed] [Google Scholar]
- Zheng X et al. , 2015. Epithelial-to-mesenchymal transition is dispensable for metastasis but induces chemoresistance in pancreatic cancer. Nature, 527(7579), pp.525–530. [DOI] [PMC free article] [PubMed] [Google Scholar]