

Abstract
Aims
Previous trials on the effectiveness of genotype‐guided warfarin dosing vs. conventional dosing have been inconclusive. We conducted a systematic review and meta‐analysis of randomized trials comparing genotype‐guided to conventional dosing strategies.
Methods
PubMed and the Cochrane Library were searched up to 23 October 2017.
Results
A total of 76 and 94 entries were retrieved were retrieved from PubMed and the Cochrane Library, respectively. A total of 2626 subjects in the genotype‐guided dosing (mean age 63.3 ± 5.8 years; 46% male) and 2604 subjects in the conventional dosing (mean age 64.7 ± 6.1 years; 46% male) groups (mean follow‐up duration 64 days) from 18 trials were included. Compared with conventional dosing, genotype‐guided dosing significantly shortened the time to first therapeutic international normalized ratio (INR) (mean difference 2.6 days, standard error 0.3 days; P < 0.0001; I 2 0%) and time to first stable INR (mean difference 5.9 days, standard error 2.0 days; P < 0.01; I 2 94%). Genotype‐guided dosing also increased the time in therapeutic range (mean difference 3.1%, standard error 1.2%; P < 0.01; I 2 80%) and reduced the risks of both excessive anticoagulation, defined as INR ≥4 [risk ratio (RR) 0.87; 95% confidence interval (CI) 0.78, 0.98; P < 0.05; I 2: 0%), and bleeding (RR 0.82; 95% CI 0.69, 0.98; P < 0.05; I 2 31%). No difference in thromboembolism (RR 0.84; 95% CI 0.56, 1.26; P = 0.40; I 2 0%) or mortality (RR 1.16; 95% CI 0.46, 2.91; P = 0.76; I 2 0%) was observed between the two groups.
Conclusions
Genotype‐guided warfarin dosing offers better safety with less bleeding compared with conventional dosing strategies. No significant benefit on thromboembolism or mortality was evident.
Keywords: CYP2C9, CYP4F2, dosing, genotype, VKORC1, warfarin
Introduction
Warfarin is one of the most commonly prescribed drugs, accounting for more than 35 million prescriptions in the United States alone 1. However, it is also responsible for more iatrogenic accident and emergency department visits in older patients compared with other medications 2, 3. This may be related to over‐ or underdosing because of wide interindividual variability in dosing requirements. To optimize anticoagulation control, the use of genetic‐based algorithms, collectively termed ‘genotype‐guided dosing’, has been devised. However, previously published randomized controlled trials (RCTs) comparing the effects of genotype‐guided dosing against conventional dosing (either fixed dosing or clinically guided dosing) strategies 4, 5, 6, 7, 8, 9, 10, 11, 12, 13, 14, and even their subsequent meta‐analyses, have yielded conflicting results 15, 16, 17, 18, 19, 20, 21. A meta‐analysis published in 2015, which pooled the evidence from 11 RCTs with trial sequential analysis 21, reported a shorter time to reach the first therapeutic or stable international normalized ratio (INR), and improvements in markers of anticoagulation control such as the time in therapeutic range (TTR) and the number of patients with an out‐of‐range INR, although this did not translate into better clinical outcomes of reducing bleeding, thromboembolism or mortality.
Since the publication of that study, six additional trials have been published on this issue 22, 23, 24, 25, 26, 27, with the most recent three showing conflicting results. For example, an RCT conducted in 2015 on nonvalvular atrial fibrillation patients reported no significant difference in TTR or in the number of patients with an out‐of‐range INR 22. Similarly, in a group of Han Chinese individuals, there was no difference in TTR, excessive anticoagulation or adverse events between the genotype‐guided and optimal clinical care arms 27. By contrast, the recently published Genetic Informatics Trial of Warfarin to Prevent Deep Vein Thrombosis (GIFT) in patients receiving warfarin at the time of elective hip or knee arthroplasty reported significant benefits with genotype‐guided dosing when compared with clinically‐guided dosing 25. In GIFT, genotype‐guided warfarin dosing increased the TTR, and reduced the combined risk of major bleeding, an INR of ≥4, venous thromboembolism or death. Given these new findings, we conducted a systematic review and meta‐analysis of all RCTs to evaluate the benefits and complication rates in genotype‐guided dosing vs. conventional dosing strategies.
Methods
Search strategy, and inclusion and exclusion criteria
The systematic review and meta‐analysis was performed according to the Preferred Reporting Items for Systematic Reviews and Meta‐Analyses (PRISMA) statement 28. PubMed and the Cochrane Library were searched for RCTs that compared the efficacy in genotype‐guided warfarin dosing compared with conventional dosing strategies. The following search terms were used for PubMed: [genotype AND warfarin AND randomized trial]. For the Cochrane Library, the following terms were used: [genotype AND warfarin]. The search period was from 1966 to 23 October 2017 for Pubmed, and 1996 to 23 October 2017 for the Cochrane Library, with no language restrictions. The following inclusion criteria were applied: (i) RCTs in humans; and (ii) studies comparing the outcomes for genotype‐guided vs. conventional warfarin dosing strategies. Reference lists of included studies, and of previous meta‐analyses identified, were searched. No additional studies were found. Given the recently published PRISMA‐compliant systematic review and meta‐analysis studies, a more robust search strategy was used than had been used in previous meta‐analyses. The 2015 Tang meta‐analysis 21 was performed using the [(genotype OR polymorphism OR gene OR allele OR variant OR mutation OR single‐nucleotide polymorphism) AND (algorithms OR regimen OR model OR strategy)] AND (warfarin OR coumarin OR anticoagula*) search terms. We used the same search terms in PubMed between 1 February 2017 and 31 March 2018, yielding an additional 128 studies. This failed to identify any further relevant studies (Figure S1). Quality assessment of RCTs was performed using the Cochrane Risk Assessment Tool (Figures S2 and S3).
Data extraction
Data from the different studies were entered in Microsoft Excel. All publications extracted from the search strategy were assessed for compliance with the inclusion criteria. In the present meta‐analysis, the extracted data elements consisted of: (i) the surname of the first author and year of publication; (ii) the target INR; (iii) the duration of follow‐up; (iv) the characteristics of the genotype‐guided and control groups, including sample size, gender and age; (v) the genes tested and dosing algorithm for the genotype‐guided group; and (vi) the dosing algorithm and whether fixed‐dose or clinical information‐guided strategy was used for the control group. The search of the two databases was conducted by G.T. The search results were then retrieved and screened independently by G.T. and M.G. Any disagreements were to be brought to the attention of a third reviewer (T.L.). However, this was not required as both reviewers arrived at the same list of RCTs for inclusion in the meta‐analysis.
Endpoints and statistical analysis
The a priori predefined endpoints for the meta‐analysis were: (i) time to first therapeutic INR; (ii) time to first stable INR; (iii) TTR; (iv) number of patients with excessive anticoagulation, defined as INR ≥4; (v) number of patients with bleeding; (vi) number of patients with thromboembolism; and (vii) number of mortalities. For time to first therapeutic INR, time to first stable INR and TTR, the mean difference between the genotype‐guided dosing and conventional dosing strategies was extracted or calculated. For INR ≥4, bleeding, thromboembolism and mortality, risk ratios (RRs) were calculated. When the data concerning a particular endpoint were not available, they were obtained from previously published meta‐analyses.
Heterogeneity across studies was assessed using the I 2 statistic from the standard chi‐square test, which describes the percentage variability in the effect estimates resulting from heterogeneity. I 2 >50% was considered to reflect significant statistical heterogeneity, and in such cases the random‐effects model using the inverse variance approach was used. Otherwise, the fixed‐effects model was used. To explore the potential sources of the heterogeneity, subgroup analysis based on the type of warfarin dosing for the control group (fixed dose and clinical information guided) was performed. Funnel plots showing standard errors against the mean difference or against the logarithms of the RRs were constructed. Egger's test was used to detect publication bias.
Results
A quorum diagram detailing the above search terms with inclusion and exclusion criteria is depicted in Figure 1. A total of 76 and 94 studies were retrieved from PubMed and the Cochrane Library, respectively. However, 152 studies did not meet the inclusion criteria. Therefore, a total of 18 trials were included in the present meta‐analysis 4, 5, 6, 7, 8, 9, 10, 11, 12, 13, 14, 22, 23, 24, 25, 26, 27, 29. The baseline characteristics of these studies are listed in Table 1. The meta‐analysis included 2626 patients in the genotype‐guided dosing arm (mean age 63.3 ± 5.8 years; 46% male) and 2604 patients in the conventional dosing arm (mean age 64.7 ± 6.1 years; 46% male). The mean follow‐up duration was 64 days. For the control group, two conventional dosing strategies were used. The first was fixed dosing, where the patients received a fixed dose for a fixed number of days. This varied from 2.5 mg to 6 mg for 3–7 days, 10 mg on day 1, 5 mg on day 2 and 5 mg on day 3 regimens were also used. The lower doses were used in Chinese populations, where warfarin requirements are lower. The second dosing strategy used was clinical information‐guided dosing, for which the different definitions are illustrated in Table 1. This involved the use of regression models based on different clinical parameters such as age, gender, body surface area and valve status. For the genotype‐guided group, 12 different algorithms were described in the 18 trials, incorporating the cytochrome P450 (CYP) 2C9, vitamin K epoxide reductase complex subunit 1 (VKORC1) and CYP4F2 polymorphisms to determine the warfarin dose (Table S1).
Figure 1.
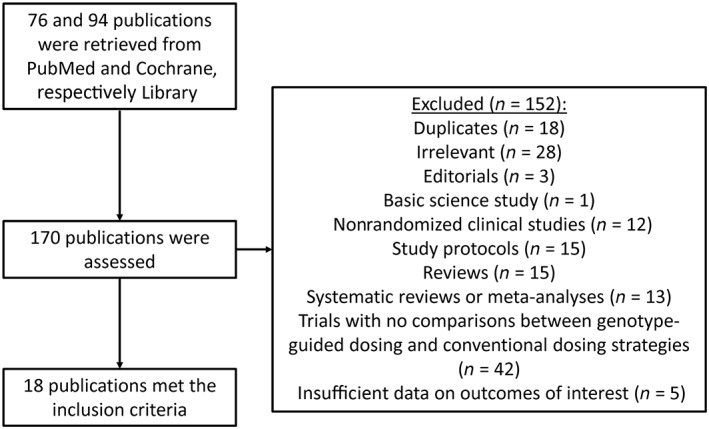
Flowchart of the database search and study selection process
Table 1.
Characteristics of the trials included in the meta‐analysis
| First author surname and year of publication | Target INR | Follow‐up (days) | Ethnicity | Indication for warfarin | Genotype‐guided group genes tested | Genotype‐guided group dosing algorithm | Genotype‐guided group total no. | Genotype‐guided group no. of males | Genotype‐guided group age, SD (years) | Control group dosing algorithm | Control group total no. | Control group no. of males | Control group age, SD (years) | Ref |
|---|---|---|---|---|---|---|---|---|---|---|---|---|---|---|
| Hillman 2005 | 1.9–3.2 | 28 ± 0 | Caucasian (100%) | AF, DVT/PE, elective valvuloplasty or arthroplasty | CYP2C9 | Hillman equation | 18 | 8 | 68.8 ± 11.3 | Fixed (5 mg for 7 days) | 20 | 9 | 70.5 ± 13.3 | 4 |
| Anderson 2007 | 2.0–3.0 | 46 ± 32 | Caucasian (95%) | AF, DVT/PE, orthopaedic surgery, others | CYP2C9, VKORC1 | Carlquist equation | 101 | 50 | 63.2 ± 15.3 | Fixed (10 mg, 10 mg, 5 mg) | 99 | 56 | 58.9 ± 16.0 | 5 |
| Caraco 2008 | 2.0–3.0 | 31 ± 22 | Not reported (Israeli patients) | AF, DVT/PE | CYP2C9 | Algorithm designed by the authors | 95 | 46 | 57.6 ± 19.6 | Fixed (5 mg for an average of 6.5 days) | 96 | 42 | 59.7 ± 18.5 | 6 |
| Huang 2009 | 1.8–3.0 | 50 ± 0 | Han Chinese (100%) | AF, DVT, valve replacement | CYP2C9, VKORC1 | Sheng‐Wen Huang equation | 61 | 20 | 41.6 ± 9.6 | Fixed (2.5 mg; did not describe how many days) | 60 | 18 | 43.0 ± 10.8 | 7 |
| Borgman 2012 | 1.8–3.2 | 90 ± 0 | Caucasian (100% in genotype group; 85% in conventional dosing) | AF, DVT, stroke, others | CYP2C9, VKORC1 | 5 mg + PerMIT software | 13 | 7 | 59.0 ± 12.3 | Fixed (5 mg for 7 days, but clinicians allowed to deviate) | 13 | 7 | 45.0 ± 17.3 | 9 |
| Wang 2012 | 1.8–3.0 | 50 ± 0 | Han Chinese (100%) | Valve replacement for rheumatic heart disease | CYP2C9, VKORC1 | Sheng‐Wen Huang equation | 53 | 15 | 41.9 ± 6.3 | Fixed (2.5 mg for 3 days) | 53 | 16 | 42.8 ± 8.5 | 10 |
| Pirmohamed 2013 | 2.0–3.0 | 90 ± 0 | Caucasian (98.5%), African (1.1%), Asian (0.4%) | AF, DVT/PE | CYP2C9, VKORC1 | Modified IWPC algorithm | 227 | 145 | 67.8 ± 14.5 | Fixed (10/5 mg, 5 mg, 5 mg) | 228 | 132 | 66.9 ± 12.9 | 14 |
| Pengo 2015 | 2.0–3.0 | 30 ± 0 | Italian Caucasian (100%) | AF | CYP2C9, VKORC1, CYP4F2 | Hamberg equation | 88 | 58 | 71.0 ± 11.3 | Fixed (5 mg for 4 days) | 92 | 60 | 75.0 ± 10.0 | 22 |
| Supe 2015 | 2.0–3.0 | 21 ± 0 | Croatian Caucasian (100%) | Acute stroke | CYP2C9, VKORC1 | IWPC algorithm | 106 | 46 | 67.6 ± 13.5 | Fixed (6 mg for days 2 to 5) | 104 | 42 | 69.1 ± 12.2 | 23 |
| Wen 2017 | 2.0–3.0 | 90 ± 0 | Han Chinese (100%) | AF, DVT, PE, stroke, others | CYP2C9, VKORC1 | Wen et al. algorithm | 107 | 59 | 67.0 ± 15.5 | Fixed (5 mg for 3 days) | 104 | 63 | 66.0 ± 14.0 | 27 |
| Jin 2017 | 2.0–3.0 | 84 ± 0 | Han Chinese (100%) | PE | CYP2C9, VKORC1 | IWPC algorithm | 115 | 57 | 69.0 ± 12.0 | Fixed (3 mg) | 123 | 63 | 68.0 ± 12.0 | 26 |
| Burmester 2011 | 2.0–3.5 | 60 ± 0 | Caucasian, including Hispanics (100%) | AF, DVT/PE, valve surgery | CYP2C9, VKORC1, CYP4F2 | Burmester equation | 115 | 66 | 67.4 ± 12.3 | CI (Burmester equation, regression model based on age, gender, BSA, heart valve status) | 115 | 70 | 69.2 ± 12.7 | 8 |
| Radhakrishnan 2012 | N/A | 90 ± 0 | Not mentioned (US study based in Pittsburgh, PA) | Any indication (not elaborated further) | CYP2C9, VKORC1 | N/A | 28 | – | – | CI (N/A) | 28 | – | – | 29 |
| Li 2013 | 2.0–3.0 | 50 ± 0 | Han Chinese (100%) | PE | CYP2C9, VKORC1 | Li et al. algorithm | 97 | 38 | 61.6 ± 13.6 | CI (empirically by clinician for first 3 doses) | 95 | 38 | 60.1 ± 14.2 | 13 |
| Jonas 2013 | 2.0–3.5 | 90 ± 0 | Caucasian (72.5%), African‐American (27.5%) | AF, DVT, PE, heart valve, others | CYP2C9, VKORC1 | Gage equation | 55 | 24 | 59.0 ± 19.3 | CI (Gage equation) | 54 | 27 | 55.3 ± 19.1 | 11 |
| Kimmel 2013 | 2.0–3.0 | 30 ± 0 | Caucasian (66.5%), African (27.1%), Hispanic (6.4%) | AF, DVT/PE, multiple indications, other indications, no indication given | CYP2C9, VKORC1 | Gage equation | 514 | 272 | 59.0 ± 16.3 | CI (Gage equation, based on age, BSA, African American race, amiodarone use, target INR, smoking status, and warfarin indication) | 501 | 246 | 57.0 ± 16.3 | 12 |
| Duan 2016 | N/A | 28 ± 0 | Han Chinese (100%) | PE with or without DVT | CYP2C9, VKORC1 | N/A | 25 | 10 | 54.5 ± 14.9 | CI (traditional model) | 30 | 13 | 54.5 ± 14.9 | 24 |
| Gage 2017 | 1.5–2.1 (50%), 2.0–3.0 (50%) | 90 ± 0 | Caucasian (91.0%), African (6.4%), Asian or Indian subcontinent (1.8%), American Indian or Alaskan Native (0.1%), others | Arthroplasty | CYP2C9, VKORC1, CYP4F2 | IWPC algorithm | 808 | 286 | 72.2 ± 5.3 | CI (Gage equation, based on age, BSA, African American race, amiodarone use, target INR, smoking status, and warfarin indication) | 789 | 293 | 72.0 ± 5.5 | 25 |
AF, atrial fibrillation; BSA, body surface area; CI, clinical information; CYP, gene encoding cytochrome P450; DVT, deep vein thrombosis; INR, international normalized ratio; IWPC, International Warfarin Pharmacogenetics Consortium; N/A, not available; PE, pulmonary embolism; SD, standard deviation; VKORC1, gene encoding vitamin K epoxide reductase complex subunit 1
Quality assessment of RCTs was performed using the Cochrane Risk Assessment Tool (Figures S2 and S3). Overall, risk of bias assessment could be conducted for 16 of the 18 trials conducted, whereas the remaining two studies were conference abstracts 24, 29, which could not be judged on their quality owing to the lack of information reported. One study 6 was deemed to be of low quality, whereas the remaining 15 studies generally showed high‐quality study designs for reducing the risk of bias. Specifically, for random sequence generation, nine of the 18 trials included a low risk of bias. Similarly, for allocation concealment, only eight trials had an appropriate design to reduce selection bias. Nevertheless, to reduce performance bias, 12 trials had described proper blinding of participants and research personnel. For blinding of outcome assessment, most studies did not clearly illustrate an appropriate method, except for two trials, which had a low risk of attrition bias. On selective reporting, 15 of the 18 trials had appropriately described their data on their different endpoints, which therefore had a low risk of reporting bias. Funnel plots showing standard errors against the mean difference or against the logarithms of the RRs are shown in Figures S4 and S10.
Time‐to‐first therapeutics INR and stable INR
Seven studies provided information on the time taken to reach the first therapeutic INR 6, 9, 23, 25, 26, 27, 29, but only three of these provided sufficient information for the calculation of mean difference values 6, 9, 26 (Figure 2A, top). It was defined by Borgman et al. 9 as ‘the time interval in days from the first warfarin dosage to the first time interval where the INR remains within the predefined acceptable range (INR 1.8 to 3.2) for a minimum of 4 consecutive days’. By contrast, Caraco et al. 6 defined stable anticoagulation as ‘two consecutive INR values, 7 days apart, were within the therapeutic range, without any intervening dose alteration’. Jin et al. 26 defined it as ‘INR values maintained in the range of 2–3 for at least three times (≥7 days) continuously’. Our meta‐analysis showed a significantly shorter time to reach the first therapeutic INR in the genotype‐guided dosing group when compared with controls, all of which used fixed dosing (mean difference 2.6 days, standard error 0.3 days; P < 0.0001; I 2 0%; Figure 2A, top). Egger's test demonstrated no significant asymmetry (intercept 0.9, t‐value 1.9; P > 0.05; Figure S4). Subgroup analysis based on ethnicity showed that the mean differences remained statistically significant for each ethnicity (Figure 2A, bottom).
Figure 2.
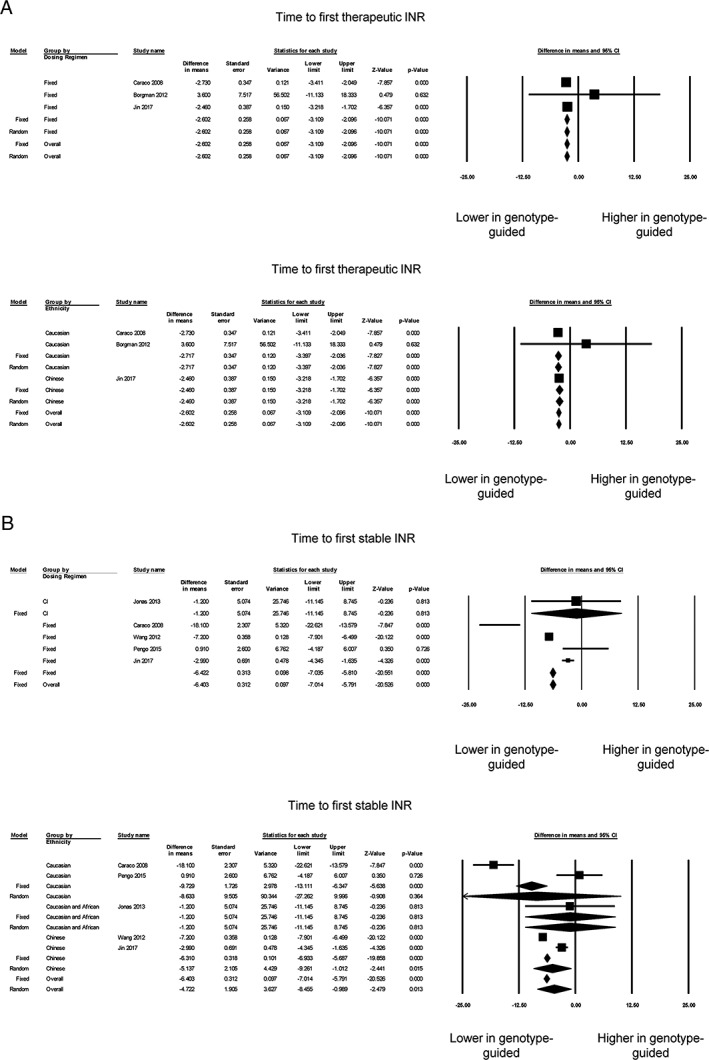
Panel A shows the mean difference in time to first therapeutic international normalized ratio (INR) based on control group dosing regimen (top) or ethnicity (bottom). Panel B shows the mean difference in time to first stable INR based on control group dosing regimen (top) or ethnicity (bottom). CI, confidence interval
For the time taken to reach a stable INR, four studies provided the median 8, 10, 14, 23 and six studies the mean 6, 10, 11, 22, 26, 27. Of the latter six studies, one was excluded because the standard deviation or another measure of dispersion was not available 27 (Figure 2B, top). Our meta‐analysis of the remaining five studies showed a shorter time to reach a stable INR with the genotype‐guided dosing group (mean difference 5.9 days, standard error 2.0 days; P < 0.01; I 2 94%). Egger's test demonstrated no significant asymmetry (intercept 0.6, t‐value 0.2; P > 0.05; Figure S5). Of the five studies, four used a fixed‐dosing regimen for the control group, and the mean difference remained statistically significant on subgroup analysis (Figure 2B, top). Subgroup analysis for ethnicity showed that the mean difference remained significant for Caucasian and Chinese subjects, but not in the study with both Caucasian and African subjects (Figure 2B, bottom).
Percentage TTR and excessive anticoagulation
Fourteen of the 18 trials reported TTR values 4, 5, 6, 7, 8, 9, 11, 12, 14, 22, 23, 24, 25, 27 but one study 24 was excluded as it did not report the standard error, standard deviation or confidence interval. Of the 13 studies, five reported significantly higher TTRs in genotype‐guided therapy compared with conventional dosing strategies, whereas the remaining studies reported no difference between the two groups (Figure 3A, top). Nevertheless, our meta‐analysis showed that genotype‐guided warfarin dosing significantly increased TTR compared with conventional dosing strategies (mean difference 3.1%, standard error 1.2%; P < 0.05; I 2 80%). Egger's test demonstrated no significant asymmetry (intercept 0.2, t‐value 0.2; P > 0.05; Figure S6). Subgroup analysis showed that genotype‐guided dosing produced a greater TTR than fixed‐dose regimens (mean difference 7.4%, standard error 2.0%; P < 0.0001; I 2 71%) (Figure 3A, top). By contrast, no significant difference in TTRs was observed between genotype‐guided dosing and clinical information‐guided regimens (mean difference 0.5%, standard error 1.5%; P = 0.73; I 2 55%). Subgroup analysis based on ethnicity showed that TTRs remained significantly different between both groups for Caucasian, Caucasian and African, and Chinese individuals, with I 2 taking values of 84%, 54%, 0%, respectively (Figure 3A, bottom).
Figure 3.
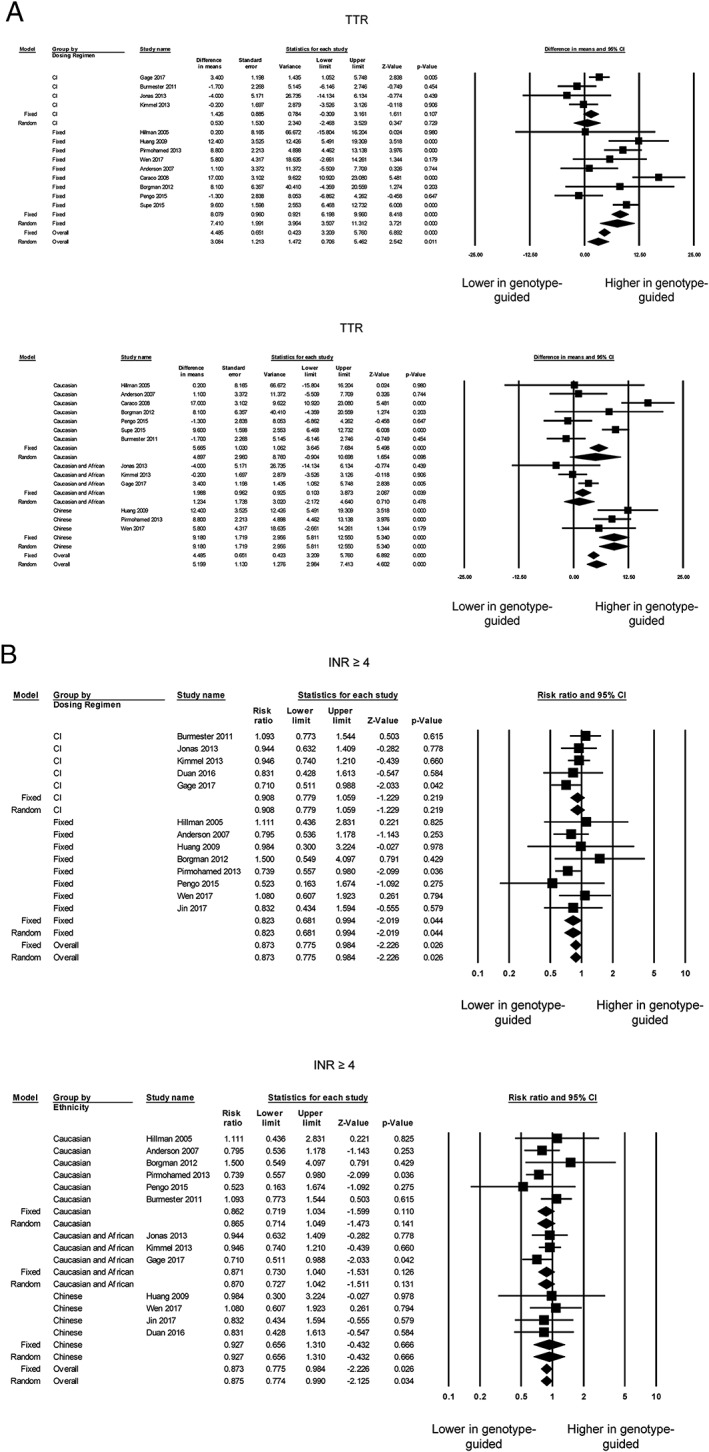
Panel A shows the mean difference in time in therapeutic range (TTR0 based on control group dosing regimen (top) or ethnicity (bottom). Panel B shows the risk ratios comparing the number of individuals with excessive anticoagulation, defined as an international normalized ratio (INR) ≥4, between genotype‐guided warfarin dosing and conventional dosing groups based on the control group dosing regimen (top) or ethnicity (bottom). CI, confidence interval
Moreover, 13 of the 18 trials 4, 5, 6, 7, 8, 9, 11, 12, 14, 22, 24, 25, 27 reported the number of individuals with excessive anticoagulation, defined as INR ≥4, and the total number of individuals in each group. Of these, two reported a reduction in the RR for excessive anticoagulation in genotype‐guided therapy compared with conventional dosing strategies, whereas 11 studies reporting no significant difference (Figure 3B, top). Our overall meta‐analysis demonstrated that genotype‐guided warfarin dosing was associated with a lower risk of excessive anticoagulation [RR 0.87; 95% confidence interval (CI) 0.78, 0.98; P < 0.05; I 2 0%]. Egger's test demonstrated no significant asymmetry (intercept 0.3, t‐value 0.6; P > 0.05; Figure S7). Subgroup analysis remained statistically significant when compared with the fixed‐dose (RR 0.82; 95% CI 0.68, 0.99; P < 0.05; I 2 0%) but not with the clinical information‐guided (RR 0.91; 95% CI 0.78, 1.06; P = 0.22; I 2 0%) regimen (Figure 3B, top). Subgroup analyses based on ethnicity resulted in RRs that were no longer statistically significant for Caucasian, Caucasian with African, and Chinese individuals (Figure 3B, bottom).
Bleeding, thromboembolism and mortality
Fourteen of the 18 trials reported bleeding events 4, 6, 7, 8, 11, 12, 14, 22, 23, 24, 25, 26, 27, 29, but one 22 was excluded from the analysis owing to zero events in both groups. Two trials reported a significant reduction in bleeding using genotype‐guided dosing, whereas the other trials did not report significant differences (Figure 4A, top). Our overall meta‐analysis showed that genotype‐guided dosing was associated with a lower risk of bleeding (RR 0.82; 95% CI 0.69, 0.98; P < 0.05; I 2 31%). Egger's test demonstrated significant asymmetry (intercept −1.4, t‐value 4.1; P < 0.05; Figure S8). Subgroup analyses based on the control group dosing regimen led to loss of statistical significance for the RRs (fixed‐dose regimen 0.86; 95% CI 0.70, 1.06; P = 0.16; I 2 22%; clinical information‐guided regimen: 0.76; 95% CI 0.57, 1.01; P = 0.06; I 2 45%) (Figure 4A, bottom). Subgroup analyses based on ethnicity showed that the risk of bleeding remained significantly lower for Chinese individuals (RR 0.46; 95% CI 0.23, 0.92; P < 0.05; I 2 0%), but not for Caucasian individuals alone or with African individuals (Figure 4A, bottom).
Figure 4.
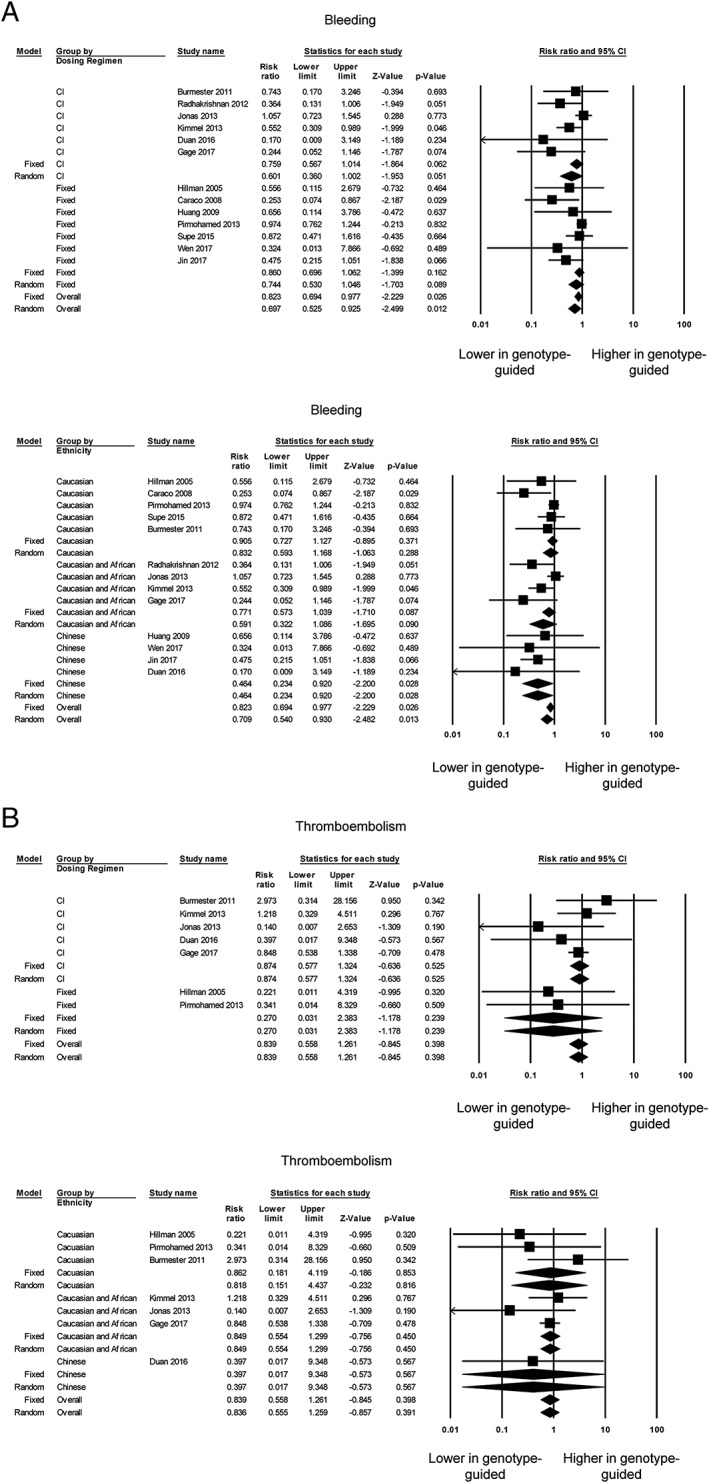
Panel A shows the risk ratios for comparing the number of individuals with bleeding symptoms between the genotype‐guided warfarin dosing and conventional dosing groups based on the control group dosing regimen (top) or ethnicity (bottom). Panel B shows the risk ratios for comparing the number of individuals with thromboembolism, based on the control group dosing regimen (top) or ethnicity (bottom). CI, confidence interval
Thromboembolism was assessed by 10 trials 4, 6, 8, 11, 12, 14, 22, 24, 25, 27, but three trials 6, 22, 27 were excluded because zero events were reported for both genotype‐guided dosing and conventional dosing groups. None of the remaining studies reported a significant difference in thromboembolism events (Figure 4B, top), which was confirmed by our meta‐analysis (RR 0.84; 95% CI 0.56, 1.26; P = 0.40; I 2 0%). Egger's test demonstrated no significant asymmetry (intercept −0.4, t‐value 0.9; P > 0.05; Figure S9). Subgroup analyses comparing against the fixed‐dose (RR 0.27; 95% CI 0.03, 2.38; P = 0.24; I 2 0%) or clinical information‐guided (RR 0.87; 95% CI 0.58, 1.32; P = 0.53; I 2 0%) regimen did not significantly alter the findings (Figure 4B, top). Subgroup analyses based on ethnicity also did not alter our results (Figure 4B, bottom). It was possible to calculate the number of patients needed to be genotyped in order to reduce the number of adverse events by one, based on the absolute risk difference. This was estimated to be only 40 patients for major bleeding but 238 for thromboembolism.
Mortality was reported in seven trials 8, 11, 12, 14, 23, 24, 25, but one 25 was excluded from further analysis because of zero events in both groups. Of the remaining studies, none reported a significant difference in mortality between genotype‐guided dosing and conventional dosing groups (Figure 5, top), which was confirmed by our meta‐analysis (RR 1.16; 95% CI 0.46, 2.90; P = 0.76; I 2 0%). Egger's test demonstrated no significant asymmetry (intercept −1.1, t‐value 0.8; P > 0.05; Figure S10). Subgroup analyses comparing against the fixed‐dose (RR 2.63; 95% CI 0.62, 11.23; P = 0.19; I 2 0%) or clinical information‐guided (RR 0.66; 95% CI 0.20, 2.19; P = 0.50; I 2 0%) regimen did not significantly alter the findings. Similarly, subgroup analyses based on ethnicity did not alter the findings (Figure 5, bottom).
Figure 5.
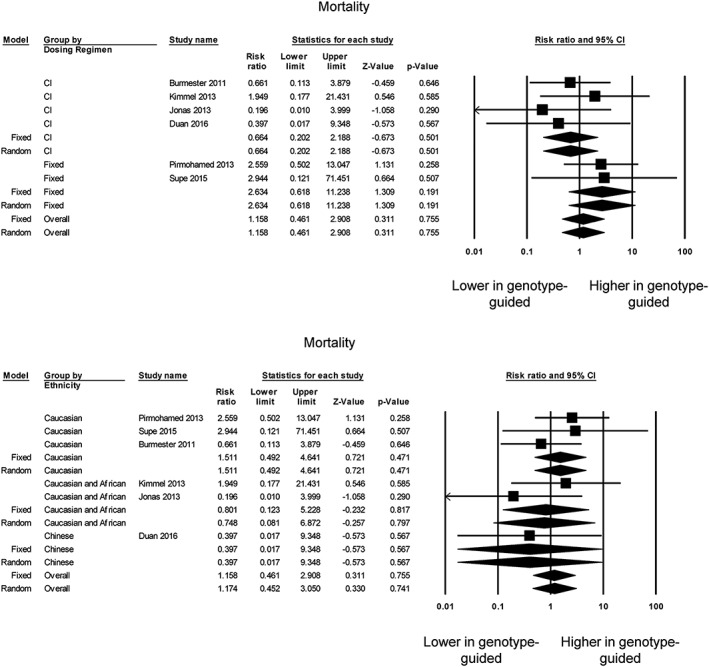
Risk ratios for comparing the mortality between the genotype‐guided warfarin dosing and conventional dosing groups based on control group dosing regimen (top) or ethnicity (bottom). CI, confidence interval
Meta‐regression analysis was conducted to explore the potential influences of continuous moderator variables. Thus, meta‐regression of the TTR mean difference on the logarithm of RRs for INR ≥4 (Figure S11), bleeding (Figure S12), thromboembolism (Figure S13) or mortality (Figure S14) did not reveal slopes or intercepts that were significantly different from zero (P > 0.05).
Discussion
The main findings of the present meta‐analysis were that, compared with conventional dosing strategies, genotype‐guided warfarin dosing significantly: (i) shortened the time to first therapeutic INR by 2.6 days; (ii) shortened the time to first stable INR by 5.9 days; (iii) improved TTRs by 3.1%; (iv) reduced the number of patients with excessive anticoagulation (INR ≥4) with an RR of 0.87; and (v) reduced bleeding events with an RR of 0.82. No significant difference in the risk of thromboembolism or mortality was observed when comparing the two groups.
Warfarin has been one of the most commonly prescribed anticoagulant medications since its approval in 1954, although it may have been overtaken by non‐Vitamin K oral anticoagulants 30. Inactivation of warfarin occurs when it is metabolized to the 7‐hydroxy metabolite by CYP2C9 31. Polymorphisms in CYP2C9 are known to reduce the activity of the enzyme, leading to less effective warfarin inactivation 32. Moreover, polymorphisms in both the VKORC1 and CYP2C9 genes contribute to the interindividual variability in dosing requirements 33 and patients' responses to warfarin 34. Therefore, there has been significant interest in establishing whether genotype‐guided dosing therapy will improve INR control and clinical outcomes for patients on warfarin.
Previous RCTs comparing the effectiveness of genotype‐guided dosing and conventional dosing strategies, and even meta‐analyses of these trials, have been inconclusive 15, 16, 17, 18. Nevertheless, a subsequent meta‐analysis of 11 RCTs with trial sequential analysis has demonstrated improvements in the biochemical parameters of INR control and TTR values but limited clinical utility with genotype‐guided dosing 21. However, since its publication, an additional seven trials have been published. Of these newer trials, GIFT has been the largest to date, with 1597 subjects. This trial contributed approximately one‐third to the cohort included in the current meta‐analysis, and reported that genotype‐guided dosing prevented more adverse outcomes than clinically guided dosing in patients undergoing hip and knee surgery. In orthopaedic surgery, surgeons often have more time to obtain genotype data and use this information to plan for the surgery. By contrast, physicians who encounter patients with atrial fibrillation or venous thromboembolism often have little time to obtain genotype data before prescribing anticoagulants.
In our updated meta‐analysis, our significant findings were that both biochemical measures of warfarin therapy were improved, and bleeding complications reduced. The endpoints were chosen as these parameters are critical for guiding the decision‐making process in clinical practice. For example, both time to first therapeutic INR and time to stable INR can guide clinicians in deciding on an appropriate follow‐up duration and frequency. By contrast, TTR, INR ≥4 and risks of complications are important for resource allocation at the population level. The effect of genotype‐guided warfarin dosing compared with conventional dosing on TTR is convincing and is clinically important. The significant difference in TTR when a clinical information‐guided warfarin dosing regimen is used in the conventional arm is striking.
Two of the studies included in the meta‐analysis genotyped only for CYP2C9 variants 4, 6. The Clarification of Optimal Anticoagulation through Genetics (COAG) trial genotyped for CYP2C9*2 and *3 variants only, and not for other CYP2C9 variants 12. This is important because other CYP2C9 variants are found more frequently than CYP2C9*2 and *3 in African Americans, who constituted nearly one‐third of the study population. Therefore, the advantages of genotype‐guided warfarin dosing could be diminished in populations with African ancestry. Nevertheless, in the COAG trial, TTR was improved, excessive anticoagulation was reduced and the number of adverse events was reduced significantly. Consequently, in our meta‐analysis this had little impact on the overall pooled effect estimates for these endpoints.
There are several considerations on the practicality of utilizing genotype‐guided warfarin dosing. All of the included studies had applied complex proprietary algorithms for genotype testing to determine the suitable warfarin dose. Currently, it is unclear which algorithm is the best because no direct comparisons have been made. Currently, at least for physicians, it is difficult to take the time for genotype‐guided dosing to guide warfarin treatment during their busy workday, especially when a patient presents with acute venous thromboembolism or atrial fibrillation, when anticoagulation needs to be started immediately. This may not be the case for orthopaedic surgery, for which more time is available for the planning of surgery and anticoagulation. It may well be that there are adequate time and resources for acquiring the genotype of patients in clinical trials or in university hospitals. The situation is different for doctors who are working in the average clinic or hospital without significant resources that can be used for such testing. Nevertheless, a study has examined the procedural feasibility of a pharmacist‐led interdisciplinary service for providing genotype‐guided warfarin dosing for hospitalized patients newly starting on warfarin 35. When these tools were embedded into electronic health records, the majority of genotypes were available before the second warfarin dose, and good adherence to genotype‐guided dose recommendations by the medical staff was observed.
We estimated that genotyping is needed for 40 individuals in order to decrease the number of major bleeding events by one. By contrast, genotyping is needed for 238 individuals to reduce the number of thromboembolic events by one. These findings suggest that genotype‐guided warfarin dosing could be worthwhile for individuals who are at high risk of bleeding. A related key issue is whether the benefits of genotype‐guided dosing are cost‐effective. The widespread and increasing use of non‐VKAs is likely strongly to diminish the impact of genotype‐driven dosing for vitamin K anticoagulation. For patients who are prescribed warfarin, the cost of genotyping is relatively modest and likely to be much less costly than the costs for hospital admissions, long stays, and medical or interventional treatment due to bleeding. As cost‐effectiveness may also vary with the baseline risk of bleeding of the patients concerned, depending on the comorbidities, this issue requires formal health economic analysis in future studies, to determine the subset of patients on warfarin for whom genotype‐guided dosing is cost‐effective 36. Indeed, analyses of cost‐effectiveness have been conducted using pharmacogenetic information in warfarin dosing for patients with nonvalvular atrial fibrillation 37. Based on a Markov state transition decision model with effectiveness measured by quality‐adjusted life‐years, it was shown that warfarin‐related genotyping is unlikely to be cost‐effective for typical patients but may be cost‐effective in those at high risk of haemorrhage who will be started on warfarin therapy. Recent work has demonstrated its cost‐effectiveness in other conditions, such as mechanical heart valve replacement 38.
In 11 of the 18 trials, the genotype‐guided therapy arm was compared with a fixed‐dosing strategy in the standard care arm. In these studies, it is difficult to attribute the beneficial effects entirely to genotyping because patients in this group also benefited from the algorithms or regression models using clinical information, which also contributed to the accuracy of warfarin dosing. Therefore, the benefits of genotype‐guided therapy alone are better estimated by comparing with the remaining seven studies using the clinical information‐guided approach in the standard care arm. There was no apparent improvement in TTR, excessive anticoagulation, risk of thromboembolism or mortality between the genotype‐guided and the clinical information‐guided groups, although there may be a benefit in reducing the number of bleeding events. From the previous meta‐analyses 15, 16, 17, 18, 19, 20, 21, only three had performed subgroup analyses based on the dosing regimen in the control group 18, 20, 21. All three of these meta‐analyses demonstrated no significant improvement in either biochemical parameters of INR control or the clinical endpoints of bleeding and thromboembolism events in the genotype‐guided warfarin dosing group when compared with the clinical information‐guided group using an equation‐based approach.
Strengths and limitations
The current study had many strengths. It was the largest meta‐analysis of randomized trials to date, including 5230 participants from 18 trials. No heterogeneity or a low level of heterogeneity was observed for our meta‐analyses on excessive anticoagulation, bleeding, thromboembolism and mortality. Heterogeneity remained low, even when different types of control groups (fixed dosing and clinical information‐guided dosing) were analysed together, indicating the appropriateness of pooling these studies.
However, several limitations inherent in the present meta‐analysis should be noted. Firstly, significant heterogeneity was observed for the time to stable INR analysis. Similarly, the meta‐analysis of TTR showed a high level of heterogeneity, which was only partially accounted for when fixed dosing and clinical information‐guided dosing were analysed separately. Some of the heterogeneity may have been clinical, as a result of different patient populations studied—for example, with different indications for anticoagulation. As described above, any small benefits in lowering the risk of bleeding can be magnified in orthopaedic surgery because of the presence of open surgical wounds. In addition, our meta‐analysis focused on only one coumarin anticoagulant, warfarin, and no others. For example, neither acenocoumarol nor phenprocoumon, which may be more commonly prescribed in some countries, were included. Further analyses will be needed to establish whether genotype‐guided dosing is also better than conventional dosing strategies for such agents. Moreover, the mean follow‐up duration was 64 days. Although this is sufficient for evaluating the time to first therapeutic INR and time to stable INR, it cannot provide the full picture in terms of clinical outcomes. Furthermore, there appears to be considerable heterogeneity among the genotype testing regimens. Finally, although differences in bleeding rates could be detected in our meta‐analysis, the study may not have been powered sufficiently to detect differences in thromboembolism or mortality. Future work could also analyse whether genotype‐guided warfarin dosing is similarly effective in the perioperative periods in orthopaedic settings as compared with other clinical indications.
Conclusion
Genotype‐guided warfarin dosing offers better safety, with less bleeding, for patients requiring anticoagulation compared with conventional dosing strategies. No significant benefit in thromboembolism or mortality was evident.
Competing Interests
There are no competing interests to declare.
G.T. and S.W. are supported by Clinical Assistant Professorships funded by the Croucher Foundation of Hong Kong.
Contributors
G.T. and M.G. carried out article screening, data extraction, data analysis, and drafting and critical revision of the manuscript. G.L., S.W., W.K.K.W., W.T.W., L.R., A.P.W.L. carried out data interpretation and critical revision of the manuscript. G.Y.H.L., M.C.S.W. and T.L. conceived and supervised the study and carried out data interpretation and critical revision of the manuscript.
Supporting information
Figure S1 Additional search using more detailed search terms from February 2017 to March 2018
Figure S2 Risk‐of‐bias graph using the Cochrane Risk Assessment Tool
Figure S3 Risk‐of‐bias summary using the Cochrane Risk Assessment Tool
Figure S4 Funnel plot for time to first therapeutic international normalized ratio
Figure S5 Funnel plot for time to first stable international normalized ratio
Figure S6 Funnel plot for time in therapeutic range
Figure S7 Funnel plot for international normalized ratio ≥4
Figure S8 Funnel plot for bleeding
Figure S9 Funnel plot for thromboembolism
Figure S10 Funnel plot for mortality
Figure S11 Meta‐regression of the mean difference in time in therapeutic range on the logarithm of the risk ratio for INR ≥4
Figure S12 Meta‐regression of the mean difference in time in therapeutic range on the logarithm of the risk ratio for bleeding
Figure S13 Meta‐regression of the mean difference in time in therapeutic range on the logarithm of the risk ratio for thromboembolism
Figure S14 Meta‐regression of the mean difference in time in therapeutic range on the logarithm of the risk ratio for mortality
Table S1 Details of different genotype dosing algorithms
Tse, G. , Gong, M. , Li, G. , Wong, S. H. , Wu, W. K. K. , Wong, W. T. , Roever, L. , Lee, A. P. W. , Lip, G. Y. H. , Wong, M. C. S. , Liu, T. , and International Health Informatics Study (IHIS) Network (2018) Genotype‐guided warfarin dosing vs. conventional dosing strategies: a systematic review and meta‐analysis of randomized controlled trials. Br J Clin Pharmacol, 84: 1868–1882. 10.1111/bcp.13621.
Contributor Information
Gary Tse, Email: tseg@cuhk.edu.hk.
Tong Liu, Email: liutongdoc@126.com.
References
- 1. Kirley K, Qato DM, Kornfield R, Stafford RS, Alexander GC. National trends in oral anticoagulant use in the United States, 2007 to 2011. Circ Cardiovasc Qual Outcomes 2012; 5: 615–621. [DOI] [PMC free article] [PubMed] [Google Scholar]
- 2. Shehab N, Lovegrove MC, Geller AI, Rose KO, Weidle NJ, Budnitz DS. US emergency department visits for outpatient adverse drug events, 2013–2014. JAMA 2016; 316: 2115–2125. [DOI] [PMC free article] [PubMed] [Google Scholar]
- 3. Budnitz DS, Lovegrove MC, Shehab N, Richards CL. Emergency hospitalizations for adverse drug events in older Americans. N Engl J Med 2011; 365: 2002–2012. [DOI] [PubMed] [Google Scholar]
- 4. Hillman MA, Wilke RA, Yale SH, Vidaillet HJ, Caldwell MD, Glurich I, et al A prospective, randomized pilot trial of model‐based warfarin dose initiation using CYP2C9 genotype and clinical data. Clin Med Res 2005; 3: 137–145. [DOI] [PMC free article] [PubMed] [Google Scholar]
- 5. Anderson JL, Horne BD, Stevens SM, Grove AS, Barton S, Nicholas ZP, et al Randomized trial of genotype‐guided versus standard warfarin dosing in patients initiating oral anticoagulation. Circulation 2007; 116: 2563–2570. [DOI] [PubMed] [Google Scholar]
- 6. Caraco Y, Blotnick S, Muszkat M. CYP2C9 genotype‐guided warfarin prescribing enhances the efficacy and safety of anticoagulation: a prospective randomized controlled study. Clin Pharmacol Ther 2008; 83: 460–470. [DOI] [PubMed] [Google Scholar]
- 7. Huang S‐W, Chen H‐S, Wang X‐Q, Huang L, Xu D‐L, Hu X‐J, et al Validation of VKORC1 and CYP2C9 genotypes on interindividual warfarin maintenance dose: a prospective study in Chinese patients. Pharmacogenet Genomics 2009; 19: 226–234. [DOI] [PubMed] [Google Scholar]
- 8. Burmester JK, Berg RL, Yale SH, Rottscheit CM, Glurich IE, Schmelzer JR, et al A randomized controlled trial of genotype‐based Coumadin initiation. Genet Med 2011; 13: 509–518. [DOI] [PubMed] [Google Scholar]
- 9. Borgman MP, Pendleton RC, McMillin GA, Reynolds KK, Vazquez S, Freeman A, et al Prospective pilot trial of PerMIT versus standard anticoagulation service management of patients initiating oral anticoagulation. Thromb Haemost 2012; 108: 561–569. [DOI] [PMC free article] [PubMed] [Google Scholar]
- 10. Wang M, Lang X, Cui S, Fei K, Zou L, Cao J, et al Clinical application of pharmacogenetic‐based warfarin‐dosing algorithm in patients of Han nationality after rheumatic valve replacement: a randomized and controlled trial. Int J Med Sci 2012; 9: 472–479. [DOI] [PMC free article] [PubMed] [Google Scholar]
- 11. Jonas DE, Evans JP, McLeod HL, Brode S, Lange LA, Young ML, et al Impact of genotype‐guided dosing on anticoagulation visits for adults starting warfarin: a randomized controlled trial. Pharmacogenomics 2013; 14: 1593–1603. [DOI] [PubMed] [Google Scholar]
- 12. Kimmel SE, French B, Kasner SE, Johnson JA, Anderson JL, Gage BF, et al A pharmacogenetic versus a clinical algorithm for warfarin dosing. N Engl J Med 2013; 369: 2283–2293. [DOI] [PMC free article] [PubMed] [Google Scholar]
- 13. Li J, Liu S, Yang JH, Guo W, Wang ZZ, Chen Y, et al A randomized controlled study of the VKORC1 and CYP2C9 genotypes in guiding warfarin therapy for pulmonary thromboembolism. Zhonghua Jie He He Hu Xi Za Zhi 2013; 36: 950–953. [PubMed] [Google Scholar]
- 14. Pirmohamed M, Burnside G, Eriksson N, Jorgensen AL, Toh CH, Nicholson T, et al A randomized trial of genotype‐guided dosing of warfarin. N Engl J Med 2013; 369: 2294–2303. [DOI] [PubMed] [Google Scholar]
- 15. Stergiopoulos K, Brown DL. Genotype‐guided vs clinical dosing of warfarin and its analogues: meta‐analysis of randomized clinical trials. JAMA Intern Med 2014; 174: 1330–1338. [DOI] [PubMed] [Google Scholar]
- 16. Franchini M, Mengoli C, Cruciani M, Bonfanti C, Mannucci PM. Effects on bleeding complications of pharmacogenetic testing for initial dosing of vitamin K antagonists: a systematic review and meta‐analysis. J Thromb Haemost 2014; 12: 1480–1487. [DOI] [PubMed] [Google Scholar]
- 17. Tang Q, Zou H, Guo C, Liu Z. Outcomes of pharmacogenetics‐guided dosing of warfarin: a systematic review and meta‐analysis. Int J Cardiol 2014; 175: 587–591. [DOI] [PubMed] [Google Scholar]
- 18. Liao Z, Feng S, Ling P, Zhang G. Meta‐analysis of randomized controlled trials reveals an improved clinical outcome of using genotype plus clinical algorithm for warfarin dosing. J Thromb Thrombolysis 2015; 39: 228–234. [DOI] [PubMed] [Google Scholar]
- 19. Dahal K, Sharma SP, Fung E, Lee J, Moore JH, Unterborn JN, et al Meta‐analysis of randomized controlled trials of genotype‐guided vs standard dosing of warfarin. Chest 2015; 148: 701–710. [DOI] [PMC free article] [PubMed] [Google Scholar]
- 20. Xu H, Xie X, Wang B, Chen Y, Meng T, Ma S, et al Meta‐analysis of efficacy and safety of genotype‐guided pharmacogenetic dosing of warfarin. Int J Cardiol 2014; 177: 654–657. [DOI] [PubMed] [Google Scholar]
- 21. Tang HL, Shi WL, Li XG, Zhang T, Zhai SD, Xie HG. Limited clinical utility of genotype‐guided warfarin initiation dosing algorithms versus standard therapy: a meta‐analysis and trial sequential analysis of 11 randomized controlled trials. Pharmacogenomics J 2015; 15: 496–504. [DOI] [PubMed] [Google Scholar]
- 22. Pengo V, Zambon CF, Fogar P, Padoan A, Nante G, Pelloso M, et al A randomized trial of pharmacogenetic warfarin dosing in naive patients with non‐valvular atrial fibrillation. PLoS One 2015; 10: e0145318. [DOI] [PMC free article] [PubMed] [Google Scholar]
- 23. Supe S, Poljakovic Z, Bozina T, Ljevak J, Macolic Sarinic V, Bozina N. Clinical application of genotype‐guided dosing of warfarin in patients with acute stroke. Arch Med Res 2015; 46: 265–273. [DOI] [PubMed] [Google Scholar]
- 24. Duan L, Zhang N, Liu C. A randomized controlled study of the VKORC1 and CYP2C9 genotypes in guiding warfarin initial dosing algorithm for pulmonary thromboembolism. Chest 2016; 149: A519. [PubMed] [Google Scholar]
- 25. Gage BF, Bass AR, Lin H, Woller SC, Stevens SM, Al‐Hammadi N, et al Effect of genotype‐guided warfarin dosing on clinical events and anticoagulation control among patients undergoing hip or knee arthroplasty: the GIFT randomized clinical trial. JAMA 2017; 318: 1115–1124. [DOI] [PMC free article] [PubMed] [Google Scholar]
- 26. Jin H, Jiang F, Wei J, Yao Y, Yuan H, Yu M, et al CYP2C9 and VKORC1 genotype‐guided individualized warfarin therapy in Chinese patients with acute pulmonary thromboembolism: a randomized controlled clinical study. Int J Clin Exp Med 2017; 10: 5595–5602. [Google Scholar]
- 27. Wen MS, Chang KC, Lee TH, Chen YF, Hung KC, Chang YJ, et al Pharmacogenetic dosing of warfarin in the Han‐Chinese population: a randomized trial. Pharmacogenomics 2017; 18: 245–253. [DOI] [PubMed] [Google Scholar]
- 28. Liberati A, Altman DG, Tetzlaff J, Mulrow C, Gøtzsche PC, Ioannidis JPA, et al The PRISMA statement for reporting systematic reviews and meta‐analyses of studies that evaluate healthcare interventions: explanation and elaboration. BMJ 2009; 339: b2700. [DOI] [PMC free article] [PubMed] [Google Scholar]
- 29. Radhakrishnan A, Vido D, Tayur S, Akan M, Murali S. Genotype guided therapeutic dosing of Warfarin in geriatric patients. J Am Coll Cardiol 2012; 59: E1696. [Google Scholar]
- 30. Weitz JI, Semchuk W, Turpie AGG, Fisher WD, Kong C, Ciaccia A, et al Trends in prescribing oral anticoagulants in Canada, 2008–2014. Clin Ther 2015; 37: 2506–14.e4. [DOI] [PubMed] [Google Scholar]
- 31. Goldstein JA, de Morais SM. Biochemistry and molecular biology of the human CYP2C subfamily. Pharmacogenetics 1994; 4: 285–299. [DOI] [PubMed] [Google Scholar]
- 32. Moyer TP, O'Kane DJ, Baudhuin LM, Wiley CL, Fortini A, Fisher PK, et al Warfarin sensitivity genotyping: a review of the literature and summary of patient experience. Mayo Clin Proc 2009; 84: 1079–1094. [DOI] [PMC free article] [PubMed] [Google Scholar]
- 33. Zhang J, Chen Z, Chen C. Impact of CYP2C9, VKORC1 and CYP4F2 genetic polymorphisms on maintenance warfarin dosage in Han‐Chinese patients: a systematic review and meta‐analysis. Meta Gene 2016; 9: 197–209. [DOI] [PMC free article] [PubMed] [Google Scholar]
- 34. Jorgensen AL, FitzGerald RJ, Oyee J, Pirmohamed M, Williamson PR. Influence of CYP2C9 and VKORC1 on patient response to warfarin: a systematic review and meta‐analysis. PLoS One 2012; 7: e44064. [DOI] [PMC free article] [PubMed] [Google Scholar]
- 35. Nutescu EA, Drozda K, Bress AP, Galanter WL, Stevenson J, Stamos TD, et al Feasibility of implementing a comprehensive warfarin pharmacogenetics service. Pharmacotherapy 2013; 33: 1156–1164. [DOI] [PMC free article] [PubMed] [Google Scholar]
- 36. Eckman MH, Greenberg SM, Rosand J. Should we test for CYP2C9 before initiating anticoagulant therapy in patients with atrial fibrillation? J Gen Intern Med 2009; 24: 543–549. [DOI] [PMC free article] [PubMed] [Google Scholar]
- 37. Eckman MH, Rosand J, Greenberg SM, Gage BF. Cost‐effectiveness of using pharmacogenetic information in warfarin dosing for patients with nonvalvular atrial fibrillation. Ann Intern Med 2009; 150: 73–83. [DOI] [PubMed] [Google Scholar]
- 38. Kim DJ, Kim HS, Oh M, Kim EY, Shin JG. Cost effectiveness of genotype‐guided warfarin dosing in patients with mechanical heart valve replacement under the fee‐for‐service system. Appl Health Econ Health Policy 2017; 15: 657–667. [DOI] [PubMed] [Google Scholar]
Associated Data
This section collects any data citations, data availability statements, or supplementary materials included in this article.
Supplementary Materials
Figure S1 Additional search using more detailed search terms from February 2017 to March 2018
Figure S2 Risk‐of‐bias graph using the Cochrane Risk Assessment Tool
Figure S3 Risk‐of‐bias summary using the Cochrane Risk Assessment Tool
Figure S4 Funnel plot for time to first therapeutic international normalized ratio
Figure S5 Funnel plot for time to first stable international normalized ratio
Figure S6 Funnel plot for time in therapeutic range
Figure S7 Funnel plot for international normalized ratio ≥4
Figure S8 Funnel plot for bleeding
Figure S9 Funnel plot for thromboembolism
Figure S10 Funnel plot for mortality
Figure S11 Meta‐regression of the mean difference in time in therapeutic range on the logarithm of the risk ratio for INR ≥4
Figure S12 Meta‐regression of the mean difference in time in therapeutic range on the logarithm of the risk ratio for bleeding
Figure S13 Meta‐regression of the mean difference in time in therapeutic range on the logarithm of the risk ratio for thromboembolism
Figure S14 Meta‐regression of the mean difference in time in therapeutic range on the logarithm of the risk ratio for mortality
Table S1 Details of different genotype dosing algorithms