

Abstract
Astrocytes are involved in non‐cell‐autonomous pathogenic cascades in amyotrophic lateral sclerosis (ALS); however, their role is still debated. We show that astrocytic NF‐κB activation drives microglial proliferation and leukocyte infiltration in the SOD1 (G93A) ALS model. This response prolongs the presymptomatic phase, delaying muscle denervation and decreasing disease burden, but turns detrimental in the symptomatic phase, accelerating disease progression. The transition corresponds to a shift in the microglial phenotype showing two effects that can be dissociated by temporally controlling NF‐κB activation. While NF‐κB activation in astrocytes induced a Wnt‐dependent microglial proliferation in the presymptomatic phase with neuroprotective effects on motoneurons, in later stage, astrocyte NF‐κB‐dependent microglial activation caused an accelerated disease progression. Notably, suppression of the early microglial response by CB2R agonists had acute detrimental effects. These data identify astrocytes as important regulators of microglia expansion and immune response. Therefore, stage‐dependent microglia modulation may be an effective therapeutic strategy in ALS.
Keywords: amyotrophic lateral sclerosis, astrocytes, CB2 receptor agonist, NF‐κB, Wnt
Subject Categories: Molecular Biology of Disease, Neuroscience
Introduction
Amyotrophic lateral sclerosis (ALS) is a motoneuron (MN) disease conceptualized as a non‐cell‐autonomous condition in which the pathogenic process originates from the interaction of MNs themselves, other neurons, astrocytes, microglia, and immune cell subpopulations (Boillée et al, 2006; Ilieva et al, 2009).
NF‐κB is a transcription factor regulating the expression of a large number of genes involved in immune responses and it is considered a master regulator of inflammation (Hayden & Ghosh, 2012). NF‐κB has been reported to be a key driver of microglia in ALS: Transgenic activation of NF‐κB in microglia is sufficient to increase MN impairment, to shorten overall survival in SOD1 (G93A) mice and to cause MN dysfunction per se, whereas NF‐κB suppression in microglia produces beneficial effects (Frakes et al, 2014). Remarkably, transcriptomics and biochemical analysis of human ALS samples revealed NF‐κB activation not only in microglia but also in astrocytes (Haidet‐Phillips et al, 2011; Swarup et al, 2011). Because of the immune‐related functions attributed to astrocytes (Brambilla et al, 2009; Lattke et al, 2012; Colombo & Farina, 2016), astrocytic NF‐κB signaling has been hypothesized to contribute to the neuroinflammatory cascade in ALS.
However, astrocyte‐specific suppression of NF‐κB activation either by conditional deletion of inhibitor of NF‐κB kinase subunit beta (IKK2) or by viral overexpression of degradation‐resistant IκB has been reported to have no effect on overall disease progression in ALS mouse models (Crosio et al, 2011; Frakes et al, 2014). This leaves the functional role of NF‐κB in astrocyte‐mediated neuroinflammation in ALS unclear, although NF‐κB is indeed activated in ALS astrocytes (Haidet‐Phillips et al, 2011; Swarup et al, 2011) and astrocytic NF‐κB has been shown to have non‐cell‐autonomous toxic effects (e.g., on oligodendrocyte function; Raasch et al, 2011). Does astrocytic NF‐κB modulate the neuroinflammatory response in ALS, and if so, in which timeframe and direction? Given the multi‐phased nature of the pathogenic process in ALS (Saxena et al, 2013) and the age‐dependent net effect of astrocytic NF‐κB (Colombo & Farina, 2016; Lattke et al, 2017), the functional analysis of NF‐κB requires experimental control over the timing and the cellular subpopulations in which its activation takes place.
Therefore, we investigated the effect of astrocytic IKK2/NF‐κB activation in ALS using the tetracycline‐regulated gene expression system under control of the GFAP promoter (Lattke et al, 2012). This allows astrocyte‐restricted conditional expression of constitutively active IKK2 (IKK2‐CA). Surprisingly, IKK2/NF‐κB activation in astrocytes induces a neuroprotective phenotype in the presymptomatic stages, with a decrease in MN disease burden and delayed onset phase, associated with an abundant Wnt‐dependent microglial proliferation. At later stages, it enhances a pro‐inflammatory microglial activation, leading to an accelerated progression phase and a shorter survival.
Results
The GFAP.tTA/tetO.IKK2CA module drives NF‐κB activation and target genes expression in spinal cord astrocytes
In order to activate NF‐κB in astrocytes in an ALS mouse model, we combined the GFAP.tTA/(tetO)7.IKK2‐CA line, in which the constitutively active IKK2 allele is expressed only upon doxycycline (DOX) withdrawal (Lattke et al, 2012), with SOD1 (G93A) mice (Fig 1A and B). Four experimental groups were contrasted as follows: the SOD1(G93A)/GFAP.tTA/(tetO)7.IKK2‐CA (activation of astrocytic IKK2/NF‐κB in mutant SOD1 ALS model, henceforth SOD1/IKK), SOD1(G93A)/GFAP.tTA or SOD1(G93A)/(tetO)7.IKK2‐CA mice (mutant SOD1 but no activation of IKK2/NF‐κB, henceforth SOD1), GFAP.tTA/tetO.IKK2‐CA mice (activation of astrocytic IKK2/NF‐κB only, no mutant SOD1, henceforth IKK), and GFAP.tTA or (tetO)7.IKK2‐CA (no activation of IKK2/NF‐κB and no mutant SOD1, henceforth WT; Fig 1A). All experiments were performed on male mice, unless otherwise specified.
Figure 1. GFAP.tTA/(tetO)7.IKK2‐CA/SOD1(G93A) triple‐transgenic mice allow cell type‐specific and persistent activation of NF‐κB in astrocytes.
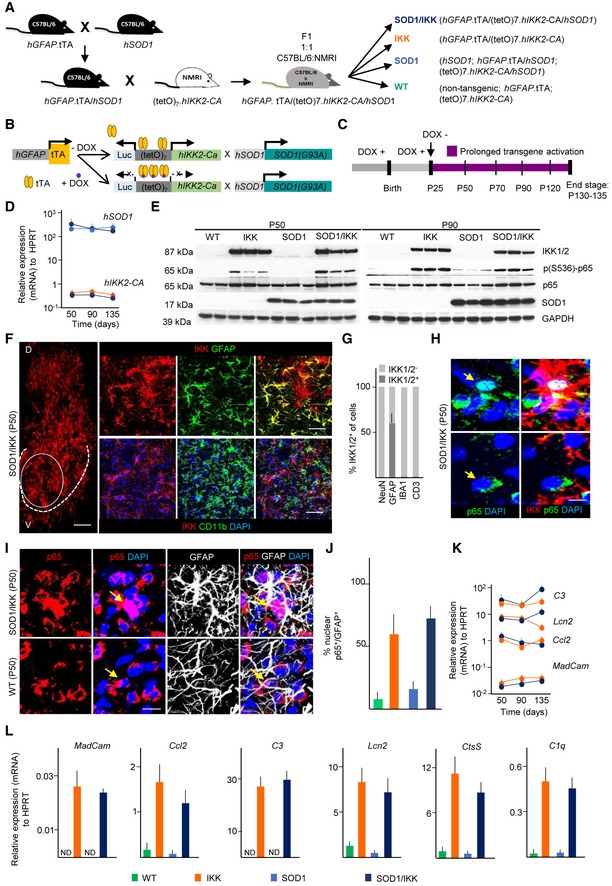
- Breeding strategy for the generation of hGFAP.tTA/(tetO)7.IKK2‐CA/hSOD1 triple‐transgenic mice and control littermates.
- Schematic of the combined transgene expression systems and impact of doxycycline (DOX).
- Experimental design for IKK2‐CA transgene expression from P25 until P130‐135.
- Stable mRNA expression (relative to HPRT) of the hIKK2‐CA and hSOD1 transgenes over time after DOX withdrawal; (n = 3–4).
- Immunoblot showing comparable levels of 17 kDa SOD1 protein in SOD1 and SOD1/IKK mice and human IKK2‐CA transgene (87 kDA, IKK1/2) in IKK and SOD1/IKK mice, respectively. Whereas p65 (NF‐κB subunit, 65 kDA) is expressed in all animals equally, phosphorylated p65 (S536) is strongly elevated only in IKK and SOD1/IKK animals, respectively.
- Immunostaining of IKK showing the distribution in the dorsal (D) and ventral (V) homolateral spinal cord of SOD1/IKK mice. The oval area represents the original target area of the upper panels stained with IKK and GFAP. The dashed line represents the ventral horn (V) gray matter boundary, where all the pictures for all the experiments of this manuscript were acquired. The upper panel shows the co‐localization of IKK2 (red) with GFAP (green) in SOD1/IKK at P50, whereas the lower panel does not show co‐localization of the microglial marker CD11b and IKK marker in SOD1/IKK mice at P50. The nuclei are stained with DAPI (blue).
- Quantification of IKK2‐CA+ cells among neuronal (NEUN), astrocytic (GFAP), microglial (IBA1), and lymphocytic (CD3) populations at P50.
- Only cells with IKK2‐CA expression (IKK2‐CAON, red) display nuclear translocation of p65 (green). Arrows indicate the nuclear p65; (n = 4).
- Co‐immunostaining of p65 (red), GFAP (white), and DAPI (blue) in ventral horn spinal cord sections of WT and SOD1/IKK mice at P50. Arrows show nuclear localization of the p65 in SOD1/IKK and extra‐nuclear localization in WT mice.
- Quantification of nuclear p65+ in astrocytes (GFAP+/p65+, expressed as %) of WT, IKK, SOD1, and SOD1/IKK at P50.
- Expression of NF‐κB target genes (P50, P90, P135) in IKK and SOD1/IKK mice as indicated (relative to HPRT, n = 4).
- Upregulation of selected NF‐κB target genes (as indicated) in the spinal cord of WT, IKK, SOD1, SOD1/IKK male animals at P50 demonstrating functional NF‐κB activation (n = 3–4).
Upon transgene activation at P25 (DOX withdrawn; Fig 1C), IKK2‐CA mRNA (Fig 1D) and protein levels (Fig 1E and Appendix Fig S1A) were persistently upregulated at P50, P90, or P135 in spinal cord in IKK and SOD1/IKK mice without interfering with the expression of mutant SOD1 (Fig 1D and E, and Appendix Fig S1B). The ratio of phosphorylated to total p65 was strongly increased in whole spinal cord protein extracts from IKK and SOD1/IKK samples at P50 and at P90, indicating the activation of the NF‐κB module (Fig 1E and Appendix Fig S1C). In agreement with the activity of the GFAP promoter, IKK2‐CA was expressed in about 60% of the total GFAP+ pool throughout the spinal cord both in IKK and SOD1/IKK mice (Fig 1F and G). Microglial cells, neurons, and lymphocytes (IBA1+, NEUN+, and CD3+ cells) displayed no transgene expression (Fig 1F and G).
IKK2‐CAON cells either in IKK or in SOD1/IKK mice displayed a nuclear translocation of p65 (68 ± 5% of IKK2‐CAON cells; Fig 1H); in agreement with astrocyte‐restricted IKK2‐CA expression, 62.5 ± 10.4% and 72.1 ± 7.6% of GFAP+ astrocytes in IKK or in SOD1/IKK, respectively, showed nuclear p65, but rarely in WT and SOD1 (at P50; Fig 1I and J). Furthermore, several NF‐κB target genes (lipocalin 2 [Lcn2], complement C3 and C1q, cathepsin S [CtsS], MadCAM, and CCL2) were persistently expressed over time in spinal cord from IKK and SOD1/IKK (Fig 1K) and strongly upregulated compared to WT and SOD1 (Fig 1L), confirming effective NF‐κB activation. LCN2 expression was verified on protein level (Appendix Fig S1D and E).
Activation of astrocytic NF‐κB causes extensive microglial proliferation and lymphocyte infiltration
Next, we activated astrocytic NF‐κB at P20‐25 in IKK and SOD1/IKK mice and analyzed astrocytes, microglia, and leukocytes in spinal cord sections over time. NF‐κB activation in astrocytes did not increase their number but rather their size and intermediate filament expression (Fig 2A–C): GFAP+ area was increased both in IKK and in SOD1/IKK mice at P30 (15.2 ± 7.1% in IKK and 16.1 ± 5.5 in SOD1/IKK compared to 5.5 ± 0.4% in WT and 6.1 ± 1.1 in SOD1) and further increased over time in SOD1, IKK, and SOD1/IKK, being significantly higher in the latter than in SOD1 or IKK littermates (Fig 2A and B).
Figure 2. Prolonged NF‐κB activation in astrocytes exacerbates an immune response in the spinal cord with microglia expansion, gliosis, and lymphocyte infiltration.
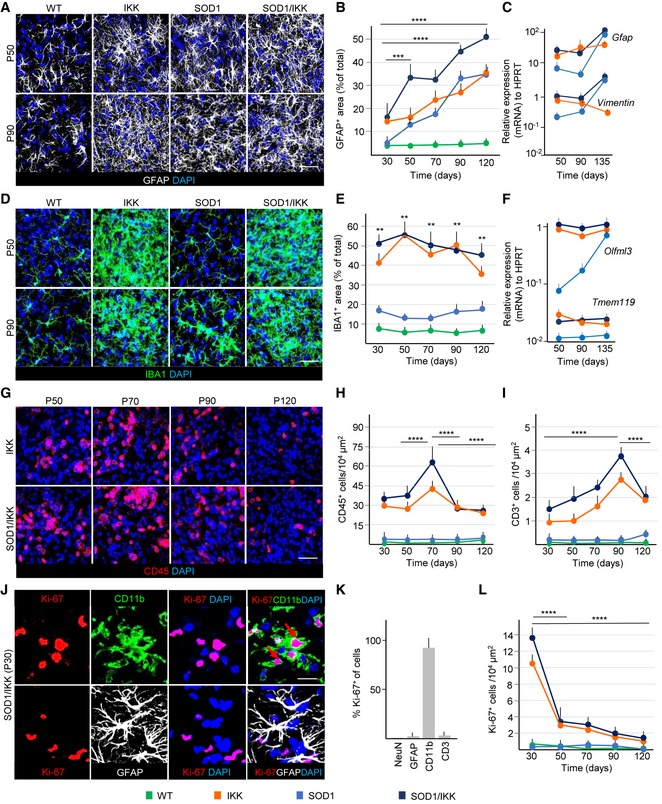
- IF staining of GFAP (white) and DAPI (blue) at P50 and P90 across all genotypes; (n = 4).
- Time course of astrocytic coverage (expressed as % of GFAP+ area) in WT, IKK, SOD1, and SOD1/IKK; (n = 4).
- Gfap and Vimentin gene expression over time in SOD1, IKK, and SOD1/IKK; (n = 4).
- Immunostaining of IBA1 (green) showing microglia expansion in IKK and SOD1/IKK ventral horn spinal cord sections; (n = 4).
- Time course of microglia density expressed as IBA1+ area (% of total area) in WT, IKK, SOD1, and SOD1/IKK mice; (n = 4).
- Relative gene expression of Olfml3 and Tmem119 (specific microglia genes) over time in IKK, SOD1, and SOD1/IKK littermates; (n = 4).
- Immunostaining of CD45+ cells (red) in ventral horn spinal cord sections of IKK and SOD1/IKK mice over time; (n = 4).
- Time course of CD45+ density (number of cells/area unit) in WT, IKK, SOD1, and SOD1/IKK mice; (n = 4).
- Time course of infiltrating CD3+ cells in WT, IKK, SOD1 and SOD1/IKK animals; (n = 4).
- IF staining of CD11b (green), KI‐67 (red), GFAP (white), and DAPI (blue) in SOD1/IKK at P30. Scale bar, 2 μm. Arrows show co‐localization of KI‐67 with CD11b but not with GFAP.
- Histogram representing % of KI‐67+ cells in neuronal (NeuN), astrocytic (GFAP), microglial (CD11b), and lymphocytic (CD3) populations at P30.
- Quantification of KI‐67+/CD11b+ cells per area unit in WT, IKK, SOD1, SOD1/IKK mice over time; (n = 4).
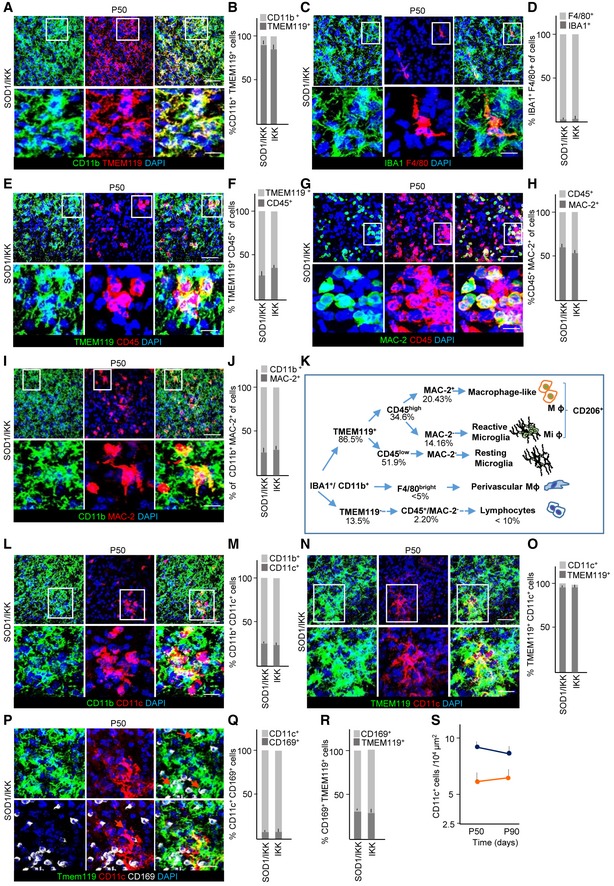
Interestingly, the population of inflammatory cells was massively expanded in IKK and SOD1/IKK mice. Both the number (not shown) and the volume occupied by IBA1+ (or CD11b+) cells were prominently (up to sevenfold) increased already at P30 (Fig 2D and E), peaking at P50 and thereafter declined until P120 (Fig 2E). In IKK and SOD1/IKK mice, IBA1+ cells assumed an amoeboid shape with prominent lamellipodia at P30‐P70, but turned to a retracted, “bushy” appearance at P90‐120 (Fig 2D and high‐magnification, single optical sections in Appendix Fig S2A and B). In agreement with the expansion of microglial population, expression of microglia‐specific genes Olfml3 and Tmem119 (Chiu et al, 2008; Fig 2F) and IBA1 protein levels (Appendix Fig S2C and D) were strongly upregulated in IKK and SOD1/IKK. Nearly all CD11b+ cells were TMEM119+ (Bennett et al, 2016; Zrzavy et al, 2017) confirming their microglial identity (Fig EV1A and B). Only a very small percentage of CD11b+ cells were F4/80+ (all of them located in perivascular position; Fig EV1C and D).
Figure EV1. Prolonged NF‐κB activation in astrocytes induces microglia differentiation.
-
A, BCo‐immunostaining of CD11b, TMEM119, DAPI, and quantification of CD11b+/TMEM119+ and CD11b+/TMEM119− cells in SOD1/IKK mice; more than 90% of CD11b+ cells are TMEM119+, confirming the microglial identity.
-
C, DImmunostaining for microglia (IBA1), macrophages (F4/80), DAPI, and quantification of F4/80+/IBA1+ cells. F4/80+ cells represent only a very small percentage of IBA1+ cells.
-
E, FCo‐immunostaining of TMEM119, CD45, DAPI, and quantification of TMEM119+/CD45+; CD45 identifies a subset of TMEM119+ microglia.
-
G, HImmunostaining for MAC‐2, CD45, DAPI, and the relative quantification of CD45+/MAC‐2+ and CD45+/MAC‐2− fraction; only a subset of CD45+ cells are also MAC‐2+.
-
I, JImmunostaining of CD11b, MAC‐2, DAPI, and quantification of CD11b+/MAC‐2+ fraction, confirming that MAC‐2+ cells represent a subset of microglia.
- K
-
L, MCo‐immunostaining of CD11b, CD11c, DAPI, and quantification of CD11b+/CD11c+ (DAM) fraction; CD11c+ cells represent about 25% of myeloid cells.
-
N, OImmunostaining of TMEM119, CD11c, DAPI, and quantification of CD11c+/TMEM119+, showing that nearly all CD11c+ are microglia and not infiltrating cells.
-
P–RImmunostaining of TMEM119, CD11c, CD169, and quantification of TMEM119+/CD11c+ fraction expressing the monocyte marker CD169; almost no CD11c+ cell is CD169+, confirming that CD11c+ are not infiltrating monocytes; nevertheless, a distinct population of TMEM119+/CD169+ early‐activated microglia can be identified (R).
-
STime course of CD11c+ cell fraction in the overall CD11b+ population; the DAM population does not expand in the progression phase.
Nevertheless, the expanded microglial population exhibited a considerable phenotypic heterogeneity: A subset (34.6%; Fig EV1E and F) of TMEM119+ cells were CD45+, discriminating reactive microglia from resting microglia (Tan et al, 2000; Nikolakopoulou et al, 2013) and within the CD45+ subpopulation a subset of galectin‐3/MAC‐2+ cells could be distinguished (Fig EV1G and H), whereas CD11b+CD45− cells were consistently galectin‐3/MAC‐2−; in agreement with these data, only 25% of CD11b+ were MAC2+ (Fig EV1I and J, summarized in Fig EV1K). Furthermore, 25% of microglia in SOD1/IKK mice at P50 were CD11b+/CD11c+ (Fig EV1L and M); more than 90% of the CD11c+ cells were TMEM119+ (Fig EV1N and O) indicating their microglial origin and identifying them as a subtype correlated with disease‐associated microglia (DAM) rather than infiltrating macrophages or dendritic cells (Keren‐Shaul et al, 2017). Confirming this view, less than 10% of CD11c+ cells were positive for the monocyte marker CD169 (Fig EV1P and Q). Of note, we also identified a population of TMEM119+/CD169+, corresponding to activated microglia (Bogie et al, 2018) which was consistently negative for CD11c (Fig EV1P–R), suggesting that CD11b+/TMEM119+/CD11c+ constitutes a distinct subset of microglial cells. The percentage of CD11c+ cells stayed stable also at P90, directly proportional to the total microglia levels (Fig EV1S).
The CD45+ population varied quantitatively over time (Fig 2G): These cells were elevated at P30 in IKK and SOD1/IKK mice, (30.7 ± 3.5 and 33.7 ± 4.3 cells/104 μm2, respectively; P < 0.0001 versus WT and SOD1; Fig 2G) and peaked at P70 before declining (Fig 2G and H). A small subpopulation of infiltrating lymphocytes (CD3+) was also found increased in the spinal cord of IKK and SOD1/IKK mice, peaking at P90 (4.8 ± 0.5 and 2.9 ± 0.3 cells/104 μm2 for SOD1/IKK and IKK, respectively; P < 0.0001 versus WT and SOD1) before declining (Fig 2I).
The increased cellularity in CD11b+/IBA1+/TMEM119+ cells (for SOD1/IKK and IKK) was mainly due to proliferation: In fact, almost all KI‐67+ cells in IKK and SOD1/IKK mice were CD11b+ and only a small fraction (< 5%) of GFAP+ or CD3+ cells was found (Fig 2J and K). Within the microglia in IKK and SOD1/IKK mice, the IBA1+CD45− subset represented one‐third of the proliferating cells (IBA1+CD45− PCNA+; Appendix Fig S3A–D), whereas IBA1+CD45+‐activated microglia represented two‐thirds of proliferating cells (IBA1+CD45+PCNA+; Appendix Fig S3A–D). Non‐microglial IBA1−CD45+ cells contributed only to about 5% of proliferating cells (5 ± 0.6 and 5.2 ± 3% in IKK and SOD1/IKK mice, respectively; Appendix Fig S3B and D). Proliferation of CD11b+ cells was maximal at P30 (when up to 15% of CD11b+ were also KI‐67+) and declined at later time points (Fig 2L). Even at later time points, IBA+CD45+ microglia contributed the largest share of proliferating cells, whereas non‐microglial IBA−CD45+ cells remained largely non‐proliferative (Appendix Fig S3A, E and F).
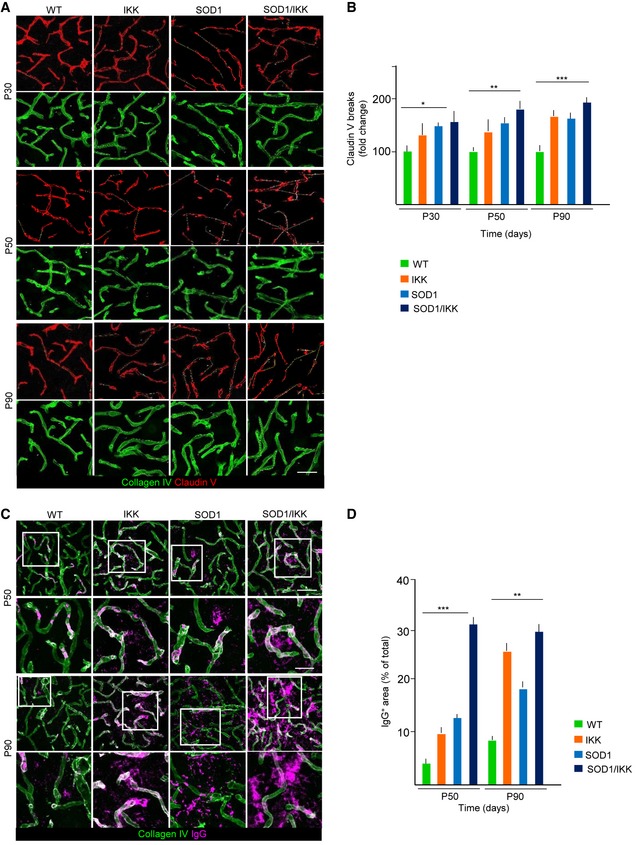
Given the role of astrocytes in the regulation of the blood–spinal cord barrier (BSCB), whose disruption has been associated with ALS pathogenesis (Garbuzova‐Davis et al, 2007), we monitored the expression of claudin‐5 (important for the maintenance of BSCB integrity) in endothelial cells upon astrocytic IKK activation. The presence of IgG in the parenchyma was also measured to test BSCB permeability. In WT mice, claudin‐5 is visualized as an almost continuous ribbon inside the collagen‐IV+ vascular basal membrane (Fig 3A). However, already at P30 in SOD1 mice, the claudin‐5 ribbon becomes discontinuous, indicating areas with changes in BSCB integrity. This disruption was significantly higher in SOD1, SOD1/IKK, and IKK than in WT at P30 (145.8 ± 6.4%, 150.6 ± 23.6%, and 136.4 ± 20.1% of WT, respectively, P < 0.01; Fig 3A and B). We observed a progressive increase in the length of disrupted claudin‐5 ribbon in IKK, SOD1, and SOD1/IKK at P50 and P90 with SOD1/IKK showing the greatest degree of breakdown (172.9 ± 10.2% of WT at P50 and 174.7 ± 10.8% of WT at P90). Consistent with that, we detected a significant enrichment of IgG (Garbuzova‐Davis et al, 2012) in the spinal cord parenchyma especially in SOD1/IKK mice at P50 (IgG+ area 31.6 ± 7.0% of total area, compared with 9.9 ± 2.2% in IKK, 12.5 ± 0.4 in SOD1 and 3.6 ± 0.5 in WT; P < 0.001; Fig 3C and D) revealing a rise in IgG extravasation. At P90, parenchymal IgG levels increase further in IKK and SOD1 littermates (26.21 ± 9.1% and 18.81 ± 5% of total area, respectively; P < 0.001; Fig 3C and D) and remained high in SOD1/IKK (29.8 ± 10% of total area; Fig 3C and D).
Figure 3. Astrocytic NF‐κB activation promotes BSCB disruption.
-
A, BEarly and progressive disruption of tight junctions in spinal cord vascular endothelium. Expression of claudin‐5 within collagen‐IV+ vessels is visualized as continuous ribbon in WT vessels; claudin‐5 ribbon is fragmented in IKK, SOD1, and SOD1/IKK mice from P30 on, and the length of vascular segments devoid of claudin‐5 increases progressively until P90, in particular in SOD1/IKK mice. Scale bar, 30 μm; (n = 4).
-
C, DImmunostaining and quantification of IgG deposits in the parenchyma of spinal cord. At P50, no IgG deposit can be detected in WT samples, although IKK and SOD1 samples display some IgG accumulation, which is greatly increased in SOD1/IKK mice. At P90, IgG deposition in spinal cord is greatly increased in IKK and SOD1/IKK mice, but less so in SOD1 mice. (n = 4). Insets are shown at higher magnification. Scale bar, 60 μm and 20 μm for the insets.
Taken together, the neuroinflammatory response in IKK and SOD1/IKK mice is characterized by prominent microglial proliferation together with an important process of differentiation and polarization toward a reactive phenotype (summarized in Fig EV1K), astrogliosis (Fig 2A–C), BSCB disruption (Fig 3A–D), and leukocyte infiltration (Fig 2G–I).
Prolonged activation of astrocytic NF‐κB delays disease onset but accelerates progression
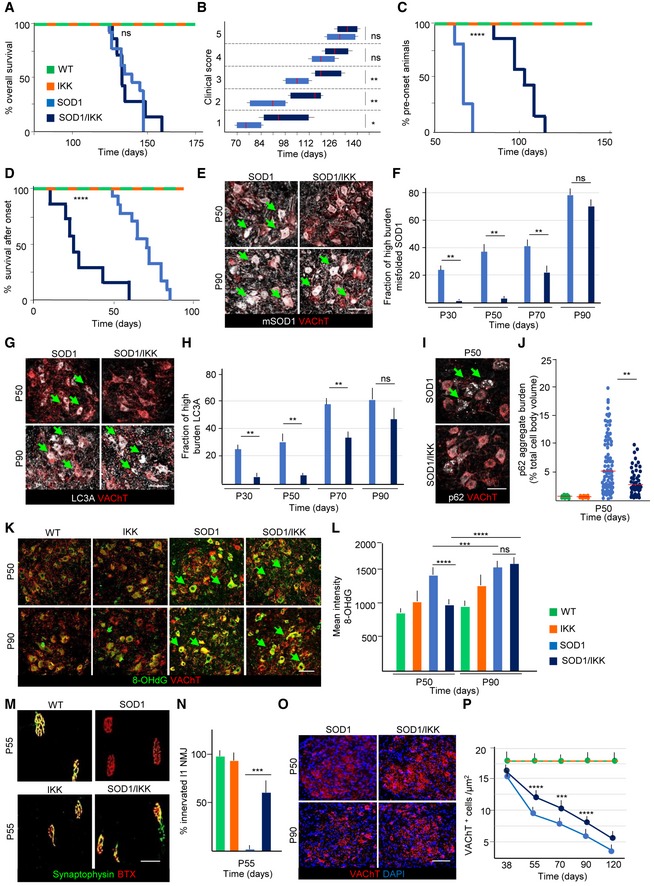
We then explored the impact of astrocytic NF‐κB activation on disease progression in SOD1/IKK mice. Although survival of SOD1/IKK and SOD1 littermates was comparable (Mantel–Cox, P = 0.5763; Fig 4A), SOD1/IKK mice reached motor impairment (Hatzipetros et al, 2015) stages 1, 2, and 3 significantly later than their SOD1 counterparts (SOD1 stayed in stage 1 from day 77–91 versus 84–122 of SOD1/IKK; P < 0.05; SOD1 stayed in stage 2 from day 84–105 versus 109–126; P < 0.05; stage 3 from day 105–119 versus 125–136; P < 0.05; Fig 4B; IKK mice displayed no motor phenotypes). However, later in disease, stages 4 and 5 were reached at comparable time points (day 133–140; Fig 4B). Notably, overall survival and clinical progression of SOD1/IKK mice continuously administered DOX (i.e., without IKK expression) was comparable to those of SOD1 mice, ruling out possible effects of transgene interference (Fig EV2A and B). We then used peak body weight to discriminate presymptomatic and progression phases (Boillée et al, 2006; Fig 4C and D). SOD1 mice had a presymptomatic phase 63–77 days long, and after onset, they kept losing body weight during a progression phase of 49–84 days. However, SOD1/IKK body weight peaked at 91–126 days (29 days later than single‐tg SOD1; P < 0.0001; Fig 4C) but then, weight loss rate was dramatically faster in SOD1/IKK than in SOD1 mice, resulting in a significantly shorter progression phase (28.5 days in SOD1/IKK compared to 67.1 for SOD1; P < 0.0001; Fig 4D). Clinical progression was slower, and survival was longer in female SOD1 and SOD1/IKK mice, but the astrocytic IKK effects were comparable to those observed in male mice of the same genotype (Fig EV2C–F). Thus, astrocytic NF‐κB displayed a beneficial effect early on and a detrimental one in the progression phase in both genders. In fact, levels of misfolded SOD1 in MNs, detected by the conformation‐specific antibody B8H10 (Gros‐Louis et al, 2010), were significantly lower in SOD1/IKK than in SOD1 littermates between P30 and P70 (fraction of high‐burden mSOD1 MN—see Materials and Methods—SOD1/IKK versus SOD1: 4.6 ± 1.2% versus 24.4 ± 3.65%; 8.5 ± 4.4% versus 38.6 ± 5.5%; 22.5 ± 5.5% versus 43.4 ± 4.7% at P30, P50, and P70, respectively; P < 0.05) but this difference disappeared at P90 (78.8 ± 8.5% versus 73.4 ± 8.2%; P > 0.05; Fig 4E and F). Likewise, the accumulation of disease‐related autophagy markers LC3A and p62 (Goode et al, 2016) was reduced in SOD1/IKK. LC3Abright MNs were fewer in SOD1/IKK than in SOD1 at P30 and at P50 (% LC3Abright MNs: 23.4 ± 2.2% versus 9.3 ± 3.8% at P30, 39.4 ± 4.5% versus 12.5 ± 3.9% in SOD1 versus SOD1/IKK, respectively; P < 0.05); this difference was reduced at P70 and was no longer significant at P90 (60.4 ± 10.2% versus 49.8 ± 13.4%; P > 0.05; Fig 4G and H). Also, the burden of p62 aggregates per MN was significantly lower in SOD1/IKK than in SOD1 MN at P50 (median [range]: 5.04%[0.14‐19.3] and 3.13%[0.1‐9.4] in SOD1 versus SOD1/IKK, respectively; P < 0.01; Fig 4I and J).
Figure 4. Prolonged NF‐κB activation in astrocytes causes a biphasic response with delayed disease onset and accelerating disease progression.
-
AKaplan–Meier curves of overall survival. No difference in survival between SOD1/IKK and SOD1 (Mantel–Cox P = 0.5763) in the prolonged activation design.
-
BTime course of the neurological score progression, showing delayed symptoms onset in SOD1/IKK mice. Data are shown as box and whiskers plot: The horizontal red lines in the middle represent median, box limits represent 10% to 90%, while left and right whisker represent min. and max. value range, respectively. Values were calculated by nonparametric Mann–Whitney test. *P ≤ 0.05; **P ≤ 0.01; ns = not significant, P > 0.05; (WT n = 3, IKK n = 10, SOD1 n = 13, SOD1/IKK n = 7).
-
CKaplan–Meier curves representing the percentage of animals in the presymtpomatic phase (based on peak weight) (Mantel–Cox ****P < 0.0001).
-
DKaplan–Meier curves representing duration of the progression phase expressed as duration of survival after onset (Mantel–Cox ****P < 0.0001; WT n = 3, IKK n = 10, SOD1 n = 13, SOD1/IKK n = 7).
-
E, FCo‐immunostaining for misfolded SOD1 and VAChT in SOD1 and SOD1/IKK at P50 and P90. Green arrows indicate mSOD1 accumulation in MN. Quantification of misfolded SOD1 burden reveals decreased in the fraction of MN with high mSOD1 burden in SOD1/IKK mice versus SOD1 and SOD1/IKK mice at P30, P50, P70 but not at P90; (n = 4). Scale bar, 40 μm.
-
G, HRepresentative images and quantification of autophagy marker LC3A in MN (identified by VAChT) in SOD1 and SOD1/IKK, showing a decrease fraction of MN with high LC3A accumulation in SOD1/IKK versus SOD1 at P30, P50, P70 but not P90. Arrows indicate LC3A aggregates accumulation in MN; (n = 4). Scale bar, 40 μm.
-
I, JImmunostaining for autophagy marker p62 and VAChT in SOD1 and SOD1/IKK at P50. Arrows show p62 buildup in MN. Distribution of p62 aggregate burden (expressed as % of p62 aggregates area/total cell body area) shows a reduced p62 aggregates burden in SOD1/IKK versus SOD1 at P50; (n = 4). Scale bar, 40 μm.
-
K, LCo‐immunostaining for 8‐hydroxydeoxyguanosine (8‐OH‐dG) and VAChT; quantification of the 8‐OH‐dG burden in MN (arrows) reveals reduced oxidative stress in SOD1/IKK versus SOD1 mice at P50 but no longer at P90; (n = 4). Scale bar, 40 μm.
-
M, NCo‐immunostaining for synaptophysin and bungarotoxin (BTX) showing denervation of l1 subcompartment of the lateral gastrocnemius in WT, IKK, SOD1, and SOD1/IKK mice at P55 (n = 4, 2 gastrocnemius per mouse). At P55, SOD1/IKK displays a significantly larger percentage of l1 NMJ still innervated compared to SOD1; (n = 4). Scale bar, 10 μm.
-
O, PQuantification of the density of MN (identified by immunostaining for VAChT and DAPI) at P38, P55, P70, P90, and P120; whereas WT and IKK mice do not display a loss of MN, SOD1 display the progressive decrease in MN in spinal cord; however, MN loss is less severe in SOD1/IKK animals at P55, P70, and P90 but not at P120; (n = 4). Scale bar, 40 μm.
Figure EV2. Time‐dependent NF‐κB activation in astrocytes differentially affects disease onset and progression.
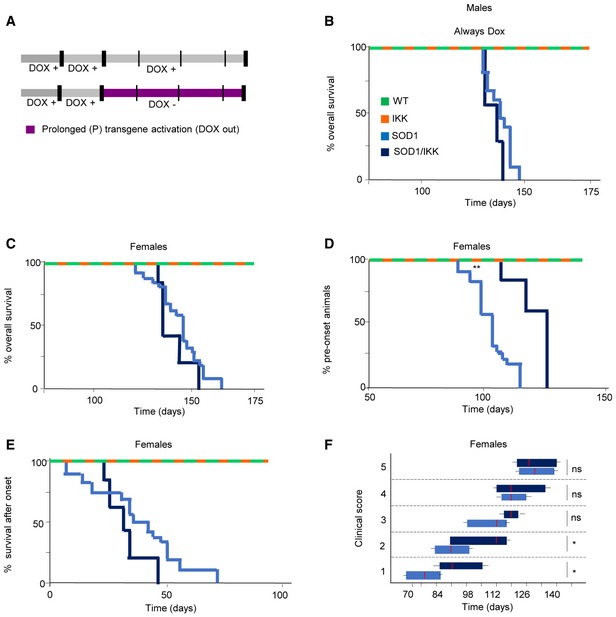
- Experimental design illustrating no transgene activation (male mice in panel B) or prolonged transgene activation (female mice in panels C–F) induced by DOX withdrawal (DOX out, purple).
- Kaplan–Meier curves of overall survival (% of alive mice over time) of male mice treated with DOX at all time, resulting in inhibition of IKK2‐CA transgene expression. No difference between the SOD1 and the SOD1/IKK mice was observed (Mantel–Cox P = 0.0612; SOD1 n = 25; SOD1/IKK n = 3).
- Overall survival depicted in a Kaplan–Meier curve of survival for female mice with prolonged activation. (Mantel–Cox P = 0.5397; SOD1 n = 18; SOD1/IKK n = 5).
- Kaplan–Meier curves representing percentage of female animals in the presymptomatic phase of ALS disease (based on peak weight); (Mantel–Cox **P = 0.0048).
- Kaplan–Meier curves representing duration of the progression phase in female mice (Mantel–Cox P = 0.2266; SOD1 n = 18; SOD1/IKK n = 5).
- Time course of the neurological score progression, showing delayed symptoms onset in female SOD1/IKK mice. Data are shown as box and whiskers plot: The horizontal red lines in the middle represent median, box limits represent 10% to 90%, while left and right whisker represent min. and max. value range, respectively. Values were calculated by nonparametric Mann–Whitney test. *P ≤ 0.05; ns = not significant P > 0.05. (Mann–Whitney score 1 *P = 0.0333; score 2 *P = 0.0433).
The production of reactive oxygen species (ROS) has been linked to MN loss in ALS (Harraz et al, 2008). We therefore evaluated the levels of oxidative damage in MN by monitoring the levels of 8‐hydroxydeoxyguanosine (8‐OH‐dG). Immunostaining for 8‐OH‐dG (displaying the cytoplasmic and nuclear pattern previously reported: Bender et al, 2013; Maity‐Kumar et al, 2015) revealed a significant increase in immunofluorescence intensity in SOD1 MNs compared with WT or with IKK mice at P50 (1,377 ± 250 a.u. integrated intensity in SOD1 versus 789 ± 13 and 964 ± 290, respectively, in WT and IKK mice; Fig 4K and L). Notably, in SOD1/IKK, 8‐OH‐dG fluorescence intensity in MN was significantly reduced compared to SOD1 at P50 (941.8 ± 16 a.u., P < 0.0001; Fig 4K and L). Interestingly, and in agreement with the other markers of disease, at P90, there was no difference between SOD1 and SOD1/IKK mice in the fraction of neurons with high 8‐OH‐dG burden (both significantly higher than in WT or IKK; 1,498 ± 250 and 15,552 ± 250 a.u. SOD1 and SOD1/IKK versus 936 ± 240 and 1,184 ± 290 in WT and IKK; P < 0.0001).
Finally, whereas in SOD1 mice, the neuromuscular junction (NMJ) in the l1 subcompartment of the lateral gastrocnemius (innervated by fast‐fatigable MNs) was totally denervated at P55 (Pun et al, 2006), in SOD1/IKK mice, vulnerable NMJ was still largely innervated (64.3 ± 5.9%, P < 0.001; Fig 4M and N). No loss of NMJ innervations was found in WT and IKK mice. In agreement with these data, SOD1 mice displayed a progressive loss of MNs in ventral spinal cord (L3‐L5) between P55 and P120 (9.2 ± 1.3 cells/μm2 at P55 and 3.6 ± 0.5 cells/μm2 at P120), whereas SOD1/IKK mice showed a significantly higher number of surviving MNs at P55 and P70 (12.1 ± 1.4 and 10 ± 1.9 cells/104 μm2, respectively; P < 0.0001 versus SOD1 at P50 and P < 0.001 at P70), but not at P90 or P120 (7.4 ± 1 and 5.3 ± 0.3 cells/104 μm2, respectively; Fig 4O and P).
These data support the view that astrocytic IKK/NF‐κB activation produces beneficial effects on multiple MN disease pathways in the early phases of the disease.
Early‐stage NF‐κB activation in astrocytes enhances beneficial microglial polarization
To explore the mechanisms underlying the differential outcome of NF‐κB activation in astrocytes, we characterized the polarization of the neuroinflammatory response. Flow cytometry of spinal cord‐isolated immune cells confirmed that microglia, defined as CD11b+CD45low‐intermediate (Solomon et al, 2006), were already upregulated in IKK and SOD1/IKK starting at P30 and P50 (respectively, 34.2 ± 5.0% and 39.8 ± 6.8% of parental at P30 and 50.25 ± 4.3% and 40.6 ± 4.4% of parental at P50) compared to WT and SOD1 littermates (at P50 19.8 ± 2.6% and 20.8 ± 1.0%, respectively, P < 0.01) but decreased at P90 in IKK and SOD1/IKK (respectively, 23.6 ± 1.6% and 24.7 ± 1.9%, Fig 5A and B) contrarily to WT or SOD1 mice. The CD11b+CD45high fraction was comparably low at P30 in all groups, but increased at P50 and P90 in IKK (from 1.2 ± 0.61% at P30 and 7.67 ± 1.68% at P50 to 13.47 ± 1.42% at P90) and SOD1/IKK (0.92 ± 0.22% and 4.25 ± 0.35% to 10.9 ± 3.69%; P < 0.0001; Fig 5A and C). Likewise, the CD11b−CD45high population increased from P30 and P50 in IKK (from 1.84 ± 0.76% at P30 to 9.4 ± 0.94% at P50) and SOD1/IKK (P < 0.001) but no further change was observed at P90 in both groups (Fig 5A and D).
Figure 5. Microglia immunophenotype characterization after IKK/NF‐κB activation in astrocytes.
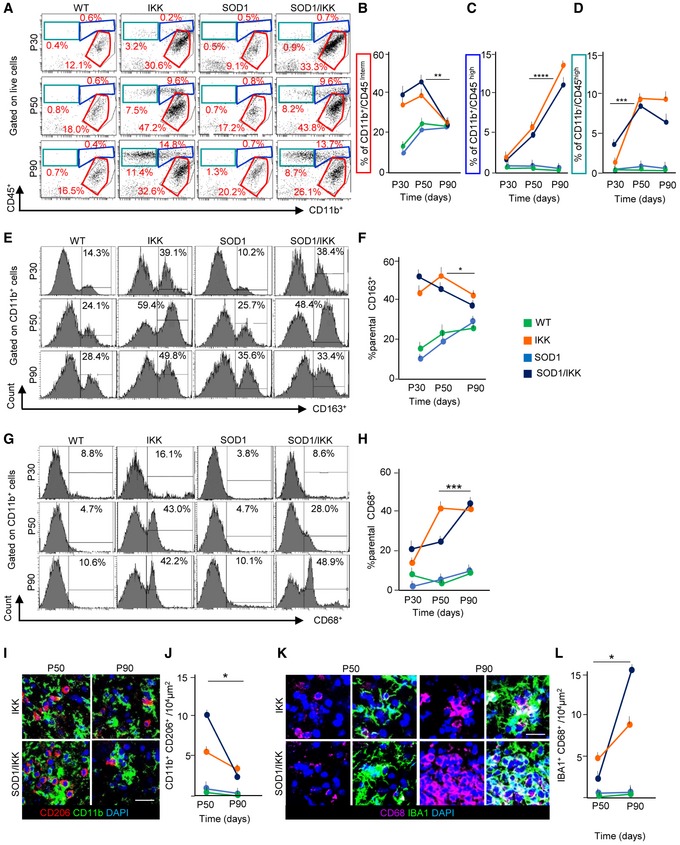
- Representative FACS dot‐plots of CD11b+ and CD45+ immune cells at P30, P50, and P90 (P30: WT n = 4, IKK n = 5, SOD1 n = 4, SOD1/IKK n = 7; P50: WT n = 4, IKK n = 6, SOD1 n = 4, SOD1/IKK n = 4; P90: WT n = 3, IKK n = 6, SOD1 n = 4, SOD1/IKK n = 5).
- Quantification of CD11b+/CD45low‐intermediate cells.
- Quantification of CD11b+/CD45high cells.
- Quantification of CD11b−/CD45+ cells.
- Histograms of CD163 expression gated on CD11b+ cells at P30, P50, and P90 (P30: WT n = 4, IKK n = 5, SOD1 n = 4, SOD1/IKK n = 7; P50: WT n = 4, IKK n = 6, SOD1 n = 4, SOD1/IKK n = 4; P90: WT n = 3, IKK n = 6, SOD1 n = 4, SOD1/IKK n = 5).
- Quantitative analysis of CD163+ cells.
- Histograms of CD68 expression gated on CD11b+ cells at P30, P50, and P90 (P30: WT n = 4, IKK n = 5, SOD1 n = 4, SOD1/IKK n = 7; P50: WT n = 4, IKK n = 6, SOD1 n = 4, SOD1/IKK n = 4; P90: WT n = 3, IKK n = 6, SOD1 n = 4, SOD1/IKK n = 5).
- Quantification of CD68+ cells.
- Co‐immunostaining of CD206 (red), CD11b (green), and DAPI (blue) in the ventral horn of IKK and SOD1/IKK spinal cord sections at P50 and P90; (n = 4).
- Quantification of CD206+/CD11b+ cell density at P50 and P90 (presented as number of cells/per area unit).
- Co‐immunostaining of CD68 (white), IBA1 (green), and DAPI (blue) in ventral horn spinal cord sections of IKK and SOD1/IKK mice; (n = 4).
- Quantification of CD68+/IBA1+ cell density at P50 and P90 expressed as number of cells/per area unit in WT, IKK, SOD1, and SOD1/IKK.
Interestingly, microglial polarization significantly changed between early and late phases: Both at P30 and at P50, IKK and SOD1/IKK spinal cord contained an abundant population of anti‐inflammatory, M2‐like CD11b+CD163+ (43.6 ± 3.1% and 52.1 ± 7.7%, 57.3 ± 3.0% and 46.6 ± 2.4% of parental at P30 and P50, respectively) that decreased at P90 (respectively, 46.3 ± 3.4% of parental, P < 0.05 versus P50 in IKK, and 33.3 ± 4.0% of parental, P < 0.05 versus P50 in SOD1/IKK mice; Fig 5E and F). Conversely, CD11b+CD68+t M1‐like microglia sharply increased in SOD1/IKK mice at P90 (from 21.3 ± 5.0% at P30 and 24.2 ± 3.8% at P50 to 47.1 ± 0.8% at P90; P < 0.0001, P50 versus P90; Fig 5G and H) but remained unchanged in IKK mice from P50 to P90 (12.2 ± 1.8% at P30, 41.7 ± 1.2% at P50 versus 39.5 ± 2.2% at P90; P > 0.05 P50 versus 90; Fig 5G and H).
We further characterized the polarization of the neuroinflammatory response separately considering CD11b+/CD45low‐intermediate and CD11b+/CD45high subsets (Fig EV3A). Notably, a large fraction of cells expressing CD163 was detected only among CD11b+/CD45low‐intermediate cells at P30 and P50, declining at P90, whereas CD11b+/CD45high cells expressed low levels of CD163 (Fig EV3A and B). On the other hand, CD11b+/CD45high represented the subset in which a strong increase in CD68 expression was seen from P30 and P50 to P90, whereas expression of CD68 on CD11b+/CD45low‐intermediate remained low and displayed a trend toward further decrease from P30 and P50 to P90 (Fig EV3C). Thus, change in polarization takes place within microglial subsets with distinct activation status (resting versus activated).
Figure EV3. Microglia immunophenotype characterization after different time points of IKK/NF‐κB activation in astrocytes.
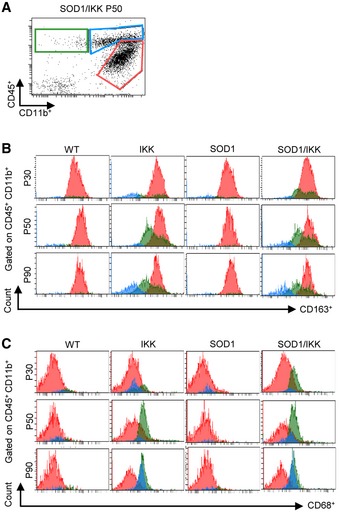
- Representative FACS dot‐plot of CD11b+ and CD45+ immune cells at P50 on which histograms in (B and C) is gated.
- Histograms of CD163 expression gated on CD11b+/CD45low‐intermediate (red), CD11b+/CD45+ (blue), and CD11b−/CD45+(green) cells at P30, P50, and P90. Distinctive CD163 expression is seen only in CD11b+/CD45low‐intermediate population and decreases from P30 and P50 to P90.
- Histograms of CD68 expression in CD11b+/CD45low‐intermediate (red), CD11b+/CD45high (blue), and CD11b−/CD45+ (green) subpopulations. Whereas CD11b+/CD45low‐intermediate express constant low levels of CD68, a strong increase in CD68 expression is detected in CD11b+/CD45high from P30, P50 to P90.
Likewise, in immunostained spinal cord sections, anti‐inflammatory, M2‐polarized CD11b+CD206+ cells strongly decreased in number from P50 to P90 (from 5.4 ± 1.4 and 10.0 ± 2.4 cells/104 μm2 in IKK and SOD1/IKK at P50 to 1.1 ± 1.0 and 0.2 ± 0.2 cells/104 μm2 in IKK and SOD1/IKK at P90, respectively; P < 0.01; Fig 5I and J). At the same time, the M1‐like IBA1+CD68+ subpopulation gets strongly upregulated (from 2.2 ± 0.5 to 15.5 ± 3.4 cells/104 μm2 in SOD1/IKK; P < 0.05, P50 versus P90; Fig 5K and L). Expression of IL1A, IL‐1β, TNF‐α, IFN‐γ, and TGFB was higher in IKK and SOD1/IKK than in WT or SOD1 mice but did not change at P50 and P90. Their expression increased later on in SOD1/IKK at P135 (Appendix Fig S4A–F). Only IL‐6 levels (Appendix Fig S4D) declined from P50 to P90.
Taken together, these data suggest that a shift in microglia activation state, from an anti‐ to pro‐inflammatory polarization status, characterizes the transition from beneficial to detrimental phases in SOD1/IKK mice.
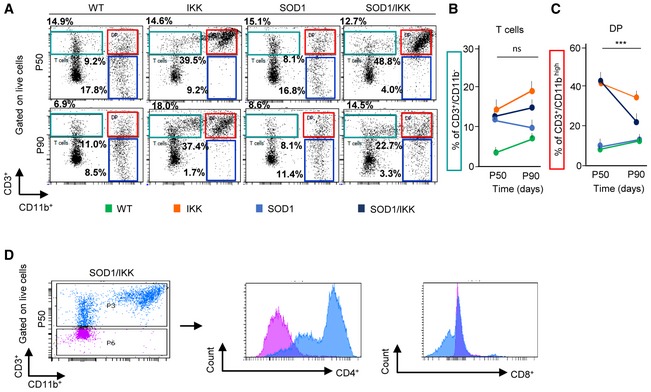
Along with microglial cells, we detected in all experimental groups a population of CD3+CD11b− lymphocytes (Fig EV4A and B) and a subset of CD3+CD11bhigh lymphocytes (Fig EV4A and C); almost all CD3+ cells were CD4+ (Fig EV4D) and only a small minority were CD8+ (Fig EV4D). Notably, whereas the CD3+CD11b− subset did not change between P50 and P90, the swap in polarization was accompanied by the distinctive loss of the CD3+CD11b+ subset of lymphocytes, which is represented by a mixed population of regulatory T cells including Th17 and NKT cells (Solomon et al, 2006), in SOD1/IKK (44.6 ± 4.2% versus 20.5 ± 3.2% P50 versus P90, P < 0.001; Fig EV4A and C) but not in IKK mice (43.4 ± 3.2% versus 33.4 ± 1.4%).
Figure EV4. Characterization of lymphocyte dynamics in lumbar spinal cord in response to NF‐κB activation in astrocytes.
-
ARepresentative FACS dot‐plot showing overall CD3+/CD11b+ population at P50 and P90 in WT, IKK, SOD1, and SOD1/IKK mice, gated on live cells.
-
B, CQuantification of (B) CD3+CD11b− cells (expressed as %; green in panel A) and (C) CD3+/CD11bhigh double‐positive populations (DP) (expressed as %; red in panel A) at P50 and P90. P50: WT n = 4, IKK n = 6, SOD1 n = 4, SOD1/IKK n = 4; P90: WT n = 3, IKK n = 6, SOD1 n = 4, SOD1/IKK n = 5. Two‐way ANOVA. Data are shown as means ± SD, ***P ≤ 0.001; ns = not significant, P > 0.05.
-
DFACS dot‐plot of CD3+/CD11b+ population at P50 in SOD1/IKK animal gated on live cells and histograms of CD4+ and CD8+ expression gated on CD3high (blue) and CD3low (purple).
Thus, astrocytic NF‐κB enhances a beneficial microglial response in the early phase of the disease contrasted by a pro‐inflammatory polarization later on (Casella et al, 2016).
Temporal dissociation of astrocytic NF‐κB effects on early and late neuroinflammatory response
We then explored the effect of astrocytic NF‐κB in the early and late phases of the disease (Fig 6A). When astrocyte NF‐κB was activated only after P80 (henceforth SOD1/IKK‐L), an accelerated rate of body weight loss culminated in a significantly shorter survival (127 days versus SOD1 median 140 days, SOD1/IKK‐L Mantel–Cox P = 0.0044; Fig 6A and B). Thus, while SOD1/IKK‐L did not differ from SOD1 mice in the time to onset (since the transgene is off before P80; Fig 6C), SOD1/IKK‐L displayed a significantly shorter progression phase than SOD1 littermates (median 45 days versus 61 days; P = 0.0024; Fig 6D) causing the earlier death. On the other hand, activating astrocytic NF‐κB between P25 and P80 (henceforth SOD1/IKK‐E) resulted in a longer SOD1/IKK‐E survival than SOD1 littermates (SOD1/IKK‐E median 149 days versus SOD1 median 140 days, Mantel–Cox P = 0.00435; Fig 6A and B). However, SOD1/IKK‐E mice showed a strongly delayed onset (median 128 days versus 70 days in SOD1; P < 0.0001; Fig 6C), followed surprisingly by an even shorter progression phase (median 21 days versus 61 days in SOD1 mice; P < 0.0001; Fig 6D). Nevertheless, the summated effects lead to a prolonged overall survival (Fig 6B). SOD1/IKK mice from which DOX was withdrawn only between P28 and P50 (SOD1/IKK‐ES; Fig 6A and B) did not differ from the SOD1 littermates in survival. Similar effects were observed in female SOD1/IKK‐E and SOD1/IKK‐L compared to female SOD1 mice: Early activation significantly prolonged presymptomatic phase and overall survival despite shortening the symptomatic phase, whereas late activation showed only a trend toward shortened symptomatic phase (Appendix Fig S5A–D).
Figure 6. Time‐dependent transgene expression allows the dissociation of onset phase from the progression phase.
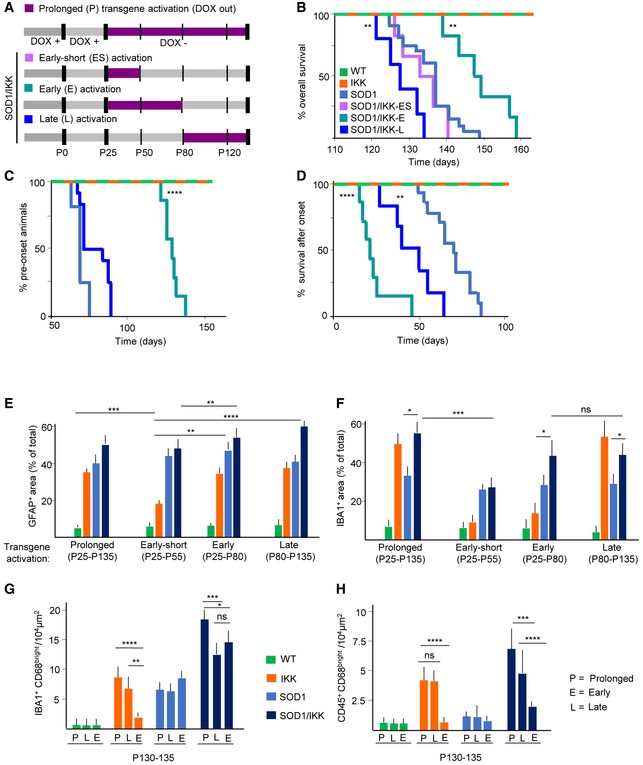
- Overall experimental design illustrating the different time windows of transgene activation induced by DOX withdrawal (DOX out, purple): prolonged (P, shown in panels E‐H), early‐short (ES; lilac), early (E; turquoise), or late (L; dark blue) as indicated.
- Kaplan–Meier curves of survival of SOD1/IKK mice in the E, ES, and L transgene activation window compared to SOD1 (light blue) mice (SOD1/IKK‐L versus SOD1: Mantel–Cox **P = 0.0044; SOD1/IKK‐E versus SOD1 and SOD1/IKK‐P (shown in Fig 4A): Mantel–Cox **P = 0.00435).
- Kaplan–Meier curves representing % of time in the preonset phase of SOD1/IKK animals in the E and L phases of transgene activation compared to SOD1 mice (light blue) (SOD1/IKK‐E versus SOD1: Mantel–Cox, ****P < 0.0001).
- Kaplan–Meier curves representing % of time in the progression phase of SOD1/IKK‐E and L compared to SOD1 mice (light blue) (SOD1/IKK‐E versus SOD1: Mantel–Cox test ****P < 0.0001; SOD1/IKK‐L versus SOD1: Mantel–Cox test **P = 0.0024).
- Quantification of astrocyte density (%GFAP+ of total area) in WT, IKK, SOD1, and SOD1/IKK activated at different stages (P, ES, E, and L); (n = 4); statistical significance is displayed for the comparison of different SOD1/IKK groups (P versus ES, E versus L).
- Quantification of microglia density (% IBA1+ of total area) in all four experimental groups activated at different stages (P, ES, E, and L); (n = 4); statistical significance is displayed for the comparison of different SOD1/IKK groups (P versus ES, E versus L) and between SOD1 and SOD1/IKK in E and L transgene activation group.
- Histograms showing number of IBA1+/CD68+ per area unit at P130‐135 in WT, IKK, SOD1, and SOD1/IKK activated at different time windows (P, L, E). (n = 4).
- Histograms representing number of CD45+/CD68 cells per area unit at P130‐135 in all genotypes activated at different time windows (P, L, E); (n = 4).
In order to provide a mechanistic interpretation of faster progression in the SOD1/IKK‐E versus SOD/IKK‐L, we analyzed the size of the astroglial and microglial populations at P130‐135. Interestingly, despite the transgene was activated at different times during the progression, at P130‐135, SOD1/IKK‐E and SOD1/IKK‐L showed the same level of astrogliosis (Fig 6E) and of microglia expansion (Fig 6F). In particular, astrocytes occupied the same area irrespectively if subject to early, late, or persistent IKK2/NF‐κB, in the SOD1, SOD1/IKK, and IKK mice; of note, in the IKK‐ES group, interrupting IKK2/NF‐κB activation allows the gliosis to revert to baseline values. Microglial expansion, on the other hand, was comparable in early‐ and late‐activated SOD1/IKK mice and was significantly larger than in the according SOD1 group (42.3 ± 9.8% and 43.2 ± 8.9% in SOD1/IKK‐E and SOD1/IKK‐L versus 28.2 ± 5.4% in the SOD1 mice, P < 0.05) and comparable to the SOD1/IKK‐P (activation from P25 on; 53.2 ± 9.9% P > 0.05; Fig 6F). However, in the ES and E group, IKK microglia density had almost reversed to the WT levels. Irrespective of when the transgene was activated, SOD1/IKK‐E and ‐L mice displayed the same extent of microglia polarization (low‐to‐undetectable numbers of CD11b+CD206+ cells [not shown] and comparable numbers of IBA1+CD68+ cells, which are significantly higher in SOD1/IKK‐P mice; Fig 6G). However, SOD1/IKK‐E and IKK‐E had, at P130‐135, a significantly decreased population of CD45+ cells compared to the according L and P group (Fig 6H), suggesting that persistence of these cells depends on the presence of IKK2‐CA expression.
Wnt5A is involved in astrocyte‐driven microglial proliferation
Since early expansion of microglial cells is a major effect of astrocytic NF‐κB, we explored possible mediators involved. We focused on WNT family members, since they are (i) targets of NF‐κB (Blumenthal et al, 2006), (ii) secreted by astrocytes (Richards et al, 2015), and (iii) induce macrophage and microglia proliferation (Sen & Ghosht, 2008; Halleskog et al, 2012).
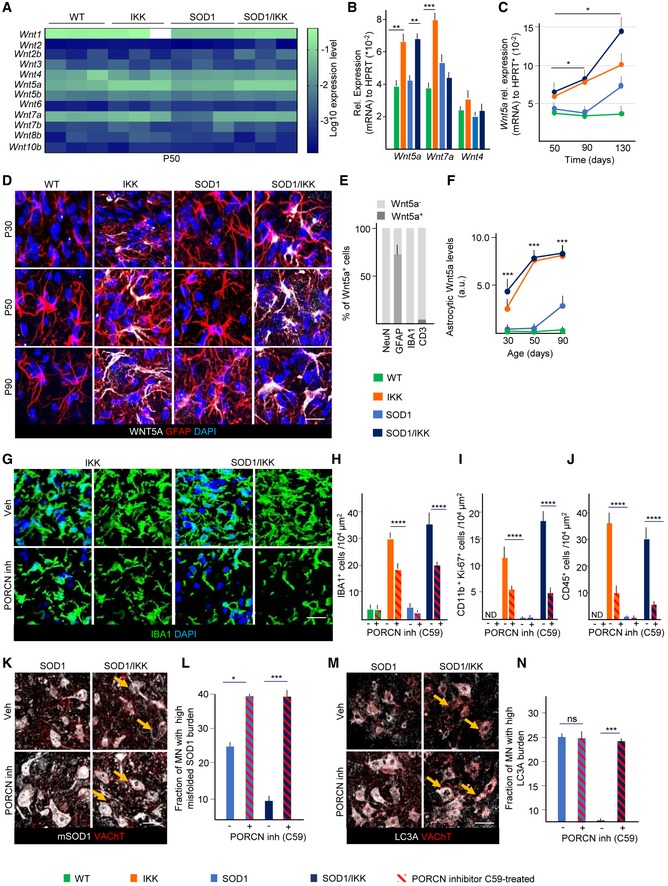
Out of 12 Wnts screened at P50, only Wnt1, Wnt4, Wnt5a, and Wnt7a were detectable (Figs 7A and B, and EV5A). Levels of Wnt4a mRNA were not different across genotypes, and levels of Wnt1 (Fig EV5A) and Wnt7a mRNA were upregulated only in IKK but unchanged or downregulated in SOD1/IKK samples, suggesting that they are not likely critical mediators of astrocytic NF‐κB activation. Only Wnt5a was significantly and equally upregulated in IKK and SOD1/IKK at P50 (152.4 ± 12.4% and 149.7 ± 6.7% for IKK and SOD/IKK versus WT, respectively; Fig 7A–C) and was also elevated later on (Fig 7C). WNT5a immunoreactivity was restricted to astrocytes (60% of astrocytes were WNT5a+, but microglia, neurons, and CD3+ cells were almost WNT5−; Fig 7D and E), whereas WNT7a was localized in a small number of round, GFAP− cells (Fig EV5B). WNT5a immunoreactivity in astrocytes was strongly upregulated in IKK and SOD1/IKK at P30, P50, and P90, but was increased in SOD1 samples only after P90 (Fig 7D and F). Therefore, WNT5a was considered as relevant candidate involved in astrocyte‐mediated microglia expansion.
Figure 7. Wnt signaling is involved in astrocyte‐driven microglia expansion after prolonged IKK activation.
-
A, BScreening of Wnt genes expression in WT, IKK, SOD1, and SOD1/IKK at P50; only Wnt1, Wnt4, Wnt5a, and Wnt7a are expressed at relevant levels (depicted in detail in panel B); (n = 3–4).
-
CProgressive increase in Wnt5a gene expression in WT, IKK, SOD1, and SOD1/IKK between P50 and P130 (relative to HPRT); (n = 3–4).
-
DCo‐immunostaining of GFAP, WNT5a, and DAPI in WT, IKK, SOD1, and SOD1/IKK over time. Scale bar, 10 μm.
-
EHistograms showing quantification of WNT5a+ cells among neuronal (NEUN), astrocytic (GFAP), microglial (IBA1), and lymphocytic (CD3) populations at P50, expressed as % of total; (n = 4).
-
FTime course of astrocytic WNT5a protein expression in WT, IKK, SOD1, and SOD1/IKK over time; (n = 4).
-
GIBA1 and DAPI immunostaining of ventral spinal cord for IKK and SOD1/IKK treated with PORCN inhibitor (P26‐P38) and vehicle‐treated (Veh) controls at P38. Scale bar, 10 μm.
-
HQuantification of microglia density (IBA1+ cells expressed as number of cells/per area unit) after PORCN inhibitor C59 treatment in WT, IKK, SOD1, and SOD1/IKK mice compared to Veh‐treated controls.
-
I>Quantification of CD11b+/KI‐67+ cell density per area unit in WT, IKK, SOD1, and SOD1/IKK mice treated with C59 PORCN inhibitor versus Veh‐treated controls.
-
JQuantification of CD45+ cell density per area unit in WT, IKK, SOD1, SOD1/IKK littermates treated with C59 PORCN inhibitor versus Veh‐treated controls.
-
KCo‐immunostaining of misfolded SOD1 (white) and VAChT (red) in SOD1 and SOD1/IKK ventral horn spinal cord sections after C59 and Veh treatment at P37. Arrows indicate misfolded SOD1 accumulation in MN. Scale bar, 40 μm.
-
LQuantification of the fraction of high mSOD burden MNs in SOD1 and SOD1/IKK mice treated with C59 and vehicle.
-
MCo‐immunostaining of LC3A and VAChT of ventral spinal cord sections of SOD1 and SOD1/IKK C59‐treated and control mice at P38. Arrows indicate LC3A‐bright MN. Scale bar, 40 μm.
-
NHistograms showing quantification of LC3A burden in SOD1 and SOD1/IKK mice treated with C59 PORCN inhibitor versus Veh.
Figure EV5. Wnt signaling is involved in astrocyte‐driven microglia expansion after IKK/NF‐κB activation in astrocytes.
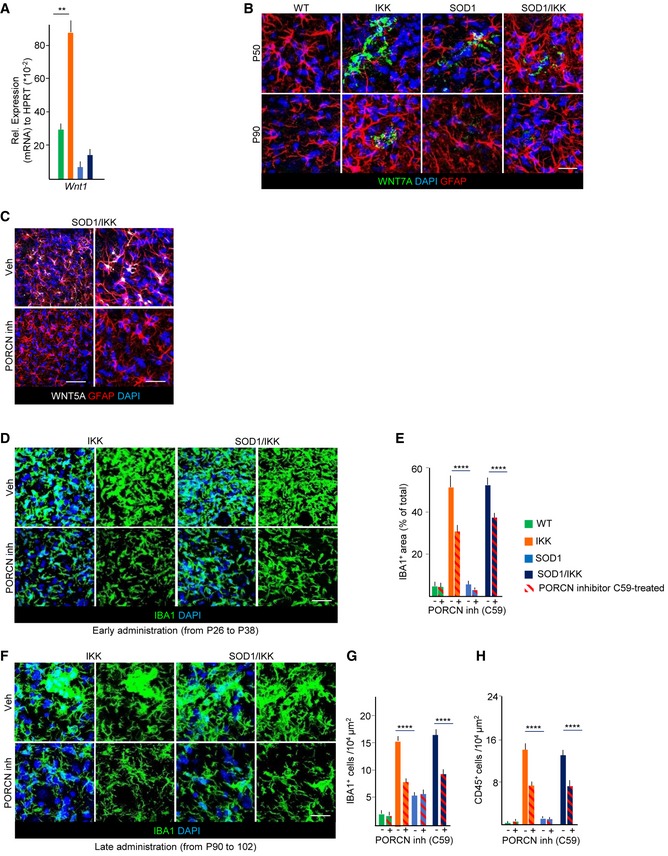
- Expression of Wnt1 on mRNA level in spinal cord of P50 mice (n = 3–4; relative to HPRT).
- Co‐immunostaining of WNT7a (green), GFAP (white), and DAPI (blue) in P50 and P90 animals of all four genotypes.
- Immunostaining for Wnt5a and GFAP in spinal cord from SOD1/IKK mice treated with vehicle or with the PORCN inhibitor C59; Wnt5a immunoreactivity is reduced to < 10% in C59‐treated compared to vehicle‐treated SOD1/IKK mice (at P38).
- High‐magnified representative pictures of IBA1+ staining in IKK and SOD1/IKK animals with either C‐59 or vehicle (Veh) treatment from P26 to P38 (early administration).
- Quantification of IBA1+ area in WT, IKK, SOD1, and SOD1/IKK animals with C‐59 or Veh treatment from P26 to P38 (% of total area).
- High‐magnified representative pictures of IBA1+ staining of IKK and SOD1/IKK, either C‐59‐ or Veh‐treated, in late administration between P90 and P102.
- Quantification of IBA1+ cells of C‐59‐ or Veh‐treated mice from P90 to P102.
- Quantification of CD45+ cells of IKK and SOD1/IKK animals treated with Veh or C‐59 from P90 to P102.
We next explored the functional role of WNT proteins, in particular WN5a molecular function (being the only one whose expression matches the IKK genotype) in the astrocytic NF‐κB‐driven neuroprotection in ALS. For this, we blocked WNT release by administering the Porcupine WNT acyltransferase inhibitor C59, 10 mg/kg daily by oral gavage (Proffitt et al, 2013; Koo et al, 2015) to P25 mice for 12 days after transgene activation before sacrifice at P38. In all C59‐treated mice, WNT5a immunoreactivity was markedly downregulated (< 10% of vehicle‐treated (Veh) SOD1/IKK; Fig EV5C). Notably, C59 administration decreased microglial density (number of cells/104 μm2: from 30.4 ± 1.8 to 18.2 ± 1.7 cells/104 μm2 in IKK mice; P < 0.001 and from 36.2 ± 6.1 to 20.2 ± 4.0 in SOD1/IKK; P < 0.0001; single optical section images Fig 7G and H) and overall IBA1+ area (30.5 ± 4.6% in IKK‐C59 versus 52.1 ± 6.5 in IKK‐Veh and 39.2 ± 4.9% in SOD1/IKK‐C59 versus 53.6 ± 3.9 in SOD1/IKK‐Veh, P < 0.0001; Fig EV5D and E). The decrease in the number of microglial cells upon Porcupine inhibitor treatment was associated with the reduction in proliferation: The number of CD11b+KI‐67+ decreased from 11.0 ± 3.0 in IKK‐Veh to 5.4 ± 0.2 in IKK‐C59 and from 18.0 ± 2.0 cells in SOD1/IKK‐Veh to 5.0 ± 1.3 in SOD1/IKK‐C59 (cells per 104 μm2; P < 0.0001; Fig 7I). Likewise, C59 administration strongly decreased the number of CD45+ (P < 0.0001; Fig 7J). The loss of IBA1+ cells and of CD45+ induced by C59 administration completely abolished the neuroprotective effect of astrocytic NF‐κB activation: In fact, whereas vehicle‐treated SOD1/IKK mice showed a significant decrease in misfolded SOD1 (Fig 7K and L) and LC3A levels (Fig 7M and N) compared to SOD1 littermates, this decrease was completely reverted by WNT inhibitor treatment.
Notably, C59 administration significantly decreased microglial density even when applied in the late phase (from P90 to P102); In fact, at P102, the number of IBA1+ cells was 7.8 ± 0.3 in IKK‐C59 versus 16.5 ± 0.7 in IKK‐Veh (Fig EV5F and G) and 9.41 ± 0.35 in SOD1/IKK‐C59 versus 15.8 ± 0.2 in SOD1/IKK‐Veh (P < 0.001; Fig EV5F and G). Likewise, the number of CD45+ cells was significantly decreased in C59‐treated IKK and SOD1/IKK mice (P < 0.0001; Fig EV5H). These data indicate the persistent role of WNT proteins in microglial proliferation, activation, and the neuroinflammatory response evoked by astrocytic IKK2/NF‐κB activation in ALS.
Pharmacological enhancement of microglial early‐stage protective effects decreases ALS disease markers
Time‐restricted astrocytic NF‐κB activation in the ALS mouse model initiates a specific neuroimmunological response that was found neuroprotective in early stages of disease progression. In order to validate this effect in an independent model system and to provide a translational perspective to our findings, we explored pharmacological approaches to modulate neuroinflammation at early stages.
In particular, we targeted the microglia‐specific (Schmöle et al, 2015) cannabinoid receptor 2 (CB2), reasoning that enhancing early microglial response pharmacologically would be beneficial, whereas suppressing it would worsen disease markers. Since the selectivity of current small molecules targeting CB2 has been debated (Soethoudt et al, 2017), we have characterized a new set of CB2 agonist and inverse agonists originating from three structurally diverse chemotypes (Table EV1). CB2 ligands RO6866945, RO689589, RO6871085 (Grether et al, 2014), and RO6851228 proved to be potent binders for mouse and human CB2 (Table EV1) with binding selectivity against CB1 (Table EV1) ranging between 44‐fold (cf. RO6871085) and 939‐fold (for RO6866945). In cAMP functional assays (Ullmer et al, 2012), RO6866945, RO6895896, and RO6871085 demonstrated to be full agonists for mouse and human CB2 with EC50 in the low nM/pM range. On the other hand, RO6851228, structurally close to RO6871085, showed inverse agonist activity (Table EV1). To assess the suitability of these CB2 ligands for targeting CB2 in the SOD1‐G93A model, physicochemical and in vitro ADME properties were profiled (Table EV2). Overall, these CB2 ligands showed suitable physicochemical properties to ensure brain penetration and they were further evaluated in vitro to assess their clearance and plasma protein‐binding (Table EV3). These studies were followed by a thorough in vivo pharmacokinetic assessment in mice (Table EV3). These data indicated that all four compounds are bioavailable and allow efficient interaction with the CB2 receptor in all relevant tissues of the SOD1 mouse if provided at 10 mg/kg i.p.
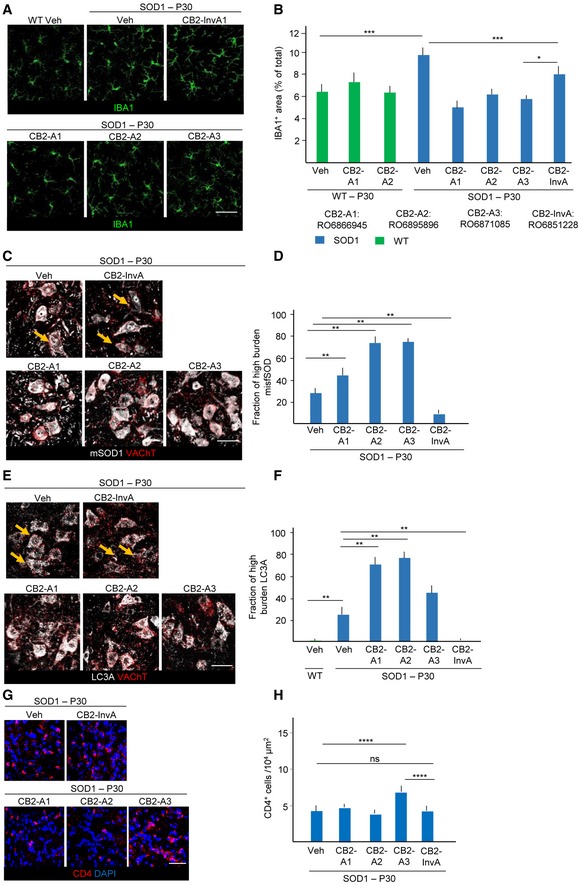
We administered the three CB2 full agonists (10 mg/kg, once daily i.p.) to SOD1 mice from P25 to P35. Microglial expansion was prevented by all three drugs (%IBA1+ area SOD1+RO6866945, RO6895896, and RO6871085, respectively, versus SOD1‐veh: 4.9 ± 0.2%, 6.0 ± 0.2%, 5.2 ± 0.3% versus 9.7 ± 0.4%; P < 0.05; Fig 8A and B), and microglial cells displayed a reduced branching. However, when applied in WT animals, RO6866945 and RO6895896 did not affect microglial size (Fig 8A and B). Conversely, when we applied the CB2 inverse agonist (which enhances cAMP signaling by blocking the constitutive Gi signaling), using the identical schedule of application (30 mg/kg, once daily i.p.), we observed a non‐significant change in overall microglial density (9.5 ± 0.3%, P > 0.05; Fig 8A and B), but a significant change in morphology, with expansion of the size and of the complexity of microglial processes (Fig 8A). In agreement with the beneficial role of early neuroinflammatory activation, levels of misfolded SOD1 were actually increased in CB2‐agonist‐treated mice (high‐burden MN fraction: 25.4 ± 5.5%, 42.3 ± 8.7%, 72.4 ± 11.3% and 69.1 ± 9.5% in vehicle, RO6866945, RO6895896, RO6871085‐treated mice, respectively; P < 0.001 versus vehicle; Fig 8C and D), and the fraction of LC3Abright MN was similarly increased (fraction of LC3Abright MN: 23.4 ± 7.7, 70.8 ± 11.2, 73.4 ± 12.4, 45.4 ± 5.6% in vehicle, RO6866945, RO6895896, RO6871085‐treated mice, respectively; P < 0.001 versus vehicle; Fig 8E and F), suggesting an overall detrimental effect of the suppression of microglial activation. On the other hand, the CB2 inverse agonist RO6851228 decreased misfolded SOD1 burden (high‐burden MN fraction: 25.4 ± 5.5% versus 10.2 ± 5.1% for vehicle or RO6851228, respectively; P < 0.04; Fig 8C and D) and of the levels of LC3A (23.4 ± 7.7 versus 11.4 ± 13.9% for vehicle or RO6851228, respectively, P < 0.05; Fig 8E and F). Since CB2 is widely expressed on T, B cells and monocytes in the peripheral immune system, we verified if treatment with CB2 agonist affected the known infiltration of CD4+ lymphocytes in the spinal cord of SOD1 mice at early stages. Notably, CB2 agonist RO6866945, RO689589, and the CB2 inverse agonist RO6851228 did not affect lymphocyte infiltration at this age, whereas the CB2 agonist RO6871085 actually increased the number of CD4+ cells in spinal cord (Fig 8G and H). Thus, effect on CD4+ infiltration was not consistently correlated with the effect of CB2 on microglia and disease markers.
Figure 8. Early‐stage modulation of microglial activation in SOD1 (G93A) animals by CB2R agonists and inverse agonist.
-
A, BImmunostaining for IBA1 of ventral horn spinal cord from WT mice treated with vehicle (Veh), SOD1 mice treated with CB2R agonists (CB2‐A1:RO6866945, CB2‐A2:RO6895896, and CB2‐A3:RO6871085), inverse agonist (CB2‐InvA:RO6851228), or Veh. Quantification of IBA1+ area reveals that, while ineffective in WT, CB2R agonists decrease the expansion of microglia, whereas CB2‐InvA only affect microglial morphology.
-
C, DBurden of misfolded SOD1 in SOD1 mice treated with CB2‐A1, A2, A3, InvA, and Veh (fraction of high‐burden MN). Treatment with CB2 agonists, which reduce microglia expansion, strongly increases misfolded SOD1 burden, whereas CB2‐InvA reduces it. Yellow arrows indicate MN with lesser accumulation of mSOD1 in the Veh‐ and CB2 InvA‐treated group.
-
E, FCo‐immunostaining for LC3A and VAChT in spinal cord SOD1 mice treated with CB2 agonists and inverse agonist and quantification (fraction of high‐burden MN). Treatment with CB2 agonists increases autophagy impairment in MN, whereas CB2‐InvA reduces it. Yellow arrows indicate MN with lesser LC3A accumulation in the Veh‐ and CB2 InvA‐treated group.
-
G, HImmunostaining of CD4 and DAPI in ventral spinal cord of SOD1 mice treated with CB2R agonists, inverse agonist (CB2‐InvA), and Veh as indicated. The number of CD4+ cells per 104 μm2 was not affected by CB2‐A1, CB2‐A2, or CB2‐InvA, although it was increased by CB2‐A3 only.
Taken together, these findings prove that early‐phase neuroimmunological response can be enhanced by appropriate pharmacological manipulations to promote beneficial ALS outcome and it is therefore a translational target for clinical intervention.
Discussion
The transcription factor NF‐κB, when activated in microglial cells, has been shown to regulate the inflammatory, neurotoxic phenotype of these cells in the symptomatic phase of ALS (Frakes et al, 2014). However, the role of NF‐κB in astrocytes over the disease course, and more broadly, its functions as modulator of the neuroimmunological response in ALS have not yet been elucidated. In the present work, we have shown that astrocytic NF‐κB regulates microglial activation and proliferation and markedly upregulates the neuroimmunological response in WT as well as in the SOD1(G93A) ALS model (although astrocytic NF‐κB may also control additional disease‐relevant pathways). Nevertheless, the consequence of such massive induction of microglia response is not obviously neurotoxic, but rather proves to be beneficial in the early presymptomatic phase (decreasing disease markers, delaying loss of motoneurons and denervation, and prolonging the presymptomatic phase) and turns detrimental in the symptomatic phase (shortening the progression phase; Fig 9). Despite endogenous astrocytic NF‐κB activation takes place in ALS (Haidet‐Phillips et al, 2011; Swarup et al, 2011; Frakes et al, 2014), the net effect has not been detected by inhibition studies (Crosio et al, 2011; Frakes et al, 2014), possibly because the endogenous early activation may take place at low levels and may be concealed by autonomous microglial events later on (Frakes et al, 2014).
Figure 9. Schematic overview of temporal control of NF‐κB activation in astrocytes affecting onset phase and disease progression.
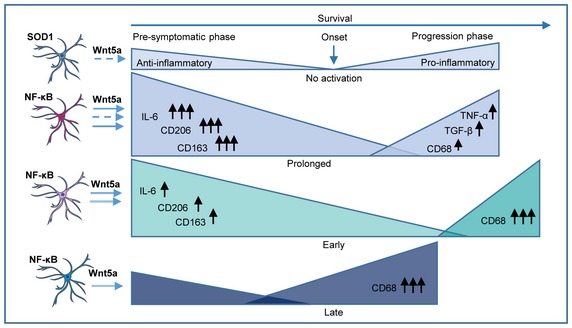
Representation of the different NF‐κB activation time windows and the critical mediators involved in the specific microglia polarization that interact with and influence the onset phase and progression phase. 1. Panel: Typical course of presymptomatic and progression phase in association with anti‐ and pro‐inflammatory microglia response in SOD1 mice without specific NF‐κB activation in astrocytes. 2. Panel: Prolonged astrocyte‐specific NF‐κB activation (P25–P135) in SOD1/IKK mice increases anti‐inflammatory microglia response (upregulation of IL‐6; CD206, CD163; primed for phagocytosis), after microglia proliferation (Wnt5a), resulting in a delayed disease onset but also changes the pro‐inflammatory response (CD68, TGF‐β, TNF‐α) that accelerates disease progression and overall survival remains unaffected. 3. Panel: Timely restricted (early) NF‐κB activation (P25–P80) prolongs presymptomatic phase (sustained by microglia proliferation—Wnt5a ‐) followed by a fast progression phase with specific microglia polarization (CD68high/CD45high). Overall survival is increased. 4. Panel: Timely restricted (late) NF‐κB activation (P80–P135) does not affect presymptomatic phase but accelerates progression phase leading to reduced overall survival.
Surprisingly, NF‐κB activation resulted in the proliferation of microglia but not in the proliferation of astrocytes themselves, but rather in their hypertrophy (astrogliosis); thus, astrocytic NF‐κB appears to regulate the relative density of these two glial populations and in particular to regulate the expansion of microglia (De Biase et al, 2017). In agreement with recent data obtained with single‐cell transcriptomics (Keren‐Shaul et al, 2017; Krasemann et al, 2017; Mathys et al, 2017), the immune cells and microglia population activated by astrocytic NF‐κB are highly complex both in composition and in evolution over time. The large majority of the immune cells expanded under astrocytic NF‐κB activation is composed by microglia, as shown by their CD11b+/IBA1+ and TMEM119+ phenotype (Satoh et al, 2016). TMEM119 is currently considered a bona fide marker of microglia even under inflammatory conditions (Zrzavy et al, 2017). However, CD11b−/CD45high clearly identify other immune cells that infiltrate the CNS (such as macrophages and monocytes) prominently at P50. The expanded microglia branch into distinct subsets, both in IKK and in SOD1/IKK mice (at P50), by expression levels of CD45 and galectin‐3/MAC‐2, suggesting that activation of astrocytic NF‐κB is sufficient to reveal a disease‐independent heterogeneity of the microglial population (as suggested by Mathys et al, 2017).
Flow cytometry and immunostaining under continuous astrocytic NF‐κB showed that a significant shift in the microglial immunophenotype takes place between P50 and P90 time points; although microglial polarization in M1 and M2 states is no longer tenable (Ransohoff, 2016), the shift may be described in broad terms as the transition of the microglial immunophenotypes from a CD163+/CD206+‐enriched state in the beneficial phase toward a CD68+, pro‐inflammatory one in the detrimental phase. Notably, the shift takes place only in the ALS mice, indicating that it does not originate from an intrinsic program driven by astrocytic NF‐κB. Both in IKK and SOD1/IKK mice, a population of CD11b+CD11c+, highlighting a class of disease‐associated microglia (DAM) (Keren‐Shaul et al, 2017; Krasemann et al, 2017), was identified. However, the substantial stability of this population between the P50 and P90 time points suggests that it is not involved in the polarization shift, although it may have significant effect later in the progression phase (Keren‐Shaul et al, 2017).
In addition to the proliferation and polarization of resident microglia, activation of astrocytic NF‐κB might also lead to the recruitment of immune cells from the periphery. In fact, peripheral immune cell contributions have been hypothesized to shape disease progression (Henkel et al, 2013). Although we identified a subset of CD11b−/CD45high cells that could be classified as infiltrating peripheral immune cells, they represented only around 7–8% at P50 and around 10% at P90 (and even less enriched at P30). In contrast, CD11b+/CD45high cells might be either infiltrating cells or activated microglia cells. However, the expression of TMEM119 and the previously reported upregulation of CD45 in microglia upon stimulation suggest that these cells too are native of the CNS and do not include large peripheral populations.
While prolonged activation of NF‐κB leads to an enhancement of both the beneficial and detrimental responses, the two phases can be dissociated by restricting the activation of NF‐κB to the presymptomatic or symptomatic phases: Activation restricted to the early phase is sufficient to prolong survival, whereas activation in the late phase boosts the inflammatory response and shortens survival, as predicted by Frakes et al, 2014; Fig 9. This lets us hypothesize that NF‐κB in astrocytes may not be involved predominantly (but not exclusively, see below) in determining the polarization but rather the expansion of the microglia, acting therefore as a quantitative but not as a qualitative regulator of the neuroimmunological response. In fact, at P120, irrespective of early or late activation of NF‐κB, the levels of CD68+ microglial population are comparable in prolonged‐, early‐, or late‐activated groups. Nevertheless, astrocytic NF‐κB seems to be necessary to recruit CD45+ cells in the late phase: In fact, at P120, CD45+ cells are decreased in early‐ (NF‐κB is off at this stage) but not in late‐activated mice, despite the two groups have the same microglial overall population. Actually, the rate of progression is slower in late‐activated than in early‐activated SOD1/IKK mice, and this effect correlates with the persistence of high levels of CD45+ cells in the latter but not in the former.
On the other hand, proliferation of microglia seems to respond strongly to NF‐κB activation both in case of early or late activation. Indeed, genetic programs for cell proliferation are a hallmark of microglial subsets in neurodegeneration (Mathys et al, 2017). We have identified Wnt5a as one of the possible mediators involved in microglial expansion: Suppression of overall Wnt secretion blocks astrocyte‐driven microglial proliferation and differentiation, leukocyte recruitment as well as any beneficial effect on disease markers. In fact, Wnt5a can drive proliferation of microglia in vitro and triggers CCL2 release which contributes to the recruitment of macrophages and lymphocytes (Richards et al, 2015). Interestingly, Wnt5a does not seem to polarize the immune phenotype per se and it has been reported to cause pro‐ or anti‐inflammatory polarization in microglia and macrophages (Halleskog et al, 2011; Halleskog & Schulte, 2013), suggesting that additional factors may determine the astrocyte‐driven activation of microglia. Since microglia depletion by CSF‐R1 inhibitor in symptomatic animals has prolonged survival in a rat model of ALS (Trias et al, 2016), manipulation of Wnt signaling may offer an additional target for controlling microglia in ALS.
If astrocyte‐specific NF‐κB activation controls microglial density, what does control the shift in microglial polarization? It is noteworthy that change in polarization takes places soon after the loss of the first population of vulnerable motoneurons at P50 (Pun et al, 2006), whereas after short‐term NF‐κB activation (P30), CD163+ cells are enriched. Therefore, the degeneration of MNs may provide the instructive signal, changing the phenotype of the neuroimmune response. In fact, exposure to apoptotic neurons is sufficient to induce a disease‐associated microglia phenotype (Krasemann et al, 2017). In addition, activation of the extra‐cerebral immune response has been shown to be a strong contributor to the neuroinflammatory process, and both monocytes (Zondler et al, 2016) and lymphocytes (Henkel et al, 2013) may provide polarization signals. Interestingly, transfer of regulatory lymphocytes from early‐stage animals to late‐stage animals has been reported to boost anti‐inflammatory polarization of microglia significantly and prolongs survival (Beers et al, 2008, 2011). Notably, we have identified a shift in lymphocytes subset, with the loss of the CD3+CD11b+ population, taking place only in SOD1/IKK mice, in correspondence to the transition between the beneficial and detrimental phases. Mechanistically, the shift from the early to the late phase does not involve significant changes in inflammatory cytokines but it is correlated to the decrease in IL‐6 levels, whose expression has been linked with anti‐inflammatory and repair‐inducing macrophages (Solomon et al, 2006; Casella et al, 2016).
Based on these data, manipulation of the neuroimmunological response for therapeutic purposes should include differential and actually opposite approaches when applied to symptomatic or presymptomatic (e.g., gene carrier) patients. Having demonstrated the therapeutic potential of enhancing the early neuroprotective inflammatory reaction, we have explored an independent application to confirm in single‐tg SOD1 mice the conceptual framework arising from astrocytic NF‐κB activation. We have also investigated a set of new small molecules highly selective for the CB2 receptor to increase or decrease microglia reactivity in vivo. CB2 agonists resulted in the decrease in beneficial microglial activation, which resulted in the worsening of disease burden in MN; on the other hand, the CB2 inverse agonist treatment caused the appearance of a highly branched microglia subtype and the significant decrease in MN disease markers. Since CB2 is expressed on B and T lymphocytes, besides monocytes and microglia (Centonze et al, 2008), we cannot exclude an impact of CB2‐targeting molecules on these cells. However, no consistent change in T lymphocytes in the spinal cord was found upon compound treatment, suggesting that even considering effects on other immune cells, microglia may be the main effector mediating protective or detrimental effects. Interestingly, CB2 agonist treatment delivered after symptom onset has been reported to prolong survival (Shoemaker et al, 2007), in agreement with the differential targeting of two distinct stages of the disease by small molecules acting on CB2. Likewise, our results suggest that the biphasic effect of cannabinoid administration (delaying onset but not affecting overall survival; Weydt et al, 2005) in ALS can be interpreted in terms of interference with the beneficial and detrimental phases of microglial activation.
Taken together, our study provides evidence that astrocytic NF‐κB may play a role in the regulation of the neuroimmunological response level in ALS and that the enhancement of the presymptomatic immune response is a viable treatment option for presymptomatic patients. However, different strategies may be required for presymptomatic and symptomatic patients, possibly via highly selective CB2‐targeting compounds.
Materials and Methods
Transgenic animal generation and triple‐transgenic mouse breeding strategy
GFAP.tTA/(tetO)7.IKK2‐CA double‐transgenic mice were previously reported (Lattke et al, 2012). To get triple‐transgenic SOD1(G93A)/GFAP.tTA/(tetO)7.IKK2‐CA mice, at first, GFAP.tTA/SOD1(G93A) mice were generated by direct crossing of GFAP.tTA mice (C57BL/6 background) with the high‐copy SOD1(G93A) mouse line (C57BL/6 background). The double‐transgenic GFAP.tTA/SOD1(G93A) mice in C57BL/6 background were then crossed to (tetO)7.IKK2‐CA mice (NMRI background; with a luciferase reporter gene regulated by the same bidirectional promoter) resulting in triple‐transgenic SOD1(G93A)/GFAP.tTA/(tetO)7.IKK2‐CA mice with defined C57BL/6:NMRI background (1:1). The breeding strategy and the resulting genotypes are reported in Fig 1. Littermates were always used as controls. Pregnant mothers and their offspring were administered with DOX (0.5 g/l; MP Biomedicals) in 1% sucrose drinking water until P20‐P25 and thereafter either no DOX (for sustained activation) or 0.1 g/l DOX until P80 (for late activation). For early or early‐short activation, DOX was withdrawn at P20‐25 and reinstated (0.1 g/l as above) from P80 or P50. Male mice were used in experiments if not otherwise stated. Mice were maintained under specific pathogen‐free conditions in the animal facility of the University of Ulm. Animals were kept in groups of 3–5 mice in a 12‐h light–dark cycle and were given ad libitum access to food and water. Mice were checked daily for the motor condition, determining end stage as the time point where animals could no longer right themselves from the back within 15–30 s (Ludolph et al, 2007). All experiments were performed in compliance with institutional guidelines (Tierforschungszentrum, Ulm) and German animal protection law and approved by Regierungspräsidium Tübingen (Tübingen, Germany).
Histology and immunofluorescence
Spinal cord samples were obtained and processed as previously reported (Saxena et al, 2013). Briefly, after perfusion‐fixation (2 ml/g cold PBS followed by 2.5 ml/g of 4% PFA), spinal cords were postfixed in 4% PFA for 18 h at 4°C, cryoprotected in 30% sucrose, embedded in OCT (TissueTek), and sectioned at 40 μm. Free‐floating sections were blocked in PBS + 3% BSA + 3% Donkey serum + 0.3% Triton and incubated with the appropriate antibodies combination (see Appendix Table S1) in the blocking buffer for 48–72 h at 4°C, followed by washing in PBS (45 min × 3) and incubation with the appropriate combination of secondary antibodies (see Appendix Table S1) for 2 h at room temperature; after washing, sections were mounted with FluoroGold mounting medium (Life Technologies). For the immunostaining of CD45, GFAP, CD4, CD169, Ki‐67, and 8‐OH‐dG, a citrate‐heat antigen retrieval was performed as previously reported (Hussaini et al, 2013). For each experimental group or time points, at least four animals were processed and analyzed.
Confocal imaging and image analysis
Confocal images were acquired using a LSM‐710 (Carl Zeiss AG) inverted microscope, fitted with a 20× air or 40× or 63× oil objective. Imaging parameters were set in order to obtain signal for the immunostained antigen > 150 while avoiding saturation in high‐intensity neurons. All images were acquired in correspondence of the gray matter of the ventral horn of the spinal cord (Fig 1F). Confocal stacks (5–9 optical sections) were collapsed in the maximum‐intensity projection, regions of interest (ROIs) were manually traced around MN (using the VAChT staining as reference), and the integrated mean gray value was obtained; fluorescence intensity was expressed in arbitrary units (a.u.) corresponding to the grayscale value (in 12‐bit images, ranging from 0 to 4,095). For the determination of “high‐burden” population of MN, we considered as threshold the value corresponding to the 75th percentile in the SOD1 mice (when compared to other genotypes) or in SOD1 mice treated with vehicle (in pharmacological experiments). The percentage of MN with values above the threshold was then computed for each experimental group (as previously reported by Saxena et al, 2013). For the quantification of p62 burden, the cytoplasm area of individual MN was determined by manually tracing the cellular contour (using VAChT as reference and excluding the nucleus); for the quantification of p62 aggregates burden, the images were thresholded (to separate the dimmer diffuse soluble p62 staining from the bright p62 aggregates) and the cumulative area of p62 aggregates was computed; p62 burden was then quantified as the ratio between the area occupied by the p62 aggregates and the area of the cytoplasm. For the study of denervation, the l1 subcompartment was identified based on anatomical landmarks (Goode et al, 2016). Innervated NMJs were defined for > 70% coverage of postsynaptic plaques by presynaptic terminals. For the cell density quantification, the ratio between total cell number, based on co‐localization with the marker of interest and DAPI staining, and total area was considered. Threshold of brightness was prefixed. The quantification of the fraction of area occupied by GFAP+, IBA1+, or IgG structures was performed as previously reported (Saxena et al, 2013); briefly, artifact‐free ROI was considered in the ventral horn, and for each, we computed the ratio between the area displaying GFAP or Iba1 immunostaining above a set intensity threshold and the total area of the ROI. For quantitative analysis, a minimum of 8–10 artifact‐free sections per mouse were analyzed. For the BSCB disruption analysis, we considered a region of interest in the ventral spinal cord. We traced the total length of vessels in the ROI, identified by collagen‐IV+ staining and thereafter we traced the length of vascular segments in which the claudin‐5 ribbon appeared disrupted or fragmented (“gaps”) and computed the ratio between the cumulative gaps length along claudin‐5 ribbons and the total length of the vessels.
Microglia and lymphocytes isolation
Microglia and lymphocytes were isolated according to a modified version of a protocol previously described (Cardona et al, 2006). Briefly, mice were perfused 30 ml of cold PBS, and lumbar spinal cord was quickly dissected, minced, and incubated in 10% collagenase D (Roche), 20% dispase II (Roche), DNaseI (Roche), and TLCK (Sigma) at 37°C for 1 h. After protease neutralization, the suspension was centrifuged (400 g, 5 min), filtered through a nylon strainer, and dissociated further. The cell suspension was layered on a 37–30–70% Percoll gradient and centrifuged (800 g, 45 min). Microglia and other immune cells were recovered at the 30% interface.
Flow cytometry
Staining for flow cytometry was performed in PBS + 5% FCS; details of the conjugated antibodies are provided in the Appendix Table S1. Flow cytometry was performed with the FACSCanto II BD, and the analysis was performed using BD FACSDiva software. Electronic gates were set on live cells by a combination of forward/side scatter and Sytox Blue. To classify CD45 population identified by flow cytometry, we used the arbitrary nomenclature high/low intermediate to discriminate the different populations. By immunostaining, we preferred to use positive/negative (+/−).
RNA extraction and gene expression quantification
RNA was extracted from the lumbar part of the spinal cord with the Peqlab peqGOLD TriFast kit (#30‐2010), and cDNA was synthesized with the Roche Transcriptor High‐Fidelity cDNA Synthesis Kit (#05081955001) according to manufacturer's instructions. This assay was performed in the Roche LightCycler 480 with the LightCycler 480 Probe Master (#04707494001) according to manufacturer's instructions. Primers are listed in Appendix Table S2.
Western blot
Western blot was performed as previously reported (Baumann et al, 2007). Details of the antibodies are reported in Appendix Table S1. The chemiluminescence signal was detected on X‐ray films (Fuji); films were scanned and mean gray value was quantified with ImageJ.
Body weight and clinical assessment
Body weight for all four genotypes was obtained every 3 days. Clinical score was evaluated according to Hatzipetros et al (2015). End stage was determined as the time point where animals could no longer right themselves from the back within 15–30 s (Ludolph et al, 2007).
Wnt inhibitor C59 administration
The Porcupine inhibitor C59 was suspended in PBS + 5% Tween‐80 + 5% PEG‐400 and was administered to P25 or P90 mice (prolonged activation cohort) of all four genotypes via oral gavage (10 mg/kg) for 12 days.
In vitro pharmacology
Ligand‐binding assays were performed with membranes prepared from cells expressing human CB2 or CB1 or mouse CB2 receptors using [3H]‐CP55940 (Perkin Elmer) as radioligand. Ki values were calculated from a single experiment using triplicates of 10 different concentrations of compound as previously reported (Ullmer et al, 2012). cAMP assays were performed using CHO cells stably expressing human CB2 or CB1 or mouse CB2 receptors, as previously described (Ullmer et al, 2012). Efficacies are expressed in % relative to 1 μM CP55940.
Physicochemical and in vitro ADME properties
PAMPA (parallel artificial membrane permeability assay) was performed as previously reported (Kansy et al, 1998). Microsomal clearance was performed as previously reported (Di et al, 2012). Plasma protein‐binding potential was assessed as previously reported (Zamek‐Gliszczynski et al, 2011) using diazepam as reference. The determination of unbound compound was performed on Teflon equilibrium dialysis plate and cellulose membranes (12–14 kDa cut‐off; HT‐Dialysis, Gales Ferry, Connecticut).
In vivo pharmacokinetics and pharmacology
C57Bl/6 mice were used to study the pharmacokinetics of CB2 ligands after p.o., i.v. and i.p. administration. To verify the results for i.p. administration 120‐min postinjection, plasma, brain, and spleen samples were collected and subjected to exposure measurements. For pharmacology experiments, 10 mg/kg of the three CB2 agonists RO6866945, RO6895896, and RO6871085 and 30 mg/kg of the CB2 inverse agonist RO6851228 (microsuspension in 1% Tween‐80 in 0.9% NaCl preserved with 0.2% parabens) were administered daily i.p.
Statistical analysis
One‐way ANOVA with Bonferroni correction for multiple comparisons was applied for the comparison of multiple groups. Two‐way ANOVA and nonparametric statistical analysis for the comparison of multiple groups with various conditions were applied. Survival analysis was performed using the Mantel–Cox statistical test. Statistical analysis was performed with the Prism software (GraphPad). All values are expressed as mean ± SD unless otherwise indicated.
Author contributions
Experiments were designed and planned by FR, BB, NOA, CS, AT, TW, TMB, and AL. The majority of the experiments were performed by NOA, CS, FOH, LT, and QL; AT was involved in the FACS analysis. Pharmacological development of CB2R‐targeting compounds was performed by JF, CR, IK, and CU; medicinal chemistry was performed by UG, AK, MN, SR, MR‐E; pharmacokinetics experiments were performed by GO; and drug formulation was performed by BR The manuscript was prepared by FR, BB, NOA, CS, TW, TMB, and AL.
Conflict of interest
The authors declare that they have no conflict of interest.
Supporting information
Appendix
Expanded View Figures PDF
Table EV1
Table EV2
Table EV3
Source Data for Appendix
Review Process File
Source Data for Figure 1
Acknowledgements
The technical assistance of Clive Brealey, Heinz Gutzwiller, Hua Lv, Virginie Micallef, Anja Osterwald, Isabelle Parrilla, Björn Wagner, Petra Weihrich, and Elisabeth Zirwes is greatly acknowledged. The authors wish to thank prof. Frank Kirchhoff for the use of the Zeiss LSM710 confocal microscope and Prof. Anita Ignatius for the use of the histology facility. F.R. is supported by the Synapsis Foundation (CH) and F.R. and T.W. by the SFB1149; Danger Response, Disturbance Factors and Regenerative Potential after Acute Trauma; funded by the German Research Foundation (DFG, grants A03, B05) and by the Ulm University Baustein program. The present work was supported in part by a grant from F. Hoffmann‐La Roche and by the Ministry of Science, Research and the Arts, Baden‐Wuerttemberg (Sonderlinie Neuroinflammation; to T.W., A.L. and B.B.).
The EMBO Journal (2018) 37: e98697
[The copyright line of this article was changed on 8 June 2018 after original online publication.]
See also: https://doi.org/10.15252/embj.2018100130 (August 2018)
Contributor Information
Thomas Wirth, Email: thomas.wirth@uni-ulm.de.
Francesco Roselli, Email: francesco.roselli@uni-ulm.de.
Bernd Baumann, Email: bernd.baumann@uni-ulm.de.
References
- Baumann B, Wagner M, Aleksic T, Von Wichert G, Weber CK, Adler G, Wirth T (2007) Constitutive IKK2 activation in acinar cells is sufficient to induce pancreatitis in vivo . J Clin Invest 117: 1502–1513 [DOI] [PMC free article] [PubMed] [Google Scholar]
- Beers DR, Henkel JS, Zhao W, Wang J, Appel SH (2008) CD4+ T cells support glial neuroprotection, slow disease progression, and modify glial morphology in an animal model of inherited ALS. Proc Natl Acad Sci USA 105: 15558–15563 [DOI] [PMC free article] [PubMed] [Google Scholar]
- Beers DR, Henkel JS, Zhao W, Wang J, Huang A, Wen S, Liao B, Appel SH (2011) Endogenous regulatory T lymphocytes ameliorate amyotrophic lateral sclerosis in mice and correlate with disease progression in patients with amyotrophic lateral sclerosis. Brain 134: 1293–1314 [DOI] [PMC free article] [PubMed] [Google Scholar]
- Bender A, Desplats P, Spencer B, Rockenstein E, Adame A, Elstner M, Laub C, Mueller S, Koob AO, Mante M, Pham E, Klopstock T, Masliah E (2013) TOM40 mediates mitochondrial dysfunction induced by α‐synuclein accumulation in Parkinson's disease. PLoS ONE 8: e62277 [DOI] [PMC free article] [PubMed] [Google Scholar] [Retracted]
- Bennett ML, Bennett FC, Liddelow SA, Ajami B, Zamanian JL, Fernhoff NB, Mulinyawe SB, Bohlen CJ, Adil A, Tucker A, Weissman IL, Chang EF, Li G, Grant GA, Hayden Gephart MG, Barres BA (2016) New tools for studying microglia in the mouse and human CNS. Proc Natl Acad Sci USA 113: E1738–E1746 [DOI] [PMC free article] [PubMed] [Google Scholar]
- Blumenthal A, Ehlers S, Lauber J, Buer J, Lange C, Goldmann T, Brandt E, Reiling N (2006) The Wingless homolog WNT5A and its receptor Frizzled‐5 regulate inflammatory responses of human mononuclear cells induced by microbial stimulation. Blood 108: 965–973 [DOI] [PubMed] [Google Scholar]
- Bogie JF, Boelen E, Louagie E, Delputte P, Elewaut D, van Horssen J, Hendriks JJ, Hellings N (2018) CD169 is a marker for highly pathogenic phagocytes in multiple sclerosis. Mult Scler 24: 290–300 [DOI] [PubMed] [Google Scholar]
- Boillée S, Yamanaka K, Lobsiger CS, Copeland NG, Jenkins NA, Kassiotis G, Kollias G, Cleveland DW (2006) Onset and progression in inherited ALS determined by motor neurons and microglia. Science 312: 1389–1392 [DOI] [PubMed] [Google Scholar]
- Brambilla R, Persaud T, Hu X, Karmally S, Shestopalov VI, Dvoriantchikova G, Ivanov D, Nathanson L, Barnum SR, Bethea JR (2009) Transgenic inhibition of astroglial NF‐κB improves functional outcome in experimental autoimmune encephalomyelitis by suppressing chronic central nervous system inflammation. J Immunol 182: 2628–2640 [DOI] [PMC free article] [PubMed] [Google Scholar]
- Cardona AE, Huang D, Sasse ME, Ransohoff RM (2006) Isolation of murine microglial cells for RNA analysis or flow cytometry. Nat Protoc 1: 1947–1951 [DOI] [PubMed] [Google Scholar]
- Casella G, Garzetti L, Gatta AT, Finardi A, Maiorino C, Ruffini F, Martino G, Muzio L, Furlan R (2016) IL4 induces IL6‐producing M2 macrophages associated to inhibition of neuroinflammation in vitro and in vivo . J Neuroinflammation 13: 139 [DOI] [PMC free article] [PubMed] [Google Scholar]
- Centonze D, Battistini L, Maccarrone M (2008) The endocannabinoid system in peripheral lymphocytes as a mirror of neuroinflammatory diseases. Curr Pharm Des 14: 2370–23742 [DOI] [PubMed] [Google Scholar]
- Chiu IM, Chen A, Zheng Y, Kosaras B, Tsiftsoglou SA, Vartanian TK, Brown RH Jr, Carroll MC (2008) T lymphocytes potentiate endogenous neuroprotective inflammation in a mouse model of ALS. Proc Natl Acad Sci USA 105: 17913–17918 [DOI] [PMC free article] [PubMed] [Google Scholar]
- Colombo E, Farina C (2016) Astrocytes: key regulators of neuroinflammation. Trends Immunol 37: 608–620 [DOI] [PubMed] [Google Scholar]
- Crosio C, Valle C, Casciati A, Iaccarino C, Carrì MT (2011) Astroglial inhibition of NF‐κB does not ameliorate disease onset and progression in a mouse model for amyotrophic lateral sclerosis (ALS). PLoS ONE 6: e17187 [DOI] [PMC free article] [PubMed] [Google Scholar]
- De Biase LM, Schuebel KE, Fusfeld ZH, Jair K, Hawes IA, Cimbro R, Zhang HY, Liu QR, Shen H, Xi ZX, Goldman D, Bonci A (2017) Local cues establish and maintain region‐specific phenotypes of basal ganglia microglia. Neuron 95: 341–356.e6 [DOI] [PMC free article] [PubMed] [Google Scholar]
- Di L, Keefer C, Scott DO, Strelevitz TJ, Chang G, Bi YA, Lai Y, Duckworth J, Fenner K, Troutman MD (2012) Mechanistic insights from comparing intrinsic clearance values between human liver microsomes and hepatocytes to guide drug design. Eur J Med Chem 57: 441–448 [DOI] [PubMed] [Google Scholar]
- Frakes AE, Ferraiuolo L, Haidet‐Phillips AM, Schmelzer L, Braun L, Miranda CJ, Ladner KJ, Bevan AK, Foust KD, Godbout JP (2014) Microglia induce motor neuron death via the classical NF‐κB pathway in amyotrophic lateral sclerosis. Neuron 81: 1009–1023 [DOI] [PMC free article] [PubMed] [Google Scholar]
- Garbuzova‐Davis S, Haller E, Saporta S, Kolomey I, Nicosia SV, Sanberg PR (2007) Ultrastructure of blood‐brain barrier and blood‐spinal cord barrier in SOD1 mice modeling ALS. Brain Res 1157: 126–1237 [DOI] [PubMed] [Google Scholar]
- Garbuzova‐Davis S, Hernandez‐Ontiveros DG, Rodrigues MC, Haller E, Frisina‐Deyo A, Mirtyl S, Sallot S, Saporta S, Borlongan CV, Sanberg PR (2012) Impaired blood‐brain/spinal cord barrier in ALS patients. Brain Res 1469: 114–128 [DOI] [PubMed] [Google Scholar]
- Goode A, Butler K, Long J, Cavey J, Scott D, Shaw B, Sollenberger J, Gell C, Johansen T, Oldham NJ (2016) Defective recognition of LC3B by mutant SQSTM1/p62 implicates impairment of autophagy as a pathogenic mechanism in ALS‐FTLD. Autophagy 12: 1094–1104 [DOI] [PMC free article] [PubMed] [Google Scholar]
- Grether U, Kimbara A, Nettekoven M, Ricklin F, Roever S, Rogers‐Evans M, Rombach D, Schulz‐Gasch T, Westphal M (2014) Preparation of pyridine‐2‐carboxamides useful as CB2 agonists. WO2014086805A1
- Gros‐Louis F, Soucy G, Larivière R, Julien JP (2010) Intracerebroventricular infusion of monoclonal antibody or its derived Fab fragment against misfolded forms of SOD1 mutant delays mortality in a mouse model of ALS. J Neurochem 113: 1188–1199 [DOI] [PubMed] [Google Scholar]
- Haidet‐Phillips AM, Hester ME, Miranda CJ, Meyer K, Braun L, Frakes A, Song S, Likhite S, Murtha MJ, Foust KD (2011) Astrocytes from familial and sporadic ALS patients are toxic to motor neurons. Nat Biotechnol 29: 824–828 [DOI] [PMC free article] [PubMed] [Google Scholar]
- Halleskog C, Mulder J, Dahlström J, Mackie K, Hortobágyi T, Tanila H, Kumar Puli L, Färber K, Harkany T, Schulte G (2011) WNT signaling in activated microglia is proinflammatory. Glia 59: 119–131 [DOI] [PMC free article] [PubMed] [Google Scholar]
- Halleskog C, Dijksterhuis JP, Kilander MBC, Becerril‐Ortega J, Villaescusa JC, Lindgren E, Arenas E, Schulte G (2012) Heterotrimeric G protein‐dependent WNT‐5A signaling to ERK1/2 mediates distinct aspects of microglia proinflammatory transformation. J Neuroinflammation 9: 111 [DOI] [PMC free article] [PubMed] [Google Scholar]
- Halleskog C, Schulte G (2013) WNT‐3A and WNT‐5A counteract lipopolysaccharide‐induced pro‐inflammatory changes in mouse primary microglia. J Neurochem 125: 803–808 [DOI] [PubMed] [Google Scholar]
- Harraz MM, Marden JJ, Zhou W, Zhang Y, Williams A, Sharov VS, Nelson K, Luo M, Paulson H, Schöneich C, Engelhardt JF (2008) SOD1 mutations disrupt redox‐sensitive Rac regulation of NADPH oxidase in a familial ALS model. J Clin Invest 118: 659–670 [DOI] [PMC free article] [PubMed] [Google Scholar]
- Hatzipetros T, Kidd JD, Moreno AJ, Thompson K, Gill A, Vieira FG (2015) A quick phenotypic neurological scoring system for evaluating disease progression in the SOD1‐G93A mouse model of ALS. J Vis Exp 104: e53257–e53257 [DOI] [PMC free article] [PubMed] [Google Scholar]
- Hayden MS, Ghosh S (2012) NF‐κB, the first quarter‐century: remarkable progress and outstanding questions. Genes Dev 26: 203–234 [DOI] [PMC free article] [PubMed] [Google Scholar]
- Henkel JS, Beers DR, Wen S, Rivera AL, Toennis KM, Appel JE, Zhao W, Moore DH, Powell SZ, Appel SH (2013) Regulatory T‐lymphocytes mediate amyotrophic lateral sclerosis progression and survival. EMBO Mol Med 5: 64–79 [DOI] [PMC free article] [PubMed] [Google Scholar]
- Hussaini SM, Jun H, Cho CH, Kim HJ, Kim WR, Jang MH (2013) Heat‐induced antigen retrieval: an effective method to detect and identify progenitor cell types during adult hippocampal neurogenesis. J Vis Exp 78: e50769 [DOI] [PMC free article] [PubMed] [Google Scholar]
- Ilieva H, Polymenidou M, Cleveland DW (2009) Non‐cell autonomous toxicity in neurodegenerative disorders: ALS and beyond. J Cell Biol 187: 761–772 [DOI] [PMC free article] [PubMed] [Google Scholar]
- Kansy M, Senner F, Gubernator K (1998) Screening: parallel artificial membrane permeation assay in the description of passive absorption processes. J Med Chem 41: 1007–1010 [DOI] [PubMed] [Google Scholar]
- Keren‐Shaul H, Spinrad A, Weiner A, Matcovitch‐Natan O, Dvir‐Szternfeld R, Ulland TK, David E, Baruch K, Lara‐Astaiso D, Toth B, Itzkovitz S, Colonna M, Schwartz M, Amit I (2017) A unique microglia type associated with restricting development of Alzheimer's disease. Cell 169: 1276–1290.e17 [DOI] [PubMed] [Google Scholar]
- Koo BK, van Es JH, van den Born M, Clevers H (2015) Porcupine inhibitor suppresses paracrine Wnt‐driven growth of Rnf43;Znrf3 ‐mutant neoplasia. Proc Natl Acad Sci USA 112: 7548–7550 [DOI] [PMC free article] [PubMed] [Google Scholar]
- Krasemann S, Madore C, Cialic R, Baufeld C, Calcagno N, El Fatimy R, Beckers L, O'Loughlin E, Xu Y, Fanek Z, Greco DJ, Smith ST, Tweet G, Humulock Z, Zrzavy T, Conde‐Sanroman P, Gacias M, Weng Z, Chen H, Tjon E et al (2017) The TREM2‐APOE pathway drives the transcriptional phenotype of dysfunctional microglia in neurodegenerative diseases. Immunity 47: 566–581.e9 [DOI] [PMC free article] [PubMed] [Google Scholar]
- Lattke M, Magnutzki A, Walther P, Wirth T, Baumann B (2012) Nuclear Factor B activation impairs ependymal ciliogenesis and links neuroinflammation to hydrocephalus formation. J Neurosci 32: 11511–11523 [DOI] [PMC free article] [PubMed] [Google Scholar]
- Lattke M, Reichel SN, Magnutzki A, Abaei A, Rasche V, Walther P, Calado DP, Ferger B, Wirth T, Baumann B (2017) Transient IKK2 activation in astrocytes initiates selective non‐cell‐autonomous neurodegeneration. Mol Neurodegener 12: 16 [DOI] [PMC free article] [PubMed] [Google Scholar]
- Ludolph AC, Bendotti C, Blaugrund E, Hengerer B, Löffler JP, Martin J, Meininger V, Meyer T, Moussaoui S, Robberecht W (2007) Guidelines for the preclinical in vivo evaluation of pharmacological active drugs for ALS/MND: report on the 142nd ENMC international workshop. Amyotroph Lateral Scler 8: 217–223 [DOI] [PubMed] [Google Scholar]
- Maity‐Kumar G, Thal DR, Baumann B, Scharffetter‐Kochanek K, Wirth T (2015) Neuronal redox imbalance results in altered energy homeostasis and early postnatal lethality. FASEB J 29: 2843–2858 [DOI] [PubMed] [Google Scholar]
- Mathys H, Adaikkan C, Gao F, Young JZ, Manet E, Hemberg M, De Jager PL, Ransohoff RM, Regev A, Tsai LH (2017) Temporal tracking of microglia activation in neurodegeneration at single‐cell resolution. Cell Rep 21: 366–380 [DOI] [PMC free article] [PubMed] [Google Scholar]
- Nikolakopoulou AM, Dutta R, Chen Z, Miller RH, Trapp BD (2013) Activated microglia enhance neurogenesis via trypsinogen secretion. Proc Natl Acad Sci USA 110: 8714–8719 [DOI] [PMC free article] [PubMed] [Google Scholar]
- Proffitt KD, Madan B, Ke Z, Pendharkar V, Ding L, Lee MA, Hannoush RN, Virshup DM (2013) Pharmacological inhibition of the Wnt acyltransferase PORCN prevents growth of WNT‐driven mammary cancer. Cancer Res 73: 502–507 [DOI] [PubMed] [Google Scholar]
- Pun S, Santos AF, Saxena S, Xu L, Caroni P (2006) Selective vulnerability and pruning of phasic motoneuron axons in motoneuron disease alleviated by CNTF. Nat Neurosci 9: 408–419 [DOI] [PubMed] [Google Scholar]
- Raasch J, Zeller N, van Loo G, Merkler D, Mildner A, Erny D, Knobeloch KP, Bethea JR, Waisman A, Knust M, Del Turco D, Deller T, Blank T, Priller J, Brück W, Pasparakis M, Prinz M (2011) IkappaB kinase 2 determines oligodendrocyte loss by non‐cell‐autonomous activation of NF‐kappaB in the central nervous system. Brain 134: 1184–1198 [DOI] [PMC free article] [PubMed] [Google Scholar]
- Ransohoff RM (2016) A polarizing question: do M1 and M2 microglia exist? Nat Neurosci 19: 987–991 [DOI] [PubMed] [Google Scholar]
- Richards MH, Narasipura SD, Kim S, Seaton MS, Lutgen V, Al‐Harthi L (2015) Dynamic interaction between astrocytes and infiltrating PBMCs in context of neuroAIDS. Glia 63: 441–451 [DOI] [PMC free article] [PubMed] [Google Scholar]
- Satoh J, Kino Y, Asahina N, Takitani M, Miyoshi J, Ishida T, Saito Y (2016) TMEM119 marks a subset of microglia in the human brain. Neuropathology 36: 39–49 [DOI] [PubMed] [Google Scholar]
- Saxena S, Roselli F, Singh K, Leptien K, Julien JP, Gros‐Louis F, Caroni P (2013) Neuroprotection through excitability and mTOR required in ALS motoneurons to delay disease and extend survival. Neuron 80: 80–96 [DOI] [PubMed] [Google Scholar]
- Schmöle AC, Lundt R, Gennequin B, Schrage H, Beins E, Krämer A, Zimmer T, Limmer A, Zimmer A, Otte DM (2015) Expression analysis of CB2‐GFP BAC transgenic mice. PLoS ONE 10: e0138986 [DOI] [PMC free article] [PubMed] [Google Scholar]
- Sen M, Ghosht G (2008) Transcriptional outcome of Wnt‐Frizzled signal transduction in inflammation: evolving concepts. J Immunol 181: 4441–4445 [DOI] [PubMed] [Google Scholar]
- Shoemaker JL, Seely KA, Reed RL, Crow JP, Prather PL (2007) The CB2 cannabinoid agonist AM‐1241 prolongs survival in a transgenic mouse model of amyotrophic lateral sclerosis when initiated at symptom onset. J Neurochem 101: 87–98 [DOI] [PMC free article] [PubMed] [Google Scholar]
- Soethoudt M, Grether U, Fingerle J, Grim TW, Fezza F, de Petrocellis L, Ullmer C, Rothenhäusler B, Perret C, van Gils N (2017) Cannabinoid CB2 receptor ligand profiling reveals biased signalling and off‐target activity. Nat Commun 8: 13958 [DOI] [PMC free article] [PubMed] [Google Scholar]
- Solomon JN, Lewis CA, Ajami B, Corbel SY, Rossi FM, Krieger C (2006) Origin and distribution of bone marrow‐derived cells in the central nervous system in a mouse model of amyotrophic lateral sclerosis. Glia 53: 744–753 [DOI] [PubMed] [Google Scholar]
- Swarup V, Phaneuf D, Dupré N, Petri S, Strong M, Kriz J, Julien JP (2011) Deregulation of TDP‐43 in amyotrophic lateral sclerosis triggers nuclear factor κB‐mediated pathogenic pathways. J Exp Med 208: 2429–2447 [DOI] [PMC free article] [PubMed] [Google Scholar]
- Tan J, Town T, Mullan M (2000) CD45 inhibits CD40L‐induced microglial activation via negative regulation of the Src/p44/42 MAPK pathway. J Biol Chem 275: 37224–37231 [DOI] [PubMed] [Google Scholar]
- Trias E, Ibarburu S, Barreto‐Núñez R, Babdor J, Maciel TT, Guillo M, Gros L, Dubreuil P, Díaz‐Amarilla P, Cassina P (2016) Post‐paralysis tyrosine kinase inhibition with masitinib abrogates neuroinflammation and slows disease progression in inherited amyotrophic lateral sclerosis. J Neuroinflammation 13: 177 [DOI] [PMC free article] [PubMed] [Google Scholar]
- Ullmer C, Zoffmann S, Bohrmann B, Matile H, Lindemann L, Flor PJ, Malherbe P (2012) Functional monoclonal antibody acts as a biased agonist by inducing internalization of metabotropic glutamate receptor 7. Br J Pharmacol 167: 1448–1466 [DOI] [PMC free article] [PubMed] [Google Scholar]
- Weydt P, Hong S, Witting A, Möller T, Stella N, Kliot M (2005) Cannabinol delays symptom onset in SOD1 (G93A) transgenic mice without affecting survival. Amyotroph Lateral Scler Other Motor Neuron Disord 6: 182–184 [DOI] [PubMed] [Google Scholar]
- Zamek‐Gliszczynski MJ, Ruterbories KJ, Ajamie RT, Wickremsinhe ER, Pothuri L, Rao MVS, Basavanakatti VN, Pinjari J, Ramanathan VK, Chaudhary AK (2011) Validation of 96‐well equilibrium dialysis with non‐radiolabeled drug for definitive measurement of protein binding and application to clinical development of highly‐bound drugs. J Pharm Sci 100: 2498–2507 [DOI] [PubMed] [Google Scholar]
- Zondler L, Müller K, Khalaji S, Bliederhäuser C, Ruf WP, Grozdanov V, Thiemann M, Fundel‐Clemes K, Freischmidt A, Holzmann K, Strobel B, Weydt P, Witting A, Thal DR, Helferich AM, Hengerer B, Gottschalk KE, Hill O, Kluge M, Ludolph AC et al (2016) Peripheral monocytes are functionally altered and invade the CNS in ALS patients. Acta Neuropathol 132: 391–411 [DOI] [PubMed] [Google Scholar]
- Zrzavy T, Hametner S, Wimmer I, Butovsky O, Weiner HL, Lassmann H (2017) Loss of “homeostatic” microglia and patterns of their activation in active multiple sclerosis. Brain 140: 1900–1913 [DOI] [PMC free article] [PubMed] [Google Scholar]
Associated Data
This section collects any data citations, data availability statements, or supplementary materials included in this article.
Supplementary Materials
Appendix
Expanded View Figures PDF
Table EV1
Table EV2
Table EV3
Source Data for Appendix
Review Process File
Source Data for Figure 1