

Abstract
Adrenal Cortex Carcinoma (ACC) is an aggressive tumour with poor prognosis. Common alterations in patients include constitutive WNT/β-catenin signalling and overexpression of the growth factor IGF2. However, the combination of both alterations in transgenic mice is not sufficient to trigger malignant tumour progression, suggesting that other alterations are required to allow development of carcinomas. Here, we have conducted a study of publicly available gene expression data from three cohorts of ACC patients to identify relevant alterations. Our data show that the histone methyltransferase EZH2 is overexpressed in ACC in the three cohorts. This overexpression is the result of deregulated P53/RB/E2F pathway activity and is associated with increased proliferation and poorer prognosis in patients. Inhibition of EZH2 by RNA interference or pharmacological treatment with DZNep inhibits cellular growth, wound healing and clonogenic growth and induces apoptosis of H295R cells in culture. Further growth inhibition is obtained when DZNep is combined with mitotane, the gold-standard treatment for ACC. Altogether, these observations suggest that overexpression of EZH2 is associated with aggressive progression and may constitute an interesting therapeutic target in the context of ACC.
Introduction
Adrenocortical carcinoma (ACC) is a rare tumour with an incidence of 0.5–2 new cases per million per year. However it is associated with poor prognosis. Half of the patients present with metastatic disease at diagnosis, which results in 5-year survival rates of 16–47%. Clinical management of ACC relies on surgical resection of the primary tumour and mitotane treatment alone or in combination with chemotherapy. However it is still ineffective in treating patients with metastases (1). It is thus essential to identify the causes of malignant progression in order to develop more effective therapeutic strategies.
Molecular analyses have shown that the two most frequent alterations in ACC are overexpression of IGF2 and constitutive activation of the Wnt/β-catenin signalling pathway (2,3). Using transgenic mouse models, we have shown that constitutive activation of β-catenin was sufficient to induce the development of benign tumours but not malignant progression (4). In contrast, overexpression of Igf2 alone had no oncogenic effect and only moderately accelerated tumour development in mice with constitutive β-catenin activation (5,6). This was consistent with the low efficacy of therapeutic strategies targeting IGF receptor in the context of ACC (7). Further alterations are thus required to allow malignant progression in adrenal cortex cancer.
Deregulation of epigenetic factors is frequently involved in tumour progression. This includes alteration of DNA methylation profiles, histone post-translational modifications (acetylation, methylation) and regulation by small and large non-coding RNAs that result in broad deregulations of gene expression. A number of studies have focused on the potential involvement of DNA methylation or deregulation of miRNA expression in ACC (reviewed in (8)). However, the potential role of factors controlling histone methylation has never been evaluated. In this article, we performed a screen of histone methyltransferases, demethylases and associated factors (9) in publicly available transcriptome data from ACC patients. We identified the methyl transferase EZH2 as the most deregulated histone modifier in adrenal cortex cancer. We show that overexpression of EZH2 is associated with tumour proliferation and poor prognosis in ACC patients. Conversely, inhibition of EZH2 by RNA interference or pharmacological treatment with DZNep inhibits cellular growth, wound healing and clonogenic growth and induces apoptosis of H295R cells in culture. These observations suggest that EZH2 may be involved in the progression of ACC and may constitute an interesting therapeutic target in the context of these devastating tumours.
Results
In order to identify novel contributors to adrenal cortex carcinoma progression, we conducted a retrospective analysis of publicly available micro-array data from Cochin and Michigan ACC patients’ cohorts. Expression levels of a list of 58 histone modifying epigenetic factors (Supplementary Material, Fig. S1) were evaluated in ACC compared with normal adrenals (NAds) and adrenocortical adenomas in both cohorts. In this screen, EZH2 was the most significantly deregulated factor (Supplementary Material, Fig. S1), showing up-regulation in carcinomas compared with NAds and adenomas in both Cochin and Michigan cohorts (Fig. 1A). Overexpression of EZH2 in adrenal cortex carcinomas was further confirmed by RTqPCR (Fig. 1B) and western-blot analyses on a small independent cohort of 7 ACA and 7 ACC from the COrtico- et MEdullo-surrénale Tumeurs Endocrines (COMETE) network (Fig. 1C). EZH2 is the catalytic core protein in the Polycomb Repressor Complex 2 (PRC2), which catalyses the trimethylation of histone H3 lysine 27 (H3K27me3) and mediates silencing of its target genes (10). EZH2 expression is elevated in advanced prostate cancer (11), aggressive and metastatic breast cancer (12) and in most solid tumours and haematologic malignancies (13). This overexpression is often correlated with advanced stages of cancer and poor prognosis, which suggests that increased expression of EZH2 could be involved in progression of ACC. Interestingly, there was a significant correlation between EZH2 accumulation and expression of both Ki67 and PCNA in ACC patients of Cochin and Michigan cohorts, which was further supported by analysis of mRNAseq data from ACC patients enrolled in the The Cancer Genome Atlas (TCGA) programme (Fig. 1D). High EZH2 expression was also significantly associated with poor overall survival in Cochin and TCGA cohorts when analyzed as a continuous variable (Cochin: P = 0,0022, hazard ratio (HR) = 2.27, 95% CI = 1.34–3.84; Michigan: P = 0.12, HR = 1.61, 95% CI = 0.89–2.93; TCGA: p = 2.1 × 10⁻⁹, HR = 3.07, 95% CI = 2.01–4.7) or after separation of ACC in three equivalent groups of high, medium and low EZH2 expression, even though low and medium expression groups did not separate for Michigan and TCGA cohorts (Fig. 1E). The association of EZH2 overexpression with prognosis was further confirmed by the observation of significantly higher expression of EZH2 (Supplementary Material, Fig. S2) and enrichment of EZH2/EED/PRC2 oncogenic gene signatures (MSigDB C6 signature) in the C1A group of poor prognosis (14) when compared with C1B (Supplementary Material, Fig. S3). Altogether, these observations suggested that EZH2 overexpression could be involved in the establishment of an aggressive tumour phenotype in the context of ACC.
Figure 1.
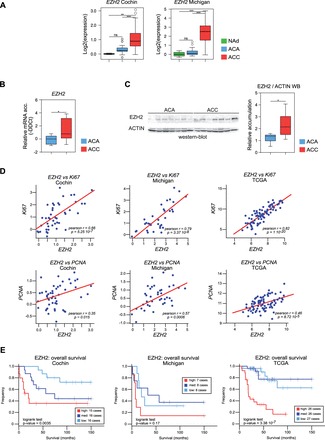
EZH2 is upregulated and associated with aggressive ACC in patients. (A) Expression levels of EZH2 in patients. Boxplots represent the expression levels of EZH2 in NAd (green), ACA (blue) and ACC (red), from two independent cohorts (Cochin and Michigan). (B) Expression of EZH2 in an independent group of patients. mRNA accumulation of EZH2 was evaluated by RTqPCR in 7 ACA and 7 ACC from the COMETE network. (C) EZH2 protein is overexpressed in ACC. Accumulation of EZH2 protein was evaluated by western blot in 7 ACA and 7 ACC from the COMETE network. (D)EZH2 expression is correlated with Ki67 and PCNA. Pearson correlation between log2 values of EZH2 expression and expression of Ki67 and PCNA genes in ACC from Cochin, Michigan and TCGA cohorts. P, P-value; r, Pearson correlation coefficient. (E) EZH2 overexpression is associated with poor prognosis. Graphs show Kaplan-Meier estimates of overall survival for patients with ACC, as a function of EZH2 expression (divided as high, medium and low). The P-value of the log-rank test for differences between survival curves is shown.
Although the locus encoding EZH2 is amplified in a number of cancers, there was no evidence for correlation between copy numbers and EZH2 expression in ACC (Supplementary Material, Fig. S4). Activating mutations of EZH2 have been described in B-cell lymphomas (15,16). However, there were no such alterations in Cochin and TCGA cohorts of ACC patients ((17) and Cbioportal). This suggested that increased accumulation of EZH2 in ACC could rely on its transcriptional control. EZH2 expression is normally repressed by the P53/RB pathway (18,19). Consequently, inactivation of this pathway is associated with EZH2 overexpression in cancer. Consistent with this, ACC patients with inactivating mutations/deletions in TP53 or RB1 showed significantly higher EZH2 expression in both Cochin and TCGA cohorts (Fig. 2A). E2F transcription factors that are inhibited by RB (20), are stimulators of cell proliferation and positive regulators of EZH2 expression (19). In humans, E2Fs are encoded by eight different genes (21,22). Analysis of their expression showed significant up-regulation of E2F1 and E2F8 in ACC from both Cochin and Michigan Cohorts (Fig. 2B and Supplementary Material, Fig. S5). Interestingly, expression levels of E2F1 and E2F8 were very significantly correlated with EZH2 expression in ACC from Cochin, Michigan and TCGA cohorts (Fig. 2C and Supplementary Material, Fig. S6). This suggested that E2F1 and eight could be positive regulators of EZH2 expression in ACC. To test this hypothesis, we decided to knockdown expression of both E2Fs in human ACC H295R cell lines. For this, H295R cells were transfected with siRNAs targeting EZH2, E2F1 or E2F8 alone or a combination of E2F1 and E2F8 siRNAs (Fig. 2D). As expected EZH2 siRNAs induced a 40% reduction in both EZH2 mRNA and EZH2 protein accumulation (Fig. 2D). Transfection of E2F1 and E2F8 siRNAs inhibited accumulation of their respective targets both at the mRNA (Supplementary Material, Fig. S7) and protein levels (Fig. 2D), whereas combination of both siRNAs resulted in simultaneous down-regulation of both targets to about 50% of their control levels (Supplementary Material, Fig. S7). Interestingly, knockdown of E2F1 resulted in a mild reduction in the accumulation of EZH2 mRNA (Fig. 2D). Although the knockdown of E2F8 alone had no effect on EZH2 accumulation, the combination of both E2F1 and E2F8 siRNAs was associated with a 40% reduction in both mRNA and protein accumulation, which was comparable with the effect of EZH2 siRNA (Fig. 2D). Altogether, these experiments suggested that E2Fs positively controlled EZH2 expression in H295R cells. Even though E2F8 was described as a repressor of E2F1 target genes (22), there was no increase in EZH2 expression following E2F8 knockdown (Fig. 2D). To further establish a role of E2Fs in controlling EZH2 expression in H295R cells, we performed chromatin immunoprecipitation (ChIP) experiments with E2F1 and E2F8 antibodies. Consistent with knockdown experiments, ChIP analyses showed that E2F1, but not E2F8 was markedly enriched on EZH2 regulatory regions (Fig. 2E). This suggested that E2F1, but not E2F8 played a direct role in controlling EZH2 expression. We thus concluded that EZH2 expression was downstream of the P53/RB/E2F pathway in ACC.
Figure 2.
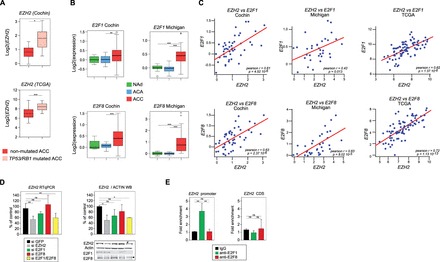
Expression of EZH2 is downstream of P53/RB/E2F in ACC. (A) EZH2 expression is higher in patients with inactivating mutations in TP53/RB1. Patients from Cochin and TCGA cohorts were separated in two groups based on the presence or absence of inactivating mutations in either TP53 or RB1 and relative expression levels of EZH2 were calculated from micro-array and RNA seq data. Significance of the differential expression was evaluated by Student’s t test. (B) E2F1 and E2F8 are up-regulated in ACC. Boxplots represent the expression levels of E2F1 and E2F8 in NAd (green), ACA (blue) and ACC (red), from two independent cohorts (Cochin and Michigan) (C) Expression of EZH2 is correlated with expression of E2F1 and E2F8. Pearson correlation between log2 values of EZH2 expression and expression of E2F1 and E2F8 genes in ACC from Cochin, Michigan and TCGA cohorts. P, P-value; r, Pearson correlation coefficient. (D) Effect of E2F1 and E2F8 knockdown on EZH2 expression in H295R cells. H295R cells were transfected with siRNAs targeting GFP (negative control), EZH2, E2F1, E2F8 or both E2F1 and E2F8. After 5 days, expression levels of EZH2, E2F1 and E2F8 were determined by RTqPCR (EZH2, left panel) and western blot (EZH2, E2F1, E2F8, right panel). Bars represent the mean of at least four experiments performed in triplicate ± SD. (E) Analysis of E2F1 and E2F8 recruitment on EZH2 promoter. Recruitment of E2F1 and E2F8 on EZH2 promoter in H295R cells was evaluated by ChIP with E2F1 and E2F8 antibodies. Bars represent the mean of RTqPCR quantification of three independent ChIP experiments ± SD. These were obtained with primers within EZH2 promoter, surrounding four putative E2F response elements (EZH2 promoter) (19) or with primers within EZH2 coding region (negative control).
Both EZH2 and E2Fs have been associated with cell proliferation. Consistent with a role of EZH2 in stimulating proliferation of adrenocortical cells, gene set enrichment analysis (GSEA) showed a very robust association between EZH2-correlated genes and both cell cycle and DNA replication pathways in ACC patients from Cochin, Michigan and TCGA cohorts (Fig. 3A and Supplementary Material, Fig. S8). To confirm this, we evaluated H295R cell growth after siRNA-mediated knockdown of EZH2. For this, H295R cells were transfected with three different EZH2 siRNAs and cell growth was calculated after 5 days in culture. As expected, the three siRNAs induced a robust reduction in EZH2 protein accumulation (Fig. 3B and Supplementary Material, Fig. S9A), which was associated with a significant reduction in total H3K27me3 levels for two of them (Fig. 3B and Supplementary Material, Fig. S9A), consistent with EZH2 activity within PRC2 complex. Interestingly, this was correlated with a 40% reduction in H295R cells growth after 5 days, which suggested that EZH2 was involved in controlling proliferation/apoptosis in ACC cell lines (Fig. 3B). Consistent with a role of E2F1 in stimulating EZH2 expression, knockdown of E2F1 alone or in combination with E2F8 also reduced H295R cell growth (Fig. 3C). However, isolated E2F8 knockdown also showed an effect on cell growth (Fig. 3C), even though it had no effect on EZH2 expression (Fig. 2D) or E2F1 expression (Supplementary Material, Fig. S7).
Figure 3.
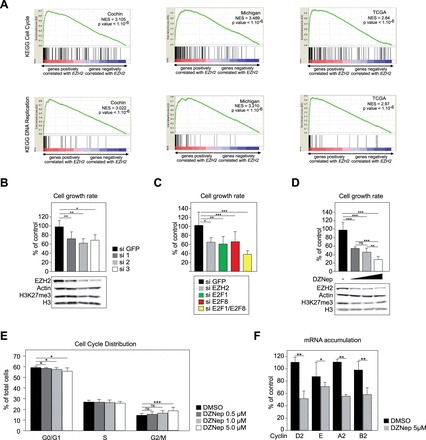
EZH2 overexpression is associated with ACC cell growth. (A) Overexpression of EZH2 is associated with cell cycle and DNA replication in ACC patients. GSEAs show a strong association between EZH2 overexpression and both cell cycle and DNA replication KEGG pathways in patients from Cochin, Michigan and TCGA cohorts. NES, normalized enrichment score. (B) siRNA-mediated knockdown of EZH2 reduces H295R cell growth. H295R cells were transfected with siRNAs targeting GFP (si GFP, negative control) or three different siRNAs targeting EZH2 (Si 1/2/3). Cell growth rate (top panel) was evaluated by counting live cells 5 days after transfection. Bottom panel shows corresponding accumulation of EZH2, Actin, H3K27me3 and histone H3, analysed by western blot. (C) siRNA-mediated knockdown of E2Fs reduces H295R H295R cell growth. H295R cells were treated as in Figure 2D and cell growth rate was determined 5 days after transfection. (D) Pharmacological inhibition of EZH2 with DZNep in H295R cells. H295R cells were treated with DMSO or increasing amounts of DZNep (0.5, 1.0 and 5.0 µM) for 5 days. Cell growth rate was then evaluated by counting live cells (top panel). Bottom panel shows corresponding accumulation of EZH2, Actin, H3K27me3 and histone H3, analysed by western blot. (E) DZNep treatment partially blocks H295R cells in G2/M. H295R cells were treated as in D and trypsinized after 5 days. They were then incubated with propidium iodide and analysed by flow cytometry to establish their distribution in the different phases of the cell cycle. Bars represent the mean of three independent experiments performed in triplicate ± SD. (F) DZNep treatment inhibits expression of Cyclins. H295R cells were treated with 5 µM DZNep for 5 days and expression of Cyclin D2, E, A2 and B2 was evaluated by RTqPCR. Bars represent the mean of at least four experiments performed in triplicate ± SD. Statistical analysis was performed by Student’s t test. In A-C, Growth rates are shown relative to control (si GFP) transfected cells and represent the mean of at least four experiments ± SD.
To further evaluate the role of EZH2 in H295R cells homeostasis, we elected to use DZNep, a pharmacological inhibitor that circumvents the toxicity resulting from transfection of siRNAs. As expected (23), treatment with DZNep inhibited EZH2 expression and total H3K27me3 accumulation (Fig. 3D and Supplementary Material, Fig. S9B). This was also associated with a dose-dependent decrease in cell growth, which was inhibited by 70% for the highest dose that we evaluated (Fig. 3D). A similar effect of DZNep was also observed in SW13 cells, a highly undifferentiated ACC cell line (24) (Supplementary Material, Fig. S10). In H295R cells, growth inhibition was associated with a partial block in the G2/M phase of the cell cycle and a concomitant reduction in the number of cells in the G0/G1 phase (Fig. 3E). RT-qPCR analysis further showed a significant decrease in expression of Cyclin D2, E A2 and B2 in response to 5 µM DZNep (Fig. 3F).
The potential role of EZH2 in aggressive behaviour of ACC cells in culture was further suggested by a 40% inhibition in their wound healing capacity after treatment with 5 µM DZNep (Fig. 4A). This treatment was also associated with a complete absence of clonogenic growth in soft agar, suggesting that inhibition of EZH2 restored anoikis in H295R cells (Fig. 4B). This also increased apoptosis by 50% (Fig. 4C), which was associated with increased Caspase 3 activity (Fig. 4D) and decreased expression of anti-apoptotic factors BCL2, BCL-XL and BIRC5 (Fig. 4E). Interestingly, Z-VAD-FMK, a pan-Caspase inhibitor, almost completely reversed the inhibitory effect of DZNep on H295R cells growth (Fig. 4F), which confirmed the contribution of apoptosis to the cytostatic effect of DZNep. Altogether, these experiments suggested that inhibition of EZH2 could represent a potentially interesting option in the context of ACC.
Figure 4.
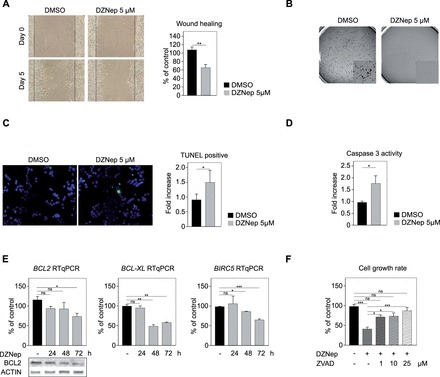
EZH2 inhibition inhibits aggressive behaviour and induces apoptosis of H295R cells. (A) DZNep inhibits wound healing capacity. A confluent monolayer of H295R cells was wounded with a tip and cells were allowed to heal the wound. Size of the wound was measured after 5 days in culture in the presence of DMSO or 5 µM DZNep. Left panel shows a typical experiment. Right panel: wound healing was quantified as a percentage of control DMSO-treated cells healing capacity. (B) DZNep blocks clonogenic growth in soft agar. Diluted H295R cells (1.104/well) were allowed to form clones in soft agar for 15 days. DZNep treatment completely prevented clonogenic growth. (C) DZNep induces apoptosis. H295R cells were grown on coverslips and treated with DMSO or 5 µM DZNep for 48 h. Apoptosis was detected by TUNEL staining (left panel). TUNEL-positive cells in DZNep treatment group are expressed relative to control group. (D) DZNep activates Caspase 3. H295R cells were treated for 48 h with DMSO or 5 µM DZNep and Caspase 3 activity was determined by a colorimetric assay. (E) DZNep inhibits expression of anti-apoptotic factors. H295R cells were treated for 24, 48 and 72 h with DMSO or 5 µM DZNep and expression of BCL2, BCL-XL and BIRC5 was evaluated by RTqPCR. Bars represent the mean of 4 experiments performed in triplicate ± SD. Bottom panels show corresponding accumulation of BCL2, and ACTIN analyzed by western-blot in the same experiments. (F) Z-VAD-FMK reverses the growth inhibitory effect of DZNep. H295R cells were treated with DZNep alone or a combination of DZNEp and increasing doses of Z-VAD-FMK, a pan-caspase inhibitor, for 5 days. Cell growth rate was then evaluated by counting live cells. Bars represent the mean of four experiments performed in triplicate ± SD.
To further evaluate the therapeutic potential of EZH2 inhibition, we evaluated its effect in combination with mitotane, the gold-standard treatment of ACC. We elected to use 5 µM DZNep (40% growth rate reduction, Fig. 5A) and two doses of mitotane that induced 35 (10 µM) and 60% (20 µM) growth rate reductions (Fig. 5A). Interestingly, the combination of 10 µM mitotane and 5 µM DZNep induced a more significant growth rate reduction than 10 µM mitotane alone (Fig. 5A), which did not result from decreased EZH2 expression following mitotane treatment (Supplementary Material, Fig. S11). The combined effect was more evident when cells were treated with 20 µM mitotane and 5 µM DZNep. This induced an 80% reduction in cell growth rate, which was significantly different from the effect of 20 µM mitotane or 5 µM DZNep alone (Fig. 5A). In contrast with 10 µM treatment, high concentration of mitotane was associated with significantly decreased EZH2 expression (Supplementary Material, Fig. S11). Altogether, these experiments showed that the combination of DZNep and mitotane was more efficient than one or the other compound alone to inhibit growth of H295R cells. We then evaluated their capacity to induce apoptosis by measuring Caspase 3 activity (Fig. 5B). Mitotane or DZNep significantly induced apoptosis. However, in contrast with their effect on proliferation, the combination of both compounds was not more efficient than DZNep alone to induce apoptosis (Fig. 5B).
Figure 5.
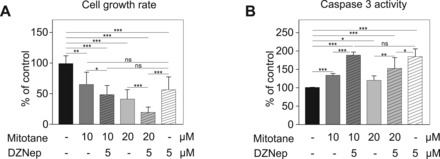
DZNep and mitotane have additive effects on H295R growth inhibition. (A) Effect of DZNep and mitotane on H295R cell growth. H295R cells were grown for 5 days with DMSO, Mitotane alone (10 or 20 µM), DZNep alone (5 µM) or a combination of 10 or 20 µM Mitotane with 5 µM DZNep. Cell growth rate was then evaluated by counting live cells. (B) Effect of DZNep and mitotane on Caspase 3 activity. H295R cells were treated as in A and Caspase 3 activity was evaluated by a colorimetric assay. In A-B, Growth rates and Caspase 3 activity are shown relative to control DMSO-treated cells and represent the mean of at least four experiments ± SD.
Discussion
In this article, we show that histone epigenetic regulators and in particular EZH2, are strongly deregulated in adrenal cortex carcinomas compared with adenomas and NAds. EZH2 encodes the methyl transferase of Polycomb Repressive Complex 2, which catalyses the tri-methylation of lysine 27 of histone H3. Our data show that it is overexpressed and correlated with proliferation and poor prognosis in ACC. We further show that siRNA-mediated knockdown and pharmacological inhibition of EZH2 are associated with decreased proliferation and aggressiveness as well as increased apoptosis of H295R ACC cells in culture.
To the best of our knowledge, this is the first demonstration of the role of a histone-modifying enzyme in adrenal tumourigenesis. EZH2 overexpression is associated with tumour progression in a variety of cancers including solid tumours and haematologic neoplasia (13). Our data strongly suggest that this is also the case in ACC, which is further supported by data from Sidhu’s group (25). Interestingly, DZNep treatment of H295R cells induces a concomitant decrease in EZH2 expression and H3K27me3 accumulation, which is correlated with cell growth inhibition and induction of apoptosis. We further show that combination of DZNep with Mitotane, the gold-standard treatment for ACC is more effective at reducing H295R cell growth than either compound alone. Although DZNep is also capable of inhibiting methyl-transferases other than EZH2 (23), our preliminary data using GSK126, a highly selective EZH2 inhibitor (26), show a comparable effect on H295R cell growth (Supplementary Material, Fig. S12A). Altogether, these data suggest that EZH2 inhibition may be effective at inhibiting tumour growth in patients. This approach may prove feasible as compounds such as GSK2816126 (NCT02082977, (26)), EPZ-6438 (NCT01897571, (27)) or CPI-1205 (NCT02395601) have entered phase I clinical trials for lymphomas and advanced solid tumours.
The mechanisms that result in EZH2 overexpression in tumours are still unclear. Here we show that the transcription factor E2F1 is overexpressed in ACC, correlated with EZH2 within ACC samples and stimulates expression of EZH2 in vitro. This is consistent with previously published data showing that E2Fs control expression of EZH2 in MEFs (19) and fibroblasts (18) but also in bladder cancer (28). Interestingly, experimental evidence suggests that EZH2 could positively control expression and/or activity of E2Fs, which would constitute a feed-forward loop involved in tumour cell growth (27,29–32). Even if we cannot exclude such a scenario for some members of the E2F family, our data show no alteration of E2F1 or E2F8 expression following EZH2 knockdown in H295R cells (Supplementary Material, Fig. S5). Consistent with the central role of the TP53/RB/E2F cascade in the progression into S-phase, we show that high expression of E2F1 and to a lesser extent E2F8 is correlated with poor prognosis in ACC patients (Supplementary Material, Table S3). Furthermore, knockdown of E2F1 or E2F8 results in decreased H295R cell growth, suggesting that E2Fs may be involved in adrenal cortex tumour progression. This effect could involve direct regulation of EZH2 expression in the case of E2F1. However, knockdown of E2F8 had no effect on EZH2 expression (Fig. 2), which indicates that E2F8 in particular and probably other E2Fs stimulate proliferation of ACC cells through EZH2-independent mechanisms. Although this highlights E2Fs as interesting therapeutic targets in ACC, drugs targeting E2Fs are scarce (33) and may be ineffective in light of the complex effects of different E2F family members on cell cycle progression and cell growth (34). This emphasizes downstream E2Fs targets, such as EZH2, as better candidates for ACC treatment.
Consistent with data from the literature (19), our experiments show decreased expression of a number of Cyclin coding genes following EZH2 inhibition in H295R cells (Fig. 3F and Supplementary Material, Fig. S12B). Whether these are direct targets of EZH2 remains to be determined. Canonical activity of EZH2/PRC2 complex is to repress transcription of target genes by catalysing tri-methylation of histone H3 on lysine 27 (H3K27me3). This serves as a docking platform for Polycomb PRC1 complex that monoubiquitinylates histone H2A at Lysine 119 (H2AK119ub), which maintains gene repression. This activity has been shown to repress expression of tumour suppressors (35) such as DAB2IP, SLIT2, TIMP-3, MSMB and NKX3.1 in the prostate (35,36) or RUNX3, FOXC1, RKIP, CIITA, IL-6, IL-8 and CDKN1C in breast tumours (36), which directly links overexpression of EZH2 with tumour growth. The decrease in Cyclin genes expression following EZH2 inhibition is thus incompatible with recruitment of PRC2 repressive activity on their promoters. However, recent data have identified novel activities of EZH2 that are independent of PRC2 complex. Indeed, after phosphorylation by Akt at serine 21, EZH2 has been shown to associate with and methylate the androgen receptor AR in advanced castration-resistant prostate cancer. This results in transcriptional induction through AR rather than inhibition (37). EZH2 has also been shown to stimulate transcriptional activity of STAT3 through methylation, which promotes tumourigenicity of glioblastoma stem-like cells (38). Therefore, EZH2 is capable of both transcription repression and activation depending on its partners and its serine 21-phosphorylation status. Which of these activities is mobilized in the context of ACC, will have to be determined.
We and others have shown that WNT signalling pathway plays a crucial role in adrenal cancer development (2,4–6,39). Interestingly, EZH2 has been shown to modulate WNT signalling in various tissues. Indeed, it represses AXIN2, a WNT repressor, in parathyroid cell lines (40) and it enhances WNT signalling in a β-catenin/PAF/EZH2 complex, independently of its methyltransferase activity in the intestine (41). EZH2 also activates WNT signalling in hepatocellular carcinoma by inhibiting expression of WNT antagonists such as AXIN2, NKD1, PPP2R2B, PRICKLE1, SFRP5 (42) and CXXC4 (43). However, it can also repress WNT signalling to facilitate adipogenesis, by inhibiting expression of a number of WNT ligands (44). Furthermore, EZH2 directly binds the promoters and represses the expression of CTNNB1 and LEF1 in human embryonic fibroblasts (45). Therefore, understanding the potential role of EZH2 in WNT signalling modulation in ACC, will require careful evaluation of the possible crosstalks between the two pathways.
In most cancer types, EZH2 has been proposed to play a role in tumour progression rather than initiation (11–13). Consistent with this idea, mouse models of EZH2 overexpression in mammary epithelium (46) or in haematopoietic stem cells (47) have failed to induce bona fide cancer development. However, overexpression of EZH2 in morphologically normal breast tissue is a good predictor of future neoplastic development (48), suggesting that it is involved in the establishment of a pre-cancerous state. Consistent with this idea, EZH2 is amplified and overexpressed in both benign and malignant parathyroid tumours (40). Our data show that EZH2 is already overexpressed in adrenocortical adenomas in both Cochin and Michigan cohorts (Fig. 1B). Although overexpression in these benign tumours is much lower than in ACC, it suggests that EZH2 may also participate in benign tumour development. Even though integrative genomic approaches suggest that ACA are not precursors of ACC (49), it may be interesting to determine whether those ACA with increased EZH2 expression may represent a more aggressive adenoma phenotype or even a precancerous state. Defining the precise role of EZH2 in adrenal tumour development and progression will require development of genetically engineered mouse models.
In conclusion, we have shown that the histone methyltransferase EZH2 is overexpressed in adrenal cortex cancer and that its inhibition may constitute an interesting therapeutic approach.
Materials and Methods
Cell culture
Human H295R ACC cells and SW13 cells were cultured in DMEM/Ham’s F12 supplemented with 10% foetal bovine serum (S1800-500, Biowest), 2 mM L-Glutamine (ref. 25030, Gibco), 50 U/ml penicillin, 50 mg/ml streptomycine and 1× Insulin/Transferrin/Selenium (ref. 41400-045, Gibco).
Transfections and treatments
For siRNA-mediated knockdown of EZH2, E2F1 and E2F8, H295R were seeded at a density of 4.105 cells per well in 6-wells plates (no. 353046, BD Falcon). Cells were then transfected twice within 48h with Effectene using 100 pmol siRNA per well, following manufacturer’s instructions. siRNA sequences were: siGFP: ACUACCAGCAGAACACCCCUU; siEZH2-1: CAGAGAAUGUGGAUUUAUA; siEZH2-2: Silencer Select (s4917, Ambion Life Technologies); siEZH2-3: ON-TARGET plus SMART pool (J-004218-07, Dharmacon); siE2F1 (sc-29297, Santa Cruz Biotechnology); siE2F8 (sc-96849, Santa Cruz Biotechnology).
For pharmacological EZH2 inhibition, H295R cells were seeded as above and treated with increasing doses (0.5, 1.0, 5.0 µM) of DZNep (102052-95-9, Cayman Chemical) for 48–120 h in complete culture medium, which was changed every 24h. Mitotane (Sigma-Aldrich) treatment was conducted in a similar way with 10 or 20 µM doses. GSK126 (S7061, Selleckchem) treatment was conducted in a similar way, with increasing doses (0.5, 1.0, 5.0, 10 µM). In all experiments, control cells were treated with equivalent amounts of DMSO.
For inhibition of Caspases, H295R cells were treated as described above with 5 µM DZNep alone or in combination with increasing doses (1.0, 10, 25 µM) of Z-VAD-FMK (S7023, Selleckchem), a pan-caspase inhibitor, for 120 h.
Real-time quantitative PCR
Total RNAs from patients’ tissues and H295R cells were extracted with RNAII nucleotide extraction kit (Macherey Nagel), following manufacturer’s instructions. One microgram of total mRNAs was reverse transcribed for 1 h at 37 °C with 5 pmoles of random hexamers primers, 200 U reverse transcriptase (M-MLV RT, M1701, Promega), 2 mM dNTPs and 20 U RNAsin (N2615, Promega). One microliter of a one-tenth dilution of cDNA was used in each quantitative PCR reaction. All reactions were conducted with SYBR qPCR Premix Ex Taq II Tli RNase H+ (TAKRR820W, Takara). Primer pairs are listed in Supplementary Material, Table S1. For each experiment and primer pairs, efficiency of PCR reactions was evaluated by amplification of serial dilutions of a mix of cDNAs. Relative gene expression was normalized to ACTIN by the ΔΔCt method. Statistical analyses were directly conducted on ΔΔCt values.
Protein extraction and western blot analyses
Proteins from H295R cells or patients samples were extracted with nuclear lysis buffer (50 mM Tris-HCl pH 8.1, 10 mM EDTA and 1% SDS) supplemented with protease inhibitors (Complete, 11-697-498-001, Roche). Thirty micrograms of total proteins were separated by SDS-PAGE electrophoresis and transferred to a nitrocellulose membrane and detected with antibodies to EZH2 (1/1000, no. 3147, Cell Signaling Technology), H3K27me3 (1/1000, no. 07-449, Merck Millipore), E2F1 (1/1000, 05-379, Millipore), E2F8 (1/1000, ab109596, Abcam) and BCL2 (1/1000, no. 2876, Cell Signaling Technology). EZH2, E2F1, E2F8 and BCL2 accumulation levels were normalized to actin (1/500, no. A2066, Sigma Aldrich). H3K27me3 was normalized to histone H3 (1/1000, no. C-16, Santa Cruz Biotechnology).
Chromatin immunoprecipitation
H295R cells ChIP was performed as previously described in (50). E2F1 and E2F8 were immunoprecipitated with 5 µg anti-E2F1 (05-379, Millipore) and 5 µg anti-E2F8 (ab109596, Abcam). Rabbit IgGs (kch-504-250, Diagenode) were used as a control. Enrichment of EZH2 promoter in precipitates was detected by RTqPCR using primers pEZH2-Fwd 5′- GGGCCAAATAAAAGCGATGG-3′ and pEZH2-Rev 5′-CTGCCTTCTGAGTCCCACCG-3′ as described by Bracken et al. (19). Negative control primers (EZH2-neg-Fwd 5′- GGAGTTTGCTGCTGCTCTCACCG-3′; EZH2-neg-Rev 5′-CCCGTTTCAGTCCCTGCTTCCC-3′) were designed within the coding region of EZH2. Results are expressed as fold-enrichment over control IgG.
Measure of cell growth and cell cycle analysis
H295R cell growth rate was determined by calculating the ratio of live H295R cells after treatment over the number of cells initially seeded. It was then expressed as a relative value over control DMSO-treated group. For knockdown experiments, cells were counted 5 days after the first round of siRNA transfection. For pharmacological inhibition, cells were counted 5 days after initiation of treatment. These experiments were repeated at least four times with triplicate samples.
For cell cycle analysis, H295R cells were trypsinized after 5 days and centrifuged. Pellets were resuspended in a solution of 100 µg/ml RNAse A and 25 µg/ml Propidium Iodide. Cell cycle distribution was determined by analysing propidium incorporation by flow cytometry. At least 15 000 events were measured for each sample. These experiments were repeated three times with triplicate samples.
Detection of apoptosis by TUNEL assay
H295R cells were seeded at a density of 4 × 10⁵ per well (six-well plates) on glass coverslips. After 48 h treatment, cells were fixed with 4% PFA for 30 min at room temperature. Cells were then permeabilized with 0.1% Triton X-100. Cells were then incubated for 1h at 37 °C with a mix of 20 U/µl TdT (Terminal Deoxynucleotidyl Transferase, EP0162, Thermo Scientific), 1 mM Biotin-11-dUTP (R0081, Thermo Scientific) and 1 mM ATP in TdT buffer. Following DNA end labelling, cells were incubated at room temperature for 1h with Streptavidin-HRP (1/1000, Jackson ImmunoResearch). HRP was then detected with Tyramide Signal Amplification following manufacturer’s instructions (TSA-Alexa488, T-20932, Life Technologies). Nuclei were counterstained with Hoechst 33342. Apoptotic rate was determined by counting the number of TUNEL-positive cells on 5 high power fields (40×) for each slide. The data are expressed as the ratio of TUNEL-positive cells in DZNep treated cells over control DMSO-treated cells. These experiments were performed three times with triplicate samples.
Detection of Caspase 3 activity
H295R cells were seeded at a density of 4 × 10⁵ per well (six-well plates). After 48 h treatment, cells were lysed and Caspase 3 activity was determined using a Caspase 3 colorimetric assay kit, following manufacturer’s instructions (ALX-850-215-KI01, Enzo Life Sciences). Data were expressed as Caspase 3 activity in DZNep-treated group, relative to control DMSO-treated group. These experiments were performed three times with triplicate samples.
Clonogenic growth assay
H295R cells were seeded at a density of 4 × 10⁵ per well (six-well plate). After 24 h, cells were treated with DZNep (5 µM) or DMSO for 48 h. They were then trypsinized and resuspended at a density of 1 × 10⁴ cells/ml of a 0.45% agar solution in DMEM/Ham’s F12, in the presence of 5 µM DZNep or DMSO. One ml of this suspension was seeded on 1 ml of a 0.75% agar base (per well) that had been allowed to settle in six-well plates. After 15 days in culture, cell colonies were fixed with 4% PFA and stained with crystal violet. These experiments were performed three times with triplicate samples.
Wound healing assay
H295R cells were seeded at a density of 3.5 × 10⁶ per well in six-wells plates. After 48 h, the confluent monolayer was wounded with a 10µl pipette tip. Cells were then treated with DZNep 5 µM or DMSO for 5 days. After treatment, wound healing was measured with Image J. These experiments were performed three times with triplicate samples.
Patient’s samples
We obtained frozen adrenal tumour samples through the COMETE network from patients who underwent adrenal surgery for adrenal cortex adenoma (7 ACA) or adrenal cortex carcinoma (7 ACC). The clinical and biological characteristics of the patients are summarized in Supplementary Material, Table S2. Methods for screening and criteria for diagnosing adenomas and carcinomas were in agreement with institutional guidelines. All patients gave written informed consent to participate to the study.
Patients’ data analysis
Three independent cohorts of adrenocortical tumours were used: Cochin cohort included 47 ACC, 41 ACA and 4 NAds (Gene Expression Omnibus (GEO) dataset GSE49280 and ArrayExpress dataset E-TABM-311); Michigan Cohort included 33 ACC, 22 ACA and 10 NAd (GEO dataset GSE33371) and TCGA cohort included 79 ACC (http://gdac.broadinstitute.org, last accessed May 07, 2016, mRNA sequencing data, 2015_08_21 release). For Cochin and Michigan cohorts all samples were normalized in batches, independently for each chip type, using the RMA algorithm (Bioconductor affy package), and probe set intensities were then averaged per gene symbol. For both of these data-sets, each gene was centred to the median of the NAd samples. For TCGA cohort, mRNA sequencing data were extracted from Broad Institute GDAC Firehose (TCGA data version 2015_08_21) and all calculations were performed on Log2 values of RSEM normalized read counts. Differential expression was measured with moderated F-test (limma R package) and all P values were adjusted using the Benjamini–Hochberg correction method. Survival curves were obtained by the Kaplan-Meier method. Differences in survival were assessed with the log-rank test. Data on EZH2 copy numbers and EZH2 expression were extracted from C-Bioportal (http://www.cbioportal.org, last accessed May 07, 2016). Mutational data for TP53 and RB1 were previously described for Cochin cohort (17) and were extracted from C-Bioportal for TCGA cohort. Only potentially inactivating mutations were considered in the analysis (exclusion of missenses). All analyses were performed using R 3.0.3 with custom scripts. GSEA (51) were performed with gene expression data from Cochin, Michigan and TCGA cohorts and with BioCarta (http://cgap.nci.nih.gov/Pathways/BioCarta_Pathways, last accessed May 07, 2016), KEGG (http://www.genome.jp/kegg/genes.html, last accessed May 07, 2016) and oncogenic signatures (MsigDB C6, http://software.broadinstitute.org/gsea/msigdb/collections.jsp#C6, last accessed May 07, 2016) gene sets. Significance was set at P < 0.05 (represented by * in figures); P < 0.01 (**) and P < 0.001 (***).
Statistical analyses of experimental data
Experimental data were processed with R. All data were analyzed in Log2 space. Two groups comparisons were analysed by Student’s t test or Mann-Whitney test. All bars represent mean ± SD. Multiple group comparisons were analysed by two-way ANOVA procedures with terms for each condition and each experiment. Significance was set at P < 0.05. (represented by * in figures); P < 0.01 (**) and P < 0.001 (***).
Supplementary Material
Supplementary Material is available here.
Supplementary Material
Acknowledgements
We wish to thank Jean-Paul Saru for western blot analyses, Dr Adrian P. Bracken (Smurfit Institute, Dublin) for providing sequences of ChIP primers, Dr Marc Lombes and Dr Ségolène Hescot (UMR-S1185, Paris) for providing SW13 cells.
Conflict of Interest statement. None declared.
Funding
This work was supported by institutional support from Centre National de la Recherche Scientifique, Institut National de la Santé et de la Recherche Médicale, Université Blaise Pascal, Université d’Auvergne and through grants from Fondation de France, La Ligue Contre le Cancer (Allier & Puy de Dôme committees), Fondation ARC (PJA20141201894), Société Française d’Endocrinologie (young researcher grant to C.D. and Researcher Prize to P.V.) and University of Michigan Cancer Center Support Grant P30-CA046592 (NIH to R.K. and T.J.G.). The funders had no role in study design, data collection and analysis, decision to publish or preparation of the article.
References
- 1. Else T., Kim A.C., Sabolch A., Raymond V.M., Kandathil A., Caoili E.M., Jolly S., Miller B.S., Giordano T.J., Hammer G.D. (2014) Adrenocortical carcinoma. Endocr. Rev., 35, 282–326. [DOI] [PMC free article] [PubMed] [Google Scholar]
- 2. Berthon A., Martinez A., Bertherat J., Val P. (2011) Wnt/β-catenin signalling in adrenal physiology and tumour development. Mol. Cell. Endocrinol., 351, 87–95. [DOI] [PubMed] [Google Scholar]
- 3. Drougat L., Omeiri H., Lefèvre L., Ragazzon B. (2015) Novel insights into the genetics and pathophysiology of adrenocortical tumors. Front. Endocrinol., 6, 96. [DOI] [PMC free article] [PubMed] [Google Scholar]
- 4. Berthon A., Sahut-Barnola I., Lambert-Langlais S., de Joussineau C., Damon-Soubeyrand C., Louiset E., Taketo M.M., Tissier F., Bertherat J., Lefrancois-Martinez A.M. et al. (2010) Constitutive {beta}-catenin activation induces adrenal hyperplasia and promotes adrenal cancer development. Hum. Mol. Genet., 19, 1561–1576. [DOI] [PubMed] [Google Scholar]
- 5. Drelon C., Berthon A., Ragazzon B., Tissier F., Bandiera R., Sahut-Barnola I., De Joussineau C., Batisse-Lignier M., Lefrançois-Martinez A.M., Bertherat J. et al. (2012) Analysis of the role of Igf2 in adrenal tumour development in transgenic mouse models. PLoS One, 7, e44171.. [DOI] [PMC free article] [PubMed] [Google Scholar]
- 6. Heaton J.H., Wood M.A., Kim A.C., Lima L.O., Barlaskar F.M., Almeida M.Q., Fragoso M.C.B.V., Kuick R., Lerario A.M., Simon D.P. et al. (2012) Progression to adrenocortical tumorigenesis in mice and humans through insulin-like growth factor 2 and β-catenin. Am. J. Pathol., 181, 1017–1033. [DOI] [PMC free article] [PubMed] [Google Scholar]
- 7. Fassnacht M., Berruti A., Baudin E., Demeure M.J., Gilbert J., Haak H., Kroiss M., Quinn D.I., Hesseltine E., Ronchi C.L. et al. (2015) Linsitinib (OSI-906) versus placebo for patients with locally advanced or metastatic adrenocortical carcinoma: a double-blind, randomised, phase 3 study. Lancet Oncol., 16, 426–435. [DOI] [PubMed] [Google Scholar]
- 8. Igaz P., Igaz I., Nagy Z., Nyírő G., Szabó P.M., Falus A., Patócs A., Rácz K. (2015) MicroRNAs in adrenal tumors: relevance for pathogenesis, diagnosis, and therapy. Cell. Mol. Life Sci. CMLS, 72, 417–428. [DOI] [PMC free article] [PubMed] [Google Scholar]
- 9. Varier R.A., Timmers H.T.M. (2011) Histone lysine methylation and demethylation pathways in cancer. Biochim. Biophys. Acta, 1815, 75–89. [DOI] [PubMed] [Google Scholar]
- 10. Cao R., Zhang Y. (2004) The functions of E(Z)/EZH2-mediated methylation of lysine 27 in histone H3. Curr. Opin. Genet. Dev., 14, 155–164. [DOI] [PubMed] [Google Scholar]
- 11. Varambally S., Dhanasekaran S.M., Zhou M., Barrette T.R., Kumar-Sinha C., Sanda M.G., Ghosh D., Pienta K.J., Sewalt R.G.A.B., Otte A.P. et al. (2002) The polycomb group protein EZH2 is involved in progression of prostate cancer. Nature, 419, 624–629. [DOI] [PubMed] [Google Scholar]
- 12. Kleer C.G., Cao Q., Varambally S., Shen R., Ota I., Tomlins S.A., Ghosh D., Sewalt R.G.A.B., Otte A.P., Hayes D.F. et al. (2003) EZH2 is a marker of aggressive breast cancer and promotes neoplastic transformation of breast epithelial cells. Proc. Natl. Acad. Sci. U S A, 100, 11606–11611. [DOI] [PMC free article] [PubMed] [Google Scholar]
- 13. Deb G., Singh A.K., Gupta S. (2014) EZH2: Not EZHY (Easy) to Deal. Mol. Cancer Res., 10.1158/1541-7786.MCR-13-0546. [DOI] [PMC free article] [PubMed] [Google Scholar]
- 14. de Reynies A., Assie G., Rickman D.S., Tissier F., Groussin L., Rene-Corail F., Dousset B., Bertagna X., Clauser E., Bertherat J. (2009) Gene expression profiling reveals a new classification of adrenocortical tumors and identifies molecular predictors of malignancy and survival. J. Clin. Oncol., 27, 1108–1115. [DOI] [PubMed] [Google Scholar]
- 15. McCabe M.T., Graves A.P., Ganji G., Diaz E., Halsey W.S., Jiang Y., Smitheman K.N., Ott H.M., Pappalardi M.B., Allen K.E. et al. (2012) Mutation of A677 in histone methyltransferase EZH2 in human B-cell lymphoma promotes hypertrimethylation of histone H3 on lysine 27 (H3K27). Proc. Natl. Acad. Sci. U S A, 109, 2989–2994. [DOI] [PMC free article] [PubMed] [Google Scholar]
- 16. Morin R.D., Johnson N.A., Severson T.M., Mungall A.J., An J., Goya R., Paul J.E., Boyle M., Woolcock B.W., Kuchenbauer F. et al. (2010) Somatic mutations altering EZH2 (Tyr641) in follicular and diffuse large B-cell lymphomas of germinal-center origin. Nat. Genet., 42, 181–185. [DOI] [PMC free article] [PubMed] [Google Scholar]
- 17. Assié G., Letouzé E., Fassnacht M., Jouinot A., Luscap W., Barreau O., Omeiri H., Rodriguez S., Perlemoine K., René-Corail F. et al. (2014) Integrated genomic characterization of adrenocortical carcinoma. Nat. Genet., 46, 607–612. 10.1038/ng.2953. [DOI] [PubMed] [Google Scholar]
- 18. Tang X., Milyavsky M., Shats I., Erez N., Goldfinger N., Rotter V. (2004) Activated p53 suppresses the histone methyltransferase EZH2 gene. Oncogene, 23, 5759–5769. [DOI] [PubMed] [Google Scholar]
- 19. Bracken A.P., Pasini D., Capra M., Prosperini E., Colli E., Helin K. (2003) EZH2 is downstream of the pRB-E2F pathway, essential for proliferation and amplified in cancer. Embo J., 22, 5323–5335. [DOI] [PMC free article] [PubMed] [Google Scholar]
- 20. Dick F.A., Rubin S.M. (2013) Molecular mechanisms underlying RB protein function. Nat. Rev. Mol. Cell Biol., 14, 297–306. [DOI] [PMC free article] [PubMed] [Google Scholar]
- 21. Dimova D.K., Dyson N.J. (2005) The E2F transcriptional network: old acquaintances with new faces. Oncogene, 24, 2810–2826. [DOI] [PubMed] [Google Scholar]
- 22. Lammens T., Li J., Leone G., De Veylder L. (2009) Atypical E2Fs: new players in the E2F transcription factor family. Trends Cell Biol., 19, 111–118. [DOI] [PMC free article] [PubMed] [Google Scholar]
- 23. Miranda T.B., Cortez C.C., Yoo C.B., Liang G., Abe M., Kelly T.K., Marquez V.E., Jones P.A. (2009) DZNep is a global histone methylation inhibitor that reactivates developmental genes not silenced by DNA methylation. Mol. Cancer Ther., 8, 1579–1588. [DOI] [PMC free article] [PubMed] [Google Scholar]
- 24. Wang T., Rainey W.E. (2012) Human adrenocortical carcinoma cell lines. Mol. Cell. Endocrinol., 351, 58–65. [DOI] [PMC free article] [PubMed] [Google Scholar]
- 25. Ip J.C.Y., Pang T.C.Y., Glover A.R., Soon P., Zhao J.T., Clarke S., Robinson B.G., Gill A.J., Sidhu S.B. (2015) Immunohistochemical validation of overexpressed genes identified by global expression microarrays in adrenocortical carcinoma reveals potential predictive and prognostic biomarkers. Oncologist, 20, 247–256. [DOI] [PMC free article] [PubMed] [Google Scholar]
- 26. McCabe M.T., Ott H.M., Ganji G., Korenchuk S., Thompson C., Van Aller G.S., Liu Y., Graves A.P., Iii A.D.P., Diaz E. et al. (2012) EZH2 inhibition as a therapeutic strategy for lymphoma with EZH2-activating mutations. Nature, 10.1038/nature11606. [DOI] [PubMed] [Google Scholar]
- 27. Knutson S.K., Kawano S., Minoshima Y., Warholic N.M., Huang K.C., Xiao Y., Kadowaki T., Uesugi M., Kuznetsov G., Kumar N. et al. (2014) Selective inhibition of EZH2 by EPZ-6438 Leads to potent antitumor activity in EZH2-mutant non-hodgkin lymphoma. Mol. Cancer Ther., 13, 842–854. [DOI] [PubMed] [Google Scholar]
- 28. Lee S.R., Roh Y.G., Kim S.K., Lee J.S., Seol S.Y., Lee H.H., Kim W.T., Kim W.J., Heo J., Cha H.J. et al. (2015) Activation of EZH2 and SUZ12 regulated by E2F1 predicts the disease progression and aggressive characteristics of bladder cancer. Clin. Cancer Res., 21, 5391–5403. 10.1158/1078-0432.CCR-14-2680. [DOI] [PubMed] [Google Scholar]
- 29. Liu T., Hou L., Huang Y. (2014) EZH2-specific microRNA-98 inhibits human ovarian cancer stem cell proliferation via regulating the pRb-E2F pathway. Tumour Biol., 35, 7239–7247. [DOI] [PubMed] [Google Scholar]
- 30. Leseva M., Santostefano K.E., Rosenbluth A.L., Hamazaki T., Terada N. (2013) E2f6-mediated repression of the meiotic Stag3 and Smc1β genes during early embryonic development requires Ezh2 and not the de novo methyltransferase Dnmt3b. Epigenetics, 8, 873–884. [DOI] [PMC free article] [PubMed] [Google Scholar]
- 31. Wu Z.L., Zheng S.S., Li Z.M., Qiao Y.Y., Aau M.Y., Yu Q. (2010) Polycomb protein EZH2 regulates E2F1-dependent apoptosis through epigenetically modulating Bim expression. Cell Death Differ., 17, 801–810. [DOI] [PubMed] [Google Scholar]
- 32. Xu H., Xu K., He H.H., Zang C., Chen C.H., Chen Y., Qin Q., Wang S., Wang C., Hu S. et al. (2016) Integrative Analysis Reveals the Transcriptional Collaboration between EZH2 and E2F1 in the Regulation of Cancer-Related Gene Expression. Mol. Cancer Res., 14, 163–172. [DOI] [PMC free article] [PubMed] [Google Scholar]
- 33. Kurtyka C.A., Chen L., Cress W.D. (2014) E2F inhibition synergizes with paclitaxel in lung cancer cell lines. PloS One, 9, e96357.. [DOI] [PMC free article] [PubMed] [Google Scholar]
- 34. Chen H.Z., Tsai S.Y., Leone G. (2009) Emerging roles of E2Fs in cancer: an exit from cell cycle control. Nat. Rev. Cancer, 9, 785–797. [DOI] [PMC free article] [PubMed] [Google Scholar]
- 35. Pommier A.J.C., Dufour J., Alves G., Viennois E., De Boussac H., Trousson A., Volle D.H., Caira F., Val P., Arnaud P. et al. (2013) Liver x receptors protect from development of prostatic intra-epithelial neoplasia in mice. PLoS Genet., 9, e1003483.. [DOI] [PMC free article] [PubMed] [Google Scholar]
- 36. Deb G., Thakur V.S., Gupta S. (2013) Multifaceted role of EZH2 in breast and prostate tumorigenesis: epigenetics and beyond. Epigenetics, 8, 464–476. [DOI] [PMC free article] [PubMed] [Google Scholar]
- 37. Xu K., Wu Z.J., Groner A.C., He H.H., Cai C., Lis R.T., Wu X., Stack E.C., Loda M., Liu T. et al. (2012) EZH2 oncogenic activity in castration-resistant prostate cancer cells is Polycomb-independent. Science, 338, 1465–1469. [DOI] [PMC free article] [PubMed] [Google Scholar]
- 38. Kim E., Kim M., Woo D.H., Shin Y., Shin J., Chang N., Oh Y.T., Kim H., Rheey J., Nakano I. et al. (2013) Phosphorylation of EZH2 activates STAT3 signaling via STAT3 methylation and promotes tumorigenicity of glioblastoma stem-like cells. Cancer Cell, 23, 839–852. [DOI] [PMC free article] [PubMed] [Google Scholar]
- 39. Tissier F., Cavard C., Groussin L., Perlemoine K., Fumey G., Hagnere A.M., Rene-Corail F., Jullian E., Gicquel C., Bertagna X. et al. (2005) Mutations of beta-catenin in adrenocortical tumors: activation of the Wnt signaling pathway is a frequent event in both benign and malignant adrenocortical tumors. Cancer Res., 65, 7622–7627. [DOI] [PubMed] [Google Scholar]
- 40. Svedlund J., Barazeghi E., Stålberg P., Hellman P., Åkerström G., Björklund P., Westin G. (2014) The histone methyltransferase EZH2, an oncogene common to benign and malignant parathyroid tumors. Endocr. Relat. Cancer, 21, 231–239. [DOI] [PubMed] [Google Scholar]
- 41. Jung H.Y., Jun S., Lee M., Kim H.C., Wang X., Ji H., McCrea P.D., Park J.I. (2013) PAF and EZH2 induce Wnt/β-catenin signaling hyperactivation. Mol. Cell, 52, 193–205. [DOI] [PMC free article] [PubMed] [Google Scholar]
- 42. Cheng A.S.L., Lau S.S., Chen Y., Kondo Y., Li M.S., Feng H., Ching A.K., Cheung K.F., Wong H.K., Tong J.H. et al. (2011) EZH2-mediated concordant repression of Wnt antagonists promotes β-catenin-dependent hepatocarcinogenesis. Cancer Res., 71, 4028–4039. [DOI] [PubMed] [Google Scholar]
- 43. Lu H., Sun J., Wang F., Feng L., Ma Y., Shen Q., Jiang Z., Sun X., Wang X., Jin H. (2013) Enhancer of zeste homolog 2 activates wnt signaling through downregulating CXXC finger protein 4. Cell Death Dis., 4, e776.. [DOI] [PMC free article] [PubMed] [Google Scholar]
- 44. Wang L., Jin Q., Lee J.E., Su I.-H, Ge K. (2010) Histone H3K27 methyltransferase Ezh2 represses Wnt genes to facilitate adipogenesis. Proc. Natl. Acad. Sci. U S A, 107, 7317–7322. [DOI] [PMC free article] [PubMed] [Google Scholar]
- 45. Bracken A.P., Dietrich N., Pasini D., Hansen K.H., Helin K. (2006) Genome-wide mapping of Polycomb target genes unravels their roles in cell fate transitions. Genes Dev., 20, 1123–1136. [DOI] [PMC free article] [PubMed] [Google Scholar]
- 46. Li X., Gonzalez M.E., Toy K., Filzen T., Merajver S.D., Kleer C.G. (2009) Targeted overexpression of EZH2 in the mammary gland disrupts ductal morphogenesis and causes epithelial hyperplasia. Am. J. Pathol., 175, 1246–1254. [DOI] [PMC free article] [PubMed] [Google Scholar]
- 47. Herrera-Merchan A., Arranz L., Ligos J.M., de Molina A., Dominguez O., Gonzalez S. (2012) Ectopic expression of the histone methyltransferase Ezh2 in haematopoietic stem cells causes myeloproliferative disease. Nat. Commun., 3, 623. [DOI] [PubMed] [Google Scholar]
- 48. Ding L., Erdmann C., Chinnaiyan A.M., Merajver S.D., Kleer C.G. (2006) Identification of EZH2 as a molecular marker for a precancerous state in morphologically normal breast tissues. Cancer Res., 66, 4095–4099. [DOI] [PubMed] [Google Scholar]
- 49. Barreau O., de Reynies A., Wilmot-Roussel H., Guillaud-Bataille M., Auzan C., René-Corail F., Tissier F., Dousset B., Bertagna X., Bertherat J. et al. (2012) Clinical and pathophysiological implications of chromosomal alterations in adrenocortical tumors: an integrated genomic approach. J. Clin. Endocrinol. Metab., 97, E301–E311. [DOI] [PubMed] [Google Scholar]
- 50. Berthon A., Drelon C., Ragazzon B., Boulkroun S., Tissier F., Amar L., Samson-Couterie B., Zennaro M.C., Plouin P.F., Skah S. et al. (2014) WNT/β-catenin signalling is activated in aldosterone-producing adenomas and controls aldosterone production. Hum. Mol. Genet., 23, 889–905. [DOI] [PubMed] [Google Scholar]
- 51. Subramanian A., Tamayo P., Mootha V.K., Mukherjee S., Ebert B.L., Gillette M.A., Paulovich A., Pomeroy S.L., Golub T.R., Lander E.S. et al. (2005) Gene set enrichment analysis: a knowledge-based approach for interpreting genome-wide expression profiles. Proc. Natl. Acad. Sci. U S A, 102, 15545–15550. [DOI] [PMC free article] [PubMed] [Google Scholar]
Associated Data
This section collects any data citations, data availability statements, or supplementary materials included in this article.