

We probe herpesvirus binding to living cells using atomic force microscopy.
Abstract
Viral infection, initiated by the landing of a virion on a cellular surface, is largely defined by the preliminary interactions established between viral particles and their receptors at the cell surface. While multiple parallel interactions would allow strong virus attachment, a low number of bonds could be preferred to allow lateral diffusion toward specific receptors and to promote efficient release of progeny virions from the cell surface. However, so far, the molecular mechanisms underlying the regulation of the multivalency in virus attachment to receptors are poorly understood. We introduce a new method to force-probe multivalent attachment directly on living cells, and we show, for the first time, direct evidence of a new mechanism by which a herpesvirus surface glycoprotein acts as a key negative regulator in the first step of herpesvirus binding. Using atomic force microscopy, we probe at the single-virion level the number and the strength of the bonds established with heparan sulfate both on model surfaces and on living cells. Our biophysical results, correlated with other techniques, show that the major envelope glycoprotein functions as a regulator of binding valency during both attachment and release steps, determining the binding, diffusion, and release potential of virions at the cellular surface.
INTRODUCTION
Viruses are obligate intracellular parasites, using various fundamental functions of the host cell to complete their viral life cycle, leading to the production of new infectious viral particles. As they are too large to diffuse through the cytoplasmic membrane, virions hijack basic cellular processes to cross the host cell membrane (1). Virus infection is initiated by a collision between the viral particle and the cell surface, and virus entry is first defined by the preliminary interactions occurring between virus particles and their receptors at the cell surface (2). While it has been suggested that the multivalent nature of virus interactions with the cell surface could constitute a “signal” leading to the virus internalization (3), multivalency also reduces the lateral virus mobility at the cell surface, limiting the probability to find a specific receptor (2). Similarly, after replication within the cell, freshly assembled virus particles must “escape” from cells and tackle the same interactions encountered during entry. Therefore, to lead to a successful infection, a tight regulation of the multivalency with cell surface moieties is crucial. However, direct evidence about the regulatory mechanism is missing, mainly due to the fact that currently no technique is able to decipher the multivalent characteristics of single-virus interactions with their individual receptors.
Herpesviruses (HVs) and, in particular, members of the Gammaherpesvirinae subfamily, are ubiquitous viruses that establish latency in their hosts. Human gammaherpesvirus (γ-HV) infections are generally asymptomatic but can also be associated with mononucleosis and specific forms of cancer, especially in immunocompromised people (4). Infection by HVs is more complex than infection by other viruses, as it requires the concerted effort of multiple viral glycoproteins and involves multiple host receptors (5). Currently, murid HV 4 (MuHV-4; Fig. 1A) serves as a model for the in vivo study of human γ-HV pathogenesis (6). MuHV-4 binding to glycan receptors involves two glycoproteins (gp70 and the dimer gH/gL), which bind to cell surface glycosaminoglycans (GAGs) (Fig. 1, A and B), providing virions with a vital first foothold (7). Subsequently, two other glycoproteins (gB and gH) are engaged and mediate the membrane fusion through specific binding to host receptors (8). In addition, the role of gp150, another major viral glycoprotein, remains elusive. While gp150 shows low affinity for GAGs in vitro (9) and seems redundant for virus entry (10, 11), it inhibits gB/gH binding until GAGs are engaged (7) and acts as an immunogenic decoy (12). Furthermore, gp150-deficient virions are defective in release from infected cells (11, 13). Therefore, the exact role of gp150 during the first binding events and release from infected cells remains to be clarified.
Fig. 1. Schematic of HV and AFM probing of HV binding to living animal cells.
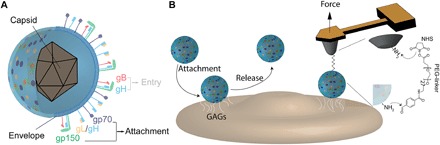
(A) Schematic model of MuHV-4 particle, showing a lipid bilayer–derived envelope (blue) carrying multiple glycoproteins, a subset of which are involved either in the attachment (gp70, gp150, and gL/gH) to cell surface molecules or in the entry mechanism into cells (gB and gH). (B) Schematic of HV binding to GAGs and virus release (either after attachment or after cellular infection). Before cell entry, the virus must bind to attachment factors (GAGs, HS, etc.) to concentrate virus on the cell surface before the specific binding to entry receptors. Interactions with GAG moieties will be monitored at the single-virus level using AFM, with tips derivatized with a single virion.
Here, we use and further develop atomic force microscopy (AFM) with tips functionalized with single virus particles to study the multivalent binding mechanism of single-virion attachment to living cells. By probing discrete points on the surface of biological samples, force-distance (FD) curve-based AFM (FD-based AFM) methods allow quantitative three-dimensional (3D) images of biological systems to be recorded at high resolution (~50 nm) (14) and to simultaneously extract quantitative parameters such as adhesion, elasticity, or deformation (fig. S1) (14–16). In particular, we focus on probing the multivalency established to glycan receptors at the cell surface and how the virus developed strategies to regulate its multivalent anchorage to these cellular attachment factors (Fig. 1B). By combining experiments on purified glycans and living cells, we extracted quantitative parameters underlying virus binding to GAGs, and we gain unprecedented insights into the tight regulation of virus anchorage to cell surfaces.
RESULTS
Characterization of MuHV-4 particles
To study virus binding by FD-based AFM, purified MuHV-4 viral particles (see fig. S2 and Materials and Methods) were covalently attached to AFM tips by means of a 27-unit polyethylene glycol (PEG) chain, as previously established (Fig. 1B) (17–19). Tip functionalization was validated using scanning electron microscopy (SEM), which shows a single virus particle bound to the AFM tip apex (fig. S2). In addition, viral particle infectivity was confirmed by flow cytometry (fig. S3). Either wild-type (WT) virions or gp150− (a gp150-deficient mutant) virions were used to infect GAG-positive (GAG+) Chinese hamster ovary (CHO) cells and CHO cells deficient in xylosyltransferase, that is, that do not express GAGs at the cell surface (GAG−) (7, 20). WT virions were shown to bind mainly to GAG+ cells and showed a large significant infection deficit toward GAG− cells, as previously described (11). We thus concluded that WT virions were functional and observed the expected role of GAGs in efficient infection. Surprisingly, gp150− viral particles showed increased binding toward GAG+ cells, whereas their infection level remained constant in comparison with WT virions (fig. S3). This finding suggests that bound particles are less efficient in producing cellular infection. Therefore, we sought to determine how gp150 could specifically contribute to HV binding to GAGs. To ensure that we were probing the role of gp150 using a gp150-deficient mutant virus, we characterized the viral productions to evaluate their glycoprotein content using Western blot analysis (fig. S2). We observed a similar expression of glycoproteins (with the exception of gp150) in both WT and gp150-deficient virions.
Probing WT virion interactions with GAGs in vitro
As we first wanted to evaluate the binding of MuHV-4 virions toward immobilized GAGs, we prepared a heparin-coated model surface. Heparin is a polysaccharide very closely related in structure to heparan sulfate (HS), a GAG expressed at the cell surface. Attachment of MuHV-4 virions was shown to be blocked by soluble heparin, probably due to a competition with cellular HS to bind viral glycoproteins (7). Heparin was immobilized in an oriented manner using the strong biotin-streptavidin display system (21), and surface derivatization was validated using AFM scratching, showing a deposited layer of ≈3 nm (fig. S2).
Using AFM single-molecule experiments on purified heparin, we found that WT virions specifically bind to heparin. Briefly, FD curves with AFM tips functionalized with single WT particles were recorded on heparin-coated surfaces (Fig. 2A) (21, 22). FD curves were recorded at various constant retraction speeds, and the rupture force observed between the virion and the heparin was extracted (fig. S4). Adhesion events were observed in 10 to 40% of retraction FD curves. To assess the specificity of the interactions, we fitted adhesion peaks with the worm-like chain (WLC) model, confirming the typical signature of the PEG chain elongation (Fig. 2A). We also performed three other independent controls using (i) a PEG-coated AFM tip, (ii) a streptavidin-coated surface (without heparin), and (iii) the in situ injection of free heparin (fig. S5). These controls confirmed that virions bound to the tip undergo specific interactions with immobilized heparin. Neither the PEG-coated AFM tip on the heparin surface nor the virus-streptavidin contact shows specific interactions, as previously measured. Furthermore, injection of free heparin markedly reduced the binding frequency (from 38 to 17%).
Fig. 2. Extraction of average rupture forces of WT MuHV-4 binding for discrete LRs.
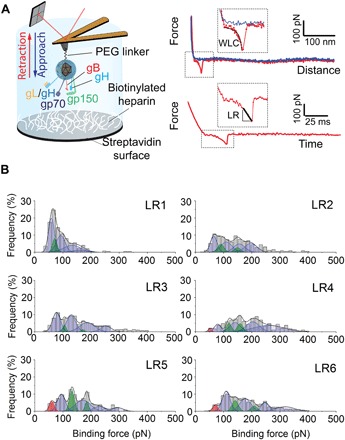
(A) Schematic representation of FD-based AFM allowing interactions between an AFM tip functionalized with a MuHV-4 viral particle and a heparin-coated model surface to be probed. Heparin molecules were immobilized, taking advantage of the oriented and strong biotin-streptavidin noncovalent attachment. Representative FD curve showing a specific adhesion event, as detected by the shape of the adhesion peak, where the extension of the PEG linker can be fitted with the WLC model for polymer extension (39). Representative retraction force-time (FT) curve from which the LR applied by the AFM tip can be extracted via the slope of the curve on the adhesive peak just before bond rupture. (B) Force and LR were extracted from FD and FT curves and sorted in narrow LR ranges (LR1, 300 to 1000 pN/s; LR2, 1000 to 3000 pN/s; LR3, 3000 to 104 pN/s; LR4, 104 to 3 × 10⁴ pN/s; LR5, 3 × 10⁴ to 105 pN/s; LR6, 105 to 3 × 10⁵ pN/s). The rupture forces for each LR range were plotted as histograms. Histograms are fitted with multipeak Gaussian fits. n = 2400 from eight independent experiments.
As the theory predicts, receptor-ligand bond strength depends on the rate at which the load is applied [the loading rate (LR)] (23). By applying different tip retraction speeds, we explored the dependency of the force on the LR (fig. S4). From each adhesive curve, the binding force (F) was extracted together with the LR from the force versus time curve (Fig. 2A). Virion-heparin bonds are in the range of 50 to 400 pN over the explored range of applied LRs. Next, bond strengths were analyzed through distinct discrete ranges of LRs, giving multiple force histograms, as previously established (18). The force histograms showed a wide distribution ranging from 50 to 400 pN (Fig. 2B). The broad range of forces, the sawtooth pattern, and the multivalent nature of virus binding strongly argue that the distribution arises from the convolution of multiple peaks. Thus, the overall distribution was deconvoluted, yielding the most probable rupture forces for single and multiple interactions. While the first peak appears clearly, the following peaks overlap and are difficult to identify. The number and approximate position of the individual peaks within each histogram were determined by the second derivate method that reveals local maxima and hidden peaks within the histogram as local minima in the second derivate of the distribution. Next, an iterative algorithm was used, enabling to freely adjust the exact position and the area of each peak. The width of each peak is constrained to enable an incremental increase following N·σ, where σ is the SD determined from the first peak.
How to decipher and validate these multiple peaks? Because at least two viral glycoprotein complexes are involved in glycan binding (gp70 and gH/gL), two components (blue and red peaks) were assigned corresponding to each individual glycoprotein (fig. S6). Consequently, simultaneous rupture of both interactions can occur (green peaks). At the highest LR, we hypothesized that the first two peaks are the individual contributions of gp70 and gH/gL, with one being of lower affinity and less abundant (red peak). We also observed that the number of peaks scales down with the logarithm of the LR range. As the theory predicts, the unbinding force linearly increases with the LR and peaks will therefore be better resolved at higher LR, explaining why some extra peaks could appear at higher LR. In addition, weak affinity interactions could be hidden within the noise level at the low LR. This explains why the lowest affinity interaction is hidden within the LR1 to LR3 range. Using the mean rupture forces of the individual contributions, we used the predictive Williams-Evans model (24), which describes the dependency on the LR of multiple uncorrelated bonds, to evaluate the binding strength of multivalent parallel interactions. We observed a good correlation between the peaks detected by our algorithms and the Williams-Evans prediction, validating our analysis approach.
The resulting dynamic force spectroscopy (DFS) plot showed a linear dependency of the force with the LR in the DFS plot (Fig. 3A). This linear dependency has been described previously for other receptor-ligand bonds and is explained by a single free-energy barrier being crossed during the mechanical pulling (25). With the Bell-Evans model (26), the distance to the transition state xβ and the kinetic off-rate koff were extracted for the two single bonds (Fig. 3A). The values were xβ = 0.61 ± 0.04 nm and koff = 1.05 ± 0.52 s−1 for the first glycoprotein, and xβ = 0.49 ± 0.06 nm and koff = 0.09 ± 0.08 s−1 for the second glycoprotein. This observation is in good agreement with other studies, performed on a related HV, showing that the two GAG-binding glycoproteins differ in their affinity or stability, with one being highly unstable (27). The Williams-Evans model gives insights into the number of bonds and the nature of glycoproteins (that is, identical glycoproteins or combination of different glycoproteins). The full analysis of multivalent interactions revealed that two interaction types are established as stand-alone or in concert with glycan moieties.
Fig. 3. Extraction of kinetic parameters of WT and gp150-deficient viral particles binding toward purified heparin molecules.
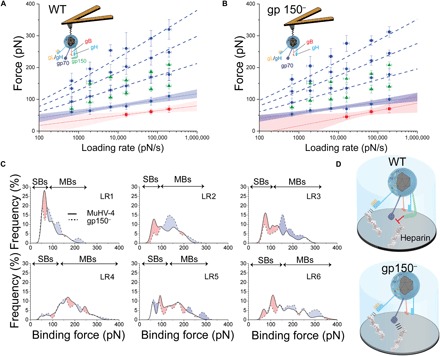
(A) AFM tip carrying a single WT MuHV-4 virion and DFS plot reporting the average values of the force distributions for WT MuHV-4–heparin interactions, enabling analysis using the Bell-Evans fit (23). Dashed lines represent the predicted binding forces for two, three, and four uncorrelated interactions rupturing simultaneously, according to the Williams-Evans model. (B) AFM tip carrying a single MuHV-4 virion from which the glycoprotein gp150 was deleted and DFS plot reporting the average values of the force distributions (fig. S8) for gp150− MuHV-4–heparin interactions, enabling analysis using the Bell-Evans fit. Dashed lines represent the Williams-Evans prediction for the simultaneous rupture of uncorrelated bonds. (C) Comparison of the multipeak Gaussian curves fitting the rupture force histograms of MuHV-4 WT and gp150− binding to heparin. Red-shaded areas correspond to higher binding probabilities for WT virions, while blue-shaded regions show more frequent gp150− virion binding. Single bonds (SBs) occur more frequently with the WT viral particles, while multiple bonds (MBs) are more probable for gp150-deficient virions. Thus, gp150 is thought to play a role in the regulation of GAG binding by limiting multivalent linkages between viral particles and long GAG chains. (D) Schematic representation of either single glycoprotein (gL/gH or gp70) interaction with heparin occurring more frequently with WT virions or multiple interactions involving a combination of the two glycoproteins more frequently observed upon gp150− virion binding.
Role of gp150 in GAG binding
To investigate the role of gp150 during the first binding steps of the whole virion, we analyzed the specific binding events of gp150− virions to heparin. The distributions of rupture forces were similar to what we observed for WT virions, as observed on the Gaussian distributions (fig. S7). Analysis of kinetic parameters extracted from the DFS plots revealed no significant differences (Fig. 3B). Our FD-based AFM experiments showed that the binding of WT and gp150− virions to GAGs is established through a similar binding potential, suggesting that gp150 is not directly involved in GAG binding. These results agree with previous studies performed on recombinant gp150. Full-length recombinant gp150 failed to bind to the cell surface, while the N-terminal region (residues 41 to 151) is capable of GAG binding, suggesting that residues 21 to 41 might inhibit GAG binding (9).
As we observed no difference in the kinetic parameters underlying binding during the first attachment step, we wanted to test whether our nanoscopic approach was able to detect differences in the number of bonds, or multivalency, established for short contact times (<1 ms). This number could strongly influence subsequent steps toward virus entry. From the histograms of both viruses (Fig. 2B and fig. S7), it appears that the occurrence frequency of each force peak strongly differs between WT and mutant virions. To facilitate the comparison, we superimposed for each LR the full distribution resulting from the multi-Gaussian analysis (Fig. 3C). Red-shaded areas correspond to higher binding probabilities for WT virions, while blue-shaded regions show more frequent gp150− virion binding. gp150− virions establish fewer interactions at low forces, while the number of interactions at high forces increases (Fig. 3C). This suggests that gp150 plays a role in the first binding steps during the early attachment to the cell surface. Together, these results show that both WT and gp150-deficient MuHV-4 particles specifically bind heparin through the same glycoproteins, most probably gH/gL and gp70 (7), and that the multivalent bond establishment appears negatively regulated by gp150.
Cell line labeling, validation, and imaging
Next, we confirmed our in vitro results in the cellular context. To investigate virion binding to cellular GAGs, we mixed two CHO cell lines, that is, cells expressing GAGs (GAG+) and cells deficient in GAG expression (GAG−). To differentiate between the two cell types, we transfected the GAG+ cell line using lentiviruses carrying the actin-mCherry transgene and we sorted it using fluorescence-activated cell sorting (FACS; see Materials and Methods). Virus binding and infection assays were performed on transfected GAG+ and GAG− cells. As expected, we observed that GAG− cells are less susceptible to viral infection and that mCherry transfection using lentiviruses does not alter it (fig. S3).
To compare virus-binding properties to GAGs, we cocultured GAG+-mCherry and GAG− cells to form a monolayer. The cells were imaged using an AFM placed on an inverted epifluorescence microscope and equipped with a cell culture chamber to maintain cell culture conditions (fig. S1A). Fluorescence microscopy was used to select areas in which cells from both cell lines were adjacent (fig. S8, A and B). Then, FD-based AFM imaging, using a PEG-derivatized tip as a control, was performed, providing simultaneously height images, elasticity maps, and adhesion maps (fig. S8, C to E). Height images showed the presence of two adjacent CHO cells with heterogeneous surfaces, regardless of the cell line. Elasticity maps showed a homogeneous stiffness on the top of the cell, while the glass substrate strongly influenced the extracted Young’s modulus between the cells. The adhesion map shows nearly no adhesion (fig. S8, E and F). These experiments demonstrated that we could image adjacent GAG+-mCherry and GAG− cells and that PEG-derivatized AFM tips show no differential and specific affinity for either cell line.
Probing MuHV-4 interactions with live cells
AFM tips functionalized with WT MuHV-4 particles were used to image both cell lines (Fig. 4). Differential interference contrast and fluorescence channels of mixed confluent monolayers of GAG+-mCherry and GAG− cells were used as a guide to select a region of interest that overlaps both cell lines (Fig. 4A, inset). An AFM height image was recorded together with an adhesion map (Fig. 4, A and B), allowing direct comparison of the adhesion properties of each cell line. Repetitive scanning of the same cell surfaces showed similar results in consecutive maps (fig. S9). While GAG+ cells showed high density of adhesion with a low binding force (100 to 200 pN; Fig. 4C), GAG+ cells only show sparse adhesion events with high unbinding forces (>200 pN; Fig. 4C). This observation is in good agreement with our experiments in vitro, showing that WT virions and glycan moieties interact through lower valency interactions. Representative FD curves between WT virions and GAG+ cells showed specific adhesion events, on the retraction curve (Fig. 4D), with unbinding forces ranging from 100 to 400 pN over the range of applied LRs (from ~1 × 10⁵ to 4 × 10⁶ pN s−1) and rupture distances >100 nm accounting for the PEG spacer, the size of the attached viral particle, and the elasticity of the cell surface. The binding frequency on GAG+ and GAG− cells was compared, underlying that WT virions interact more with cell surfaces depleted from glycans, probably due to a higher exposure of GAG-independent receptors (Fig. 4E).
Fig. 4. Probing the role of gp150 in virion-glycan binding on living cells.
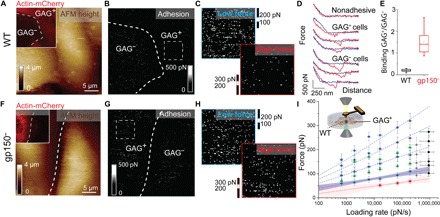
(A) AFM height image of two adjacent CHO cells: a GAG+ (fluorescently tagged) cell and an unlabeled GAG− CHO cell. Inset: 30 μm × 30 μm fluorescent image of both cells. (B) Corresponding adhesion map, showing interactions between WT viral particles and CHO cells. The adhesion intensity is lower in GAG+ cells than in GAG− cells. (C) Zoom on the adhesion map recorded on the GAG+ cell [see dashed square in (B)]. The upper map displayed the low forces (range, 100 to 200 pN), and the lower map showed the higher forces (range, 200–300 pN). (D) Representative FD curves extracted from the adhesion map shown in (B), showing either nonadhesive FD curves on both cell surfaces (black pixels) or adhesion events (white pixels) on GAG+ and GAG− cells. Data are representative of 26 measurements from seven independent experiments. (E) Box plot of the relative binding frequency (GAG+/GAG−) observed for WT and gp150− virions. (F) AFM height image, with fluorescence image in the inset showing two adjacent GAG+ and GAG− cells. (G) Corresponding adhesion map recorded with gp150− virions. gp150− virions bind strongly to GAG+ cells in comparison to WT virions. Data are representative of 15 measurements from six independent experiments. (H) Zoom on the adhesion map recorded on the GAG+ cell [see dashed square in (G)]. The upper map displayed the low forces (range, 100 to 200 pN), and the lower map displayed the higher forces (range, 200–300 pN). (I) DFS plot with data obtained on purified heparin (Fig. 3A), where force distributions between WT virions and GAG+ cells are overlaid. Data in gray and black were obtained at tip oscillation frequencies of 0.125 and 0.250 kHz.
Similarly, the interaction of gp150− particles with CHO cells was probed (Fig. 4, F and G). While gp150− virion binding frequency to GAG− cells is similar to what was found for WT virions, we observed a higher density of adhesion events on GAG+ cells (Fig. 4, E and G). This observation corroborates well with in vitro measurements. Comparison of low and high binding force reveals that gp150− particles interact through higher forces with cell surface glycans (Fig. 4H), as previously observed in vitro.
Finally, WT virion binding forces were extracted from individual FD curves measured on GAG+ cells along with the LR. Force distribution was plotted as histograms and analyzed using the same algorithms. The positions of the peaks were overlaid on the DFS plot obtained in vitro (Fig. 4I), showing a good agreement with binding forces extracted on purified heparin. Together, these results indicate (i) that virions interact with cell surfaces using similar virion-glycan interactions as measured on model surfaces and (ii) that gp150− virions established stronger binding to cell surfaces through interactions of higher valency.
Functional role of gp150 in virus attachment
Next, we wanted to evaluate whether the role of gp150 as the bond multivalency key regulator could be directly observed during virus attachment and release. To test its functional role, we infected CHO cells with either WT or gp150− virions and observed them by transmission electron microscopy (TEM) 48 hours after infection (Fig. 5A). GAG+ CHO cells infected with WT virions showed a cell surface with sparsely distributed virions. In contrast, WT virus particles are rarely associated to GAG− cells, suggesting a poor anchoring. GAG+ CHO cells infected with gp150− virions showed a cell surface covered with very high amounts of bound virions, while GAG− CHO cells infected with gp150− virions showed a cell surface with fewer evenly distributed virions. These observations confirm our AFM results, that is, gp150− virions are more strongly bound with GAGs because of their ability to establish multivalent interactions and therefore reducing their release efficiency. To quantify our TEM observation, we also performed FACS using virions that express a green fluorescent protein (GFP) reporter gene that green-color infected cell. Viral particles were labeled just before FACS using an anti-gN monoclonal antibody (mAb) and an Alexa Fluor 633 secondary antibody (fig. S10). These experiments confirmed that (i) WT virions are more infectious than gp150− virions, meaning that strong attachment does not mean infection; (ii) gp150− virions are more frequently present on GAG+ cells, supporting a higher overall avidity; and (iii) gp150− virions remain more present on infected cells, confirming their poor dissociation from the cell surface.
Fig. 5. Investigation of virus binding and release.
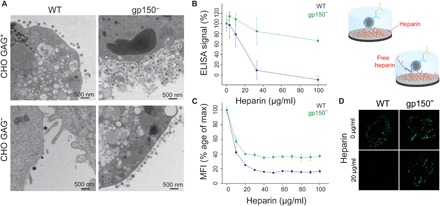
(A) TEM images recorded 48 hours after infection at a multiplicity of infection of 2 using WT and gp150− virions on GAG+ and GAG− cells. (B) ELISA tests monitoring virus binding to heparin-coated surfaces using anti-gN signal and titration using increasing concentration of soluble heparin. (C) Flow cytometry assay of virus binding to cell surfaces in the presence of increasing heparin concentration. MFI, mean fluorescence intensity. (D) Confocal microscopy images of fluorescent-tagged virions binding to cell surfaces in the presence of heparin.
Finally, to show the multivalency importance and the direct role of gp150 as a regulator, we performed a series of ELISA (enzyme-linked immunosorbent assay; Fig. 5B) and flow cytometry assays (Fig. 5C), evaluating the presence of virions bound to heparin-coated and cellular surfaces, respectively. Competition assays were performed with increasing concentration of free heparin. We observed that WT virions were more efficiently released from heparin surfaces at a lower heparin concentration, supporting again the idea that gp150 maintains a low number of bonds during virus attachment, reducing the overall avidity. In contrast, gp150− particles are more strongly attached to surface heparin molecules, as it requires a higher concentration of soluble competitors to release virions from the surface. Similarly, we observed that free soluble heparin was more efficiently blocking the attachment of WT virions to cellular surfaces compared to gp150-deficient particles. This was also illustrated by confocal microscopy images of immobilized cells (Fig. 5D).
DISCUSSION
GAGs are found at the cell surface and in the extracellular matrix, where they interact with a plethora of ligands including growth factors, cytokines, enzymes, bacteria, and viruses. These various ligands show affinity from millimolar to nanomolar values. However, affinity does not indicate selectivity; some low-affinity ligands exhibit high avidity through dimerization (for example, chemokines) or by clustering (for example, fibronectin). We showed here that GAGs provide the first vital foothold for γ-HV after landing at the cellular surface. Our data demonstrated that two viral glycoproteins, presumably gp70 and gH/gL, are involved in direct GAG binding, with one complex being 10-fold less stable (koff = 1.05 ± 0.52 s−1) compared to the second one (koff = 0.09 ± 0.08 s−1; Fig. 3, A and B). We also observed that gp150, another viral glycoprotein, is not directly involved in GAG binding.
Next, we investigated the number of GAG-glycoprotein bonds established during the first millisecond. Force probing of virus binding to GAGs, both in vitro and on living cells, revealed that interactions are limited to lower valency for WT virions in comparison with the gp150− mutant. As it has been shown that the gp150 deficiency did not induce an overexpression of other GAG-binding glycoproteins (fig. S2), the observed binding behavior pleads in favor of a regulator role of gp150 toward GAG binding. By minimizing multivalency between GAGs and viral glycoproteins (11), gp150 could facilitate virus lateral diffusion on the cell membrane, allowing the virus particle to bind and slide or dissociate/reassociate through adjacent binding sites present on GAGs. The multivalency responds to the classical thermodynamic rule; the more receptor molecules are present at the cell surface, the more affinity a virus has for its receptors and the more efficient the primary attachment will be. However, the increased avidity between the virus particle and its receptor could prevent dissociation/reassociation (Fig. 6) and spatially confines the virus particles (28), reducing their chance to find entry receptors and the consecutive cellular infection. Recent studies demonstrated that a number of bonds and diffusion are intimately linked (28, 29). In this context, gp150 could appear as a key element, preventing high valency during virus entry. We hypothesized that gp150, because of its long and heavily glycosylated stalk (11), covers key functional epitopes on other viral glycoproteins and therefore functions as a hindrance to multiple viral bonds to GAGs, acting as a negative regulator of binding.
Fig. 6. Free-energy landscape describing the first binding steps of MuHV-4 and gp150− to cell surfaces.
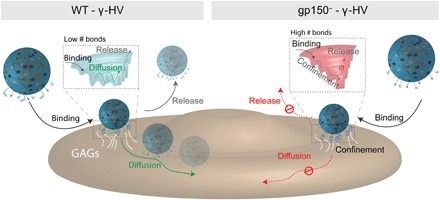
(Left) After landing on the cell surface, the HV particle binds to GAGs. gp150 acts as a binding regulator by maintaining the number of foothold low, enabling the virus to diffuse laterally to seek for specific receptors. (Right) gp150− virion lacking this regulatory element increases its adhesion to cellular surfaces, preventing the virus from lateral diffusion. The multiples bonds, preventing the virus from lateral diffusion and release, kinetically and thermodynamically stabilize the virus.
In addition, regulation of virus binding to the cell membrane appears to be crucial for viral egress. During virion release from cells, particles are associated with cellular surfaces through similar interactions to those encountered during virus entry. To escape from cell surfaces, various strategies have evolved and have been adopted by many viruses such as the cleavage of the interacting sugar moieties at the cell surface [for example, influenza neuraminidase enzyme that degrades sialic acid (30) or induced up-regulation of HS-degrading enzyme by HSV-1 (31)]. It has been previously shown that gp150− virions show a deficit of release from epithelial cells in vitro (11) and in vivo (10). The investigation of the role of gp150 in the present work reveals another type of regulation in which a viral glycoprotein is directly involved, acting as the conductor of the infection and enabling a precise control of the multivalency, that is, a number of bonds sufficiently high to bind the cellular surface but limited to allow the virus to detach from infected cells (Fig. 6).
As recently highlighted, characterization of the very first interaction step between viruses and their receptors has been limited because of the technical challenge (2). Here, we further developed FD-based AFM to directly investigate the dynamics of bond establishment, with an emphasis on the screening of the multivalency of viral interactions with cellular receptors. By force-probing HV binding to mammalian cells, we showed that virus particles bind GAGs through a limited number of bonds, around two to three simultaneous interactions. In this context, GAG chains provide virions with a 3D diffusion pathway (32), increasing the probability of binding specific receptors. An optimum stoichiometry in GAG binding should therefore be achieved to promote an adequate diffusion rate (2). gp150 acts as the key negative regulator to control this number of interactions and to maintain it to a low level. Furthermore, this permits efficient release of newly assembled viral particles, as low valency interactions at the cell surface are more likely overcome by the stochastic binding and unbinding events occurring between virions and GAG moieties.
This work sheds new light on the infection mechanism and on how the virus itself regulates its binding toward controlling the entry and release scenarios and its diffusion at the cell surface. We also hypothesized that the mechanism observed here could be generalized to related glycoproteins or domains of other viral glycoproteins showing regulatory roles such as mucin-like regions of glycoproteins from Ebola virus or Marburg virus. Molecular mechanisms acquired by our nanoscopic approach can facilitate the design of antiviral molecules to impede cell surface interactions and therefore interfere with viral entry. In this context, it appears crucial that anti-adhesive complexes match the size and the multivalent nature of viruses to effectively fight virus infection.
MATERIALS AND METHODS
Viruses
All viruses were derived from a MuHV-4 bacterial artificial chromosome (BAC) (33). The gp150-deficient mutant was previously described (11). The loxP-flanked BAC/eGFP cassette was removed by subsequent growths of the virus in NIH-3T3-CRE cells until eGFP+ cells were no longer visible (34).
Production and purification of MuHV-4 virions
Virus stocks were grown in baby hamster kidney–21 (BHK-21) cells cultured in Dulbecco’s modified Eagle’s medium (Gibco) supplemented with 2 mM glutamine, penicillin (100 U ml−1), streptomycin (100 μg ml−1), and 10% fetal calf serum (FCS). Extracellular virions were purified from the cell supernatant, as previously described (35). Briefly, after removal of the cell debris by low-speed centrifugation (1000g, 10 min at 4°C), virions present in the infected cell supernatant were harvested by ultracentrifugation (100,000g, 2 hours at 4°C) through a 30% (w/v) sucrose cushion. Virions were then banded by isopycnic gradient ultracentrifugation (100,000g, 2 hours at 4°C) in a continuous 20 to 50% (w/v) potassium tartrate gradient in phosphate-buffered saline (PBS). The band containing virions was collected (~3 ml), diluted 10-fold in PBS, and pelleted by ultracentrifugation (100,000g, 2 hours at 4°C). The virion pellet was finally resuspended in PBS, and virus solutions were stored at −80°C. Virus stocks were titrated by plaque assay on BHK-21 cells, as described elsewhere (12).
CHO cell lines
WT (GAG+, CHO K1) CHO cells and mutant deficient in cell surface GAGs (GAG−, CHO PGS A745) were grown in Ham’s F12 nutrient mixture with GlutaMax (Gibco) supplemented with 10% newborn calf serum (NBCS), penicillin (100 U ml−1), and streptomycin (100 μg ml−1) (Sigma) at 37°C in humidified atmosphere supplemented with 5% CO2. To generate a CHO K1 cell line stably expressing actin-mCherry, the sequence encoding actin-mCherry was subcloned into the lentiviral vector pRRLsincPPT-hPGK (36). With a standardized protocol (37), lentiviruses carrying the actin-mCherry transgene were cotransduced to CHO K1 cells. CHO cells expressing mCherry were selected by FACS and propagated in the culture conditions described above.
FACS of transduced cells
CHO K1 cells transduced with the actin-mCherry transgene were trypsinized and collected in PBS with 2 mM EDTA and 1% NBCS. The cells were sorted using a BD FACSARIA III cell sorter, with a nozzle of 85 μm, a sheath pressure of 45 psi, a drop frequency of 47 kHz, and a sort precision of 0-32-0. mCherry was excited with a 561-nm (yellow-green) laser and emission-filtered with a 610/20 band-pass filter collecting wavelengths from 600 to 630 nm. Cells expressing mCherry proteins were sorted and propagated in the culture conditions described above.
Functionalization of AFM tips
To functionalize AFM tips, NHS-PEG27-acetal linkers were used. AFM tips [PeakForce Quantitative Nanomechanical Mapping-Live Cell (PFQNM-LC) and MSCT probes, Bruker] were immersed in chloroform for 10 min, rinsed with ethanol, dried with a stream of filtered nitrogen, cleaned for 10 min in an ultraviolet radiation and ozone cleaner (JetLight), and immersed overnight in an ethanolamine solution [3.3 g of ethanolamine hydrochloride in 6.6 ml of dimethyl sulfoxide (DMSO)]. The cantilevers were then washed three times with DMSO and two times with ethanol, and dried with nitrogen. To ensure a low grafting density of the linker on the AFM tip, 1 mg of acetal-PEG27-NHS was diluted in 0.5 ml of chloroform with 30 μl of triethylamine (17). Ethanolamine-coated cantilevers were immersed for 2 hours in this solution, then washed three times with chloroform, and dried with nitrogen. Next, the cantilevers were immersed for 10 min in 1% citric acid in water, washed three times with water, and dried with nitrogen. An 80-μl aliquot of either MuHV-4 WT or gp150− (~107 to 108 particles ml−1) was thawed and centrifuged at 1677g for 1 min to remove aggregates. Besides removing aggregates, this gentle centrifugation ensured that the remaining virus solution was highly diluted as needed to bind only a few viruses to the functionalized AFM tip. Seventy microliters of virus solution was pipetted onto the tips placed on parafilm (Bemis) in a small plastic dish stored within an icebox. Two microliters of a freshly prepared solution of NaCNBH3 [~6 weight % in 0.1 M NaOH(aq)] was gently mixed into the virus solution, and the cantilever chips gently positioned with their cantilevers extending into the virus drop. The icebox was incubated at 4°C for 1 hour. Then, 5 μl of 1 M ethanolamine solution (pH 8) was gently mixed into the drop to quench the reaction. The icebox was incubated for a further 10 min at 4°C, and the cantilever chips were removed, washed once in ice-cold PBS, and stored in individual wells of a multiwell dish containing 2 ml of ice-cold PBS per well until used in AFM experiments. During these functionalization steps, the virus-functionalized cantilevers were never allowed to dry. Transfer of the functionalized AFM cantilevers to a PBS buffer and then to the AFM was rapid (≤20 s), and during transfer, a drop of PBS buffer remained on cantilever and tip. Cantilevers were used in AFM experiments the same day they were functionalized with the virus. Control experiments using SEM imaging showed that, in most cases, no more than one virus was present at the apex of the AFM tip, which interacts with the cell surface during AFM imaging.
Preparation of heparin surfaces
Gold-coated silicon substrates were incubated overnight at 4°C in a biotinylated bovine serum albumin (BBSA) solution (25 μg/ml; Sigma) in PBS. After rinsing with PBS, the BBSA surfaces were exposed to a streptavidin solution (10 μg/ml; Sigma) in PBS for 2 hours, followed by rinsing with PBS. The BBSA-streptavidin surfaces were finally immersed for 2 hours in a biotinylated heparin solution (10 μg/ml; Sigma) in PBS, followed by PBS rinsing. The surfaces showed a homogeneous and stable morphology under repeated scanning and exhibited a thickness of ~3 nm. The thickness of the deposited layer was estimated by scanning a small area (1 μm × 1 μm) of the surface at high forces to remove the attached biomolecules, followed by imaging larger squares of the same region (5 μm × 5 μm) at a lower force.
FD-based AFM on heparin-coated model surfaces
A NanoScope MultiMode 8 (Bruker) was operated (NanoScope software v9.1) to conduct FD-based AFM. MSCT-D probes [with calculated spring constants, using thermal tune (38), ranging from 0.024 to 0.043 N m−1] were used to record 5 μm × 5 μm arrays of force curves in the force-volume (contact) mode with an approach velocity of 1 μm s−1 and retraction velocities of 0.1, 0.2, 1, 10, and 20 μm s−1, a ramp size of 500 nm, a maximum force of 500 pN, and no surface delay. The sample was scanned using a line frequency of 1 Hz, and 32 pixels were scanned per line (32 lines). All FD-based AFM measurements were conducted in PBS at ~25°C. Force curves were analyzed using the NanoScope analysis software v1.7 (Bruker). To ensure that the analyzed adhesive peaks correspond to adhesion events occurring between particles linked to the PEG spacer and the heparin surface, the retraction curves before bond rupture were fitted with the WLC model for polymer extension (39). The latter expressed the force-extension (F-x) relationship for semiflexible polymers and was described by the following equation, where lP is the persistence length and Lc is the contour length
Origin software (OriginLab) was used to fit histograms of rupture force distributions.
Combined FD-based AFM and fluorescence microscopy on living cells
Correlative images were acquired on an AFM (Bioscope Catalyst and Bioscope Resolve, Bruker) operated in the PeakForce QNM mode (NanoScope software v9.2) to conduct FD-based AFM and were coupled on an inverted epifluorescence microscope (Zeiss Observer Z.1), as previously described (19, 40). The objective used was a 40× air (numerical aperture, 0.95). The AFM was equipped with a 150-μm piezoelectric scanner and a cell culture chamber, as previously described (18). Overview images of cell surfaces (30 μm × 30 μm) were recorded at imaging forces of ~500 pN using PFQNM-LC probes (Bruker) having tip lengths of 17 μm, tip radii of 65 nm, and opening angles of 15°. All fluorescence microscopy and FD-based AFM imaging were performed under cell culture conditions using the combined AFM and fluorescence microscopy chamber (Fig. 1B) at 37°C in Ham’s F12 medium supplemented with 10% NBCS. A gas mixture of synthetic air supplemented with 5% CO2 at 95% relative humidity using a gas humidifier membrane (PermSelect silicone) was blown at 0.1 liter min−1 into the microscopy chamber. The humidity was controlled using a humidity sensor (Sensirion). Cantilevers were first calibrated using the thermal noise method (41), yielding values ranging from 0.036 to 0.132 N m−1 for PFQNM-LC probes. The AFM tip was oscillated in a sinusoidal fashion at 0.125 and 0.25 kHz with a 500-nm amplitude in the PeakForce Tapping mode. The sample was scanned using a frequency of 0.125 Hz and 256 pixels per line (256 lines). AFM images and FD curves were analyzed using the NanoScope analysis software (v1.7, Bruker). Individual FD curves detecting unbinding events between the virus and the cell surface were analyzed using the NanoScope analysis software. The baseline of the retraction curve was corrected using a linear fit on the last 30% of the retraction curve. With the FT curve, the LR (slope) of each rupture event was determined (Fig. 2A). Optical images were analyzed with Zen Blue software (Zeiss).
Western blot analysis of WT and gp150-deficient viral particles
Purified virions were lysed and denatured by heating (95°C, 5 min) in an SDS–polyacrylamide gel electrophoresis (PAGE) sample buffer [31.25 mM tris-HCl (pH 6.8), 1% (w/v) SDS, 12.5% (w/v) glycerol, 0.005% (w/v) bromophenol blue, 2.5% (v/v) 2-mercaptoethanol]. Proteins were resolved by electrophoresis on Mini-PROTEAN TGX (Tris-Glycine eXtended) precast 4 to 15% resolving gels (Bio-Rad) in an SDS-PAGE running buffer [25 mM tris-base, 192 mM glycine, 0.1% (w/v) SDS] and transferred to polyvinylidene difluoride membranes (Immobilon-P transfer membrane, 0.45-μm pore size, Millipore). The membranes were blocked with 3% nonfat milk in PBS/0.1% Tween 20 and then incubated with primary antibody in the same buffer. mAbs T1A1 [recognizing gp150 (11)], 58-16D2 [recognizing gp70 (9)], 2C10 [recognizing gB (42)], and 4A5 [recognizing the viral thymidine kinase (43)] were used as primary antibodies. Bound antibodies were detected with horseradish peroxidase–conjugated rabbit anti-mouse immunoglobulin G polyclonal antibody (pAb), followed by washing in PBS/0.1% Tween 20, development with ECL substrate (GE Healthcare), and exposure to x-ray film.
AFM imaging of MuHV-4 virions adsorbed on mica
A 10-μl droplet of a solution (~108 particles ml−1) of MuHV-4 viral particles in PBS was deposited on a mica substrate and incubated for 1 hour at 4°C. Then, the solvent was replaced by Milli-Q water and allowed to evaporate at 37°C for 1 hour. AFM imaging was performed in the PeakForce Tapping mode using a ScanAsyst-Air tip (nominal spring constant, 0.4 N/m; Bruker). A tip oscillation frequency of 1 kHz was used, with a maximum peak force of 250 pN and a scan rate of 0.25 kHz and displaying 256 pixels per line (256 lines).
SEM of silicon chips and functionalized AFM tips
Viruses were covalently attached to silicon chips using NHS-PEG27-acetal linkers, as described for the functionalization of the cantilevers. The virions were fixed in glutaraldehyde (2%) in PBS for 2 hours, then rinsed with PBS for 5 min, and postfixed in osmium tetroxide 2% (w/v). Afterward, the functionalized tips were rinsed with distilled water and allowed to dehydrate using a graded ethanol series of 30, 50, 75, 90, and, finally, 100% (v/v) (10 min for each step). The solvent was then evaporated at 37°C for 1 hour. Viruses covalently attached to AFM tips were prepared for SEM in the same manner. The nonconductive Si3N4 AFM tips were then sputter-coated with a gold layer of 2 to 5 nm and imaged with SEM (JSM-7600F, JEOL) using an acceleration voltage of 15 kV.
Flow cytometry for attachment and infection assays
MuHV-4 virions were bound to the cells at 4°C, and the cells were then washed three times with ice-cold PBS to remove unbound virions. In some experiments, virions were preincubated at 4°C with heparin (Sigma). Cell surface and intracellular stainings were performed at 4°C on living cells and on fixed and permeabilized cells, respectively. Fixation was achieved by incubating the cells in ice-cold 4% paraformaldehyde in PBS [room temperature (RT), 30 min], followed by three washes in PBS. The cells were then permeabilized with 0.1% Triton X-100 (RT, 30 min) and blocked in PBS containing 10% FCS. Staining was performed using the 3F7 antibody (anti-gN) (44) as the primary antibody (4°C, 45 min) and Alexa Fluor 488–conjugated goat anti-mouse pAb (Invitrogen) as the secondary antibody (4°C, 30 min). For cell surface staining, a viability dye was used to exclude dead cells [eFluor 450 (eBioscience) or propidium iodide (Sigma) at 0.5 μg/ml]. Fluorescence was measured on a Fortessa cytometer (Becton Dickinson), and analysis was performed using FlowJo software.
Confocal microscopy for attachment and infection assays
Cells were seeded overnight onto glass coverslips. MuHV-4 virions were bound to the cells (4°C, 4 hours). The cells were then washed three times with ice-cold PBS to remove unbound virions and then fixed immediately by adding ice-cold 4% formaldehyde in PBS and leaving at RT for 30 min, followed by three washes in PBS. The cells were blocked with 10% FCS in PBS and stained for surface expression of gN by using the 3F7 antibody as the primary antibody (4°C, 45 min) and the Alexa Fluor 488–conjugated goat anti-mouse pAb (Invitrogen) as the secondary antibody (4°C, 30 min). The cells were mounted in ProLong Gold Antifade Mountant with 4′,6-diamidino-2-phenylindole (DAPI) (Life Technologies). Images were acquired on a Leica TCS SP5 confocal laser scanning microscope. Images were analyzed with ImageJ.
TEM of infected cells
Cells were washed with PBS and fixed directly in the dish in a 0.1 M cacodylate buffer (pH 7.4) containing 2.5% glutaraldehyde and 2% paraformaldehyde. The scraped off and pelleted cells were then postfixed in 1% osmium tetroxide and 2% uranyl acetate and Epon blocks, and ultrathin sections were prepared as described (45). Sections were imaged in bright-field mode using a Tecnai Spirit TEM (FEI) with BioTwin lens configuration operating at 120 kV. Micrographs were recorded using a bottom-mounted 4K × 4K charge-coupled device camera (Eagle, FEI).
ELISA test
Streptavidin-coated 96-well plates (catalog no. 15124, Pierce) were incubated (4°C, 2 hours) with heparin-biotin (1 mg ml−1, catalog no. B9806, Sigma), washed with PBS, and blocked in PBS/1% BSA. WT and gp150− MuHV-4 virions (105 plaque-forming units per well) were then bound in the presence of increasing amounts of soluble heparin (catalog no. H3393, Sigma) for 2 hours at 37°C. Plates were washed twice with PBS, and bound virions were detected with a mAb recognizing gN (mAb 3f7) (44). Bound antibodies were detected with alkaline phosphatase–conjugated goat anti-mouse Ig pAb (Sigma). Washing was performed with PBS. p-Nitrophenylphosphate (Sigma) was used as the substrate, and absorbance was read at 405 nm using a Benchmark ELISA plate reader (Thermo Fisher Scientific). Results were expressed as the percentage of absorbance without soluble heparin.
Supplementary Material
Acknowledgments
We thank N. Dauguet for assistance with FACS operation and analysis, R. Newton for the provision of mCherry-encoding lentiviruses, P. G. Stevenson for providing the gp150− virus, M. Pfreundschuh for the help with data analysis, and S. Derclaye for the technical assistance. Funding: This work was supported by the Université catholique de Louvain and University of Liège [Fonds Spéciaux de Recherche (FSR)] and the Fonds National de la Recherche Scientifique (FRS-FNRS). This project has received funding from the European Research Council (ERC) under the European Union’s Horizon 2020 research and innovation programme (grant agreement no. 758224). D.A. is a research associate of the FRS-FNRS. M.D. and C.Z. are research fellows of the FRS-FNRS. Author contributions: M.D., C.Z., J.M., B.M., L.G., and D.A. designed the experiments. C.Z., B.M., and L.G. produced viruses and performed Western blots, ELISA, virus binding, and infection assays. D.A. set up the AFM chamber. M.D. set up and performed AFM experiments and SEM imaging. J.M. performed TEM imaging. M.D., C.Z., J.M., B.M., L.G., and D.A. co-analyzed the experimental and calculated data. All authors wrote the paper. Competing interests: The authors declare that they have no competing interests. Data and materials availability: All data needed to evaluate the conclusions in the paper are present in the paper and/or the Supplementary Materials. Additional data related to this paper may be requested from the authors.
SUPPLEMENTARY MATERIALS
Supplementary material for this article is available at http://advances.sciencemag.org/cgi/content/full/4/8/eaat1273/DC1
Fig. S1. Principle of FD-based AFM to probe HV binding to living animal cells.
Fig. S2. Characterization of MuHV-4 viral particles and validation of tip and surface functionalization.
Fig. S3. Attachment and infection of GAG+ and GAG− CHO cells.
Fig. S4. Exploring a wide range of LRs with FD-based AFM.
Fig. S5. Control experiments showing the specificity of MuHV-4 virus binding toward immobilized heparin.
Fig. S6. Binding force distribution and multipeak Gaussian fit of different LR sets.
Fig. S7. Multipeak Gaussian fit of average rupture forces of gp150− MuHV-4 binding extracted for discrete LRs.
Fig. S8. Principle of combined optical and FD-based AFM imaging of animal cells to extract topography images and quantitative multiparametric maps.
Fig. S9. Consecutive mapping of WT virus binding to CHO cells shows similar results.
Fig. S10. Investigation of virus binding to cells using flow cytometry.
REFERENCES AND NOTES
- 1.Grove J., Marsh M., The cell biology of receptor-mediated virus entry. J. Cell Biol. 195, 1071–1082 (2011). [DOI] [PMC free article] [PubMed] [Google Scholar]
- 2.Boulant S., Stanifer M., Lozach P.-Y., Dynamics of virus-receptor interactions in virus binding, signaling, and endocytosis. Viruses 7, 2794–2815 (2015). [DOI] [PMC free article] [PubMed] [Google Scholar]
- 3.Ehrlich M., Boll W., Van Oijen A., Hariharan R., Chandran K., Nibert M. L., Kirchhausen T., Endocytosis by random initiation and stabilization of clathrin-coated pits. Cell 118, 591–605 (2004). [DOI] [PubMed] [Google Scholar]
- 4.Verma S. C., Robertson E. S., Molecular biology and pathogenesis of Kaposi sarcoma-associated herpesvirus. FEMS Microbiol. Lett. 222, 155–163 (2003). [DOI] [PubMed] [Google Scholar]
- 5.Connolly S. A., Jackson J. O., Jardetzky T. S., Longnecker R., Fusing structure and function: A structural view of the herpesvirus entry machinery. Nat. Rev. Microbiol. 9, 369–381 (2011). [DOI] [PMC free article] [PubMed] [Google Scholar]
- 6.François S., Vidick S., Sarlet M., Michaux J., Koteja P., Desmecht D., Stevenson P. G., Vanderplasschen A., Gillet L., Comparative study of murid gammaherpesvirus 4 infection in mice and in a natural host, bank voles. J. Gen. Virol. 91, 2553–2563 (2010). [DOI] [PubMed] [Google Scholar]
- 7.Gillet L., Colaco S., Stevenson P. G., The murid herpesvirus-4 gH/gL binds to glycosaminoglycans. PLOS ONE 3, e1669 (2008). [DOI] [PMC free article] [PubMed] [Google Scholar]
- 8.Gillet L., Colaco S., Stevenson P. G., Glycoprotein B switches conformation during murid herpesvirus 4 entry. J. Gen. Virol. 89, 1352–1363 (2008). [DOI] [PMC free article] [PubMed] [Google Scholar]
- 9.Gillet L., Adler H., Stevenson P. G., Glycosaminoglycan interactions in murine gammaherpesvirus-68 infection. PLOS ONE 2, e347 (2007). [DOI] [PMC free article] [PubMed] [Google Scholar]
- 10.Zeippen C., Javaux J., Xiao X., Ledecq M., Mast J., Farnir F., Vanderplasschen A., Stevenson P., Gillet L., The major envelope glycoprotein of murid herpesvirus 4 promotes sexual transmission. J. Virol. 91, e00235–e17 (2017). [DOI] [PMC free article] [PubMed] [Google Scholar]
- 11.de Lima B. D., May J. S., Stevenson P. G., Murine gammaherpesvirus 68 lacking gp150 shows defective virion release but establishes normal latency in vivo. J. Virol. 78, 5103–5112 (2004). [DOI] [PMC free article] [PubMed] [Google Scholar]
- 12.Gillet L., May J. S., Colaco S., Stevenson P. G., The murine gammaherpesvirus-68 gp150 acts as an immunogenic decoy to limit virion neutralization. PLOS ONE 2, e705 (2007). [DOI] [PMC free article] [PubMed] [Google Scholar]
- 13.Gillet L., May J. S., Stevenson P. G., In vivo importance of heparan sulfate-binding glycoproteins for murid herpesvirus-4 infection. J. Gen. Virol. 90, 602–613 (2009). [DOI] [PMC free article] [PubMed] [Google Scholar]
- 14.Dufrêne Y. F., Martínez-Martín D., Medalsy I., Alsteens D., Müller D. J., Multiparametric imaging of biological systems by force-distance curve-based AFM. Nat. Methods 10, 847–854 (2013). [DOI] [PubMed] [Google Scholar]
- 15.Alsteens D., Dupres V., Yunus S., Latgé J. P., Heinisch J. J., Dufrêne Y. F., High-resolution imaging of chemical and biological sites on living cells using peak force tapping atomic force microscopy. Langmuir 28, 16738–16744 (2012). [DOI] [PubMed] [Google Scholar]
- 16.Alsteens D., Trabelsi H., Soumillion P., Dufrêne Y. F., Multiparametric atomic force microscopy imaging of single bacteriophages extruding from living bacteria. Nat. Commun. 4, 2926 (2013). [DOI] [PubMed] [Google Scholar]
- 17.Wildling L., Unterauer B., Zhu R., Rupprecht A., Haselgrübler T., Rankl C., Ebner A., Vater D., Pollheimer P., Pohl E. E., Hinterdorfer P., Gruber H. J., Linking of sensor molecules with amino groups to amino-functionalized AFM tips. Bioconjug. Chem. 22, 1239–1248 (2011). [DOI] [PMC free article] [PubMed] [Google Scholar]
- 18.Alsteens D., Newton R., Schubert R., Martinez-Martin D., Delguste M., Roska B., Müller D. J., Nanomechanical mapping of first binding steps of a virus to animal cells. Nat. Nanotechnol. 12, 177–183 (2017). [DOI] [PubMed] [Google Scholar]
- 19.Newton R., Delguste M., Koehler M., Dumitru A. C., Laskowski P. R., Müller D. J., Alsteens D., Combining confocal and atomic force microscopy to quantify single-virus binding to mammalian cell surfaces. Nat. Protoc. 12, 2275–2292 (2017). [DOI] [PubMed] [Google Scholar]
- 20.Schowalter R. M., Pastrana D. V., Buck C. B., Glycosaminoglycans and sialylated glycans sequentially facilitate Merkel cell polyomavirus infectious entry. PLOS Pathog. 7, e1002161 (2011). [DOI] [PMC free article] [PubMed] [Google Scholar]
- 21.Lee G. U., Kidwell D. A., Colton R. J., Sensing discrete streptavidin biotin interactions with atomic force microscopy. Langmuir 10, 354–357 (1994). [Google Scholar]
- 22.Dupres V., Menozzi F. D., Locht C., Clare B. H., Abbott N. L., Cuenot S., Bompard C., Raze D., Dufrêne Y. F., Nanoscale mapping and functional analysis of individual adhesins on living bacteria. Nat. Methods 2, 515–520 (2005). [DOI] [PubMed] [Google Scholar]
- 23.Merkel R., Nassoy P., Leung A., Ritchie K., Evans E., Energy landscapes of receptor-ligand bonds explored with dynamic force spectroscopy. Nature 397, 50–53 (1999). [DOI] [PubMed] [Google Scholar]
- 24.E. Evans, P. Williams, Dynamic force spectroscopy, in Physics of Bio-Molecules and Cells, H. Flyvbjerg, F. Jülicher, P. Orms, F. David, Eds. (Springer-Verlag, 2002), pp. 145–204. [Google Scholar]
- 25.Evans E., Ritchie K., Dynamic strength of molecular adhesion bonds. Biophys. J. 72, 1541–1555 (1997). [DOI] [PMC free article] [PubMed] [Google Scholar]
- 26.Evans E. A., Calderwood D. A., Forces and bond dynamics in cell adhesion. Science 316, 1148–1153 (2007). [DOI] [PubMed] [Google Scholar]
- 27.Rux A. H., Lou H., Lambris J. D., Friedman H. M., Eisenberg R. J., Cohen G. H., Kinetic analysis of glycoprotein C of herpes simplex virus types 1 and 2 binding to heparin, heparan sulfate, and complement component C3b. Virology 294, 324–332 (2002). [DOI] [PubMed] [Google Scholar]
- 28.Ewers H., Smith A. E., Sbalzarini I. F., Lilie H., Koumoutsakos P., Helenius A., Single-particle tracking of murine polyoma virus-like particles on live cells and artificial membranes. Proc. Natl. Acad. Sci. U.S.A. 102, 15110–15115 (2005). [DOI] [PMC free article] [PubMed] [Google Scholar]
- 29.Ewers H., Römer W., Smith A. E., Bacia K., Dmitrieff S., Chai W., Mancini R., Kartenbeck J., Chambon V., Berland L., Oppenheim A., Schwarzmann G., Feizi T., Schwille P., Sens P., Helenius A., Johannes L., GM1 structure determines SV40-induced membrane invagination and infection. Nat. Cell Biol. 12, 11–18 (2010). [DOI] [PubMed] [Google Scholar]
- 30.Air G. M., Laver W. G., The neuraminidase of influenza virus. Proteins 6, 341–356 (1989). [DOI] [PubMed] [Google Scholar]
- 31.Hadigal S. R., Agelidis A. M., Karasneh G. A., Antoine T. E., Yakoub A. M., Ramani V. C., Djalilian A. R., Sanderson R. D., Shukla D., Heparanase is a host enzyme required for herpes simplex virus-1 release from cells. Nat. Commun. 6, 6985 (2015). [DOI] [PMC free article] [PubMed] [Google Scholar]
- 32.Sarrazin S., Lamanna W. C., Esko J. D., Heparan sulfate proteoglycans. Cold Spring Harb. Perspect. Biol. 3, a004952 (2011). [DOI] [PMC free article] [PubMed] [Google Scholar]
- 33.Adler H., Messerle M., Wagner M., Koszinowski U. H., Cloning and mutagenesis of the murine gammaherpesvirus 68 genome as an infectious bacterial artificial chromosome. J. Virol. 74, 6964–6974 (2000). [DOI] [PMC free article] [PubMed] [Google Scholar]
- 34.Adler H., Messerle M., Koszinowski U. H., Virus reconstituted from infectious bacterial artificial chromosome (BAC)-cloned murine gammaherpesvirus 68 acquires wild-type properties in vivo only after excision of BAC vector sequences. J. Virol. 75, 5692–5696 (2001). [DOI] [PMC free article] [PubMed] [Google Scholar]
- 35.Vidick S., Leroy B., Palmeira L., Machiels B., Mast J., François S., Wattiez R., Vanderplasschen A., Gillet L., Proteomic characterization of murid herpesvirus 4 extracellular virions. PLOS ONE 8, e83842 (2013). [DOI] [PMC free article] [PubMed] [Google Scholar]
- 36.Sorce B., Escobedo C., Toyoda Y., Stewart M. P., Cattin C. J., Newton R., Banerjee I., Stettler A., Roska B., Eaton S., Hyman A. A., Hierlemann A., Müller D. J., Mitotic cells contract actomyosin cortex and generate pressure to round against or escape epithelial confinement. Nat. Commun. 6, 8872 (2015). [DOI] [PMC free article] [PubMed] [Google Scholar]
- 37.Salmon P., Trono D., Production and titration of lentiviral vectors. Curr. Protoc. Hum. Genet. Chapter 12, Unit 12.10 (2010). [DOI] [PubMed] [Google Scholar]
- 38.Butt H.-J., Jaschke M., Calculation of thermal noise in atomic-force microscopy. Nanotechnology 6, 1–7 (1995). [Google Scholar]
- 39.Bustamante C., Marko J. F., Siggia E. D., Smith S., Entropic elasticity of lambda-phage DNA. Science 265, 1599–1600 (1994). [DOI] [PubMed] [Google Scholar]
- 40.Knoops B., Becker S., Poncin M. A., Glibert J., Derclaye S., Clippe A., Alsteens D., Specific interactions measured by AFM on living cells between peroxiredoxin-5 and TLR4: Relevance for mechanisms of innate immunity. Cell Chem. Biol. 25, 550–559.e3 (2018). [DOI] [PubMed] [Google Scholar]
- 41.Hutter J. L., Bechhoefer J., Calibration of atomic-force microscope tips. Rev. Sci. Instrum. 64, 1868–1873 (1993). [Google Scholar]
- 42.Gillet L., Stevenson P. G., Antibody evasion by the N terminus of murid herpesvirus-4 glycoprotein B. EMBO J. 26, 5131–5142 (2007). [DOI] [PMC free article] [PubMed] [Google Scholar]
- 43.Gill M. B., May J. S., Colaco S., Stevenson P. G., Important role for the murid herpesvirus 4 ribonucleotide reductase large subunit in host colonization via the respiratory tract. J. Virol. 84, 10937–10942 (2010). [DOI] [PMC free article] [PubMed] [Google Scholar]
- 44.May J. S., Colaco S., Stevenson P. G., Glycoprotein M is an essential lytic replication protein of the murine gammaherpesvirus 68. J. Virol. 79, 3459–3467 (2005). [DOI] [PMC free article] [PubMed] [Google Scholar]
- 45.Mast J., Nanbru C., van den Berg T., Meulemans G., Ultrastructural changes of the tracheal epithelium after vaccination of day-old chickens with the La Sota strain of Newcastle disease virus. Vet. Pathol. 42, 559–565 (2005). [DOI] [PubMed] [Google Scholar]
Associated Data
This section collects any data citations, data availability statements, or supplementary materials included in this article.
Supplementary Materials
Supplementary material for this article is available at http://advances.sciencemag.org/cgi/content/full/4/8/eaat1273/DC1
Fig. S1. Principle of FD-based AFM to probe HV binding to living animal cells.
Fig. S2. Characterization of MuHV-4 viral particles and validation of tip and surface functionalization.
Fig. S3. Attachment and infection of GAG+ and GAG− CHO cells.
Fig. S4. Exploring a wide range of LRs with FD-based AFM.
Fig. S5. Control experiments showing the specificity of MuHV-4 virus binding toward immobilized heparin.
Fig. S6. Binding force distribution and multipeak Gaussian fit of different LR sets.
Fig. S7. Multipeak Gaussian fit of average rupture forces of gp150− MuHV-4 binding extracted for discrete LRs.
Fig. S8. Principle of combined optical and FD-based AFM imaging of animal cells to extract topography images and quantitative multiparametric maps.
Fig. S9. Consecutive mapping of WT virus binding to CHO cells shows similar results.
Fig. S10. Investigation of virus binding to cells using flow cytometry.