

Abstract
Cells in a multicellular organism fulfill specific functions by enacting cell type specific programs of gene regulation. Single cell RNA sequencing technologies have provided a transformative view of cell type specific gene expression, the output of cell type specific gene regulatory programs. This review will discuss new single cell genomic technologies that complement single cell RNA-seq by providing additional readouts of cellular state beyond the transcriptome. We will highlight regression models as a simple yet powerful approach to relate gene expression to other aspects of cellular state; and in doing so, gain insights into the biochemical mechanisms that are necessary to produce a given gene expression output.
Successes and limitations of sc-RNA-seq and pseudotemporal analysis
Single cell RNA sequencing (sc-RNA-seq) methods have allowed biologists to produce “molecular atlases” of gene expression [1–19] that comprehensively catalog the repertoire of cell types present in a tissue, or even a whole organism. These atlases have given us an unprecedented view into what each cell in a organism is doing at a given time. But the question of why a cell adopted one state and not another is difficult to answer with sc-RNA-seq alone. This review will discuss new experimental methods that complement sc-RNA-seq by providing readouts of additional aspects of cellular state beyond the transcriptome, and analytical methods that use this “multi-omic” data to try to identify causal factors that regulate cell state dynamics. Most of these methods are still in a proof-of-concept stage, needing additional technical development before being suitable for wider use. We will therefore focus less on the biological settings the methods have been applied to and more on how the data from each method, in theory, might fit into a statistical model of gene regulation.
The idea of using single cell data to gain insights into gene regulation precedes the development of multi-omic methods. In 2014, two software packages, Monocle [20] and Wanderlust [21], independently introduced the concept of “pseudotemporal analysis”, in which sc-RNA-seq data is collected for a population of cells undergoing a dynamic biological process, and then computationally ordered into a trajectory that reflects the continuous changes in gene expression that occur from the beginning to the end of the process. Pseudotime trajectories allow one to identify genes that are differentially expressed (DE; see Glossary) over the course of the biological process and cluster them based on their expression dynamics (i.e. genes with increasing, decreasing, or transient expression patterns). Identifying DE genes with known regulatory function, such as transcription factors, can help prioritize follow-up experiments. For example, the original Monocle paper [20] identified candidate regulators of myogenesis based on pseudotime DE gene analysis and validated these candidates using RNAi.
Pseudotemporal analysis has been refined by methods including Monocle 2 [22], DPT [23], Wishbone [24], SLICER [25], and URD [18], which allow one to infer branches in pseudotime. Branches in pseudotime correspond to “decision points” in which a cell decides to progress towards one or two mutually exclusive fates. Branched pseudotime inference has been successfully applied to complex biological processes such as hematopoietic development [22] and zebrafish embryogenesis [18]. Methods such as WADDINGTON-OT [26], RNA velocity analysis [27], topological data analysis [28], and Monocle 3 (est. release summer 2018) generalize pseudotime even further to support modeling trajectories in which cells may cycle through recurrent intermediate states before terminally differentiating.
The main limitation of pseudotemporal analysis of sc-RNA-seq data lies in the difficulty in identifying the causal factors that push a cell towards one lineage on a trajectory vs. another. A fate decision may correlate with the expression of many lineage-specific transcription factors, making the relative importance of these factors unclear. Moreover, the expression of lineage-specific transcription factors is often not sufficient to establish a robust differentiation process. Experiments with direct reprogramming of fibroblasts to other lineages [29–32] have shown that to achieve efficient reprogramming, a suitable cell signaling context is necessary to potentiate the effects of lineage-specific TFs. When we apply sc-RNA-seq and pseudotime analysis to in vivo systems, we can observe the result of a cell’s gene regulatory network transducing signals from its environment: the cell appears to traverse a smooth gradient of gene expression, which has been compared to the “epigenetic gradient” of Waddington’s landscape [26,27]. But we do not directly observe the structure of the gene regulatory network, or the set of signals the cell has received.
The promise of single cell multi-omic assays is that by modeling the statistical relationships between different aspects of a cell’s genetic and epigenetic state, we will be able to nail down specific causal factors that regulate the cell fate decisions that one can see in a pseudotime trajectory. We will discuss four main families of assays. CRISPR knockout screens measure the impact of gene loss of function on gene expression and enable the mapping of gene regulatory networks. Methods for paired quantitation of protein epitopes and RNAs allow one to correlate the state of cell signaling proteins with gene expression. Single cell ATAC-seq measures chromatin accessibility, which when integrated with transcriptomic data and sequence analysis, can identify DNA elements important for cis-regulation. Lastly, single molecule FISH and related methods can put gene expression in context of spatial position within a tissue section.
In our discussion of these four families of multi-omic assays, we will emphasize statistical regression as a simple yet powerful means to integrate the diverse data types they produce into quantitative models of gene regulation. The approach of directly regressing multiple readouts of cellular state against each other is made possible by the enormous sample size of single cell assays, in which every cell provides an independent observation of the state of a gene regulatory network. We anticipate that the engine of statistical regression, fueled by single cell multi-omic data, will in the coming years enable the construction of comprehensive models of regulatory interactions between genes, proteins, non-coding DNA elements, and cell communities.
Outlining the architecture of signaling pathways with CRISPR screens
In development, signaling pathways such as BMP/TGF-β, Wnt, Notch, and Hedgehog are used pleiotropically across tissues and lineages to regulate cell fate decisions. These pleiotropic capabilities were highlighted by [33], who used sequential combinations of activating and inhibition of BMP, Wnt, and Notch signaling to differentiate human pluripotent stem cells into twelve mesodermal lineages. The competency of a cell to enact a lineage-specific response to a ubiquitously used signaling pathway is established by a variety of factors. A cell could, for example, express a specific subset of a family of related receptor proteins [34]; express lineage specific transcription factors that physically interact with signal transducing transcriptional co-factors [35]; or restrict nuclear receptor binding to specific genomic locations that have a pre-accessible chromatin state [36,37].
The most straightforward way to show that a gene has a causal role in making a cell competent to respond to a signal, drug, or other perturbation is to show that loss of gene function (LoF) results in an abnormal response. This basic principle can be scaled to screen almost every gene in a genome using RNA interference [38], CRISPR-induced indels [39], or CRISPR-mediated epigenetic repression (CRISPRi) [40,41]. A caveat to these methods is that they do not produce complete loss of function phenotypes. CRISPR will only make loss of function edits on both alleles in a minority of cells; and with RNAi and CRISPRi, gene expression is knocked down with variable efficiency. Even the phenotype of a bona fide loss of function mutant can be variable due to incomplete penetrance. A high-throughput LoF screen is only interpretable if paired with a statistical model to assess the significance of a putative LoF phenotype.
Until recently, most large-scale LoF screens involved measuring a single quantitative metric, e.g. the amount of fluorescence from a reporter gene or the fold change in cell count after a drug selection. A natural way to model such data is a regression model in which the quantitative phenotype is a linear function of the “genotype” (which genes are knocked down/out in an experiment or in a single cell). LoF in a gene can be considered to have a significant effect on the phenotype if the regression coefficient for that gene is significantly different from zero.
Recently, CRISPR LoF screens have been paired with single cell RNA-seq to give a multivariate, transcriptomic readout [41–45]. The data produced by these methods can also be interpreted using a phenotype ~ genotype regression model (Fig. 1a). In this model, the response is a matrix: rows correspond to cells in the experiment, columns correspond to genes, and the entries in the matrix are log counts of number of mRNA molecules observed for a given gene in a given cell. Correspondingly, there is now a matrix of regression coefficients: each coefficient βij represents the effect of LoF in gene j on the expression of gene i. A coefficient βij < 0 indicates non-functional gene j results in reduced expression of gene i, and therefore suggests that gene j has a role in activating gene i. A coefficient βij > 0 suggests that gene j inhibits gene i.
Figure 1. Regression modeling for CRISPR loss of function screens.

a) A simplified version of Dixit et al.’s [42] regression model for analyzing CRISPR loss of function (LoF) screen data with a single cell RNA-seq readout. Gene expression, measured by log counts of unique molecular identifiers (UMIs) constitutes a cell’s phenotype, while observations of which sgRNAs were received by each cell serve as a proxy for the cell’s genotype of CRISPR edits. The regression coefficient matrix β represents the effects of LoF in the sgRNA target genes on downstream gene expression. The model is fit using LASSO (l1-regularized) regression, which encourages the coefficient matrix to be sparse (containing only a limited number of non-zero entries). In practice, the genotype and regression coefficient matrices are typically augmented with columns for experimental covariates, such as a biological replicate id, and cell-specific covariates, such as cell cycle status. Another potential adjustment to the model is to first cluster cells using a dimensionality reduction technique such as t-stochastic neighbor embedding (t-SNE) and then simplify the phenotype matrix to encode the assignment of cells to clusters instead of full gene expression profiles. b) Schematic of the CROP-seq [45] vector, which avoids the barcode swapping problem encountered by most other CRISPR screen vectors. The sgRNA is transcribed by RNA pol III from a U6 promoter. The U6 promoter and sgRNA are placed within the 3′ UTR of a puromycin resistance gene, which is transcribed by RNA pol II from an EF-1α promoter. This mRNA is recovered by sc-RNA-seq, allowing the set of sgRNAs received by each cell to be recorded. This is only a proxy for the cell’s true genotype however, as Cas9 is not guaranteed to make a loss of function edit on both alleles of a target site. c) Interpretation of the regression coefficients. If LoF in gene X decreases expression of gene Y, then functional gene X activates gene Y, and vice versa.
Several methods for analyzing CRISPR LoF sc-RNA-seq data were recently developed by Dixit et al. [42] and applied them to investigate the role of transcription factors in bone marrow dendritic cell response to LPS stimulation. After setting up a phenotype ~ genotype regression model as described above, hierarchical clustering was applied to the regression coefficient matrix. Clustering identified “modules” of transcription factors with similar LoF phenotypes, and modules of co-regulated target genes, which they associated with biological pathways using Gene Ontology enrichment analysis [46]. This allowed the results of the experiment to be intuitively summarized as a graph of activation and inhibition relationships between TF modules and target gene modules.
CRISPR LoF screens in which two or more genes per cell are knocked out could potentially allow one to identify and quantify genetic interactions. A phenotype ~ genotype regression model could include interaction terms between genotype terms. Interaction terms could be used to identify genes that are part of a common pathway (interaction term < 0, indicating that the combined effect is less than the sum of the individual effects), or genes that have redundant functions (individual effects ~= 0 but interaction term > 0).
Several published combinatorial CRISPR screens have identified synthetic lethal genetic interactions by measuring changes of sgRNA barcode abundances before and after a cell population is expanded in culture, often in the context of a drug selection [47–50]. The exponential nature of cell growth allows even small changes of cellular fitness to result in significant differences in sgRNA barcode abundances. In principle, single-cell CRISPR screens performed at large enough scale could be used to test all pairwise or even higher-order mutants from a library of candidate genes, potentially even without a phenotypic selection. Realizing this goal will require further improvements to the technique..
Accurately genotyping each cell is crucial to assessing the effect of mutations on molecular phenotype. In most published methods for CRISPR LoF screens with a sc-RNA-seq readout, sgRNAs are expressed on a plasmid from one promoter, and a barcode linked to the sgRNA during cloning is expressed from a different promoter as part of an mRNA. However, it was found that recombination between the sgRNA and the barcode can break the genotype to phenotype linkage, reducing statistical power [51]. One protocol, CROP-seq [45], avoids this problem by expressing the sgRNA from a promoter placed within the UTR of an mRNA (Fig. 1b), allowing it to be read out directly in sc-RNA-seq data. However, CROP-seq’s design precludes the vector from co-expressing multiple sgRNAs, which may constrain screens of higher order combinations of mutations.
Another problem is CRISPR cuts that do not always result in gene LoF. Suppose the probability of an edit causing LoF on one allele is p = ⅔ and a cell receives a sgRNA for two genes. The cell will be recorded as having a LoF genotype for both genes, but the chance that the cell will actually get a homozygous knockout for both genes is only p4 ≈ 20%. There is also a 2p2(1-p)2 + 4p(1-p)3 + (1-p)4 = 21% chance that the cell will have no LoF alleles for at least one of the two targeted genes. One study [42] used an expectation-maximization procedure to try to impute which cells got LoF edits vs. non-LoF edits. While this procedure was successful in increasing their signal-to-noise ratio, it may lead to over-estimated regression coefficients in a scenario where a bona fide LoF has incomplete penetrance. Optimized sgRNA libraries for CRISPRi [52] may offer a solution to this problem by producing more reliable LoF than CRISPR cuts. However, to our knowledge, a head-to-head comparison of CRISPRi vs. CRISPR-cut has not yet been published.
Paired protein and transcriptomic readouts using antibody-conjugated oligos
Gene regulatory networks are mediated by the proteins those genes encode. Proteomic methods that give a readout of protein abundance and state (i.e. the abundance of phosphorylated epitopes) can give key insights into the biochemical mechanisms that underlie the statistical properties of a gene regulatory network. For example, mass cytometry [53], a system that combines antibody labeling with mass spectrometry to enable protein epitope quantification in single cells, has been leveraged to perform de novo statistical inference of signaling pathway architecture [54,55]. Systems based on mass spectrometry however require a different experimental apparatus and technical skill-set from those based on DNA sequencing, which has impeded the integration of genomic and proteomic methods. To work around this technical gap, several groups have developed assays to quantify protein epitope abundances in single cells using DNA sequencing, and in tandem quantify RNA abundances for the same single cells.
In CITE-seq [56] and REAP-seq [57], antibodies are conjugated to single stranded oligonucleotides that contain a barcode for the antibody. These oligos are then reverse transcribed as part of standard sc-RNA-seq protocols, allowing antibody barcodes to be quantified as part of a transcriptomic readout. While these methods could potentially be used to quantify phospho-epitopes, the CITE-seq and REAP-seq papers did not directly demonstrate the capability. A similar antibody-conjugated-oligo system, ID-seq, was developed and used to profile the effects of ~300 kinase inhibitors on the abundance of 70 phospo-epitopes in the context of epidermal stem cell response to EGFR signaling [58]. This study was at the level of cell populations, not single cells, but it is an impressive proof-of-concept nevertheless. Applying even simple regression models to such data could yield insights into the organization of signaling pathways. Coupled with a genetic LoF screen, more complex machine learning techniques, such as Nested Effects Models [59], might be able to accurately and automatically reconstruct them from phospho-epitope quantification data (see Outstanding Questions).
Interrogating chromatin state at single cell resolution
Chromatin state at non-coding DNA elements provides another key biochemical mechanism by which a cell establishes its gene regulatory network. A cell’s response to signaling inputs is in large part determined by pre-existing chromatin state. So-called “pioneer” transcription factors (TFs), named for their ability to bind to closed, nucleosome-bound chromatin and make it accessible to other TFs [60], are a minority amongst the repertoire of TFs expressed in a cell. Other TFs, including effectors of signaling pathways such as the glucocorticoid receptor, predominantly bind to accessible chromatin [36,61,62]. Studies on “dynamic assisted loading” [37,63,64], a process in which TFs co-operate stochastically to displace nucleosomes, have shown that the “pioneer”/“settler” distinction is an simplification of reality; however, there remains substantial evidence that in processes such as myogenesis [65–67], adipogenesis [68], and hematopoiesis [69–72], binding of lineage-specific TFs is dependent on accessible chromatin states having been established in advance by more general TFs that are expressed in multiple lineages.
Sequencing based assays for interrogating chromatin state have the potential to accelerate the process of developing mechanistic models for gene regulation, but several technological hurdles remain. Ideally, an experimenter should be able to 1) quantify the temporal dynamics of chromatin state in a biological process; 2) relate chromatin state changes to transcription factor binding; and 3) relate chromatin state changes to gene expression.
DNase-seq [73], ATAC-seq [74,75], and THS-seq [76] assays enable chromatin accessibility to be profiled genome-wide, and ChIP-seq targeting histone modifications can provide additional information, e.g. to distinguish active from poised enhancers [77]. In some cases, the temporal dynamics of chromatin state could be profiled with a simple time series of bulk assays. Bulk assays however will convolute the dynamics of different cell types if used to profile a heterogenous cell community. They can also be misleading for systems in which cells differentiate asynchronously, as population-level dynamics will not reflect the sequence of chromatin state changes that an individual cell goes through.
Just as single cell RNA-seq has resolved such problems for gene expression analysis, single cell ATAC-seq [78,79] and single cell THS-seq [7] hold the potential to resolve them for chromatin accessibility analysis. These methods have already been applied to resolve cell types from heterogeneous tissues [7,80,81] and to reconstruct pseudotemporal trajectories of chromatin state change during differentiation [82,83]. First-generation single-cell assays for chromatin accessibility could be substantially improved in several ways. One method [79] relies on Fluidigm microfluidics that can only process on the order of hundreds of cells per experiment. Other methods [7,78] handle thousands of cells per experiment, but each cell’s chromatin accessibility profile is more sparsely sampled (sparse coverage can be mitigated by aggregating cells with similar accessibility profiles). Commercial kits have not yet been released for single-cell chromatin assays (10X Genomics has announced one in development at the AGBT 2018 conference), and analysis algorithms that exploit single-cell accessibility data are only starting to appear. Despite these challenges, the potential utility of these assays for quantitatively modeling gene regulation is tremendous.
A bulk or single cell ATAC-seq time series experiment can identify genomic sites that change in accessibility over time. Having identified such sites, a natural question to ask is which transcription factors are causing the chromatin state to change? One way to model this is as a simple logistic regression [82]: predict whether a site’s accessibility will increase, decrease, or remain unchanged on the basis of features associated with the site (Fig. 2a). Ideally, these features would be direct measurements of TF binding. ChIP-seq TF profiling is expensive and requires large numbers of cells however. CUT&RUN [84], a new protocol that maps TF binding events using antibody-guided MNase digestion, requires fewer cells and lower sequencing depth than ChIP-seq; but it still requires a separate antibody and experiment for each TF one wants to examine.
Figure 2. Regression modeling for single cell ATAC-seq.

a) Sites that feature differential chromatin accessibility between sub-populations of cells in a sc-ATAC-seq experiment can be identified using pseudotime analysis or other dimensionality reduction methods. A classification model can then be used to identify sequence features that are predictive of a site being differentially accessible. Potential classifiers include a simple logistic regression model that uses transcription factor binding motifs from a database as its features, or a more complex convolutional neural network model that learns sequence features de novo. b) Data from Pliner et al. [82] suggested that distal regulatory elements and gene promoters that are accessible in the same single cells in sc-ATAC-seq data are statistically more likely to be proximal to each other in 3D space that element pairs with uncorrelated accessibility patterns. Pliner et al. developed an algorithm, Cicero, that uses co-accessibility patterns in sc-ATAC-seq data to infer the target promoters of distal regulatory elements. These distal-to-promoter links can also be directly measured using assays such as ChIA-PET [89–91], promoter capture HiC [92–94], and HiChIP [95,96]. c) Given a map of distal element to promoter links, one could construct a regression model that predicts gene expression based on sequence features in a gene’s promoter and distal element “neighborhood.”
An alternative to using TF binding profiles to predict chromatin accessibility dynamics is to use computational predictions of TF binding based on DNA sequence. In our experience, TF binding imputed from sequence motifs (position weight matrices) is a mediocre predictor of chromatin state changes, and limited by the fact that many TFs have the exact same motif. More advanced methods for predicting TF binding, such as gapped kernel SVMs [85,86] or convolutional neural networks (CNNs) [87,88] may substantially improve our ability to explain chromatin state dynamics.
Quantitative models of chromatin state are a stepping stone towards models of gene expression, the ultimate “output” of the various biochemical events that occur around regulatory DNA. In vertebrates, the prevalence of distal regulatory sites is a major impediment to models of gene expression, as distal site to target gene relationships are difficult to predict. Promoter-to-distal-site contacts can be directly quantified using assays such as ChIA-PET [89–91], promoter capture HiC [92–94], and HiChIP [95,96]. HiChIP is a promising technology that dramatically reduces the input number of cells required compared to ChIA-PET and promoter capture HiC (~100k compared to ~10 million or more).
An alternative approach was recently developed in which an algorithm, Cicero [82], is used to computationally predict connections between promoters and distal sites based on patterns of co-accessibility (Fig. 2b) in single cell ATAC-seq data. We believe this method may enable the reconstruction of cis-regulatory landscapes in heterogeneous tissue samples. As a proof-of-concept, Cicero was used to map cis-regulatory landscapes in the context of myoblast differentiation. Using these maps, a regression model was trained in which changes in gene expression were predicted based on sequence motifs in the gene promoter and at linked distal sites (Fig. 2c). Integrating distal sites into the model more than doubled the proportion of variance explained, and the motifs that were most predictive of expression changes were those of known myogenic TFs such as MYOD, MEF2C, and MEIS1.
We envision that future experiments will integrate sophisticated TF binding prediction, high quality promoter-to-distal-site maps, and large-scale sc-ATAC-seq datasets to develop regression models that can predict gene expression dynamics and attribute them to transcription factor activity at specific sequences of regulatory DNA. Early work on “co-assays” that measure “inputs” such as chromatin accessibility along with the “output” of gene or protein expression in the same single cells could dramatically improve the power and accuracy of such models compared to methods that integrate data separate experiments. Currently two such methods, scNMT-seq [97] and Pi-ATAC [98], exist, but it is limited by low throughput. A sufficiently advanced model of gene regulation would implicitly learn the “combinatorial logic” that relates TF protein-protein interactions to expression outputs and allows widely-expressed TFs to regulate tissue specific genes. Such a model would also allow one to perform in silico mutagenesis experiments to predict the functional impacts of non-coding human genetic variation [88,99–101]. Follow-up validation of candidate enhancers with genetic deletions or CRISPRi [96,102–104] would of course be essential.
Single cell assays also exist for other epigenetic features in addition to chromatin accessibility. Single cell bisulfite sequencing [105–108] profiles DNA methylation across whole genomes, and has recently adapted to support high throughputs using combinatorial indexing [109]. Since they profile the whole genome, these methods are expensive and require deep sequencing. In the latter study [109], the mean coverage of mappable CpG dinucleotides is 1.1% given a mean unique aligned read count per cell of >400,000. Other single cell methods include single cell ChIP-seq [110], which is limited by even greater sparsity than sc-ATAC (~1,000 unique reads/cell vs. ~10,000 for sc-ATAC), and single cell Hi-C [111–115], which is well suited for answering questions about 3D genome structure at the megabase scale, but is less suitable (due to lack of resolution) for characterizing individual gene loci.
Relating single cell states to environmental context
The single cell assays discussed so far provide a wealth of tools for investigating how cells enact a response to a developmental or environmental signal. In many contexts however, we don’t know what the most important signaling ligands are, or which cells are producing them. Organoid models [116,117] can provide a controlled environment for investigating cell signaling in development. Most organoid systems involve stimulating pluripotent stem cells (PSC) with signaling agonist/inhibitor molecules that mimic morphogen gradients in early development. What makes an organoid an organoid however is that once primed by this initial exogenous signaling, the cells, given suitable culture conditions, self-organize into organ-like structures that contain cells differentiated into multiple distinct lineages. sc-RNA-seq has been used to characterize the resulting heterogeneous cell populations [118–121].
Camp et al. [120] provide a model for how to follow up an observational sc-RNA-seq experiment to gain mechanistic insights into cell signaling. They made liver bud organoids by co-culturing hPSC-derived hepatic endoderm cells with mesenchymal and endothelial cells, and showed with sc-RNA-seq that the development of hepatocytes in the organoid more closely resembled in vivo hepatogenesis than homotypic differentiation of hPSCs into hepatocytes. They then compared the signaling receptors and ligands expressed in each of the three cell types in the organoid to perform an in silico screen for potential cross-lineage signaling events. The predictions were validated with a multiplexed chemical screen in which miniaturized organoids were exposed to signaling inhibitors and the ratio of hepatic to endothelial cells measured using confocal imaging. This screen confirmed that inhibition of several pathways predicted in silico to be involved in cross-lineage communication affected hepatic differentiation.
Profiling single cell transcriptomes with RNA fluorescence in-situ hybridization (RNA FISH) allows for analyses of signaling interaction between cell types to be performed in a native biological context. Unlike sequencing, RNA FISH can be applied directly to tissue sections without cell dissociation. New protocols such as MERFISH [122] and seqFISH [123] have scaled RNA FISH to profile hundreds of RNAs in the same experiment, enabling high-throughput quantification of signaling ligands, receptors, and other genes of interest in situ. Moreover, these imaging based readouts preserve the spatial and morphological information present in the sample.
Profiling the spatial expression patterns of a limited set of “landmark” genes with in situ hybridizations can allow one to impute the physical location of cells in a sc-RNA-seq assay, and correspondingly impute the spatial expression patterns of novel genes. This approach was first demonstrated by Satija et al. [124], who integrated a database of in situ assays and sc-RNA-seq data to impute spatial expression patterns in early zebrafish embryos. Karaiskos et al. [9] performed a similar analysis for early Drosophila embryos, and were able to impute complex spatial expression patterns, such as stripes. Halpern et al. [125] applied this approach to the murine liver, imputing the relationship between gene expression and physical distance from the central vein vs. portal nodes in liver lobules (Fig. 3). In each system, variation in cell morphology with respect to spatial position is much less prominent than variation in gene expression, suggesting that cryptic spatial expression variation may exist in other biological contexts that have putatively homogenous cell populations. We anticipate that adding additional multi-omic assays, such as single cell protein epitope quantification chromatin accessibility profiling, to spatial gene expression analysis will substantially advance our understanding of how cell signaling and morphogen gradients give rise to stereotyped patterns of gene expression in development.
Figure 3. Spatial gene expression analysis with in situ hybridization and sc-RNA-seq.
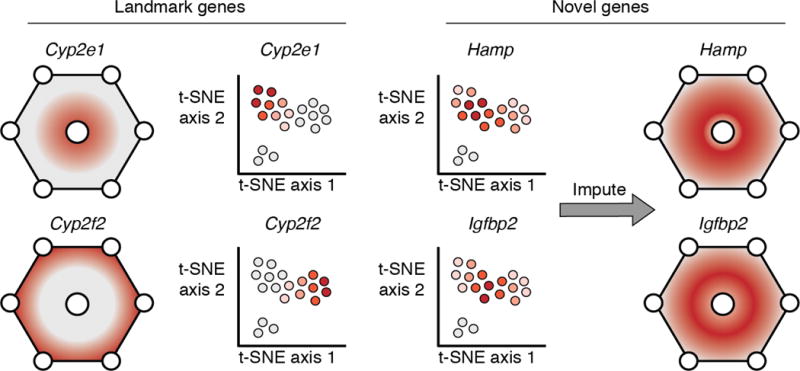
A cartoon illustrating the analytical approach used by Halpern et al. [125], who profiled murine liver lobules with RNA FISH and sc-RNA-seq. Liver lobules are hexagonal structures with a central vein and portal veins at each vertex (shown as circles in the figure). The spatial axis of interest is the relative distance of a cell from the central vs. portal vein. Halpern et al. profiled the spatial expression patterns of a handful of “landmark genes” with FISH. The position of cells from sc-RNA-seq on the central-to-portal axis was imputed based on their expression of these landmark genes. Given the imputed cell positions, the spatial gene expression patterns of novel genes without FISH data could be estimated. Some genes, such as Hamp and Igfbp2 featured non-monotonic expression patterns, peaking in the middle between the pericentral and periportal regions.
Concluding remarks and future directions
How does a complex animal endowed with consciousness arise from a single cell? This fundamental question has driven human inquiry as far back as Aristotle. Many general gene regulatory principles underlying the process of development—e.g. cell signaling, lineage-specific transcription factors, chromatin biology—were demonstrated well before the genomics era. Genomics gives us the opportunity to fill in all the details with high-throughput: to learn which proteins, which DNA sequences, which cell types are necessary in any given sub-task within the grand program of development. With the advent of single cell RNA-seq, it is now feasible to make a comprehensive “parts list” for an entire organism. The challenge that remains is how to scale traditional methods for interrogating the function of these “parts”—e.g. genetic screens, phospho-proteomics, chromatin state profiling, or in situ analysis—to keep pace with the massive scale of observational data being generated (see Outstanding Questions).
Regression models provide a simple yet powerful tool that can leverage the scale and diverse readouts provided by single cell multi-omic assays to construct quantitative models of gene regulation. As one profiles larger numbers of cells, one obtains more and more observations to fuel a regression model; and therefore the statistical power to fit a model with more and more complex sets of features. In the coming years, single cell datasets on the order of hundreds of thousands or millions of cells will become common-place. We anticipate that single-cell analysis at this scale will allow us to model how interactions between genes, proteins, regulatory DNA, and cell communities establish the epigenetic landscape more comprehensively and elegantly than ever before.
Highlights.
Regression models offer a simple yet powerful framework for integrating single cell transcriptomic, genetic, and epigenetic data to identify mechanisms of gene regulation.
New protocols for CRISPR loss of function screens read out gene expression and genetic perturbations in the same single cells. Regressing expression (phenotype) vs. genotype can provide insights into gene function and epistasis.
Antibodies conjugated to barcoded oligonucleotides have been used to read out gene expression and protein epitope abundance in the same single cells. Regression modeling of such data may facilitate the reconstruction of cell signaling networks.
Emerging single cell ATAC-seq technologies measure chromatin accessibility in single cells and can facilitate the identification of non-coding DNA elements, sequence features, and transcription factors that drive gene expression dynamics.
Outstanding Questions.
Could co-assaying single-cell (phospho-)epitope abundances and expression measurements in single cells to computationally reconstruct cell signaling network architecture?
Can we accurately model the expression level of individual genes across cell types based on chromatin accessibility of noncoding DNA elements?
Regression models relating gene expression dynamics to regulatory element sequence features can identify candidate transcription factors that establish the global dynamics of a biological process. But how can the key transcription factors and regulatory elements that explain the dynamics of individual, specific genes of interest be identified with high throughput?
Can the quantitative and statistical methods discussed here be adapted to emerging single cell technologies that preserve spatial context, or will new computational frameworks be required?
Glossary
- accessible chromatin
DNA that is not wrapped around a nucleosome.
- ATAC-seq
Assay for Transposase Accessible Chromatin using sequencing.
- ChIP-seq
Chromatin Immunoprecipitation followed by sequencing. Used to map transcription factor binding sites or histone modification domains.
- CUT&RUN
Cleavage Under Targets and Releasing Using Nuclease. An alternative to ChIP-seq that requires substantially less input material and sequencing depth.
- CRISPRi
a method for epigenetically repressing a target gene using a nuclease-deficient Cas9 protein fused to a transcriptionally repressing KRAB domain.
- CRISPR induced indel
a sequence insertion or deletion introduced at a target locus using a CRISPR/Cas9 system. Cas9 protein cuts DNA to make a double strand break, which is repaired by non-homologous end joining (NHEJ), often introducing indels
- DNase-seq
uses chromatin digestion with DNase I followed by sequencing to identify DNase hypersensitive sites (DHS), which correspond to regions of accessible chromatin
- differential expression
a statistically significant different in the abundance of a given RNA between one or more datasets.
- DPT
a pseudotime analysis method that uses diffusion maps for dimensionality reduction of sc-RNA-seq data.
- Gene Ontology enrichment analysis
a statistical test to identify Gene Ontology terms that are associated with a larger proportion of a query set of genes the would be expected due to chance.
- nested effects model
a regression model that assumes that data points are generated by a hierarchical process.
- MNase digestion
cutting DNA into small fragments using micrococcal nuclease (MNase), which has higher specificity for non-nucleosomal DNA than DNase I
- Monocle 2
a software package for single cell analysis in the R programming language. Includes an implementation of sc-RNA-seq pseudotime analysis that is based on the dimensionality reduction algorithm “DDRTree.”
- pseudotime trajectory
a computational ordering of cells from a single cell assay (i.e. sc-RNA-seq) that aims to reconstruct the continuous temporal dynamics of a gene regulatory process.
- RNA FISH
RNA fluorescence in situ hybridization. Fluorophore-conjugated oligonucleotide probes are hybridized to mRNA molecules in a fixed sample allowing them to be counted
- RNAi
RNA interference. A biological pathway present in many eukaryotes in which short hairpin RNAs or short double-stranded RNAs trigger degradation and/or translational inhibition of complementary messenger RNA.
- RNA velocity
an algorithm that analyzes the ratios of spliced mRNA to un-spliced pre-mRNAs in single cell RNA-seq data in order to estimate the time derivative of cell gene expression profiles, i.e. a cell’s “RNA velocity”
- single cell ATAC-seq
one of several protocols that adapt ATAC-seq to provide chromatin accessibility data for individual cells instead of a bulk cell population.
- single cell bisulfate sequencing
one of several protocols that adapt bisulfate sequencing to profile CpG methylation in single cells. Bisulfate sequencing uses a chemical reaction to convert non-methylated cytosine nucleotides to uracil, which is read out as thymine when sequenced
- single cell THS-seq
an adaptation of the THS-seq protocol that provides chromatin accessibility data for individual cells instead of a bulk cell population.
- SLICER
an algorithm for pseudotemporal analysis that examines shortest paths on a k-nearest-neighbor graph of cells.
- THS-seq
Transposome Hypersensitive Site sequencing. An alternative to ATAC-seq that uses in vitro transcription to amplify sequence from regions of accessible chromatin.
- URD
an algorithm for pseudotemporal analysis. Similar to DPT, but supports reconstructing trajectories with multiple branches
- Waddington’s landscape
a metaphor to describe the process of development introduced by Conrad Waddington in 1957.
- Waddington-OT
an algorithm for identifying lineage relationships between cells in time series single cell RNA-seq data.
- Wishbone
an algorithm for pseudotemporal analysis that examines shortest paths on a k-nearest-neighbor graph of cells.
Footnotes
Publisher's Disclaimer: This is a PDF file of an unedited manuscript that has been accepted for publication. As a service to our customers we are providing this early version of the manuscript. The manuscript will undergo copyediting, typesetting, and review of the resulting proof before it is published in its final citable form. Please note that during the production process errors may be discovered which could affect the content, and all legal disclaimers that apply to the journal pertain.
References
- 1.Macosko EZ, et al. Highly Parallel Genome-wide Expression Profiling of Individual Cells Using Nanoliter Droplets. Cell. 2015;161:1202–1214. doi: 10.1016/j.cell.2015.05.002. [DOI] [PMC free article] [PubMed] [Google Scholar]
- 2.Shekhar K, et al. Comprehensive Classification of Retinal Bipolar Neurons by Single-Cell Transcriptomics. Cell. 2016;166:1308–1323.e30. doi: 10.1016/j.cell.2016.07.054. [DOI] [PMC free article] [PubMed] [Google Scholar]
- 3.Joost S, et al. Single-Cell Transcriptomics Reveals that Differentiation and Spatial Signatures Shape Epidermal and Hair Follicle Heterogeneity. Cell Syst. 2016;3:221–237.e9. doi: 10.1016/j.cels.2016.08.010. [DOI] [PMC free article] [PubMed] [Google Scholar]
- 4.Baron M, et al. A Single-Cell Transcriptomic Map of the Human and Mouse Pancreas Reveals Inter- and Intra-cell Population Structure. Cell Systems. 2016;3:346–360.e4. doi: 10.1016/j.cels.2016.08.011. [DOI] [PMC free article] [PubMed] [Google Scholar]
- 5.Campbell JN, et al. A molecular census of arcuate hypothalamus and median eminence cell types. Nat Neurosci. 2017;20:484–496. doi: 10.1038/nn.4495. [DOI] [PMC free article] [PubMed] [Google Scholar]
- 6.Habib N, et al. Massively parallel single-nucleus RNA-seq with DroNc-seq. Nat Methods. 2017;14:955–958. doi: 10.1038/nmeth.4407. [DOI] [PMC free article] [PubMed] [Google Scholar]
- 7.Lake BB, et al. Integrative single-cell analysis of transcriptional and epigenetic states in the human adult brain. Nat Biotechnol. 2017 doi: 10.1038/nbt.4038. [DOI] [PMC free article] [PubMed] [Google Scholar]
- 8.Haber AL, et al. A single-cell survey of the small intestinal epithelium. Nature. 2017;551:333–339. doi: 10.1038/nature24489. [DOI] [PMC free article] [PubMed] [Google Scholar]
- 9.Karaiskos N, et al. The Drosophila embryo at single-cell transcriptome resolution. Science. 2017 doi: 10.1126/science.aan3235. [DOI] [PubMed] [Google Scholar]
- 10.Cao J, et al. Comprehensive single-cell transcriptional profiling of a multicellular organism. Science. 2017;357:661–667. doi: 10.1126/science.aam8940. [DOI] [PMC free article] [PubMed] [Google Scholar]
- 11.The Tabula Muris Consortium et al. Transcriptomic characterization of 20 organs and tissues from mouse at single cell resolution creates a Tabula Muris. bioRxiv. 2017 Dec 20;:237446. [Google Scholar]
- 12.Ibarra-Soria X, et al. Defining murine organogenesis at single-cell resolution reveals a role for the leukotriene pathway in regulating blood progenitor formation. Nat Cell Biol. 2018 doi: 10.1038/s41556-017-0013-z. [DOI] [PMC free article] [PubMed] [Google Scholar]
- 13.Han X, et al. Mapping the Mouse Cell Atlas by Microwell-Seq. Cell. 2018;172:1091–1107.e17. doi: 10.1016/j.cell.2018.02.001. [DOI] [PubMed] [Google Scholar]
- 14.Park J, et al. Single-cell transcriptomics of the mouse kidney reveals potential cellular targets of kidney disease. Science. 2018 doi: 10.1126/science.aar2131. [DOI] [PMC free article] [PubMed] [Google Scholar]
- 15.Fincher CT, et al. Cell type transcriptome atlas for the planarian Schmidtea mediterranea. Science. 2018 doi: 10.1126/science.aaq1736. [DOI] [PMC free article] [PubMed] [Google Scholar]
- 16.Briggs JA, et al. The dynamics of gene expression in vertebrate embryogenesis at single-cell resolution. Science. 2018 doi: 10.1126/science.aar5780. [DOI] [PMC free article] [PubMed] [Google Scholar]
- 17.Wagner DE, et al. Single-cell mapping of gene expression landscapes and lineage in the zebrafish embryo. Science. 2018 doi: 10.1126/science.aar4362. [DOI] [PMC free article] [PubMed] [Google Scholar]
- 18.Farrell JA, et al. Single-cell reconstruction of developmental trajectories during zebrafish embryogenesis. Science. 2018 doi: 10.1126/science.aar3131. [DOI] [PMC free article] [PubMed] [Google Scholar]
- 19.Zeisel A, et al. Molecular architecture of the mouse nervous system. bioRxiv. 2018 doi: 10.1016/j.cell.2018.06.021. at https://www.biorxiv.org/content/early/2018/04/06/294918.abstract. [DOI] [PMC free article] [PubMed]
- 20.Trapnell C, et al. The dynamics and regulators of cell fate decisions are revealed by pseudotemporal ordering of single cells. Nat Biotechnol. 2014;32:381–386. doi: 10.1038/nbt.2859. [DOI] [PMC free article] [PubMed] [Google Scholar]
- 21.Bendall SC, et al. Single-cell trajectory detection uncovers progression and regulatory coordination in human B cell development. Cell. 2014;157:714–725. doi: 10.1016/j.cell.2014.04.005. [DOI] [PMC free article] [PubMed] [Google Scholar]
- 22.Qiu X, et al. Reversed graph embedding resolves complex single-cell trajectories. Nat Methods. 2017;14:979–982. doi: 10.1038/nmeth.4402. [DOI] [PMC free article] [PubMed] [Google Scholar]
- 23.Haghverdi L, et al. Diffusion pseudotime robustly reconstructs lineage branching. Nat Methods. 2016;13:845–848. doi: 10.1038/nmeth.3971. [DOI] [PubMed] [Google Scholar]
- 24.Setty M, et al. Wishbone identifies bifurcating developmental trajectories from single-cell data. Nat Biotechnol. 2016;34:637–645. doi: 10.1038/nbt.3569. [DOI] [PMC free article] [PubMed] [Google Scholar]
- 25.Welch JD, et al. SLICER: inferring branched, nonlinear cellular trajectories from single cell RNA-seq data. Genome Biol. 2016;17:106. doi: 10.1186/s13059-016-0975-3. [DOI] [PMC free article] [PubMed] [Google Scholar]
- 26.Schiebinger G, et al. Reconstruction of developmental landscapes by optimal-transport analysis of single-cell gene expression sheds light on cellular reprogramming. bioRxiv. 2017 Sep 27;:191056. bioRxiv. [Google Scholar]
- 27.La Manno G, et al. RNA velocity in single cells. bioRxiv. 2017 Oct 19;:206052. [Google Scholar]
- 28.Rizvi AH, et al. Single-cell topological RNA-seq analysis reveals insights into cellular differentiation and development. Nat Biotechnol. 2017;35:551–560. doi: 10.1038/nbt.3854. [DOI] [PMC free article] [PubMed] [Google Scholar]
- 29.Xu J, et al. Direct lineage reprogramming: strategies, mechanisms, and applications. Cell Stem Cell. 2015;16:119–134. doi: 10.1016/j.stem.2015.01.013. [DOI] [PubMed] [Google Scholar]
- 30.Cacchiarelli D, et al. Aligning single-cell developmental and reprogramming trajectories identifies molecular determinants of reprogramming outcome. bioRxiv. 2017 Mar 30;:122531. doi: 10.1016/j.cels.2018.07.006. [DOI] [PubMed] [Google Scholar]
- 31.Liu ML, et al. Small molecules enable neurogenin 2 to efficiently convert human fibroblasts into cholinergic neurons. Nat Commun. 2013;4:2183. doi: 10.1038/ncomms3183. [DOI] [PMC free article] [PubMed] [Google Scholar]
- 32.Ladewig J, et al. Small molecules enable highly efficient neuronal conversion of human fibroblasts. Nat Methods. 2012;9:575–578. doi: 10.1038/nmeth.1972. [DOI] [PubMed] [Google Scholar]
- 33.Loh KM, et al. Mapping the Pairwise Choices Leading from Pluripotency to Human Bone, Heart, and Other Mesoderm Cell Types. Cell. 2016;166:451–467. doi: 10.1016/j.cell.2016.06.011. [DOI] [PMC free article] [PubMed] [Google Scholar]
- 34.Antebi YE, et al. Combinatorial Signal Perception in the BMP Pathway. Cell. 2017;170:1184–1196.e24. doi: 10.1016/j.cell.2017.08.015. [DOI] [PMC free article] [PubMed] [Google Scholar]
- 35.Mullen AC, et al. Master Transcription Factors Determine Cell-Type-Specific Responses to TGF-β Signaling. Cell. 2011;147:565–576. doi: 10.1016/j.cell.2011.08.050. [DOI] [PMC free article] [PubMed] [Google Scholar]
- 36.Grøntved L, et al. C/EBP maintains chromatin accessibility in liver and facilitates glucocorticoid receptor recruitment to steroid response elements. EMBO J. 2013;32:1568–1583. doi: 10.1038/emboj.2013.106. [DOI] [PMC free article] [PubMed] [Google Scholar]
- 37.Goldstein I, et al. Transcription factor assisted loading and enhancer dynamics dictate the hepatic fasting response. Genome Res. 2017;27:427–439. doi: 10.1101/gr.212175.116. [DOI] [PMC free article] [PubMed] [Google Scholar]
- 38.Boutros M, Ahringer J. The art and design of genetic screens: RNA interference. Nat Rev Genet. 2008;9:554–566. doi: 10.1038/nrg2364. [DOI] [PubMed] [Google Scholar]
- 39.Shalem O, et al. Genome-scale CRISPR-Cas9 knockout screening in human cells. Science. 2014;343:84–87. doi: 10.1126/science.1247005. [DOI] [PMC free article] [PubMed] [Google Scholar]
- 40.Gilbert LA, et al. Genome-Scale CRISPR-Mediated Control of Gene Repression and Activation. Cell. 2014;159:647–661. doi: 10.1016/j.cell.2014.09.029. [DOI] [PMC free article] [PubMed] [Google Scholar]
- 41.Adamson B, et al. A Multiplexed Single-Cell CRISPR Screening Platform Enables Systematic Dissection of the Unfolded Protein Response. Cell. 2016;167:1867–1882.e21. doi: 10.1016/j.cell.2016.11.048. [DOI] [PMC free article] [PubMed] [Google Scholar]
- 42.Dixit A, et al. Perturb-Seq: Dissecting Molecular Circuits with Scalable Single-Cell RNA Profiling of Pooled Genetic Screens. Cell. 2016;167:1853–1866.e17. doi: 10.1016/j.cell.2016.11.038. [DOI] [PMC free article] [PubMed] [Google Scholar]
- 43.Jaitin DA, et al. Dissecting Immune Circuits by Linking CRISPR-Pooled Screens with Single-Cell RNA-Seq. Cell. 2016;167:1883–1896.e15. doi: 10.1016/j.cell.2016.11.039. [DOI] [PubMed] [Google Scholar]
- 44.Xie S, et al. Multiplexed Engineering and Analysis of Combinatorial Enhancer Activity in Single Cells. Mol Cell. 2017;66:285–299.e5. doi: 10.1016/j.molcel.2017.03.007. [DOI] [PubMed] [Google Scholar]
- 45.Datlinger P, et al. Pooled CRISPR screening with single-cell transcriptome readout. Nat Methods. 2017;14:297–301. doi: 10.1038/nmeth.4177. [DOI] [PMC free article] [PubMed] [Google Scholar]
- 46.Tang H, et al. GOATOOLS: tools for gene ontology. Zenodo 2015 [Google Scholar]
- 47.Wong ASL, et al. Multiplexed barcoded CRISPR-Cas9 screening enabled by CombiGEM. Proc Natl Acad Sci U S A. 2016;113:2544–2549. doi: 10.1073/pnas.1517883113. [DOI] [PMC free article] [PubMed] [Google Scholar]
- 48.Shen JP, et al. Combinatorial CRISPR–Cas9 screens for de novo mapping of genetic interactions. Nat Methods. 2017;14:573. doi: 10.1038/nmeth.4225. [DOI] [PMC free article] [PubMed] [Google Scholar]
- 49.Najm FJ, et al. Orthologous CRISPR–Cas9 enzymes for combinatorial genetic screens. Nat Biotechnol. 2017;36:179. doi: 10.1038/nbt.4048. [DOI] [PMC free article] [PubMed] [Google Scholar]
- 50.Boettcher M, et al. Dual gene activation and knockout screen reveals directional dependencies in genetic networks. Nat Biotechnol. 2018;36:170–178. doi: 10.1038/nbt.4062. [DOI] [PMC free article] [PubMed] [Google Scholar]
- 51.Hill AJ, et al. On the design of CRISPR-based single-cell molecular screens. Nat Methods. 2018 doi: 10.1038/nmeth.4604. [DOI] [PMC free article] [PubMed] [Google Scholar]
- 52.Horlbeck MA, et al. Compact and highly active next-generation libraries for CRISPR-mediated gene repression and activation. Elife. 2016:5. doi: 10.7554/eLife.19760. [DOI] [PMC free article] [PubMed] [Google Scholar]
- 53.Spitzer MH, Nolan GP. Mass Cytometry: Single Cells, Many Features. Cell. 2016;165:780–791. doi: 10.1016/j.cell.2016.04.019. [DOI] [PMC free article] [PubMed] [Google Scholar]
- 54.Krishnaswamy S, et al. Conditional density-based analysis of T cell signaling in single-cell data. Science. 2014;346:1250689. doi: 10.1126/science.1250689. [DOI] [PMC free article] [PubMed] [Google Scholar]
- 55.Krishnaswamy S, et al. Learning Edge Rewiring in EMT from Single Cell Data. bioRxiv. 2017 Jun 25;:155028. [Google Scholar]
- 56.Stoeckius M, et al. Simultaneous epitope and transcriptome measurement in single cells. Nat Methods. 2017;14:865–868. doi: 10.1038/nmeth.4380. [DOI] [PMC free article] [PubMed] [Google Scholar]
- 57.Peterson VM, et al. Multiplexed quantification of proteins and transcripts in single cells. Nat Biotechnol. 2017 doi: 10.1038/nbt.3973. [DOI] [PubMed] [Google Scholar]
- 58.van Buggenum JA, et al. Immuno-Detection by sequencing (ID-seq) enables large-scale high-dimensional phenotyping in cells. bioRxiv. 2017 Jun 30;:158139. doi: 10.1038/s41467-018-04761-0. [DOI] [PMC free article] [PubMed] [Google Scholar]
- 59.Markowetz F, et al. Non-transcriptional pathway features reconstructed from secondary effects of RNA interference. Bioinformatics. 2005;21:4026–4032. doi: 10.1093/bioinformatics/bti662. [DOI] [PubMed] [Google Scholar]
- 60.Zaret KS, Carroll JS. Pioneer transcription factors: establishing competence for gene expression. Genes Dev. 2011;25:2227–2241. doi: 10.1101/gad.176826.111. [DOI] [PMC free article] [PubMed] [Google Scholar]
- 61.John S, et al. Chromatin accessibility pre-determines glucocorticoid receptor binding patterns. Nat Genet. 2011;43:264–268. doi: 10.1038/ng.759. [DOI] [PMC free article] [PubMed] [Google Scholar]
- 62.Biddie SC, et al. Transcription factor AP1 potentiates chromatin accessibility and glucocorticoid receptor binding. Mol Cell. 2011;43:145–155. doi: 10.1016/j.molcel.2011.06.016. [DOI] [PMC free article] [PubMed] [Google Scholar]
- 63.Voss TC, et al. Dynamic exchange at regulatory elements during chromatin remodeling underlies assisted loading mechanism. Cell. 2011;146:544–554. doi: 10.1016/j.cell.2011.07.006. [DOI] [PMC free article] [PubMed] [Google Scholar]
- 64.Swinstead EE, et al. Steroid Receptors Reprogram FoxA1 Occupancy through Dynamic Chromatin Transitions. Cell. 2016;165:593–605. doi: 10.1016/j.cell.2016.02.067. [DOI] [PMC free article] [PubMed] [Google Scholar]
- 65.Knoepfler PS, et al. A conserved motif N-terminal to the DNA-binding domains of myogenic bHLH transcription factors mediates cooperative DNA binding with pbx-Meis1/Prep1. Nucleic Acids Res. 1999;27:3752–3761. doi: 10.1093/nar/27.18.3752. [DOI] [PMC free article] [PubMed] [Google Scholar]
- 66.Berkes CA, et al. Pbx Marks Genes for Activation by MyoD Indicating a Role for a Homeodomain Protein in Establishing Myogenic Potential. Mol Cell. 2004;14:465–477. doi: 10.1016/s1097-2765(04)00260-6. [DOI] [PubMed] [Google Scholar]
- 67.Ivana L, et al. MyoD targets chromatin remodeling complexes to the myogenin locus prior to forming a stable DNA-bound complex. Mol Cell Biol. 2005;25:3997–4009. doi: 10.1128/MCB.25.10.3997-4009.2005. [DOI] [PMC free article] [PubMed] [Google Scholar]
- 68.Siersbæk R, et al. Extensive chromatin remodelling and establishment of transcription factor “hotspots” during early adipogenesis. EMBO J. 2011;30:1459–1472. doi: 10.1038/emboj.2011.65. [DOI] [PMC free article] [PubMed] [Google Scholar]
- 69.Krysinska H, et al. A two-step, PU.1-dependent mechanism for developmentally regulated chromatin remodeling and transcription of the c-fms gene. Mol Cell Biol. 2007;27:878–887. doi: 10.1128/MCB.01915-06. [DOI] [PMC free article] [PubMed] [Google Scholar]
- 70.Decker T, et al. Stepwise activation of enhancer and promoter regions of the B cell commitment gene Pax5 in early lymphopoiesis. Immunity. 2009;30:508–520. doi: 10.1016/j.immuni.2009.01.012. [DOI] [PubMed] [Google Scholar]
- 71.Heinz S, et al. Simple Combinations of Lineage-Determining Transcription Factors Prime cis-Regulatory Elements Required for Macrophage and B Cell Identities. Mol Cell. 2010;38:576–589. doi: 10.1016/j.molcel.2010.05.004. [DOI] [PMC free article] [PubMed] [Google Scholar]
- 72.Samstein RM, et al. Foxp3 exploits a pre-existent enhancer landscape for regulatory T cell lineage specification. Cell. 2012;151:153–166. doi: 10.1016/j.cell.2012.06.053. [DOI] [PMC free article] [PubMed] [Google Scholar]
- 73.Song L, Crawford GE. DNase-seq: a high-resolution technique for mapping active gene regulatory elements across the genome from mammalian cells. Cold Spring Harb Protoc. 2010;2010 doi: 10.1101/pdb.prot5384. db.prot5384. [DOI] [PMC free article] [PubMed] [Google Scholar]
- 74.Buenrostro JD, et al. Transposition of native chromatin for fast and sensitive epigenomic profiling of open chromatin, DNA-binding proteins and nucleosome position. Nat Methods. 2013;10:1213–1218. doi: 10.1038/nmeth.2688. [DOI] [PMC free article] [PubMed] [Google Scholar]
- 75.Corces MR, et al. An improved ATAC-seq protocol reduces background and enables interrogation of frozen tissues. Nat Methods. 2017;14:959–962. doi: 10.1038/nmeth.4396. [DOI] [PMC free article] [PubMed] [Google Scholar]
- 76.Sos BC, et al. Characterization of chromatin accessibility with a transposome hypersensitive sites sequencing (THS-seq) assay. Genome Biol. 2016;17:20. doi: 10.1186/s13059-016-0882-7. [DOI] [PMC free article] [PubMed] [Google Scholar]
- 77.Creyghton MP, et al. Histone H3K27ac separates active from poised enhancers and predicts developmental state. Proc Natl Acad Sci U S A. 2010;107:21931–21936. doi: 10.1073/pnas.1016071107. [DOI] [PMC free article] [PubMed] [Google Scholar]
- 78.Cusanovich DA, et al. Multiplex single cell profiling of chromatin accessibility by combinatorial cellular indexing. Science. 2015;348:910–914. doi: 10.1126/science.aab1601. [DOI] [PMC free article] [PubMed] [Google Scholar]
- 79.Buenrostro JD, et al. Single-cell chromatin accessibility reveals principles of regulatory variation. Nature. 2015;523:486–490. doi: 10.1038/nature14590. [DOI] [PMC free article] [PubMed] [Google Scholar]
- 80.Preissl S, et al. Single-nucleus analysis of accessible chromatin in developing mouse forebrain reveals cell-type-specific transcriptional regulation. Nat Neurosci. 2018 doi: 10.1038/s41593-018-0079-3. [DOI] [PMC free article] [PubMed] [Google Scholar]
- 81.Cusanovich DA, et al. The cis-regulatory dynamics of embryonic development at single-cell resolution. Nature. 2018;555:538–542. doi: 10.1038/nature25981. [DOI] [PMC free article] [PubMed] [Google Scholar]
- 82.Pliner H, et al. Chromatin accessibility dynamics of myogenesis at single cell resolution. bioRxiv. 2017 Jun 26;:155473. [Google Scholar]
- 83.Buenrostro JD, et al. Integrated Single-Cell Analysis Maps the Continuous Regulatory Landscape of Human Hematopoietic Differentiation. Cell. 2018 doi: 10.1016/j.cell.2018.03.074. [DOI] [PMC free article] [PubMed] [Google Scholar]
- 84.Skene PJ, Henikoff S. An efficient targeted nuclease strategy for high-resolution mapping of DNA binding sites. eLife Sciences. 2017;6:e21856. doi: 10.7554/eLife.21856. [DOI] [PMC free article] [PubMed] [Google Scholar]
- 85.Ghandi M, et al. Enhanced regulatory sequence prediction using gapped k-mer features. PLoS Comput Biol. 2014;10:e1003711. doi: 10.1371/journal.pcbi.1003711. [DOI] [PMC free article] [PubMed] [Google Scholar]
- 86.Lee D. LS-GKM: a new gkm-SVM for large-scale datasets. Bioinformatics. 2016;32:2196–2198. doi: 10.1093/bioinformatics/btw142. [DOI] [PMC free article] [PubMed] [Google Scholar]
- 87.Alipanahi B, et al. Predicting the sequence specificities of DNA- and RNA-binding proteins by deep learning. Nat Biotechnol. 2015;33:831–838. doi: 10.1038/nbt.3300. [DOI] [PubMed] [Google Scholar]
- 88.Kelley DR, et al. Basset: learning the regulatory code of the accessible genome with deep convolutional neural networks. Genome Res. 2016;26:990–999. doi: 10.1101/gr.200535.115. [DOI] [PMC free article] [PubMed] [Google Scholar]
- 89.Li G, et al. Extensive promoter-centered chromatin interactions provide a topological basis for transcription regulation. Cell. 2012;148:84–98. doi: 10.1016/j.cell.2011.12.014. [DOI] [PMC free article] [PubMed] [Google Scholar]
- 90.Zhang Y, et al. Chromatin connectivity maps reveal dynamic promoter-enhancer long-range associations. Nature. 2013;504:306–310. doi: 10.1038/nature12716. [DOI] [PMC free article] [PubMed] [Google Scholar]
- 91.Li X, et al. Long-read ChIA-PET for base-pair-resolution mapping of haplotype-specific chromatin interactions. Nat Protoc. 2017;12:899–915. doi: 10.1038/nprot.2017.012. [DOI] [PMC free article] [PubMed] [Google Scholar]
- 92.Mifsud B, et al. Mapping long-range promoter contacts in human cells with high-resolution capture Hi-C. Nat Genet. 2015;47:598–606. doi: 10.1038/ng.3286. [DOI] [PubMed] [Google Scholar]
- 93.Javierre BM, et al. Lineage-Specific Genome Architecture Links Enhancers and Non-coding Disease Variants to Target Gene Promoters. Cell. 2016;167:1369–1384.e19. doi: 10.1016/j.cell.2016.09.037. [DOI] [PMC free article] [PubMed] [Google Scholar]
- 94.Rubin AJ, et al. Lineage-specific dynamic and pre-established enhancer-promoter contacts cooperate in terminal differentiation. Nat Genet. 2017 doi: 10.1038/ng.3935. [DOI] [PMC free article] [PubMed] [Google Scholar]
- 95.Mumbach MR, et al. HiChIP: efficient and sensitive analysis of protein-directed genome architecture. Nat Methods. 2016;13:919–922. doi: 10.1038/nmeth.3999. [DOI] [PMC free article] [PubMed] [Google Scholar]
- 96.Mumbach MR, et al. Enhancer connectome in primary human cells identifies target genes of disease-associated DNA elements. Nat Genet. 2017;49:1602–1612. doi: 10.1038/ng.3963. [DOI] [PMC free article] [PubMed] [Google Scholar]
- 97.Clark SJ, et al. scNMT-seq enables joint profiling of chromatin accessibility DNA methylation and transcription in single cells. Nat Commun. 2018;9:781. doi: 10.1038/s41467-018-03149-4. [DOI] [PMC free article] [PubMed] [Google Scholar]
- 98.Chen X, et al. Joint single-cell DNA accessibility and protein epitope profiling reveals environmental regulation of epigenomic heterogeneity. bioRxiv. 2018 Apr 27;:310359. doi: 10.1038/s41467-018-07115-y. [DOI] [PMC free article] [PubMed] [Google Scholar]
- 99.Zhou J, Troyanskaya OG. Predicting effects of noncoding variants with deep learning-based sequence model. Nat Methods. 2015;12:931–934. doi: 10.1038/nmeth.3547. [DOI] [PMC free article] [PubMed] [Google Scholar]
- 100.Maurano MT, et al. Large-scale identification of sequence variants influencing human transcription factor occupancy in vivo. Nat Genet. 2015;47:1393–1401. doi: 10.1038/ng.3432. [DOI] [PMC free article] [PubMed] [Google Scholar]
- 101.Lee D, et al. A method to predict the impact of regulatory variants from DNA sequence. Nat Genet. 2015;47:955–961. doi: 10.1038/ng.3331. [DOI] [PMC free article] [PubMed] [Google Scholar]
- 102.Lopes R, et al. Applying CRISPR-Cas9 tools to identify and characterize transcriptional enhancers. Nat Rev Mol Cell Biol. 2016;17:597–604. doi: 10.1038/nrm.2016.79. [DOI] [PubMed] [Google Scholar]
- 103.Fulco CP, et al. Systematic mapping of functional enhancer–promoter connections with CRISPR interference. Science. 2016;354:769–773. doi: 10.1126/science.aag2445. [DOI] [PMC free article] [PubMed] [Google Scholar]
- 104.Gasperini M, et al. CRISPR/Cas9-Mediated Scanning for Regulatory Elements Required for HPRT1 Expression via Thousands of Large, Programmed Genomic Deletions. Am J Hum Genet. 2017;101:192–205. doi: 10.1016/j.ajhg.2017.06.010. [DOI] [PMC free article] [PubMed] [Google Scholar]
- 105.Smallwood SA, et al. Single-cell genome-wide bisulfite sequencing for assessing epigenetic heterogeneity. Nat Methods. 2014;11:817–820. doi: 10.1038/nmeth.3035. [DOI] [PMC free article] [PubMed] [Google Scholar]
- 106.Farlik M, et al. DNA Methylation Dynamics of Human Hematopoietic Stem Cell Differentiation. Cell Stem Cell. 2016;19:808–822. doi: 10.1016/j.stem.2016.10.019. [DOI] [PMC free article] [PubMed] [Google Scholar]
- 107.Clark SJ, et al. Genome-wide base-resolution mapping of DNA methylation in single cells using single-cell bisulfite sequencing (scBS-seq) Nat Protoc. 2017;12:534–547. doi: 10.1038/nprot.2016.187. [DOI] [PubMed] [Google Scholar]
- 108.Luo C, et al. Single-cell methylomes identify neuronal subtypes and regulatory elements in mammalian cortex. Science. 2017;357:600–604. doi: 10.1126/science.aan3351. [DOI] [PMC free article] [PubMed] [Google Scholar]
- 109.Mulqueen RM, et al. Highly scalable generation of DNA methylation profiles in single cells. Nat Biotechnol. 2018;36:428–431. doi: 10.1038/nbt.4112. [DOI] [PMC free article] [PubMed] [Google Scholar]
- 110.Rotem A, et al. Single-cell ChIP-seq reveals cell subpopulations defined by chromatin state. Nat Biotechnol. 2015;33:1165–1172. doi: 10.1038/nbt.3383. [DOI] [PMC free article] [PubMed] [Google Scholar]
- 111.Nagano T, et al. Single-cell Hi-C reveals cell-to-cell variability in chromosome structure. Nature. 2013;502:59–64. doi: 10.1038/nature12593. [DOI] [PMC free article] [PubMed] [Google Scholar]
- 112.Nagano T, et al. Single-cell Hi-C for genome-wide detection of chromatin interactions that occur simultaneously in a single cell. Nat Protoc. 2015;10:1986–2003. doi: 10.1038/nprot.2015.127. [DOI] [PubMed] [Google Scholar]
- 113.Flyamer IM, et al. Single-nucleus Hi-C reveals unique chromatin reorganization at oocyte-to-zygote transition. Nature. 2017;544:110–114. doi: 10.1038/nature21711. [DOI] [PMC free article] [PubMed] [Google Scholar]
- 114.Stevens TJ, et al. 3D structures of individual mammalian genomes studied by single-cell Hi-C. Nature. 2017;544:59–64. doi: 10.1038/nature21429. [DOI] [PMC free article] [PubMed] [Google Scholar]
- 115.Ramani V, et al. Massively multiplex single-cell Hi-C. Nat Methods. 2017;14:263–266. doi: 10.1038/nmeth.4155. [DOI] [PMC free article] [PubMed] [Google Scholar]
- 116.Clevers H. Modeling Development and Disease with Organoids. Cell. 2016;165:1586–1597. doi: 10.1016/j.cell.2016.05.082. [DOI] [PubMed] [Google Scholar]
- 117.Kelava I, Lancaster MA. Dishing out mini-brains: Current progress and future prospects in brain organoid research. Dev Biol. 2016;420:199–209. doi: 10.1016/j.ydbio.2016.06.037. [DOI] [PMC free article] [PubMed] [Google Scholar]
- 118.Grün D, et al. Single-cell messenger RNA sequencing reveals rare intestinal cell types. Nature. 2015;525:251–255. doi: 10.1038/nature14966. [DOI] [PubMed] [Google Scholar]
- 119.Camp JG, et al. Human cerebral organoids recapitulate gene expression programs of fetal neocortex development. Proceedings of the National Academy of Sciences. 2015;112:15672–15677. doi: 10.1073/pnas.1520760112. [DOI] [PMC free article] [PubMed] [Google Scholar]
- 120.Camp JG, et al. Multilineage communication regulates human liver bud development from pluripotency. Nature. 2017;546:533–538. doi: 10.1038/nature22796. [DOI] [PubMed] [Google Scholar]
- 121.Yamamoto Y, et al. Long-term expansion of alveolar stem cells derived from human iPS cells in organoids. Nat Methods. 2017;14:1097–1106. doi: 10.1038/nmeth.4448. [DOI] [PubMed] [Google Scholar]
- 122.Chen KH, et al. RNA imaging. Spatially resolved, highly multiplexed RNA profiling in single cells. Science. 2015;348:aaa6090. doi: 10.1126/science.aaa6090. [DOI] [PMC free article] [PubMed] [Google Scholar]
- 123.Shah S, et al. In Situ Transcription Profiling of Single Cells Reveals Spatial Organization of Cells in the Mouse Hippocampus. Neuron. 2016;92:342–357. doi: 10.1016/j.neuron.2016.10.001. [DOI] [PMC free article] [PubMed] [Google Scholar]
- 124.Satija R, et al. Spatial reconstruction of single-cell gene expression data. Nat Biotechnol. 2015;33:495–502. doi: 10.1038/nbt.3192. [DOI] [PMC free article] [PubMed] [Google Scholar]
- 125.Halpern KB, et al. Single-cell spatial reconstruction reveals global division of labour in the mammalian liver. Nature. 2017;542:352–356. doi: 10.1038/nature21065. [DOI] [PMC free article] [PubMed] [Google Scholar]