

Abstract
Pesticides must be effective to be commercially viable but they must also be reasonably safe for those who manufacture them, apply them, or consume the food they are used to produce. Animal testing is key to ensuring safety, but it comes late in the agrochemical development process, is expensive, and requires relatively large amounts of material. Surrogate assays used as in vitro models require less material and shift identification of potential mammalian toxicity back to earlier stages in development. Modern in silico methods are cost‐effective complements to such in vitro models that make it possible to predict mammalian metabolism, toxicity and exposure for a pesticide, crop residue or other metabolite before it has been synthesized. Their broader use could substantially reduce the amount of time and effort wasted in pesticide development. This contribution reviews the kind of in silico models that are currently available for vetting ideas about what to synthesize and how to focus development efforts; the limitations of those models; and the practical considerations that have slowed development in the area. Detailed discussions are provided of how bacterial mutagenicity, human cytochrome P450 (CYP) metabolism, and bioavailability in humans and rats can be predicted. © 2018 The Authors. Pest Management Science published by John Wiley & Sons Ltd on behalf of Society of Chemical Industry.
Keywords: absorption; absorption, distribution, metabolism and excretion (ADME); bioavailability; cytochrome P450 (CYP); mammalian toxicity; metabolism; modeling; quantitative structure–activity relationship (QSAR)
1. INTRODUCTION
Anticipating mammalian toxicity of agrochemical pesticides or their metabolites is a key part of agrochemical development. Environmental problems can be identified fairly readily by tests on invertebrates and fish. Testing new candidate compounds in humans and large mammals is generally unethical and rarely practical early in development, however, so rodents are used instead. Humanitarian and cost concerns have combined to drive testing away from animal testing and towards greater reliance on in vitro assays. These serve as useful models of the relevant in vivo endpoints, but they can be quite far removed from what they are intended to predict. Moreover, the more definitive in vitro tests often require a substantial amount of pure material, which can be especially challenging when it comes to metabolites. An alternative approach is to use knowledge of molecular structure–activity relationships (SARs) gleaned from past assay results to build in silico models that can predict metabolism and toxicity of a compound even before it, its metabolites or its crop residues have been synthesized.
Such quantitative SAR (QSAR) models can be used to guide on‐target pharmaceutical optimization and to minimize undesirable off‐target activities.1 In the case of pesticide development, mammalian toxicity – or lack thereof as a consequence of metabolic inactivation – is a key off‐target activity that needs to be considered. The possibility of human toxicity is certainly a concern. As a practical matter, however, evidence of toxicity in other species – e.g., rodents or livestock – is just as capable of derailing development, making it almost as important to be able to predict the likely results of animal testing. Doing so requires reliable prediction of whether the active ingredient itself is likely to be toxic, how it is likely to be metabolized, and whether the metabolites produced are likely to be toxic or innocuous. In fact, in silico model predictions provide an important way to reduce the need for animal testing and to make sure it is done efficiently when it is needed. They can also complement both in vitro and in vivo tests by identifying instances where those results are misleading or incorrect.
Predictive in silico models could be built to address many different aspects of xenobiotic metabolism and toxicity, but technical and practical issues limit those that are currently available. Here we will focus primarily on those that are best positioned at present to facilitate agrochemical pesticide discovery and development: those addressing mutagenicity, rodent toxicity, metabolism by cytochrome P450s (CYPs), and bioavailability. Factors holding back development of quantitative models for potentially important processes like glucuronidation and glutathione conjugation will also be described.
Most in silico metabolism and toxicity models depend implicitly or explicitly on predicted physicochemical properties relevant to absorption, distribution, metabolism, excretion and toxicity (ADMET). Lipophilicity (commonly expressed as logP, the common logarithm of the octanol:water partition coefficient for the neutral species), logP at a specified pH (logD), the negative logarithm of the dissociation constant (pK a), and solubility under physiological conditions are key examples of such physicochemical properties.
Many models for individual ADMET properties have been published, and in most cases their usefulness has not been explored outside the group that developed them. This is often because either they are not readily available to other researchers or they have not been integrated effectively with other models. Here we will highlight software packages that provide access to multiple models, especially those that combine their outputs somehow. Most that go beyond simple tabular outputs are commercial products. The information presented in Supporting Information Table S1 illustrates the range of mammalian metabolism, toxicity and bioavailability models offered as of February 2018, with links provided to the website associated with each software package. Those included were chosen because they are more or less directly applicable to mammalian metabolic and toxicological aspects of pesticide discovery and early development; models that address environmental effects such as bioconcentration and aquatic toxicity were not taken into consideration. Integrated systems were favored over less structured compendia of models such as ChemProp (http://www.ufz.de). More general and exhaustive tabulations of ADMET‐related software packages have been published recently elsewhere.2, 3, 4
The agrochemicals chosen to illustrate how the models discussed herein can be applied reflect the author's experience in the area. They include: acetochlor and alachlor (chloroacetamides); glyphosate [an 5‐enolpyruvylshikimate‐3‐phosphate synthase (EPSPS) inhibitor]; the auxin 2,4‐dichlorophenoxyacetic acid (2,4‐D); imazapyr and sulfometuron methyl [acetolactate synthase (ALS) inhibitors]; and oxyfluorfen [a protoporphyrinogen IX oxidase (PPO) inhibitor]. Twenty‐five herbicides drawn from a recent compilation of herbicides introduced since the turn of the century5 were also included, along with three fungicidal succinate dehydrogenase (SDH) inhibitors (isopyrazan, benzovindiflupyr and sedaxane).
2. MODELING APPROACHES
Metabolism and toxicity are complex processes at the molecular level and the inherent ‘noisiness’ of biological endpoints only complicates matters further. As a result, all models intended to make predictions about such a process – whether in silico or in vitro – risk being overly reductionist.6 ‘Top‐down’ approaches generate a single over‐arching model for each overall outcome (e.g., liver microsomal clearance by CYPs). ‘Bottom up’ approaches build models for the different mechanisms contributing to a particular endpoint and then combine those predictions.
A top‐down model for overall CYP‐mediated clearance in liver microsomes can be built from fewer data than a set of bottom‐up models for individual CYP isoforms, but it can only provide apparent affinity (K m) estimates and cannot account for genetic variants in individual isoforms. A set of bottom‐up models can be used to predict kinetic parameters and effects of genetic variation, but will miss clearance contributions from isoforms for which no specific model has been built. The composite bottom‐up model may miss information from implicit intermediates (e.g., conjugates formed after an initial oxidation or reduction step) that can contribute to a top‐down model, whereas the latter risks erroneously assuming that the requisite reduction will occur in some other molecule.
Broadly speaking, computer models can be characterized in terms of how the endpoint being predicted is described, the kind of descriptors used to characterize the molecular structure, and the mathematical form used to relate the descriptors to the model output. Endpoints may be quantitative (e.g., what is the rate of metabolism in liver microsomes?), multiclass (e.g., is it most likely to be a substrate for CYP1A2, ‐2C9, ‐2D6 or ‐3A4?) or binary (e.g., is it mutagenic or not?).
QSAR descriptors can be thought of as atom‐centered (e.g., is this substructure found in the molecule?) or molecule‐centered [e.g., is the molecule as a whole polar and hydrophilic (water‐loving) or is it nonpolar and lipophilic (lipid‐loving) or is it somewhere in between?]. Either kind of descriptor can require full three‐dimensional (3D) molecular structures as input or may only require the connectivity of the molecule – i.e., which atoms are bonded to which and the nature of the bond types. The latter are referred to as ‘2D’ descriptors. One difference between the two is that 3D descriptors can take chirality into account, which often affects the activity of drugs and agrochemicals alike7 but which has relatively little effect on most ADME properties.8 The potential drawback of 3D descriptors is that their values are dependent on molecular conformation. Hence the active site plasticity underlying the promiscuity of many enzymes involved in xenobiotic absorption and metabolism limits their usefulness for modeling ADME specificity and kinetics.9
Descriptors can also be characterized as substructural or molecular. The former characterize molecules in terms of the individual atoms or substructures that make them up, with separate sets of descriptors for different substructures. Molecular descriptors, in contrast, reflect properties of the molecule as a whole, with the result that different molecules may have very similar descriptor values (e.g., of molecular volume and overall charge) even though their substructural compositions have little in common.
Finally, the mathematical form of the relationship between the endpoint and the descriptors can vary considerably, with the most common broad distinctions being between linear and nonlinear [e.g., artificial neural network (ANN)10] models. One should be aware, however, that linear models can account indirectly for nonlinear effects if the descriptors used are correlated in some nonlinear way. Unfortunately, the effect of such interrelatedness on the interpretability of (nominally) linear models is generally underappreciated. This paper will focus on general considerations to be kept in mind when selecting and applying a QSAR model. The kinds of models offered in commercial software and in academic programs available in open source environments use similar combinations of endpoints, descriptors and mathematical forms. Top‐down nonlinear models derived from substructural descriptors currently dominate both groups. ADMET Predictor™ (Simulations Plus, Inc. Lancaster, CA, USA; http://www.simulations-plus.com) is atypical in that it relies on artificial neural net ensemble models built from molecular descriptors rather than substructural ones. It also takes a bottom‐up approach to most endpoints – e.g., by providing quantitative kinetic estimates for five individual human CYPs as well as site‐of‐metabolism predictions for each of nine isoforms. It is used here to illustrate general points that should be borne in mind when working with metabolism and toxicity prediction software, in part because it offers a wide range of endpoint predictions (Table S1) that makes it easy to illustrate how the various model outputs can be combined and in part because of its availability to the author.
3. TOXICITY PREDICTION
3.1. Ames testing in silico
Despite the questions that have been raised about their relevance to pesticide registration,11, 12 Ames mutagenicity tests13 remain a major regulatory hurdle that must be passed early in agrochemical pesticide development. Although hundreds of thousands of these assays have been performed, the majority of the results obtained are not publicly available. Compounds that tested positive early in development and were not followed up are underrepresented because there is no legal requirement to publish such results. Hence the available training data are not representative of the compounds for which a prediction is desired.
Most literature compilations generated for building QSAR models are skewed in the other direction, often being unrepresentatively balanced because the model‐building tools used tend to work poorly on unbalanced data. This is unfortunate, as weighting the contributions to the output (‘objective’) function14, 15 by class size can generally accommodate class imbalances without ‘down sampling’ the larger class to artificially balance the training data.
Multiple assay outcomes contribute to an Ames test result: five bacterial strains bearing different inactivating mutations in the target gene are checked for reversion when treated with the test compound alone or with reduced nicotinamide adenine dinucleotide phosphate (NADPH) and the S9 microsomal fraction from rat liver.13 A ‘positive’ in any single assay means that the compound in question gets categorized as ‘mutagenic.’ Compilations of the overall outcome, however, almost always categorize outcomes as simply ‘positive’ or ‘negative.’ Hence most of the many QSAR models that have been built to predict them are binary classification models built on binary categorization data. This unnecessarily discards potentially useful information about mutation events specific to one particular gene sequence.
In silico Ames tests illustrate the range of approaches that can be used to model toxicity. The Computer Automated Structure Evaluation (CASE) program (MultiCASE Inc. Beachwood, OH, USA; http://www.multicase.com), Derek Nexus (Lhasa Ltd; Leeds, United Kingdom; http://www.lhasalimited.org), and the Genetox Expert Alerts in Leadscope's Non‐human Genetic Toxicity Suite Columbus, OH, USA; (http://www.leadscope.com) are expert systems that look for particular substructures (‘alerts’, ‘toxicophores’ or ‘biophores’) that have been found in compounds that have tested positive in vitro. In practice, any such ‘guilt by association’ must be tempered by allowing for the possibility that other substructures elsewhere in the molecule may attenuate or eliminate such toxicity. Such programs are broadly applicable but intrinsically qualitative in nature.
In many cases, such systems also provide an indication of the likely mode of action for a compound predicted to be toxic, e.g., by returning strain‐specific Ames test results for similar compounds. They are ‘top down’ in the sense that the binary test result (positive or negative) is the modeled endpoint, rather than the individual bacterial strain(s) responsible for that overall result. This can be unfortunate, as the information discarded can provide clues about the likely mechanism of DNA damage underlying the predicted mutagenicity.
‘Statistical’ models take a different approach. Sarah Nexus (Lhasa Ltd), Leadscope's Genetox QSAR Models, and ADMET Predictor's Toxicity Module all fall into this category. The first two return binary classifications and make use of substructure descriptors. ADMET Predictor differs in that it relies mostly on molecular descriptors. Statistical models are typically better able to provide a more quantitative indication of how reliable a particular prediction is going to be, i.e., of how confident one can be in it.14
The ‘bottom‐up’ approach taken in ADMET Predictor creates a separate model for each of the ten constituent assays, then combines the results into an overall mutagenicity risk. The default behavior is to flag a compound as probably mutagenic in the aggregated output16 if the compound is predicted to give a positive result for more than one strain. Doing so allows for one of the predictions to be an in silico false positive, which is consistent with the reproducibility of the Ames assay itself – about 85% even allowing replicate tests to resolve borderline cases.17 It also allows for the presence of spurious ‘positive’ results in the training data for compounds (e.g., ALS inhibitors) that may stress the bacteria used in the test. One can adjust that threshold if a more or less conservative criterion is desired. It makes sense, for example, to apply a less stringent filter early in discovery when large numbers of compounds are being considered.
In a ‘real’ Ames test, assays are replicated and borderline or ambiguous results prompt a retest. The equivalent for in silico ‘assays’ is to attach a confidence or uncertainty to each prediction. Having some such a measure attached to each prediction is especially important for cases where only one of the ten models returns a ‘positive’ prediction.
A recent publication18 provides a more thorough discussion of how the various in silico models for bacterial mutagenicity work and an evaluation of their performance.
3.2. Predictive uncertainty
Any in silico property prediction for a new compound should not be limited to absolute terms. Rather, it should come with two qualifications: an estimate of how reliable that prediction is likely to be and an indication of whether or not the compound is reasonably similar to the compounds used to build the model – i.e., whether it is ‘out of scope’ because it falls outside the model's ‘applicability domain’. The two kinds of qualification are connected, especially when the only reliability estimate is a measure of the average quality of prediction.
For classification models, performance statistics like sensitivity (the fraction of positive examples that are correctly classified), specificity (the fraction of negatives that are correctly classified), or the positive and negative predictive values (the fraction of positive and negative predictions that are correct) are typically reported. For regression models, the most relevant statistic is the root mean square error or the mean absolute error. The coefficient of determination (R 2) is often reported as well, but it is very sensitive to the range of the dependent variable and discounts linear systematic biases. Whatever the statistic, the value obtained for the test set – compounds set aside and not used in any way to train the model – is the best indicator of what to expect for predictions made for new compounds.
The test set sensitivities for the ten component models provided in ADMET Predictor 8.5 for the in silico Ames test are fairly representative of useful classification models, ranging from 0.80 to 0.89. The corresponding specificities range from 0.81 to 0.92. Underlying differences in assay sensitivity and in the kind of compounds tested lead to differing degrees of imbalance between positive and negative examples, with ratios ranging from 2.2:1 to 7.3:1. Acute rat toxicity is a fairly typical regression model. The root mean square error and mean absolute error statistics for it are 0.59 and 0.45, respectively, on the logarithmic scale upon which that model was built. The former translates to a geometric mean fold error of 3.9‐fold, which is fairly typical for an in vivo toxicity endpoint.
Regardless of which performance statistic is reported, it can only be relied on to reflect the typical uncertainty for compounds that lie close to or within the model's applicability domain; all bets are off for compounds that fall very far outside of it.
Applicability domains can be defined by a molecule's structure or by its properties. The former approach is based on some measure of similarity, typically one based on the number of shared substructures. The latter approach is based on how similar the properties of the molecule of interest are to those of compounds used in model building. Similarity in this case is determined by distance in the descriptor space or by whether some properties of the new compound (usually in the form of descriptors) fall outside the range seen for compounds used to construct the model. Different models are often built from different data sets and can use different descriptors, so a compound that is out of scope for one model may be in scope for another.
An implicit assumption is often made when reporting aggregate statistics and an applicability domain that all predictions within the applicability domain are equally reliable, which is demonstrably not always the case.19 It would be better to make use of confidence models that relate predictive absolute or squared errors to some set of molecular descriptors19, 20, 21 or to the spread in predictions from an ensemble model.14, 22 Robust methods for estimating how much confidence one should have in an individual prediction have only recently become an active area of research, however, so they are not yet available in some software packages.
3.3. Putting predictions in context
Most programs that model metabolic fate or toxicity return predictions for multiple endpoints (Table S1). ADMET Predictor, for example, generates predictions for many distinct toxicity endpoints. Twenty‐three that are particularly relevant to mammalian toxicity are shown in Table S2. One of the most challenging aspects of presenting that much information all at once lies in finding effective and efficient ways to communicate the results. Full details (e.g., training set sizes, data sources, plots of predicted versus observed values) are available in the documentation provided with most programs, but the interface spreadsheet should provide the structure of each molecule of interest; a brief description of aggregate statistics for each model; and – where available – a classification confidence estimate. Predictions for out‐of‐scope compounds should be highlighted in such a way that cells can be color‐coded without losing information. Confidence estimates are not necessarily well defined for those compounds, so it is best not to provide individual confidence estimates for them. There are many different ways to address the need to integrate data visually. Most programs opt for a spreadsheet, tiled or data page format. Some support multiple data presentation modes.
Spreadsheets are most useful for considering many properties of many compounds at once, whereas tiled views are well suited for visualizing structural diversity across one or a few properties. Data pages are for analyzing many predictions for one or a few compounds. The conventions used in ADMET Predictor's spreadsheet are illustrated in Fig. 1. As is typical, abbreviations are used extensively to maximize the density of information.
Figure 1.

Displaying some toxicity predictions for four herbicides. The two entries for pyrasulfatole correspond to its major (hydroxyl) and minor (keto) tautomers. The ‘Target’ column indicates the mode of herbicidal action: 4‐hydroxyphenylpyruvate dioxygenase (HPPD) inhibition, protoporphyrinogen IX oxidase (PPO) or acetolactate synthase (ALS) inhibition. The ‘Tox’ star plots summarize relative toxicity predictions. Moving clockwise from 12 o'clock: skin and respiratory sensitization (green and blue wedges); acute rat toxicity (magenta); chronic rat and mouse toxicity (yellow and red); hepatotoxicity markers serum aspartate transaminase, alanine aminotransferase and lactate dehydrogenase (cyan, purple and gray, respectively); and mutagenicity risk (blue). Cross‐hatched wedges represent predictions for out‐of‐scope compounds. The toxicity risk score shown in the ‘TOX Risk’ column ranges from 0 to 6; it is ≥ 2.0 for 17% of the compounds in a reference set of pharmaceuticals from the World Drug Index. Mnemonics shown in the ‘TOX Code’ column indicate the potential liability identified: mutagenicity (‘MUT’), hepatotoxicity (‘HEPX’), chronic mouse toxicity (‘Xm’); and acute rat toxicity (‘rat’). The ten wedges shown in the in silico Ames mutagenicity (‘Ames Mut’) column correspond to pairs of predictions (e.g., MUT_97+1537 and MUT_m97+1537; the latter is activated with S9 microsomal fraction) for the five standard mutant gene sequences assayed. Results for four of assays are presented in the ‘MUT‐XXX’ columns. The ‘Rat_Acute’ column gives the predicted 50% lethal dose for acute rat toxicity in units of mg/kg body weight. The image was generated using ADMET Predictor 8.5.
One way to relate disparate predictions to each other and to visualize trends across compounds is to color‐code cells in a spreadsheet based on their value, i.e., from red to blue to generate a ‘heat map’. Another is to provide radar or star plots. Using star plots has the virtue of making it easier to convey predicted values while highlighting any that are out of scope, e.g., by using hashed fill patterns for the corresponding wedges rather than solid fills (Fig. 1). A more complete set of physicochemical and toxicological property predictions for the 40 agrochemicals evaluated is provided in Table S2. The results shown in Fig. 1 illustrate some of the subtleties that interpreting in silico predictions can involve. The 4‐hydroxyphenylpyruvate dioxygenase (HPPD) inhibitor mesotrione is shown in the first row of the spreadsheet. It has a mutagenicity risk of 2 and so is flagged as potentially being mutagenic in the Ames assay, which it is not. The positive predictions for strain TA97 tested without S9 activation (‘S97’) and TA102 (‘S102’) are both weak positives, however, with confidences of only 42 and 46%.
Positive predictions with confidences < 50% are allowed in such models because the immediate cost of a false alarm is much less than the downstream cost of mischaracterizing a mutagen. Whether it actually merits being resolved by running an Ames assay rather than being taken at face value depends on the quality and quantity of alternative leads available.
Oxyfluorfen (second row) is correctly predicted to be hepatotoxic (as indicated by the entry in the toxicity code column) but not mutagenic.23 Mutagenicity predictions are shown in the ‘Ames Mut’ column. Salmonella strains TA98 (yellow wedge) and strain TA100 (red and cyan wedges) tend to both be positive or both be negative, so each adds only 0.5 to the predicted mutagenicity risk score when either of its two results (with or without S9 activation) is positive. The total mutagenicity risk score is 1 in this case and no mutagenicity flag is set in the mutagenicity risk code column.
Florasulam (the ALS inhibitor shown in the third row) is predicted to elevate serum levels for two liver enzymes: aspartate aminotransferase and lactate dehydrogenase, represented by the cyan and gray wedges, respectively. Alanine aminotransferase is predicted to be normal, however, so no hepatotoxicity flag is set for it; requiring both aminotransferases to be elevated parallels the way clinical laboratory results are interpreted. The mutagenicity risk for florasulam is also 0. Two of the negative predictions are out of scope, however, which puts the overall classification in doubt; the recommendation for it would be to run the in vitro test. Besides resolving this particular ambiguity, the data obtained for it and similar out‐of‐scope compounds could eventually be used to build a local model or to build a new global model with an expanded applicability domain.
Two tautomeric forms of the HPPD inhibitor topramazone are shown in the last rows of Fig. 1. The hydroxyl form predominates in aqueous solution, but a significant fraction is in the minor form at equilibrium. In such a situation it is prudent to consider the predicted properties of both. Both tautomers are predicted to elevate serum levels of aspartate aminotransferase (cyan wedge), but only the minor tautomer is predicted to elevate alanine transaminase levels. Lactate dehydrogenase must also be elevated for the hepatotoxicity flag to be set, but its serum levels are predicted to be normal. Its herbicidal activity is attributable to inhibition of plant HPPD, but that enzyme is also found in mammals. The elevated serum tyrosine levels that HPPD inhibition produces in rats causes a range of transient toxic effects, albeit non‐lethal ones.24 This is consistent with the acute rat toxicity flag being set, as is shown in Fig. 1, which is also set for five of 13 other HPPD inhibitors examined (Table S2). The toxicity risk score of 0.76 reflects the fact that both the predicted acute rat toxicity (LD50 270 mg kg−1; right‐most column shown in Fig. 1) and the predicted mouse chronic toxicity (LD50 30 mg kg−1 day−1; not shown) are borderline when compared with a panel of 2270 commercial drugs.16
4. METABOLIC PREDICTIONS
Pharmaceutical side effects are often attributable to metabolites of active ingredients rather than the drugs themselves. The same can be true for pesticides and their crop residues, but in their case conversion to innocuous metabolites can be advantageous if the parent pesticide is toxic.
Occupational exposure of human beings to intact pesticide molecules and their metabolites is dominated by three routes: through the skin (dermal), by inhalation and by ingestion. Modeling the first two routes accurately requires the sort of detailed pharmacokinetic simulations carried out late in development. Exposure via those routes also typically depends on the physical form in which the pesticide is delivered to the subject rather than on the pesticide's molecular structure, so they are much less well suited to QSAR modeling. The focus here is on ‘first pass’ metabolism after ingestion, which includes all enzymatic transformations that take place as pesticides and other xenobiotics move through the enterocytes lining the gut and – via the portal vein – through the liver to the general circulation. These transformations fall into three broad categories: hydrolytic, conjugative and oxidative. Each kind of transformation is carried out by systems that are generally similar in plants, pests and animals but that can differ sharply in the particulars.25
4.1. Hydrolytic and conjugative metabolism
Hydrolytic enzymes involved in pesticide metabolism can be very specific but they usually are not. In most cases, they attack a compound because it is designed to be hydrolyzed nonspecifically, typically to unmask a structural element – e.g., a phenolic hydroxyl group or carboxylate – that is required for a desired effect within the target organism but would interfere with absorption. Esters of carboxylic acids are more hydrophobic than the acids themselves, so they penetrate plant cuticles more readily. This makes esterification a popular way to create pro‐pesticides,26, 27 in part because the enzymes that cleave them are ubiquitous. Hence esters that are readily cleaved in plants, fungi or insects are also likely to be cleaved in the human gastrointestinal tract or liver.28 There is rarely much point in trying to build a QSAR model for such a reaction. The better approach to pro‐pesticides is to identify ethyl and other short‐chain, unbranched esters29 and ‘cleave’ them in silico before applying QSAR models. Failure to do so is likely to generate false negatives during development projects and when comparing predictions to in vivo metabolite profiles during model validation. Failure to account for esterases present in microsomes by including a control lacking the NADPH required by CYPs, on the other hand, is likely to produce false positives for oxidative metabolism.
Sulfotransferases and UDP‐glucuronosyltransferases (UGTs) are the dominant mammalian metabolic conjugative enzymes for electron‐rich groups like alcohols, phenols, carboxylic acids, amines and aromatic nitrogens. Glutathione‐S‐transferases (GSTs), in contrast, act at electron‐deficient sites (e.g., in halogenated molecules and quinones). The conjugates produced by both kinds of enzyme are more water soluble than the parent compounds and ‘targeted’ for excretion. Susceptible sites are less common in pharmaceuticals than in their primary (‘Phase I’) metabolites, which has led to the sulfotransferases, UGTs and GSTs being classified as secondary (‘Phase II’) metabolic enzymes.
This generalization is less applicable to natural products and pesticides. Chloroacetamide herbicides and safeners, in particular, are good substrates for mammalian GSTs. As it happens, they and their conjugated metabolites are also subject to CYP oxidation to quinonimines that then undergo a second round of glutathione conjugation in rats.30, 31
Very little detailed information is available regarding the specificity of sulfotransferases and their levels of expression tend to be quite variable. Enough information is available to construct QSAR models for predicting those UGT isoforms for which a compound is likely to be a substrate, especially when the glucuronide formed is stable. Identifying the site of glucuronidation is difficult when the metabolite is prone to rearrangement or spontaneous hydrolysis back to the parent. This is a practical as well as a technical challenge: if a particular product is correctly predicted to form but spontaneously rearranges or breaks down under assay conditions to regenerate the parent compound, is the prediction correct or not?
Unfortunately, other analytical difficulties limit the amount of useful kinetic information available for UGTs and makes them difficult to model.28 In particular, the active sites of UGTs are internally oriented (facing the lumen) in liver microsomes.29 Hence in vivo activity often depends on transporters that are inactive in the microsomal preparations used in vitro, necessitating the addition of detergent to make the enzymes accessible to the substrate. This distorts kinetics and means that many compounds that test ‘positive’ as substrates in vitro turn out not to be glucuronidated in vivo. As a result, most available UGT site‐of‐metabolism models are based mostly on metabolites identified through in vivo analysis.
4.2. Oxidative metabolism
Mammals have several oxidative enzyme systems for degrading xenobiotics, including aldehyde oxidase and monoamine oxidase. CYPs are the most broadly active and best studied group of oxidative enzymes, however, and one which is very relevant to pesticides.32, 33 CYP kinetic behavior can be complex, but is straightforward enough that a great deal of data are available from which to build models. Many of those data sets are in need of extensive curation, however. The CYP literature is rife with errors as a consequence of the complex nomenclature of metabolites, typographical errors in activity units, and data from mutant enzymes being ascribed to wild‐type enzymes.34 A unique source of inconsistency is the older data obtained from bespoke recombinant and reconstituted assay systems used before robust commercial preparations containing a single CYP isoform and NADPH:cytochrome P450 reductase35 became available.
Even with those caveats, CYP metabolic transformations are much more amenable to QSAR modeling than are those carried out by UGTs. Indeed, reasonably ‘good’ predictions are easy in some uncomplicated scenarios. Suppose one knows, for example, that a compound is a substrate for CYP1A2, ‐2C9, ‐2D6 or ‐3A4 and that it is a substrate for only one of the four. One can assign the correct isoform most of the time by applying a few simple rules of thumb in sequence: acids are CYP2C9 substrates; large molecules are CYP3A4 substrates; flat (aromatic) molecules are CYP1A2 substrates; and anything else is a CYP2D6 substrate. For compounds that satisfy the assumptions, the compound will be assigned correctly most of the time.36 Such simplified models have very narrow ranges of applicability, however. Many compounds are not substrates for any of those four CYPs but are substrates for another isoform, and many more are substrates for at least two of the four isoforms. More generally applicable models are much harder to construct.
Programs need to make a lot of predictions to cover the relevant enzymatic properties for enough metabolic enzymes to be useful. ADMET Predictor, for example, generates over 58 different metabolic predictions (Table S3). Of those, 36 come from substrate/nonsubstrate classification or site‐of‐metabolism models for nine recombinant human CYPs as well as kinetic models for K m, maximal rate of reaction (Vmax) and intrinsic microsomal clearance for the five isoforms that dominate human xenobiotic metabolism – CYPs 1A2, 2C9, 2C19, 2D6, and 3A4. See Table S1 for the scope of other software packages. For predicting bioavailability, it is also important to predict total CYP activity in human and rat liver microsomes. Even that level of detail fails to fully account for the existence of multiple alleles for some CYPs or variations in expression levels across ethnic groups. It also fails to address metabolism in many other species (e.g., cattle37 and other livestock) that are relevant to agrochemical pesticide development.
Only data from substrates can contribute to a kinetic QSAR model, so it is a good idea to create a complementary substrate/nonsubstrate classification model if possible. It is difficult or impossible for a kinetic regression model to ‘learn’ about molecules that are too big to enter the binding cavity of an enzyme, for example, if they never ‘see’ them. Most nonsubstrate examples for CYPs are necessarily presumptive, in that they have not been reported as a substrate for the isoform being modeled but they have been reported to be substrates for some other CYP. Similarly, negative examples for sites of metabolism are sites that have not been reported in molecules for which some site has been reported. Such absence of evidence is only circumstantial evidence of absence, however. As a result, it is not uncommon for seemingly erroneous predictions made by good CYP models to be proven correct after the fact.34
The constrained promiscuity of CYPs makes this a particularly important consideration. The constraint comes from an unusual form of evolutionary selection pressure due to what they must not metabolize. A mutation that causes a CYP to oxidize glucose, for example, will make the liver unable to carry out glycolysis and will deplete the NAD(P)H reductant pool in cells where it is expressed. That will likely be fatal even if the oxidation product is innocuous, because it short‐circuits gluconeogenesis. Having robust substrate classification models makes it possible to identify xenobiotics that are not CYP substrates because they ‘resemble’ privileged endogenous molecules, and do so in a way that models built only upon data for substrates cannot.
4.3. Identifying sites of CYP metabolism
CYP oxidation typically involves direct attack on the lone pair of a heteroatom or hydrogen atom abstraction from a carbon. Stability of the free radical produced is necessary for oxidation but it is not a sufficient condition: the substrate must be bound in such a way that the atom to be oxidized lies close enough to the activated oxygen bound to the CYP's heme to react.33 The ease of oxidation per se is a fairly localized atomic property that is essentially the same for all CYP isoforms. Most differences between CYPs therefore reflect differences in binding. Nonetheless, the size and plasticity of CYP binding sites in general and of CYP3A isoforms in particular mean that many compounds can bind in more than one way to each isoform. Alternative binding modes subject substrates to attack at multiple sites as a result, which leads to multiple metabolites being produced.
All of these considerations make predicting sites of metabolism by docking alone difficult.9, 38 QSAR approaches have been somewhat more successful.39, 40, 41 The result of applying site of metabolism models to the dominant tautomer of pyrasulfotole (an HPPD inhibitor), for example, is shown in Fig. 2. The methyl groups at N1 and C3 are highlighted as being potentially susceptible to attack, as is the unsubstituted N2. This is indicated by the cross‐hatched circles around the atoms in the output and the arrows added for emphasis in the figure.
Figure 2.

Predicted sites of metabolism for pyrasulfotole for the major human CYP isoforms. Gray arrows and crosshatching indicate potential sites of metabolism by CYPs predicted not to attack the herbicide, whereas red arrows and crosshatching indicate likely sites of metabolism for isoforms for which pyrasulfotole is predicted to be a substrate.
The corresponding CYP substrate classification models, however, predict that the herbicide is not likely to be a substrate for CYP1A2, ‐2C19 or ‐2D6. Here, the highlighting is gray for those isoforms to indicate the sites predicted if – contrary to expectations – they are substrates, which can be helpful if direct assay indicates that it has been misclassified by the substrate/nonsubstrate model. The highlighting is red for CYP2C9 and CYP3A4 to indicate that they are predicted to oxidize the herbicide. The overall prediction is that the two methyl groups on the pyrazole ring will be oxidized but that the unsubstituted nitrogen will not.
The C3‐hydroxy metabolite M1 is predicted to be nontoxic and subject to glucuronidation (not shown). The N‐demethylated metabolite M2, in contrast, is predicted to be hepatotoxic and to have an acute rat 50% lethal dose (LD50) of 23 mg kg−1. That would make it more than 20 times more potent that pyrasulfatole itself, which is not predicted to be hepatotoxic (Fig. 1). That probably reflects the exposure of the unsubstituted hydrazide [C(=O)NHNH] group by demethylation. The prediction may reflect inhibition of rat HPPD, but it is impossible to tell; the acute rat toxicity model is ‘top‐down’ in nature, so mechanistic details are not predicted.
Other programs use color‐coded circles and/or halos to convey the predicted susceptibility to attack. Doing so does a good job of communicating the ‘fuzziness’ of site‐of‐metabolism predictions.
4.4. Quantitative CYP metabolite prediction
Identifying sites of metabolism does not itself predict observable metabolites, because the immediate oxidation products are often unstable. Moreover, it says nothing about the distribution of metabolites; doing that requires kinetic property predictions. These can differ for different sites, although the CYP affinities (K m values) are often fairly similar. Most K m values are 10 μm or above, as is common for promiscuous enzymes. The main exception is CYP2D6, which often exhibits sub‐micromolar K m values for its substrates.
As noted above, one CYP can attack multiple sites on the same molecule and different CYPs can attack the same site. In some cases, attack at different sites can yield the same product. This makes it important to integrate the various predictions so as to provide metabolic maps similar to that shown in Fig. 3 for the dominant tautomer of pyrasulfotole (the map for the minor keto tautomer, which is qualitatively similar, is not shown). It might be possible to recover the metastable N‐hydroxymethyl intermediate, but in most circumstances it will spontaneously eliminate formaldehyde to form M2. The keto tautomer shown is predicted to be the more stable one for the desmethyl compound.
Figure 3.

CYP metabolites and yields predicted for the 5‐hydroxytautomer of pyrasulfotole. The total CYP intrinsic clearance estimates for the five major CYP isoforms in human liver microsomes and for rat liver microsomes are indicated below the parent herbicide. The parenthetical values along the reaction arrows indicate the intrinsic clearances for the associated CYP isoforms for that pathway. Reaction arrows without CYP annotations represent spontaneous or enzymatic reactions. The benzoic acid metabolite shown is expected to result from several further rounds of oxidation of M2; it was added manually to the figure.
Having an estimate for the overall intrinsic clearance provides an indication of how rapidly a compound will be metabolized, and having predictions for each CYP isoform at each site makes it possible to estimate the relative proportions of each that will be produced. For pyrasulfotole, the ratio of C‐hydroxymethyl M1 to N‐desmethyl product M2 is predicted to be about 2:1 (Fig. 3). The metabolism scheme shown provides a succinct summary of data from 23 separate CYP models: nine for substrate classification, nine for site of metabolism identification, and five for clearance kinetics. Such metabolic maps for human CYPs do not necessarily translate directly to rats, which have a different complement of CYP isoforms. That said, the major CYPs in the respective species (CYP3A4 and CYP3A1) belong to the same family (3A) and have somewhat similar substrate specificities.
This prediction turns out to be consistent with the available experimental data from the TOXNET record for pyrasulfotole (AE 0317309; http://www.TOXNET.nlm.nih.gov, accessed November 2017), which states that:
Following both oral and intravenous administration [in rat], most of the dose was excreted unchanged as AE 0317309. Hydroxymethyl AE 0317309, desmethyl AE 0317309, and AE B197555 were observed as minor metabolites in the urine and feces. Following oral dosing, approximately 70% of the radioactivity was excreted in the urine and 30% in the feces by 48 or 52 hr.
The reported fraction absorbed (70%) is less than the 100% predicted (Table S3). That may reflect errors in one or more of the property predictions involved or it may reflect microbial degradation in the gut.42, 43
QSAR models are not available for individual CYP isoforms from rat, but models of overall CYP metabolism by rat liver microsomes are. The small extent of metabolism reported is consistent with the relatively low predicted intrinsic clearance (16 μL min−1 mg−1 microsomal protein) for rat liver microsomes. Binding to plasma proteins will further attenuate metabolism by reducing the amount of free herbicide available to diffuse into the hepatocytes where CYPs can act upon it. The low predicted fraction unbound in rat (6%) is also consistent with the metabolic profile obtained experimentally.
AE B197555 is the benzoic acid formed by complete removal of the pyrazole ring in pyrasulfotole, possibly via subsequent oxidation of M2. That possibility can be explored manually metabolite by metabolite, but it is more convenient to generate metabolites across multiple steps en masse; that makes it easy to check each metabolite for predicted toxicity. In doing so, however, it is important to take note of the expected overall yield as well as the likely total clearance rate. Metabolites that are cleared faster than they are generated are unlikely to be a problem. Aromatic aldehydes generated by oxidation of hydroxymethyl groups like the one in M1 above are a case in point. Were they to accumulate, they would likely have significant toxic effects. In most cases they do not, because they are rapidly oxidized to the corresponding (usually innocuous) carboxylic acid by a CYP or by aldehyde oxidase.
The availability of individual quantitative clearance models makes it possible to evaluate this possibility in humans. Estimates for intrinsic clearance by other enzyme classes and in other species than human and rat are out of reach unless experimental data become available. The same is true for active transport processes, e.g., in the kidney.
5. BIOAVAILABILITY AND EXPOSURE
The intrinsic mammalian toxicity of a compound and its metabolites are important considerations in pesticide development, but they need to be considered in light of the likely systemic exposure to the parent compound. In some cases, the pesticide itself is innocuous but its metabolites are toxic. This section describes how QSAR models for ADME properties in general and CYP activity in particular can be used to estimate how much of an orally delivered bolus of pesticide is likely to reach the general circulation in humans and rats.
Many things must be taken into account when estimating exposure, including: how pesticide molecules get into an organism (absorption); how they move through its body (distribution); how they are biochemically transformed within the body (metabolism); and how they are cleared from the body (excretion). Each ADME property is important, but it is how they interact that determines toxicological exposure. Whether a xenobiotic is metabolized in the liver or not, for example, is largely irrelevant if it is not absorbed from the gut or distributed through the body.
Such interactions can be complex but in most cases they can be well simulated once the relevant ADME properties are known (or can be accurately predicted) by applying physiologically based pharmacokinetic modeling.44, 45 Doing so can also make it possible to understand differences between toxicity in humans and other mammals37 that result from differences in exposure. GastroPlus™ (Simulations Plus, Inc.; Lancaster, CA, USA; http://www.simulations-plus.com), SimCyp® (Certara; https://www.certara.com/software/pbpk-modeling-and-simulation Princeton, NJ, USA) and PK‐Sim® (Bayer; Leverkusen, Germany; http://www.systems-biology.com/) are among the programs available for carrying out detailed analyses of such processes.46, 47
The compound‐dependent parameters needed for pharmacokinetic simulations can be obtained from physicochemical measurements and biochemical assays late in development, but they are unlikely to be available earlier on and in silico QSAR models must be used. The biochemistry is different in different species, so multiple models are required. Because the amount of data in the public domain is limited, all of the purely in silico models needed are only available for human and rat at present.
Absorption of ingested compounds involves generic physicochemical properties like solubility and lipophilicity (logP). Only passive uptake is considered in the pharmacokinetic simulations provided in ADMET Predictor, which use a streamlined, ‘high‐throughput’ version of the advanced compartmental and transit model from GastroPlus to predict the fraction absorbed (F a) along the full length of the gastrointestinal tract. Active transport can affect absorption, but the only general models available are qualitative ones that classify a compound as an inhibitor or substrate (Table S1). The data required for constructing useful quantitative models are lacking. Fortunately, ignoring the case where active transport is most likely to occur – P‐glycoprotein efflux in the gut – yields a conservative estimate of exposure.
Distribution is usually dominated by binding to proteins in the plasma, blood cells, and lipids in the various organs and peripheral tissues. For pesticides, most such binding is relatively non‐specific and likely to be non‐saturable at relevant plasma concentrations. It is governed mostly by lipophilicity and ionization – e.g., whether a molecule is neutral, acidic, basic or zwitterionic at physiological pH. Its relevance in the kind of simple scenarios considered early in agrochemical development mostly involves how freely a compound can diffuse from the blood into the liver, where it can be metabolized.
Metabolism in such simulations can usually be approximated reasonably well by assuming it all takes place in the liver. In the absence of experimental data, the hepatic clearance is calculated from the total CYP liver microsomal clearance predicted for the relevant species. The fraction that reaches the general circulation after first‐pass hepatic extraction is the fraction bioavailable (F b).
Predicted F a and F b values for 31 selected pesticides are shown in Table S3 and Fig. 4 along with those for significant alternative tautomeric forms and ester hydrolysis products. Note that the fraction that survives passage through the liver cannot be higher than the fraction absorbed (F a), so all points fall below the diagonal 1:1 line in panels A and B.
Figure 4.
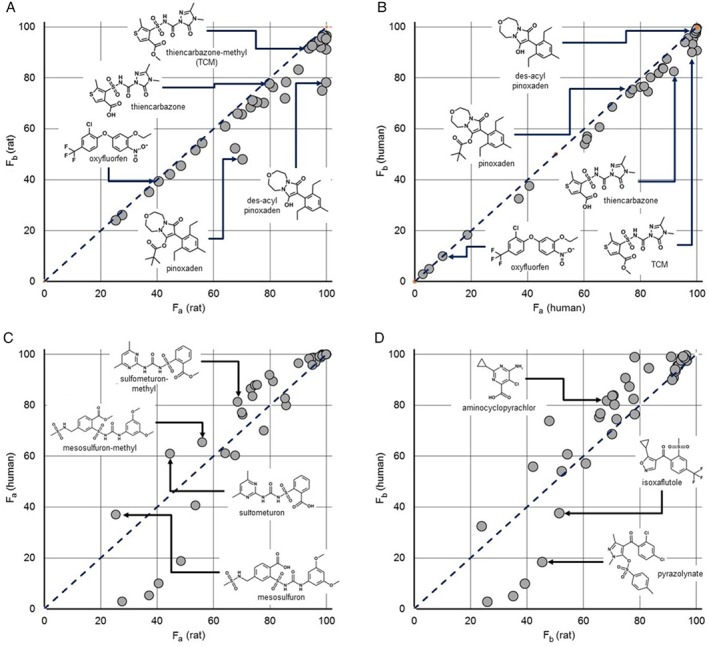
High‐throughput pharmacokinetic simulation results for selected agrochemicals and their hydrolysis products dosed at 100 μg in 2.5 mL of water (rat) or at 10 mg in 250 mL of water (human). Gastrointestinal absorption was modeled using the advanced compartmental absorption system developed for GastroPlus with subsequent liver metabolism calculated on the basis of the rat or human intrinsic clearance models in ADMET Predictor 8.5 and renal clearance calculated from the glomerular filtration rate. (a) Estimated percent bioavailable (F b) as a function of the expected percent absorbed (F a) in a fasted 250‐g rat. (b) Estimated F b as a function of F a in a 70‐kg fasted human male. (c) Estimated human F a as a function of estimated rat F a. (d) Estimated human F b as a function of estimated rat F b.
Some of the predictions displayed in Fig. 4 illustrate the reason it is important to consider how physicochemical properties interact with dose when evaluating exposure. In particular, oxyfluorfen absorption and metabolism (the degree to which F b falls below the diagonal) are quite low in both species despite its predicted hydrophobicity (logP and logD at pH 7.4), which is shown in Table 1 along with some other relevant property predictions. A more thorough list is provided in Tables S2 and S3. As expected, the passive intestinal permeability is predicted to increase with increasing hydrophobicity, but this is offset in many cases by the concomitant decrease in predicted aqueous solubility.
Table 1.
Predicted ADMET properties for selected agrochemicals.a
| Compound name | logP | logD 7.4 | Water solubility (μg mL−1) | P eff b (cm s−1 × 10⁴) | Acute rat toxicityc (mg kg−1) |
|---|---|---|---|---|---|
| Thiencarbazone‐methyl | 1.27 | 0.13 | 65 | 1.67 | 1374 |
| Thiencarbazone | 1.09 | −1.52 | 184 | 1.24 | 1986 |
| Oxyfluorfen | 4.84 | 4.84 | 0.40 | 7.98 | 829 |
| Pinoxaden | 4.09 | 4.09 | 6.6 | 4.27 | 917 |
| Des‐acyl pinoxaden | 2.45 | 1.94 | 132 | 3.05 | 399 |
| Sulfometuron methyl | 1.46 | −0.32 | 253 | 0.61 | 5031 |
| Sulfometuron | 1.03 | −2.01 | 468 | 0.40 | 6266 |
| Mesosulfuron‐methyl | 1.86 | 0.67 | 614 | 0.26 | 2248 |
| Mesosulfuron | 1.46 | −1.09 | 1091 | 0.17 | 2376 |
| Aminocyclopyrachlor | 0.72 | −1.51 | 438 | 0.92 | 1399 |
| Isoxaflutole | 2.56 | 2.56 | 2.6 | 3.55 | 182 |
| Pyrazolynate | 4.56 | 4.56 | 1.0 | 2.94 | 1159 |
Predictions were generated using ADMET Predictor 8.5 (Simulations Plus, Inc).
P eff is the passive uptake component of effective jejunal permeability.
The predicted acute rat toxicity prediction is expressed as the LD50, i.e., the dose required to kill half of the animals.
The rate of absorption is proportional to the product of the concentration of compound free in solution and its effective permeability. The simulation results shown in Fig. 4 are based on doses of 0.1 mg in 2.5 mL for rats and 10 mg in 250 mL for humans, i.e., a nominal concentration of 40 μg mL−1. This is well below the predicted acutely toxic doses for a 250‐g rat. It is, however, well above the solubilities of oxyfluorfen, pinoxaden, isoxaflutole and pyrazolynate, which accounts for their relatively low predicted bioavailability.
Formulation effects (e.g., gavage dosing as dispersions in vegetable oil) can be complicated and are hard to account for mechanistically. That said, the effects are qualitatively similar to that of bile salts, which have been taken into account here. More sophisticated programs can be used if more exact simulations are needed, but commercial formulations are unlikely to be known anyway early in development.
Limiting solubility probably also underlies the fact that the pinoxaden is less well absorbed than its des‐acyl hydrolysis product: the latter is more polar but also much more soluble. The relationship between thiencarbazone, sulfometuron and mesosulfuron and their methyl esters is more straightforward: the more lipophilic ester is better absorbed when its solubility is not limiting.
The kind of differences seen in panels C and D in Fig. 4 illustrate those to be expected between rat and human absorption and bioavailability. They are substantial in many cases. Such discrepancies show the limits to which rodent studies can be expected to anticipate what will be seen in humans, but they also demonstrate how mechanistic simulations can be used to account for the differences between species. Moreover, experimental confirmation of rat simulation predictions for advanced candidate molecules will increase confidence in the corresponding predictions of human exposure.
6. CAVEATS
Models of the kind described here can be very useful, but they need to be applied with some care.48 Their predictive accuracy varies with the chemistry involved, so the best way to assess their usefulness for a particular area of chemistry is to compare their predictions to the observed values for compounds one has recently encountered whose properties have been measured. Applicability domain information alone may not be adequate for herbicides, which are not well represented in many ADMET data sets.49 Moreover, training sets are likely to be biased towards either very well‐behaved commercial compounds or notorious ones like methyl viologen and dioxins, for example, instead of the kind of lead compounds likely to be encountered in agrochemical discovery and development.
One should, in principle, be able to assess how well different models perform by comparing the predictive statistics obtained for test sets held back when building the models. Table S4 gives training pool and test set statistics for the site of metabolism models in ADMET Predictor. In practice, this does not work as well as one would like, in part because different test sets are chosen for each model. Site of metabolism models suffer from a further complication: some authors include atoms which cannot be sites of metabolism (e.g., quaternary carbons, carbonyl oxygens or sulfonyl groups) when calculating statistics. Then, too, they may report unusual performance measures such as ‘top 2’ (or ‘top 3’) for sites of metabolism: a ‘hit’ is scored if metabolism has been reported at any site ranked among the top ranked two (or three) for a molecule. Table S4 includes ‘top 1’, ‘top 2’ and ‘top 3’ statistics to illustrate the effect the different criteria have on the statistics obtained.
Comparisons between programs are best done by third parties who have access to most or all of the programs that are available. Ideally the validation data used represent measurements carried out with the same assay and under identical protocols. Moreover, the data need to not already be in the public domain; otherwise some programs will have already incorporated the values to a greater or lesser degree during training, i.e., some will have already ‘seen’ the compounds.
Independent comparative validations are technically demanding but feasible for properties that are hard enough to determine accurately that they have not been measured carefully for many existing compounds (e.g., pK a,50, 51, 52 solubility,53 and logP 54). Unfortunately, ‘naïve’ toxicological and metabolic data for mammals are much more difficult to obtain. Data obtained during pesticide development will be published in a regulatory filing if a compound is commercialized and will be kept confidential if it is not. Accessible unpublished data are virtually nonexistent as a result, which makes doing meaningful toxicity prediction comparisons extremely difficult.55
Finally, existing in silico prediction software handles mixtures as though their components do not interact, relating the molecular structure of each ingredient and its metabolites to physicochemical properties and biological activities – or lack thereof – independently. They take no account of formulation or interactions between components. The ability of safeners to protect crop plants from herbicides when they are applied together often reflects shared routes of metabolism, e.g., by formation of glutathione conjugates or metabolism by plant CYPs.27, 56 Such interactions can in many cases be simulated quite well in mammalian pharmacokinetic analyses57 and should be taken into account when possible.
7. CONCLUSION
A complete prospective accounting of likely pesticide metabolism is a complex undertaking that requires generating a wide range of predictions. Many of the QSAR models needed for making the required physicochemical and CYP metabolism predictions are now available, as are tools for weaving them together to form a reasonably complete picture of what is likely to happen in vivo. Many desirable metabolic QSAR models – i.e., for harder‐to‐characterize metabolic enzymes and for under‐represented species – are not currently available, but the infrastructure needed to construct them is in place once the requisite data have been obtained.
The results presented here illustrate some of the ways that the models already on hand can be used to anticipate mammalian metabolism and toxicity of pesticides early in agrochemical development. The focus is on herbicides, but the same tools can be applied to other kinds of pesticides, metabolites and crop residues as well. They are still a long way from being able to replace animal testing, but can help reduce it by identifying chemistry that is unlikely to survive regulatory hurdles and stopping development early. In addition, they can provide guidance on prioritizing testing once compounds have been synthesized while providing a ‘second opinion’ on in vitro test results after they have been run.
Supporting information
Table S1. Available software providing in silico models for mammalian metabolism and toxicity. Listed characteristics summarize data found on the corresponding website as of mid‐February 2018 and may change. Empty cells indicate cases where the model in question was not found or the description of the functionality provided was ambiguous; providers should be contacted for details.
Table S2. Selected physicochemical properties and toxicologial endpoints predicted for 37 commercial herbidies and three fungicides using ADMET Predictor 8.5. See https://www.simulations-plus.com/ for more detailed descriptions and related property predictions (e.g., bioconcentration and other ecotoxicity endpoints) not shown here.
Table S3. Structures (encoded as SMILES strings) with selected metabolic and pharmacokinetic properties for 37 commercial herbidies and three fungicides predicted using ADMET Predictor 8.5.
Table S4. Predictive performance of human CYP sites‐of‐metabolism models in ADMET Predictor™ 8.5.
ACKNOWLEDGEMENTS
Points made in this article have been illustrated largely with results from the ADMET Predictor program distributed by Simulations Plus, Inc. (http://www.simulations-plus.com). Many people have contributed to the science and programming behind the functionality described here, including Marvin Waldman, Jinhua Zhang, Michael S. Lawless, Robert Fraczkiewicz, David Miller, Aleksandra Mikosz, Pankaj R. Daga, Michael Bolger and Walter S. Woltosz.
REFERENCES
- 1. Alqahtani S, In silico ADME‐Tox‐modeling: progress and prospects. Expert Opin Drug Metab Tox 13:1147–1158 (2017). [DOI] [PubMed] [Google Scholar]
- 2. Ghosh J, Lawless MS, Waldman M, Gombar V and Fraczkiewicz R, Modeling ADMET, in In Silico Methods for Predicting Drug Toxicity, ed. by Benfenati E. Springer, New York, NY, pp. 63–83 (2016). [DOI] [PubMed] [Google Scholar]
- 3. Kirchmair J, Göller AH, Lang D, Kunze J, Testa B, Wilson ID et al, Predicting drug metabolism: experiment and/or computation? Nat Rev Drug Discovery 14:387 (2015). [DOI] [PubMed] [Google Scholar]
- 4. Dearden JC, Prediction of physicochemical properties, in Computational Toxicology: Methods in Molecular Biology, Vol. 929, ed. by Reisfeld B. and Mayeno AN. Springer, New York, NY, pp. 93–138 (2012). [DOI] [PubMed] [Google Scholar]
- 5. Kraehmer H, Av A, Beffa R, Dietrich H, Eckes P, Hacker E et al, Herbicides as weed control agents: state of the art: II. Recent achievements. Plant Physiol 166:1132–1148 (2014). [DOI] [PMC free article] [PubMed] [Google Scholar]
- 6. Brigo A and Muster W, Computational models to predict toxicological endpoints, in Comprehensive Medicinal Chemistry III, ed. by Rotella D. and Ward SE. Elsevier, Oxford, UK, pp. 233–258 (2017). [Google Scholar]
- 7. Cossy JR, Introduction: The importance of chirality in drugs and agrochemicals, in Comprehensive Chirality, Vol. 1, ed. by Yamamoto H. and Carreira E. Elsevier Science, London, pp. 1–7 (2012). [Google Scholar]
- 8. Leach AG, Pilling EA, Rabow AA, Tomasi S, Asaad N, Buurma NJ et al, Enantiomeric pairs reveal that key medicinal chemistry parameters vary more than simple physical property based models can explain. MedChemComm 3:528–540 (2012). [Google Scholar]
- 9. Stoll F, Göller AH and Hillisch A, Utility of protein structures in overcoming ADMET‐related issues of drug‐like compounds. Drug Discovery Today 16:530–538 (2011). [DOI] [PubMed] [Google Scholar]
- 10. Zupan J and Gasteiger J, Neural Networks in Chemistry and Drug Design. John Wiley & Sons, New York, NY: (1999). [Google Scholar]
- 11. Gold LS, Slone TH, Ames BN and Manley NB, Pesticide residues in food and cancer risk: a critical analysis, in Handbook of Pesticide Toxicology, ed. by Krieger, R. Academic Press, San Diego, CA, pp. 799–843 (2001). [Google Scholar]
- 12. McCarren P, Springer C and Whitehead L, An investigation into pharmaceutically relevant mutagenicity data and the influence on Ames predictive potential. J Cheminfo 3:51 (2011). [DOI] [PMC free article] [PubMed] [Google Scholar]
- 13. Mortelmans K and Zeiger E, The Ames Salmonella/microsome mutagenicity assay. Mutat Res 455:29–60 (2000). [DOI] [PubMed] [Google Scholar]
- 14. Clark RD, Liang W, Lee AC, Lawless MS, Fraczkiewicz R and Waldman M, Using beta binomials to estimate classification uncertainty for ensemble models. J Cheminf 6:34 (2014). [DOI] [PMC free article] [PubMed] [Google Scholar]
- 15. Clark RD, Shepphird JK and Holliday J, The effect of structural redundancy in validation sets on virtual screening performance. J Chemom 23:471–478 (2009). [Google Scholar]
- 16. Lawless MS, Waldman M, Fraczkiewicz R and Clark RD, Using cheminformatics in drug discovery, in New Approaches to Drug Discovery, ed. by Nielsch U, Fuhrmann U. and Jaroch S. Springer, Berlin, Germany, pp. 139–168 (2015). [Google Scholar]
- 17. Hansen K, Sebastian Mika S, Schroeter T, Sutter A, Ter Laak A, Steger‐Hartmann T et al, Benchmark data set for in silico prediction of Ames mutagenicity. J Chem Inf Model 49:2077–2081 (2009). [DOI] [PubMed] [Google Scholar]
- 18. Bakhtyari NG, Raitano G, Benfenati E, Martin T and Young D, Comparison of in silico models for prediction of mutagenicity. J Environ Sci Health, Part C 31:45–66 (2013). [DOI] [PubMed] [Google Scholar]
- 19. Clark RD, Dpress: localizing estimates of predictive uncertainty. J Cheminfo 1:11 (2009). [DOI] [PMC free article] [PubMed] [Google Scholar]
- 20. Norinder U, Carlsson L, Boyer S and Eklund M, Introducing conformal prediction in predictive modeling. A transparent and flexible alternative to applicability domain determination. J Chem Inf Model 54:1596–1603 (2014). [DOI] [PubMed] [Google Scholar]
- 21. Sheridan RP, Using random forest to model the domain applicability of another random forest model. J Chem Inf Model 53:2837–2850 (2013). [DOI] [PubMed] [Google Scholar]
- 22. Chalk AJ, Beck B and Clark T, A quantum mechanical/neural net model for boiling points with error estimation. J Chem Inf Comput Sci 41:457–462 (2001). [DOI] [PubMed] [Google Scholar]
- 23. Stagg NJ, LeBaron MJ, Eisenbrandt DL, Gollapudi BB and Klaunig JE, Assessment of possible carcinogenicity of oxyfluorfen to humans using mode of action analysis of rodent liver effects. Toxicol Sci 128:334–345 (2012). [DOI] [PubMed] [Google Scholar]
- 24. Shaner DL, Herbicide safety relative to common targets in plants and mammals. Pest Manage Sci 60:17–24 (2004). [DOI] [PubMed] [Google Scholar]
- 25. Menn JJ, Comparative aspects of pesticide metabolism in plants and animals. Environ Health Perspect 27:113 (1978). [DOI] [PMC free article] [PubMed] [Google Scholar]
- 26. Salgado VL and David MD, Chance and design in proinsecticide discovery. Pest Manage Sci 73:723–730 (2017). [DOI] [PubMed] [Google Scholar]
- 27. Jeschke P, Propesticides and their use as agrochemicals. Pest Manage Sci 72:210–225 (2016). [DOI] [PubMed] [Google Scholar]
- 28. Argikar UA, Potter PM, Hutzler JM and Marathe PH, Challenges and opportunities with non‐CYP enzymes aldehyde oxidase, carboxylesterase, and UDP‐glucuronosyltransferase: Focus on reaction phenotyping and prediction of human clearance. AAPS J 18:1391–1405 (2016). [DOI] [PMC free article] [PubMed] [Google Scholar]
- 29. Oda S, Fukami T, Yokoi] T and Nakajima M, A comprehensive review of UDP‐glucuronosyltransferase and esterases for drug development. Drug Metab Pharmacokinet 30:30–51 (2015). [DOI] [PubMed] [Google Scholar]
- 30. Clarke ED, Greenhow DT and Adams D, Metabolism‐related assays and their application to agrochemical research: reactivity of pesticides with glutathione and glutathione transferases. Pest Manage Sci 54:385–393 (1998). [Google Scholar]
- 31. Coleman S, Liu S, Linderman R, Hodgson E and Rose RL, In vitro metabolism of alachlor by human liver microsomes and human cytochrome P450 isoforms. Chem Biol Interact 122:27–39 (1999). [DOI] [PubMed] [Google Scholar]
- 32. Ohkawa H and Inui H, Metabolism of agrochemicals and related environmental chemicals based on cytochrome P450s in mammals and plants. Pest Manage Sci 71:824–828 (2015). [DOI] [PubMed] [Google Scholar]
- 33. Abass K, Turpeinen M, Rautio A, Hakkola J and Pelkonen O, Metabolism of pesticides by human cytochrome P450 enzymes in vitro – a survey, in Insecticides – Advances in Integrated Pest Management, ed. by Perveen F. InTech, Rijeka, Croatia: (2012). [Google Scholar]
- 34. Waldman M, Fraczkiewicz R and Clark RD, Tales from the war on error: the art and science of curating qsar data. J Comput Aided Mol Des 29:897 (2015). [DOI] [PubMed] [Google Scholar]
- 35. Lee CA, Kadwell SH, Kost TA and Serabjitsingh CJ, CYP3A4 expressed by insect cells infected with a recombinant baculovirus containing both CYP3A4 and human NADPH‐cytochrome P450 reductase is catalytically similar to human liver microsomal CYP3A4. Arch Biochem Biophys 319:157–167 (1995). [DOI] [PubMed] [Google Scholar]
- 36. Zhang T, Dai H, Liu LA, Lewis DF and Wei D, Classification models for predicting cytochrome P450 enzyme‐substrate selectivity. Mol Inform 31:53–62 (2012). [DOI] [PubMed] [Google Scholar]
- 37. Leavens TL, Tell LA, Kissell LW, Smith GW, Smith DJ, Wagner SA et al, Development of a physiologically based pharmacokinetic model for flunixin in cattle (Bos taurus). Food Addit Contam Part A 31:1506–1521 (2014). [DOI] [PubMed] [Google Scholar]
- 38. Brändén G, Sjögren T, Schnecke V and Xue Y, Structure‐based ligand design to overcome CYP inhibition in drug discovery projects. Drug Discovery Today 19:905–911 (2014). [DOI] [PubMed] [Google Scholar]
- 39. Tyzack JD, Hunt PA and Segall MD, Predicting regioselectivity and lability of cytochrome P450 metabolism using quantum mechanical simulations. J Chem Inf Model 56:2180–2193 (2016). [DOI] [PubMed] [Google Scholar]
- 40. Singh SB, Shen LQ, Walker MJ and Sheridan RP, A model for predicting likely sites of CYP3A4‐mediated metabolism on drug‐like molecules. J Med Chem 46:1330–1336 (2003). [DOI] [PubMed] [Google Scholar]
- 41. Zaretzki J, Bergeron C, Rydberg P, Huang T‐W, Bennett KP and Breneman CM, Rs‐predictor: a new tool for predicting sites of cytochrome pP450‐mediated metabolism applied to CYP3A4. J Chem Inf Model 51:1667–1689 (2011). [DOI] [PMC free article] [PubMed] [Google Scholar]
- 42. Gressel J, Microbiome facilitated pest resistance–potential problems and uses. Pest Manage Sci 74:511–515 (2018). [DOI] [PubMed] [Google Scholar]
- 43. Koppel N, Rekdal VM and Balskus EP, Chemical transformation of xenobiotics by the human gut microbiota. Science 356:eaag2770 (2017). [DOI] [PMC free article] [PubMed] [Google Scholar]
- 44. Lipscomb JC, Haddad S, Poet T and Krishnan K, Physiologically‐based pharmacokinetic (PBPK) models in toxicity testing and risk assessment, in New Technologies for Toxicity Testing. Advances in Experimental Medicine and Biology, ed. by Balls M, Combes RD. and Bhogal N. Springer, New York, NY, pp. 76–95 (2012). [DOI] [PubMed] [Google Scholar]
- 45. Parrott N and Lave T, Applications of physiologically based absorption models in drug discovery and development. Mol Pharm 5:760–775 (2008). [DOI] [PubMed] [Google Scholar]
- 46. Hosea NA and Jones HM, Predicting pharmacokinetic profiles using in silico derived parameters. Mol Pharm 10:1207–1215 (2013). [DOI] [PubMed] [Google Scholar]
- 47. Benito JVS, Paini A, Richarz A‐N, Meinl T, Berthold MR, Cronin MT et al, Automated workflows for modelling chemical fate, kinetics and toxicity. Tox In Vitro 45:249–257 (2017). [DOI] [PMC free article] [PubMed] [Google Scholar]
- 48. Horvath D, Quantitative structure–activity relantionships: In silico chemistry or high tech alchemy. Rev Roum Chim 55:783–801 (2010). [Google Scholar]
- 49. Zang Q, Mansouri K, Williams AJ, Judson RS, Allen DG, Casey WM et al, In silico prediction of physicochemical properties of environmental chemicals using molecular fingerprints and machine learning. J Chem Inf Model 57:36–49 (2017). [DOI] [PMC free article] [PubMed] [Google Scholar]
- 50. Manchester J, Walkup G, Rivin O and You Z, Evaluation of pKa estimation methods on 211 druglike compounds. J Chem Inf Model 50:565 (2010). [DOI] [PubMed] [Google Scholar]
- 51. Fraczkiewicz R, Lobell M, Göller AH, Krenz U, Schoenneis R, Clark RD et al, Best of both worlds: combining pharma data and state of the art modeling technology to improve in silico pKa prediction. J Chem Inf Model 55:389–397 (2015). [DOI] [PubMed] [Google Scholar]
- 52. Balogh GT, Tarcsay Á and Keserü GM, Comparative evaluation of pKa prediction tools on a drug discovery dataset. J Pharm Biomed Anal 67:63–70 (2012). [DOI] [PubMed] [Google Scholar]
- 53. Dearden JC, In silico prediction of aqueous solubility. Expert Opin Drug Discov 1:31–52 (2006). [DOI] [PubMed] [Google Scholar]
- 54. Mannhold R, Poda GI, Ostermann C and Tetko IV, Calculation of molecular lipophilicity: state‐of‐the‐art and comparison of log P methods on more than 96,000 compounds. J Pharm Sci 98:861–893 (2009). [DOI] [PubMed] [Google Scholar]
- 55. Dearden JC, In silico prediction of drug toxicity. J Comput Aided Mol Des 17:119–127 (2003). [DOI] [PubMed] [Google Scholar]
- 56. Davies J and Caseley JC, Herbicide safeners: a review. Pestic Sci 55:1043–1058 (1999). [Google Scholar]
- 57. Jones H and Rowland‐Yeo K, Basic concepts in physiologically based pharmacokinetic modeling in drug discovery and development. Pharmacometrics Syst Pharmacol 2:1–12 (2013). [DOI] [PMC free article] [PubMed] [Google Scholar]
Associated Data
This section collects any data citations, data availability statements, or supplementary materials included in this article.
Supplementary Materials
Table S1. Available software providing in silico models for mammalian metabolism and toxicity. Listed characteristics summarize data found on the corresponding website as of mid‐February 2018 and may change. Empty cells indicate cases where the model in question was not found or the description of the functionality provided was ambiguous; providers should be contacted for details.
Table S2. Selected physicochemical properties and toxicologial endpoints predicted for 37 commercial herbidies and three fungicides using ADMET Predictor 8.5. See https://www.simulations-plus.com/ for more detailed descriptions and related property predictions (e.g., bioconcentration and other ecotoxicity endpoints) not shown here.
Table S3. Structures (encoded as SMILES strings) with selected metabolic and pharmacokinetic properties for 37 commercial herbidies and three fungicides predicted using ADMET Predictor 8.5.
Table S4. Predictive performance of human CYP sites‐of‐metabolism models in ADMET Predictor™ 8.5.