Somatic stem cells constantly adjust their self-renewal and lineage commitment by integrating various environmental cues to maintain tissue homeostasis. While numerous chemical and biological signals have been identified to regulate stem cell behaviors, whether stem cells can directly sense mechanical signals in vivo remains unclear1. Here, we show that mechanical stress regulates stem cell differentiation in the adult Drosophila midgut through the stretch-activated ion channel Piezo. We find that Piezo is specifically expressed in previously unidentified enteroendocrine precursor (EP) cells which have reduced proliferation ability and are destined to become enteroendocrine cells (EEs). Loss of Piezo activity reduces EE generation in the adult midgut. Meanwhile, ectopic expression of Piezo in all stem cells triggers both cell proliferation and EE differentiation. Both Piezo mutant and overexpression phenotypes can be rescued by manipulation of cytosolic Ca2+ levels, and increase of cytosolic Ca2+ resembles the Piezo over-expression phenotype, suggesting that Piezo functions through Ca2+ signaling. Further studies suggest that Ca2+ signaling promotes stem cell proliferation and differentiation through separate pathways. Finally, Piezo is required for both mechanical activation of stem cells in a gut expansion assay and the increase of cytosolic Ca2+ in response to direct mechanical stimulus in a gut compression assay. Altogether, our study demonstrates the existence of a special group of stem cells in the fly midgut that can directly sense mechanical signals through Piezo.
Drosophila midgut stem cells have emerged as an attractive in vivo model for understanding adult stem cell behaviors2–4. Like their mammalian counterparts, fly intestinal stem cells (ISCs) produce two major classes of cells that compose the adult intestinal epithelium: absorptive enterocytes (ECs) and secretory enteroendocrine cells (EEs)4. Many extrinsic signals, including chemicals, nutrition, pathogens, and cytokines, have been shown to regulate ISCs proliferation and differentiation4,5. However, whether midgut stem cells can sense biomechanical signal remains unknown.
From a screen for Gal4 lines with midgut expression, we identified Piezo-Ga4 (BL59266)6, a Gal4 under control of a cloned enhancer of Piezo, that was expressed in a subpopulation of escargot (esg) positive stem cells in the adult fly midgut (Extended Data Fig. 1a). Piezo is a cation ion channel that directly senses mechanical tension in lipid bilayers7. It was initially identified in mammalian cells as a touching sensor8, and further found responsible for mechanoreception in different kind of cell types9. The Drosophila genome encodes a single Piezo homolog, which has been characterized previously as a receptor for mechanotransduction in sensory neurons6,10.
To faithfully represents the expression pattern of Piezo, we knocked-in a Gal4, Piezo-Gal4[KI] (we use Piezo-Gal4[KI] as Piezo-Gal4 thereafter), after the first start codon of Piezo through homologous recombination (Extended Data Fig. 1b). UAS-RFP driven by Piezo-Gal4[KI] showed a pattern similar to BL59266 in esg+ cells, but was also detected in some ECs located in the cardia and copper and iron regions (Fig. 1a, Extended Data Fig. 1c-f, h), which is consistent with published Piezo mRNA profiles along the midgut (Extended Data Fig. 1g)11. Because esg is expressed in both ISCs and enteroblast cells (EBs, a progeny of ISCs that is destined to ECs), we used the ISC specific marker Delta-lacZ and the EB marker Su(H)Gbe-lacZ to precisely identify Piezo+ cells. Strikingly, Piezo is expressed in a subpopulation (~40%) of Dl+ cells, and is absent from EBs (Fig. 1a, Extended Data Fig. 1i). We also noticed that all “newborn” EEs - esg and Prospero (Pros, the EE specific marker) double positive cells - are also Piezo+, suggesting that Piezo+ cells may represent EE cell precursors (Fig. 1c, Extended Data Fig. 1k,l). Indeed, G-TRACE12 labeled progenies of Piezo+ cells are primarily EEs (~90%), compared with ISCs (Dl+) and EBs (Su(H)Gbe+) (Fig 1d,e, Extended Data Fig. 1m-o). Additionally, Bleomycin damage13 or inhibition of Notch by the γ-secretase inhibitor DAPT14 promotes both EE and Piezo+ cell generation (Fig. 1f, Extended Data Fig. 2a). Finally, ablation of Piezo+ cells using the pro-apoptotic protein Reaper (Rpr) significantly reduced not only Piezo+ cells but also EE cells number after 4 weeks (Fig. 1g,h), and both cell types are recovered after one-week of suppression of Rpr expression (Fig. 1g,h), suggesting that Piezo+ cells are an important source for EE generation. We further investigated whether Piezo+ cells are self-regenerative or primarily derived from ISCs. First, mitotic Piezo+ cells (marked by anti-phospho-Histone3 staining) only represent a small portion (~10%) of the total mitotic cells (Fig. 1i, Extended Data Fig. 2c-f), suggesting that Piezo+ cells have reduced proliferation abilities compared to Piezo− stem cells. Bleomycin damage promotes the mitosis of both Piezo+ and Piezo− cells without increasing the percentage of Piezo+ mitotic cells, suggesting that an intrinsic mechanism limits the proliferation ability of Piezo+ cells (Extended Data Fig. 2d,e). Finally, random GFP-marked clone generated from ISCs contains Piezo+ cells, supporting that Piezo+ cells are generated from ISCs (Extended Data Fig. 2g).
Figure 1. Piezo+ cells are EE precursors in the fly midgut.
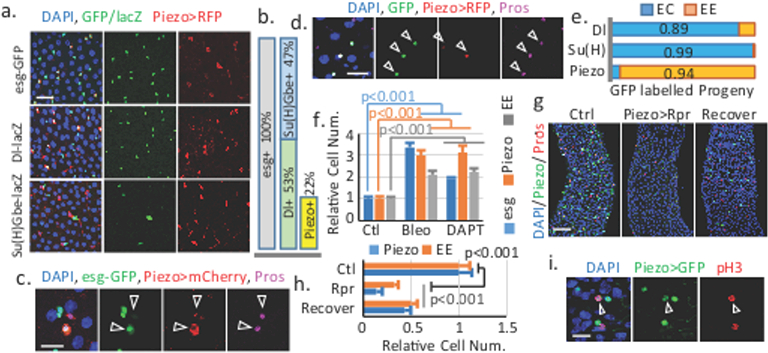
a. Piezo+ cells are esg-GFP and Dl-lacZ positive, but Su(H)Gbe-lacZ negative. b. Percentage of Piezo+ cells in esg+ cells. For Dl+: n=238 (Dl+), n=457 (esg+). For Piezo+: n=151 (Piezo+), n=682 (esg+). c. “newborn” EEs (arrowheads) are Piezo+. d. Piezo+ cells (RFP+) generate GFP+ EEs (arrowhead). e. Statistics of GFP+ ECs and EEs using Piezo-Gal4, Su(H)Gbe-Gal4, and Dl-Gal4. Number of cells analyzed: n=561 (Dl), n=432 (Su(H)), n=90 (Piezo). f. Bleomycin and DAPT treatment increase esg+, EP and EE cell numbers. Areas quantified: n=23 (Ctl), n=21 (Bleo), n=32 (DAPT). g,h. Elimination of Piezo+ cells by conditional expression of Rpr. Areas quantified: n=27 (Ctl), n=29 (Rpr), n=27 (Recover). i. pH3 staining of mitotic EPs (arrowhead). Data are expressed as mean + s.e.m. P-values are from two-tailed t-test. Scale bar: a, 20 μm; c,d,i, 10 μm; g, 50 μm.
Altogether, our data suggest that previously considered Dl+ ISCs are heterogeneous and composed of ~60% mitotic active multipotent ISCs (Piezo−) and ~40% less mitotic unipotent Piezo+ cells that mainly generate EEs. To avoid confusion with true ISCs (mitotic active and multipotent) and EBs (occasionally referred as Notch active EC progenitors), we refer to these Piezo+ population as “enteroendocrine precursors” (EPs).
To investigate the function of Piezo, we analyzed the phenotype of PiezoKO, a null allele with a complete deletion of the Piezo coding sequence6. Midguts from PiezoKO homozygous flies showed no obvious phenotypes as compared to control flies during the early developmental and young adult stages, albeit Piezo is expressed in some stem cells during the larval and pupal stages (Extended Data Fig. 3). In wildtype (WT) flies, the number of esg+ and EE cells increases as flies age15. However, in PiezoKO mutants, the number of EEs, but not esg+ cells, fails to increase (Fig. 2a,b), suggesting that the generation of EEs after adulthood is affected. Additionally, Piezo mutant clones generate 80% fewer EEs than controls, which can be rescued by expressing GFP-tagged full-length Piezo (Fig. 2c,d). These data suggest that the reduced EE generation is an autonomous defect.
Figure 2. Piezo regulates EE differentiation through cytosolic Ca2+.
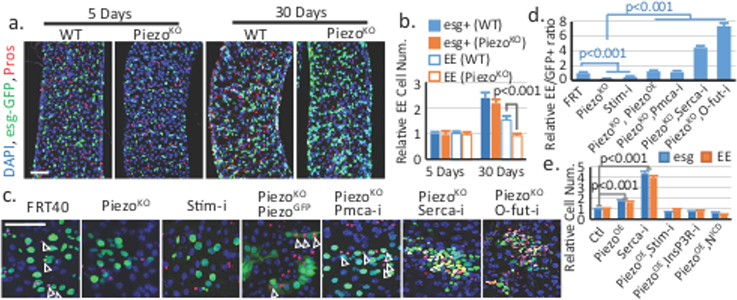
a,b. Midgut of flies homozygous for PiezoKO shows reduced EE generation after 30 days after eclosion. Areas quantified: n=32 (WT 5 days), n=32 (WT 30 days), n=35 (PiezoKO 5 days), n=32 (PiezoKO 30 days). c,d. MARCM clones of cells with indicated genotypes (arrowheads indicate the GFP+ EEs). Ratio of EEs in the clone (normalized to control) is quantified. Number of clones quantified: n=32 (FRT), n=35 (PiezoKO), n=26 (Stim-i), n=28 (PiezoKO, PiezoOE), n=31 (PiezoKO, Pmca-i), n=35 (PiezoKO, Serca-i), n=28 (PiezoKO, O-fut-i). e. esg+ and EE cell numbers were quantified in midgut expressing indicated genes using esg-Gal4. Number of areas quantified: n=22 (Ctl), n=28 (PiezoOE), n=23 (Serca-i), n=21 (PiezoOE, Stim-i), n=24 (PiezoOE, InsP3R-i), n=26 (PiezoOE, N-ICD). Data are expressed as mean + s.e.m. P-values are from two-tailed t-test. Scale bar: a, 50 μm; c, 25 μm.
Previous studies have shown that Piezo functions through increase of cytosolic Ca2+16–19. Consistently, knocking down Stromal interaction molecule (Stim), previously used as an effective target to decrease cytosolic Ca2+ 20, also led to the production of fewer EEs (Fig 2c,d). Further, elevating cytosolic Ca2+ by knocking down Plasma membrane calcium ATPase (PMCA) or Sarco-endoplasmic reticulum calcium ATPase (SERCA) rescued and even reversed the reduction of EEs in the Piezo mutant (Fig 2c,d). Meanwhile, over-expressing Piezo in esg+ cells caused an increase of both esg+ cells and EEs, which phenocopied the increase of Ca2+ through SERCA reduction, inositol-1,4,5-trisphosphate receptors (IP3R), Stim, and Orai over-expression, as well as PMCA knockdown (Fig 2e, Extended Data Fig. 4a-c, 5). Calcium imaging shows that cytosolic Ca2+ is significantly increased by Piezo over-expression in the stem cells (Extended Data Fig. 6a-d, Extended Data Video 1,2). Meanwhile, the Piezo over-expression phenotype is suppressed by reducing cytosolic Ca2+ using either Stim-RNAi or InsP3R-RNAi (Fig 2e, Extended Data Fig. 4a-c). Finally, Bleomycin damage triggers an up-regulation of Ca2+ and cell number increase of esg+ and EE cells in both WT and PiezoKO midguts, supporting that Ca2+ is the downstream effector of Piezo (Extended Data Fig. 5d-e, 6e-h).
Inhibition of Notch signaling has been shown to promote both ISCs renewal and EEs differentiation14,21, even in EE progenitors that already have low Notch activity22. Meanwhile, increase of cytosolic Ca2+ has been found to inhibit Notch activity in both cultured mammalian cells and flies23,24. Therefore, we tested whether Piezo functions through Notch inhibition by increasing cytosolic Ca2+. Indeed, blocking Notch activation by knocking-down a fucosyltransferase (O-fut) essential for Notch processing reverses the PiezoKO phenotype (Fig. 2c,d, Extended Data Fig. 4h), and increasing Notch activity by expression of the Notch intracellular domain (NICD) blocks the phenotype of both Piezo over-expression and SERCA knockdown (Fig. 2e, Extended Data Fig. 4a-g). Further, over-expressing Piezo in esg+ cells produced more Dl+ stem cells, consistent with a reduction in Notch activity (Extended Data Fig. 6i,j). Finally, neither Piezo overexpression nor SERCA knockdown had any effects in EB cells (in which Notch has already been activated), supporting that Notch signaling is the primary target (Extended Data Fig. 6k,l). Altogether, our data suggest that Piezo promotes EE differentiation by elevating cytosolic Ca2+ and inhibition of Notch.
To further dissect the function of Ca2+, we used channelrhodopsin (ChR) to optogenetically increase cytosolic Ca2+ levels. Activation of ChR in Dl+ cells promotes both ISCs proliferation and EEs production, resembling the Piezo over-expression phenotype (Fig. 3a,b; Extended Data Fig. 7a-d). This ChR-induced phenotype is blocked by knockdown of both Stim and InsP3R, suggesting that this effect is Ca2+ dependent (Extended Data Fig. 7e,f). In addition, activation of ChR in Piezo+ EP cells significantly increased EE cells at the expense of EP cells, suggesting an increase of differentiation from EPs to EEs (Fig. 3a,b). A recent study showed that Piezo activation promotes cell proliferation through Ca2+ induced ERK (extracellular signal-regulated kinase) phosphorylation19. Consistently, over-expression of Piezo in esg+ cells increases phospho-ERK staining (Extended Fig. 7g). However, reducing ERK signaling through Ras knockdown, or blocking cell proliferation by Yorkie-RNAi only affect cell proliferation but not EE differentiation in Piezo over-expressing cells (Extended Fig. 7h-k), supporting that Piezo promotes EE differentiation independently of proliferation. Consistently, increasing cytosolic Ca2+ by Thapsigargin (Thap), a SERCA inhibitor, significantly increased stem cell proliferation and EEs generation (Fig. 3c,d). Further blocking mitosis using the MEK (mitogen-activated protein kinase kinase) inhibitor Trametinib (Tram), only reduced Thap-trigged proliferation, but not the increase in EEs differentiation (Fig. 3c,d, Extended Data Fig. 7l-n). Ca2+ imaging showed that Ca2+ is increased in stem cells treated by Thap, which is not blocked by Tram (Extended Data Fig. 7o-q, Extended Data Video 3). All together, these data suggest that cytosolic Ca2+ increase promote cell proliferation (through ERK phosphorylation) and cell differentiation (though Notch inhibition) in a cell context dependent manner.
Figure 3. Cytosolic Ca2+ triggers cell proliferation and EE differentiation through different mechanisms.
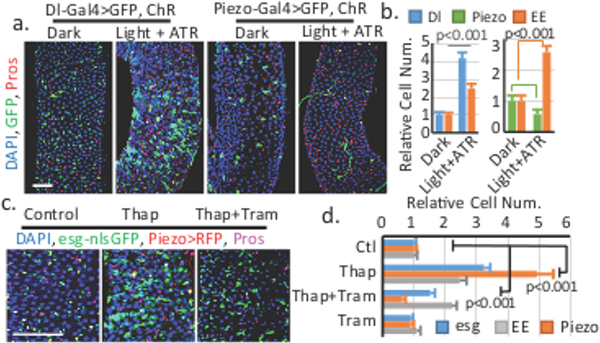
a,b. Increase of cytosolic Ca2+ by channelrhodopsin (ChR) in Dl+ and Piezo+ EP cells. Dl+, Piezo+, and EE cell numbers are quantified. Number of areas quantified: n=28 (Dark, Dl-Gal4), n=30 (Light+ATR, Dl-Gal4), n=30 (Dark, Piezo-Gal4), n=31 (Light+ATR, Piezo-Gal4). c,d. Midguts of Thapsigargin (Thap) and Trametinib (Tram) treated flies. Number of areas quantified: n=29 (Ctl), n=31 (Thap), n=32 (Thap+Tram), n=29 (Tram). Data are expressed as mean + s.e.m. P-values are from two-tailed t-test. Scale bar, 50 μm.
To test if mechanical challenges from food digestion can activate Piezo, we increased the mechanical load in the GI track by feeding flies with food containing indigestible fiber, methylcellulose (MC), a widely used food thickener and ingredient for cell culture. This MC food induce an “over-full” phenotype, as fly midguts, from~10–15% flies after 4–5 days of MC feeding, showed a significant increase in diameter (Fig 4a, Extended Data Fig. 8). Interestingly, midguts with increased diameter showed a significant increase in the number of esg+ cells and EEs (Fig 4b,c), as well as Piezo+ EP cells (Extended Data Fig. 8g-j). This effect is blocked by either Piezo knock-down or null mutant (Fig 3b,c, Extended Data Fig. 8k,l). Live-cell imaging of Ca2+ activities shows an increase of average Ca2+ level in MC fed flies, suggesting that the phenotype is related to increased Ca2+ level (Extended Data Fig. 8n-q, Extended Data Video 4). Indeed, this over-full phenotype is blocked by reducing cytosolic Ca2+ (Fig. 4b,c, Extended Data Fig. 8n-q, Extended Data Video 4), suggesting that the mechanical stress generated by the indigestible food promotes EEs generation through Piezo activation and subsequent increase in cytosolic Ca2+. As Piezo is mainly enriched in EP cells, the increase of stem proliferation may be caused by either a feedback signal from the increased EE generation25 or by low level of Piezo present in the ISCs.
Figure 4. Mechanical stress increases cytosolic Ca2+ through Piezo.
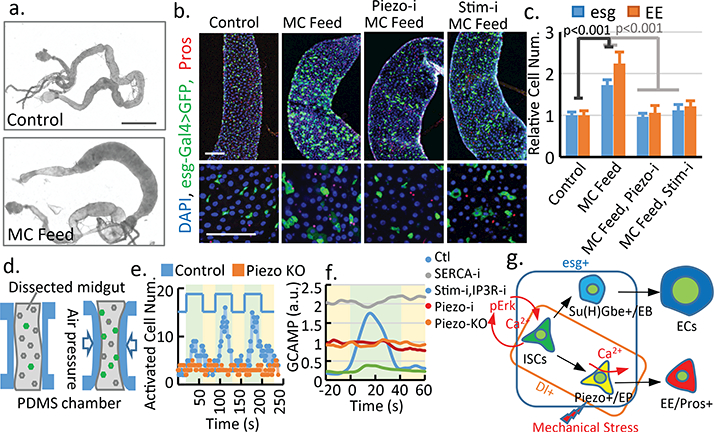
a. Flies fed on methylcellulose (MC) containing food. b,c. MC feeding increases esg+ and EE cell numbers in the midguts, which is blocked by PiezoRNAi and StimRNAi. Number of areas quantified: n=25 (Ctl), n=23 (MC), n=20 (MC+Piezo-i), n=25 (MC+Stim-i). d. An illustrated microfluidic channel that holds and compresses the midgut for ex vivo mechanical trigger experiment. e. Representative example of 3 cycles of consecutive mechanical activation. Number of calcium+ cells is plotted over time. Green: compression period. Yellow: relaxation period. f. Average GCaMP activity during compression from control, PiezoKO, PiezoRNAi, SercaRNAi, and StimRNAi + InsP3RRNAi flies. g. Model for mechanical regulation of EP differentiation in the fly midgut. Ca2+ plays different roles in ISCs (proliferation) and EPs (differentiation). Data are expressed as mean + s.e.m. P-values are from two-tailed t-test. Scale bar: a. 10 mm, b. 50 μm.
To test directly whether mechanical forces can activate EP cells, we engineered a microfluidic chip that can hold a dissected fly midgut and generate a mechanical compression through controlled air pressure (Fig. 4d, Extended Data Fig. 9a-d). Using this device, we recorded the calcium signal in Dl+ stem cells of the fly midguts (Piezo-Gal4 was tested initially but was not used due to the low GCAMP6s expression.) Interestingly, significantly more stem cells showed high cytosolic Ca2+ upon mechanical compression, and this activation was only triggered transiently by the change in tissue shape, as Ca2+ activity returned to normal within ~20 s even in the presence of constant compression (Fig 4e; Extended Data Video 6). Importantly, this mechanically triggered Ca2+ activity is significantly reduced in either PiezoKO or PiezoRNAi midguts (Fig 4e, Extended Data Fig. 9e-g; Extended Data Video 7, 8). Finally, either increase of cytosolic Ca2+ through SERCA knockdown or decrease of cytosolic Ca2+ through Stim and IP3R knockdown render the cells irresponsive to the mechanical stimulus (Fig. 4f, Extended Data Fig. 9h-l, Extended Data Video 9,10). These data suggest that Ca2+ levels in Piezo+ cells can be regulated by a transient mechanical stimulus, which may be generated by repeated vascular muscle contractions during digestion.
In conclusion, we have demonstrated that a new population of unipotent stem cells (EPs) can directly sense mechanical signals in vivo to adjust their differentiation accordingly, and that this mechanosensing is mediated through Piezo activation and cytosolic Ca2+ increase. Our findings suggest a potential direct linkage between food digestion with generation of EEs, which regulate various physiological functions, including stem cell proliferation, intestinal motility, digestion, and appetite25,26. Such mechanism may provide the midgut ability to response to particular mechanical challenges to maintain tissue homeostasis.
METHODS
Drosophila stocks and culture
The following strains were obtained from the Bloomington Drosophila Stock Center: UAS-mtdTomato3XHA (BL30124), UAS-tdTomato (BL3321, BL3322), UAS-IVS-NES-jRGECO (BL63795), UAS-IVS-GCaMP6s (BL42746), UAS-mCherry.CAAX (BL59021), UAS-mCherry.nls (BL 38424), UAS-CsChrimson (BL55134), UASp-Act5C-mRFP ((BL24778); UAS-mCD8-GFP (BL32185), G-Trace fly: UAS-RedStinger, UAS-Flp1.D, Ubi-(FRT.Stop)Stinger/CyO (BL28280); Act-(FRT.Stop)lacZ, Ubi-(FRT.Stop)Stinger/CyO (isolated from BL51308); hsFLP; Sco/CyO (BL1929); Piezo-Gal4 (with cloned promoter, BL59266); RNAi lines as previously reported20: UAS-SercaRNAi (BL25928), UAS-StimRNAi (BL27263, BL52911), UAS-Stim (BL41757), tub-Gal80ts (BL7016), UAS-O-fut1RNAi (BL9377), UAS-InsP3RRNAi (BL25937, BL51686), UAS-NotchICD (BL52008), UAS-ttk69RNAi (BL26315, BL36748), UAS-InsP3R (BL30742) and UAS-PmcaRNAi (BL31572); UAS-Rpr (BL5823), PiezoKO (BL58770), UAS-GFP-Piezo/CyO (BL58772), UAS-GFP-Piezo/TM6B (BL58773)6. UAS-Ras1RNAi (106642), UAS-YkiRNAi (104523), UAS-PiezoRNAi (2796), UAS-aseRNAi (108511), UAS-ttk69RNAi (101980) as previously reported10,29, was from the Vienna Drosophila RNAi Center. esg-GFP was from David Doupe. Su(H)-lacZ was from Pedro Saavedra; hsFlp, tub-Gal4, UAS-nlsGFP; FRT40, tub-Gal80 was from Kevin Kim; Su(H)-Gal4 and Dl-Gal4 was from Steven X. Hou30, UAS-Orai was from Gaiti Hasan, esg-Gal4, UAS-nlsGFP, and Dl-lacZ were from lab stocks. Flies were reared on standard cornmeal/agar medium supplemented with yeast. Adult flies were entrained in 12:12 light-dark cycles at 25 °C unless specifically stated otherwise.
To prepare Methylcellulose (MC) food, 10% w/w MC (sigma, 274429) was added to 5% sucrose solution and stirred until fully dissolved. Adult flies 5–7 days after hatching were water-starved (soaked filter paper) for one day at 29 °C, and transferred to vials with MC food or control food (5% sucrose soaked filter paper). Food was changed every other day. Fly midguts with a significantly enlarged diameter (>50% increase compared with the normal section of the same midgut) were counted as enlarged MC feed gut (~10–15% of total dissected midguts).
4μM DAPT (Sigma, D5942), 10μg/ml Bleomycin (Calbiochem #203408), 0.5μM Thapsigargin (Tocris, 1138), and 10μM Trametinib (Selleckchem, S2673) were used for chemical treatment. All feeding experiments were done using 5% sucrose saturated filter paper unless specifically stated otherwise.
For the lineage tracing experiments12, 4–5-day-old flies were incubated at 32 °C for one day to activate Gal4 and then maintained at 25°C for 7 days. For Piezo-Gal4, flies were incubated at 32 °C for 4 days and then maintained at 25°C for 3 days because of its low activity. Lineage tracing of MC feed fly was done by induction of flies for 4–5 days under 32 °C and when feeding the fly on 5% sucrose + 10% MC food for 4 days at 25 °C. To visualize the Gal4 expressing cells, flies were shifted to 32 °C overnight before analysis. To create random clones using hsFLp, Ubi-(FRT.Stop)Stinger, we heat shocked the 3–4 days old adult flies at 37°C for 30 min and then kept them at 25 °C for 2 weeks.
For the MARCM experiments31, 4–5-day-old flies were heat-shocked three times at 37 °C for 1 hour within one day. Then flies were maintained at 25°C, except for the flies containing RNAi which were maintained at 32 °C to increase the expression of the dsRNAs. Temperature has no significant effect on the ratio of EEs in the progenies (data not shown). Midguts from female flies were analyzed after 14 days. (GFP positive clones were induced by transient incubation at 32°C, then flies were kept at 25°C for 10 days and 32°C overnight before analysis)
Immunofluorescence imaging
Immunostainings of Drosophila midguts were performed as previously described32. The following primary antibodies were used: mouse anti-Prospero (1:50, Developmental Studies Hybridoma Bank, MR1A), rabbit anti-phospho-Histone H3 (Millipore #06–570; 1:1000); mouse anti-HA (Abcam, ab18181), rabbit anti-dpErk1/2 (Cell Signaling #4370; 1:500), mouse anti-Delta (1:50, Developmental Studies Hybridoma Bank, C594.9B), mouse anti-β-galactosidase (1/400, Promega, Z3781), rabbit anti-Tachykinin (1/5000, Veenstra et al.33). Secondary antibodies were goat anti-rabbit and anti-mouse IgGs conjugated to Alexa 555 and Alexa 647 (used at 1:500, Thermofisher, A-21428, A-21244, A-21235, A-21422). Fly guts were mounted in Vectashield with DAPI (Vector Laboratories). In all micrographs, blue staining shows the nuclear marker DAPI. Fluorescence micrographs were acquired with a Zeiss LSM 780 confocal microscope. All images were adjusted and assembled in NIH ImageJ.
CRISPR/Cas9 genome editing
Guide RNAs (gRNAs) targeting the start codon of Piezo were designed using the “Find CRISPRs” online tool (http://www.flyrnai.org/crispr2/)34,35. The genome editing efficiency of different candidate gRNAs was tested in tissue culture using T7 endonuclease assay36, and the following sequence with highest cutting efficiency was used: CTGGAGGAGAACGGCGCCGG.
~1kb genomic fragments from the upstream and downstream of the start codon were amplified from fly genome using following primers:
Up F: CTTCGGTACCGGATCACTGTGCATGTGAGGCATTA
Up R: GCTTCATTTTGGATCACTCAGACTCCGACTCCAAC
Dn F: CGGCGGCCGCTCTAGTCAGCTATGCGTGCATGGT
Dn R: AAGCTGGGTGTCTAGGGGAATGTGGTAGGCAAACTA
Genomic fragments were cloned into the up- and down-stream of Gal4-SV40 in pENTR vector by In-fusion (Clontech) to make the donor construct.
For CRISPR/Cas9-mediated homologous recombination, gRNA in pCFD3 (0.2ug/ul) and donor DNA (0.5ug/ul), were co-injected into the embryos of nos-Cas9/attP2 flies37. Knock-in flies were selected by genomic PCR using following primers from insertion and Piezo gene:
Upstream:
F. CCCACAATTTCGCACTCTTT
R. GTCTTCACGGGGAAAAATGA
Downstream:
F. GTGGTTTGTCCAAACTCATCAATG
R. CGGACAGCAGGAAAATGAGA
Piezo-Gal4 knock in homozygous flies are viable and fertile. qPCR of whole adult flies showed that Piezo mRNA from homozygous Piezo-Gal4 knock-in flies was reduced by ~50% compared to Piezo-Gal4/CyO. (The mRNA of Piezo from Piezo-Gal4/CyO was not significantly different from WT flies.) Also, qPCR of PiezoKO (BL58770) is consistent with this allele being a complete null6 as it showed a >95% reduction of Piezo mRNA.
Optogenetic activation of CsChrimson in fly midgut
Red-shifted channelrhodopsin CsChrimson38 was used to increase cytosolic Ca2+ in stem cells by light. UAS-CsChrimson was expressed using either Dl-Gal4 or Piezo-Gal4. All crosses and the early development of flies were under dark conditions at 18 °C. Experiment was done at 25°C. Adult flies were kept either on 2% Agarose food containing 5% sucrose+1% yeast extract under dark or on 2% Agarose food containing 5% sucrose + 1% yeast extract + 50mM all-trans-retinal (ATR) in presence of orange-red light from LED. 2X1 meter SMD5050 RGB LED strip (total power ~2 X 4 Watt, eTopxizu) was attached to the inner wall of a cylinder chamber (~10 cm in diameter and 15 cm in height) covered by aluminum foil to enhance the light intensity Extended Data Fig. 7a. The RGB LED strip was set at constant maximal brightness with green (500~560 nm) and red (600~650 nm) LED units on (estimated light intensity ~ 2.5 mW/cm2). The power of the LED is controlled manually to maintain 12/12 on/off circadian rhythm. Flies were kept under indicated condition for 2 weeks before analysis.
Calcium imaging
Cytosolic Ca2+ was monitored in ISCs using the red fluorescent indicator RGECO39. GFP was used as an internal control and an indicator of stem cells and EBs. Young adult flies (4–5 days after eclosion) were first incubated at 32 °C for 5–7 days before the experiment. For live-cell imaging experiment, dissected intact midgut was cultured in adult-hemolymph-like (AHL) media plus 2% fetal bovine serum (FBS). Addition of FBS into the AHL moderately increases the average cytosolic Ca2+ level and reduced the oscillation frequency, but allow a longer maintenance of dissected midgut under normal condition up to 5–6hr. Air-permeable lummox dish (SARSTEDT, 94.6077.331) was used as the imaging device as previously described40. Images of anterior midgut area were captured on Zeiss LSM 780 confocal microscope equipped with definite focus using Plan-Neofluar 25x/oil N.A. 0.8 lens. A z-stack of dual-color image (488 nm excitation/500–550nm detection for GFP, and 561 nm excitation/580–650nm detection for RGECO) was recorded every 20 sec. Both color channels were recorded simultaneously with line-based scanning. Images were manually analyzed in NIH ImageJ.
Microfluidic chip design and operation
The fly gut was immobilized and force stimuli applied in a microfluidic chip. The design took advantage of the pressure sensitivity of the poly material (PDMS, building materials of the microfluidics), and had been applied in previous studies of C. elegans41. The chip was designed using the software of Tanner L-Edit and fabricated following standard microfluidics fabrication procedures42. The layout of the design is shown in Extended Data Fig. 9. The middle channel was designed for loading and holding the gut, with the size of 6mm long and 200 μm wide. The two-side channels were for delivering the pressure, with the size of 1mm long and 450 μm width. The membrane in between is 70 μm wide, which was used for squeezing the guts when pressures were applied. The pattern was transferred onto a silicon wafer via photoresist with the height of 200 μm, which was then transferred to PDMS and bonded with glass. To achieve the desired softness, the PDMS was mixed 20:1 with the cross-linker.
Freshly dissected fly midguts were loaded in the channel inlet with the anterior part of the gut located in the middle between the two membranes. In the device, compressed air is connected to the side channels via a bidirectional switch. In the off state, the side channels are at the atmospheric pressure, and no pressure is applied on the gut. When switched to the on state, compressed air presses the PDMS membrane and squeezes the gut. The ratio of the channel width reduction was ~30% during the compression and the relaxation time of the PDMS membrane was ~1 sec. Ca2+ signals were indicated by GCAMP6s43 and captured using a Zeiss LSM 780 confocal microscope equipped with a definite focus using Plan-Neofluar 10x/0.30 lens. The anterior midgut area was recorded as time-lapse of z-stacks capturing the whole depth of the midgut every 2 sec. GCAMP6s emission was excited at 448 nm and recorded at 500–550 nm and tdTomato was excited 561 nm at and recorded at 580–610 nm. Ca2+ imaging experiments were done with identical acquisition parameters for consistency. Images from the experiment were projected using maximum intensity projection and analyzed using a macro in ImageJ to automatically detect the number of GFP-positive cells in each frame. Tracing of Ca2+ signals in individual stem cells was done using Z-axis profiling function of NIH ImageJ. Ca2+ signal in individual stem cells during mechanical compression was tacked manually.
RT-qPCR
Total RNA was extracted from 5–7 days old female by TRIZOL reagent (Thermo Fisher), converted to cDNA template after DNase I treatment and purification by QIAGEN RNeasy kit. Real-time PCR was performed using SYBR Green with GAPDH and alpha-tubulin as an internal control. Piezo mRNA was detected by two pairs of independent primers (Supplementary Table 2).
Statistics and Reproducibility
All the images presented and used for quantification are from the anterior region of adult female fly midgut for consistency. 2–3 square areas (10,000 μm2 unless specified otherwise) were randomly selected from each midgut and quantified automatically using cell counting function of NIH ImageJ. All experiments were independently biologically repeated at twice (unless specified otherwise) with similar results presented in the figures. No randomization or blind test was used. Statistical analysis was performed using Microsoft Excel. All p-values were determined by two-tailed Student’s t-test with unequal variances. Sample sizes were chosen empirically based on the observed effects and listed in the figure legends.
Data availability
All relevant data have been included in the paper and the supplementary files. Original quantifications of different cell numbers were listed in the Supplementary Dataset file. Complete genotypes information is provided in Supplementary Table 1. Original data that support the findings of this study are available from the corresponding author upon request.
Extended Data
Extended Data Figure 1. Piezo expression pattern and Piezo+ cell lineage in the fly midgut.
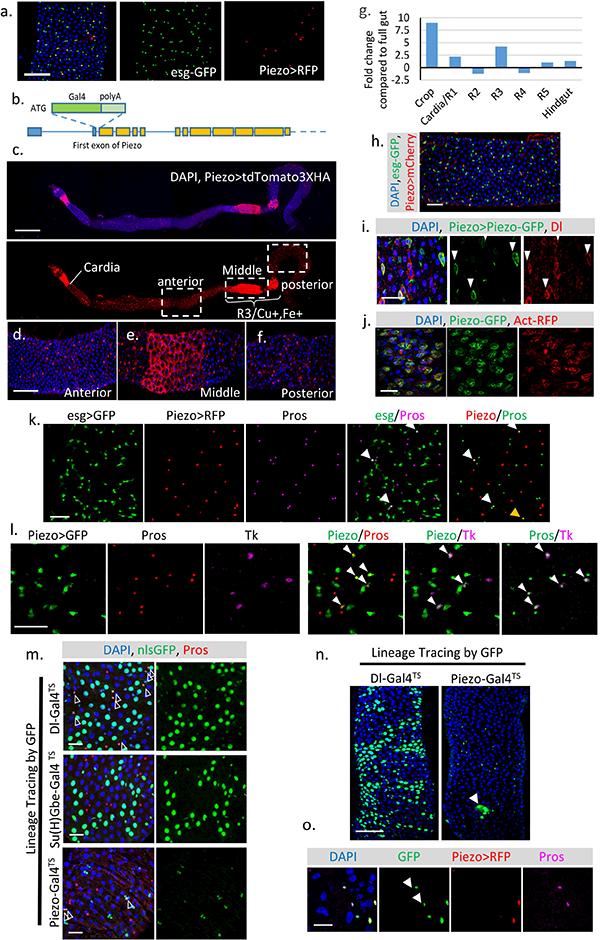
a. Expression pattern of Gal4 (BL59266) driven by the Piezo promoter6. b. Schematic of Drosophila Piezo gene structure. Gal4 together with poly-A tail was knocked in after the first start codon of Piezo. The ten predicted Piezo isoforms share the same N-terminus. We refer to this knock-in Gal4 line as Piezo-Gal4[KI]. All Piezo-Gal4 lines used in the manuscript are Piezo-Gal4[KI]. c-f. Piezo expression pattern in the midgut (Piezo-Gal4,UAS-tdTomato3XHA). Tissue was stained with anti-HA antibody to enhance the original signal. In addition to the small diploid stem cells, Piezo is also expressed in ECs after the cardia and around the Cu/Fe region of the midgut. Gal4 activity outside the intestinal epithelium from tracheal cells can also be detected. g. Expression pattern of Piezo mRNA along different sections of the midgut. h. Drosophila midgut with Piezo+ cells labeled by PiezoGal4, UAS-mCherryCAAX (Piezo>mCherry) and esg+ cells labeled by esg-nlsGFP. i. Midgut with Piezo+ cells labeled by Piezo-Gal4, UAS-Piezo-GFP. Dl+ stem cells were stained by anti-Delta antibody. Cells positive for PiezoGFP are indicated by arrowheads. j. Midgut expressing UAS-Piezo-GFP in esg+ cells with F-actin labeled by UAS-Act5C-RFP. A recent study has shown that Piezo may form large cytoplasmic aggregates under stressed condition19, however, in the fly midgut, the GFP-tagged Piezo protein is localized primarily on the plasma membrane under both quiescent or over-proliferation conditions (i,j). k. esg>GFP is used as an indicator of “newborn” EEs. Under normal physiological condition, around 2–3% of esg+ cells stain for Pros, suggesting that they are either differentiating or have just differentiated into EEs (indicated by arrowheads). In addition, all the newborn EEs are also positive for Piezo. Piezo and Pros double positive but esg negative cells can be found occasionally (indicated by yellow arrowhead), most likely reflecting their late stage of differentiation. l. If the newborn EEs are restricted to any specific EE subtype was tested. Tachykinin (Tk) is stained with antibody. Piezo+ newborn EEs are composed of both Tk+ and Tk− cells, suggesting that Piezo+ cells are precursors for different types of EEs. Cells positive for both Piezo and Pros (left panel), Piezo and Tk (middle panel), Pros and Tk (right panel) were indicated by arrowheads. m. Dl+, Su(H)+ and Piezo+ cells were traced using Dl-Gal4, Su(H)-Gal4, and Piezo-Gal4 together with UAS-Flp, Act>FRT>Stop>FRT>nlsGFP. TubGAL80TS. GAL80TS was used to suppress the early activity of Gal4 before adulthood. GFP+ clones were induced by transient incubation at 32°C. Pros (Red) and GFP double positive cells are indicated by arrowheads. n. Compared with Dl-Gal4TS, which generate large GFP+ EC clones, Piezo-Gal4TS primarily generates individual GFP+ cells with occasional GFP+ EC cell clone (indicated by arrowhead). o. To visualize the cells with Gal4 activity, which is repressed by the presence of tubGal80TS, we incubated the flies at 32°C overnight before analysis. In this figure, two Pros+ cells are GFP positive but RFP negative (indicated by arrowheads), suggesting that they are derived from Piezo+ cells and stop expressing Piezo. All experiments were independently repeated at least twice with similar results presented in the figures. Scale bar: a, 50 μm; c, 500 μm.; d-f, 100 μm. h, 50 μm; i, j, 25 μm; k,l,m, 20 μm; n, 50 μm; o, 10 μm.
Extended Data Figure 2. Piezo+/EP cells are ISC-derived EE precursors with reduced mitotic ability.
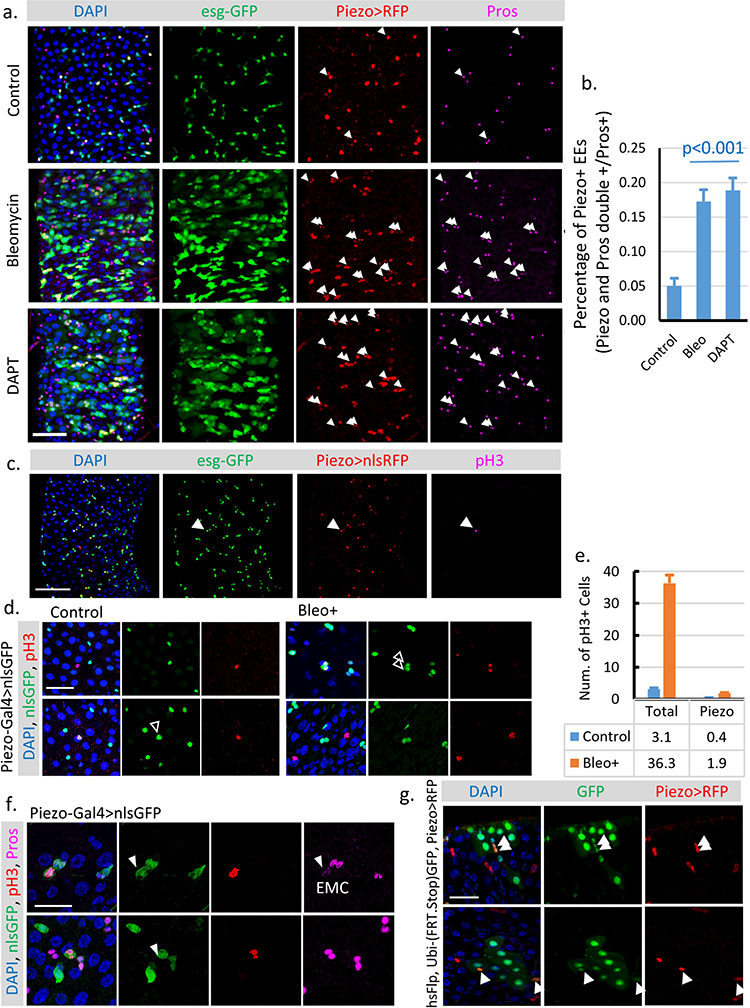
a. Midguts from flies treated with Bleomycin (10 μg/ml Bleo in 5% sucrose) or the γ-secretase inhibitor DAPT (4 mM DAPT in 5% sucrose). Cells that are positive for both Piezo and Pros are indicated by arrowheads. Note that the majority (>95%) of Piezo and Pros double positive cells are also positive for esg, suggesting that these cells are “newborn” EEs that still retain esg-GFP signal. b. Percentage of the newborn EEs (Piezo and Pros double positive cells vs. total Pros+ EEs) in fly midguts under control, Bleomycin, and DAPT treatments. Cells within 200 μm X 200 μm areas, n=27 (control), n=25 (Bleo), and n=22 (DAPT), were analyzed. c. Midgut with stem cells labeled by esg-GFP (Green), Piezo+ cells labeled by Piezo-Gal4>nlsRFP (Red), and mitotic cells labeled by anti-phospho-Histone H3 (pH3) (Magenta). pH3+ mitotic cell is indicated by arrowhead. d,e. Representative images of midguts from flies feed on either control (5% sucrose) or Bleomycin (5% sucrose plus 10ug/ml Bleomycin) food. Piezo+ EP cells are labeled by Piezo-Gal4>nlsGFP (Green), mitotic cells are labeled by pH3 staining (Red). Mitotic Piezo+ cells are indicated by arrowheads. Since all pH3+ cells are Dl+ cells (according to Dl-lacZ labeled midgut), we counted all Piezo negative pH3+ cells as pH3+ ISCs. Under both control (5% sucrose) and damage (5% sucrose + 10 μg/ml Bleomycin) conditions, only around 8–10% of the pH3+ cells are Piezo+ (~40% of total Dl+ cells), suggesting that Piezo+ cells are significantly less mitotically active compared to Piezo- Dl+ cells. f. If the pH3+ Piezo+ cells are also Pros+ as previously described “enteroendocrine mother cell (EMC)” was tested21. Around 50% of these pH3+ Piezo+ cells show low levels of Pros staining. Meanwhile, all the pH3+ Pros+ cells are positive for Piezo, suggesting that Piezo+ EP cells represent more general EE precursor cells compared to EMCs. Mitotic Piezo+ cells are indicated by arrowheads. All experiments were independently repeated at least twice with similar results presented in the figures. g. Random GFP+ clones were generated using hsFlp; Ubi-(FRT.Stop)GFP/Piezo-Gal4; UAS-nlsRFP. 3–4 days old flies were heat shocked at 37°C for 30 min once to induce clones in ISCs. Then these flies were kept at 25°C for 2 weeks before analysis. Within each GFP+ clone, which is derived from ISCs, there are typically 1–2 Piezo+ cells in the cluster (indicated by arrowheads), suggesting that Piezo+ cells are generated from ISCs after adulthood. All experiments were independently repeated at least twice with similar results presented in the figures. Data are expressed as mean + s.e.m. P-values are calculated from two-tailed Student t-test with unequal variance. Scale bar: a,c, 50 μm; d,f 20 μm; g, 25 μm.
Extended Data Figure 3. Expression and function of Piezo in larval and pupal midguts.
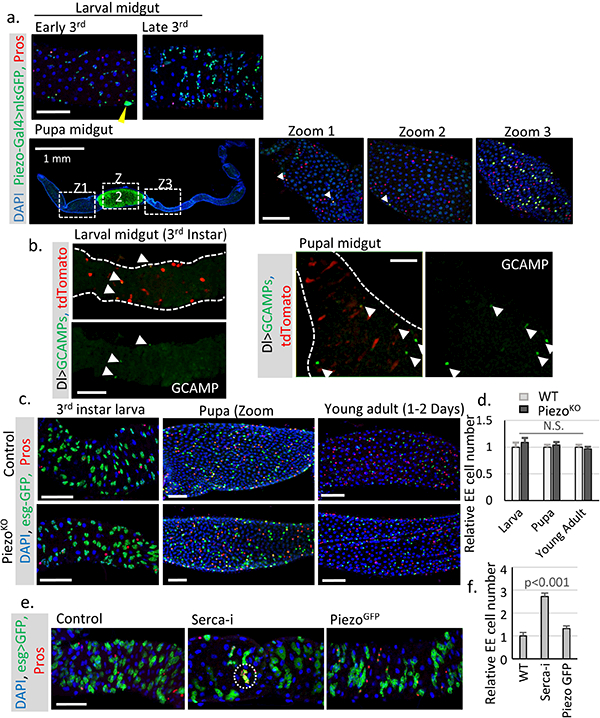
a. Expression pattern of Piezo in larval and pupal midguts. Piezo+ cells are labeled by Piezo-Gal4>nlsGFP. Piezo is enriched in adult midgut precursor cells (AMPs) during larval stages. Strong expression of Piezo is also detected in tracheal cells associated with the midgut (the nucleus of tracheal cells are indicated by yellow arrowhead). After pupariation, the GFP signal can be detected at low level in most midgut cells (including ECs), but enriched in a few stem cells and EEs, which presumably are newborn EEs. Pupal gut 72 hours after pupae formation (APF) is shown with cells positive for both Piezo and Pros are indicated by arrowheads in Zoom1 and Zoom 2. Importantly, high Piezo level is detected in a large number of EEs present in the mid-section of the pupal gut, suggesting that the association of Piezo expression and EE differentiation is probably conserved during the pupal stage. b. Live imaging of larval and pupal midguts expressing GCAMP and mcd8RFP by Dl-Gal4. Cells with high GCAMP activity are indicated by arrowheads. c,d. Midguts from Piezo null flies show no significant EE generation defects during larval, pupal, or early adult stages (1–2 Days after eclosion). Number of midgut areas quantified: n=24 (WT, larva), n=23 (WT, pupa), n=28 (WT, young adult), n=23 (PiezoKO, larva), n=23 (PiezoKO, pupa), n=28 (PiezoKO, young adult). These results indicate that mechanical controlled Piezo activation is not the major mechanism for EE production during early development. Unlike the adult midgut, the larval midgut does not regenerate through mitosis and only grow through increases in cell size. It is only during late stages of 3rd instar larval development that the quiescent AMPs start to proliferate and generate both new ECs and EEs for pupal gut formation, and the majority of new EEs (~ several hundred) are created within a very narrow time window ~ 72–96 hr APF (after pupae formation)27. Therefore, the generation of EEs is 15–30 times faster at that stage than during the adult stage under physiological condition, suggesting that a different mechanism that stimulates strong acute EE differentiation is probably involved during developmental stages. e,f. Knocking down SERCA using esg-Gal4 during larval stages significantly increases EE cell number. Meanwhile, overexpression of Piezo-GFP has no significant phenotype. A cluster of extra EE cells are indicated by write circle. Number of midgut areas quantified: n=26 (WT), n=28 (SercaRNAi), n=26 (PiezoGFP). All experiments were independently repeated at least twice with similar results presented in the figures. Data are expressed as mean + s.e.m. P-values are calculated from two-tailed Student t-test with unequal variance. Scale bar: 50 μm.
Extended Data Figure 4. Piezo regulate stem cell differentiation primarily through Ca2+ signaling, which is upstream of Notch, Ttk69, and the Achaete-Scute complex (AS-C).
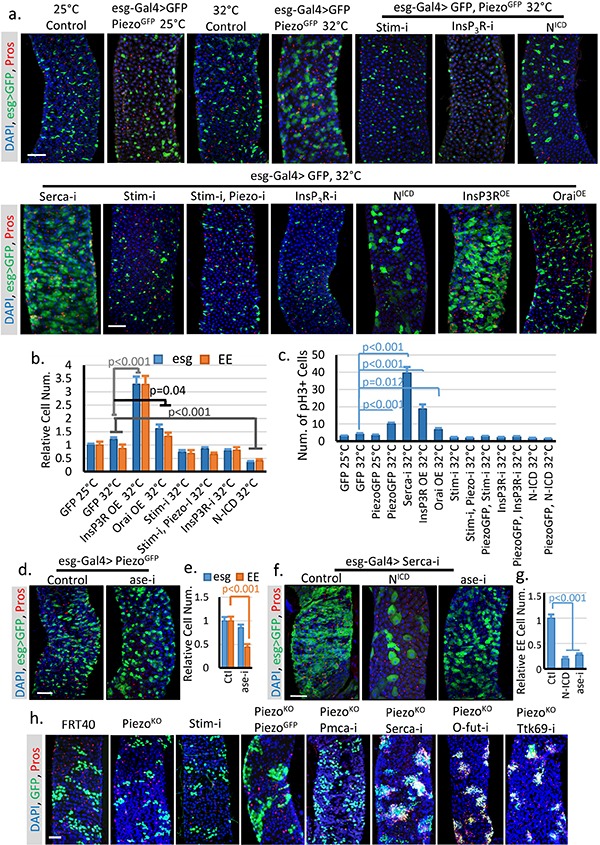
a. Phenotypes associated with UAS-GFP (at 25°C or 32°C), UAS-PiezoGFP together with StimRNAi, InsP3RRNAi and NICD, and UAS-GFP together with StimRNAi, StimRNAi + PiezoRNAi, InsP3RRNAi, NICD, InsP3R over-expression (InsP3ROE), and Orai over-expression (OraiOE) (at 32°C). Overexpression of PiezoGFP using esg-Gal4 did not show a significant phenotype at 25°C. By contrast, incubation at 32°C for 4 days showed an increased in the number of both esg+ cells and Pros+ EEs. Moderate over-expression of Piezo at 25°C had no significant effects. However, strong over-expression at 32°C caused an increase in both esg+ cells and EEs, which phenocopied the increase of cytosolic Ca2+ through SERCA reduction. All flies were incubated at the indicated temperature for 4–5 days before analysis. b. Statistics of the number of esg+ and Pros+ cells within 10,000 μm2 area. Number of midgut areas quantified: n=30 (GFP 25°C), n=31 (GFP 32°C), n=25 (InsP3ROE 32°C), n=27 (OraiOE 32°C), n=31 (Stim-i 32°C), n=27 (Stim-i, Piezo-i 32°C), n=29 (InsP3R-i 32°C), n=29 (N-ICD 32°C). c. Average number of mitotic cells within the fly midgut from indicated genotypes were quantified. Number of midguts analyzed: n=20 (GFP 25°C), n=19 (GFP 32°C), n=20 (PiezoGFP 25°C), n=19 (PiezoGFP 32°C), n=18 (Serca-I, 32°C), n=18 (InsP3ROE 32°C), n=24 (OraiOE 32°C), n=19 (Stim-i 32°C), n=19 (Stim-i, Piezo-i 32°C), n=19 (PiezoGFP, Stim-i 32°C), n=18 (InsP3R-i 32°C), n=18 (PiezoGFP, InsP3R-i 32°C), n=17 (N-ICD 32°C), n=17 (PiezoGFP, N-ICD 32°C). d,e. EE production induced by overexpression of PiezoGFP is blocked by aseRNAi (Acheate-Scute complex component asense). Number of midgut areas quantified: n=29 (Ctl), n=30 (ase-i). f,g. Expression of NICD in the presence of SercaRNAi significantly reduced both stem cell proliferation and EE production. Meanwhile, knocking-down ase specifically blocks EE differentiation but not proliferation. Number of midgut areas quantified: n=27 (Ctl), n=24 (NICD), n=25 (ase-i). Even though ttk69 and AS-C knock down affect Piezo and Serca related phenotypes, we think that Ca2+ signaling probably does not directly affects Ttk69 or AS-C since previous studies have shown that Ttk69 and AS-C reduction can convert Notch-high EB cell into EEs28, but neither Piezo over-expression nor Serca knockdown has any effect in EBs. h. MARCM clones of cells homozygous for FRT (Ctl), Piezo null allele (PiezoKO), Stim-RNAi, PiezoKO + PiezoGFP, PiezoKO + Pmca-RNAi, PiezoKO + Serca-RNAi, PiezoKO + O-fut-RNAi, and PiezoKO + ttk69-RNAi. Rescue/reversion of the reduction of EEs in Piezo null clones by increasing cytosolic Ca2+ (by knocking down the Ca2+ export pump Pmca or endoplasmic reticulum Ca2+ ATPase Serca) or by reducing Notch activity (by knocking down its key processing enzyme O-fut, and knocking down EE cell fate repressor ttk69). All data are collected from at least two independent replicates and are expressed as mean + s.e.m.. P-values are calculated from two-tailed Student t-test with unequal variance. Scale bar, 50 μm.
Extended Data Figure 5. Prolonged increase of stem cell proliferation may reduce EE cell number.
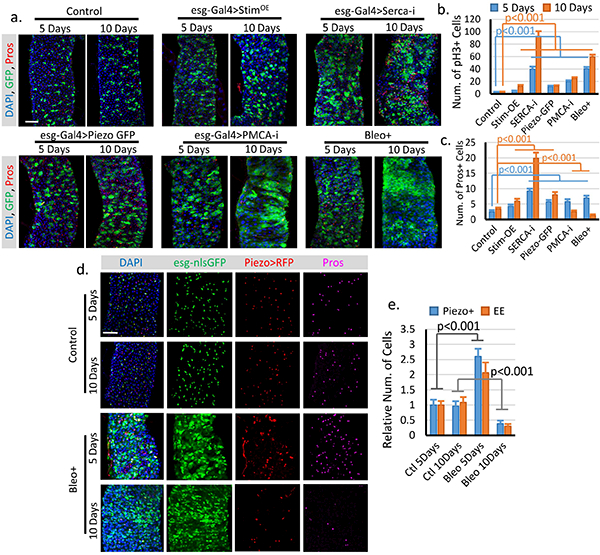
a. Fly midguts of each indicated genotype/condition were analyzed after 5 and 10 days incubations at 32°C. esg+ cells and EE cells were labeled by esg>GFP and anti-Pros staining. Representative images from two independent replicates were shown. b. Quantification of mitosis (pH3+ cell number) of midguts from flies expressing GFP only (control, n=16/5 days, n=16/10 days), full-length Stim (StimOE, n=15/5 days, n=17/10 days), SercaRNAi (Serca-i, n=18/5 days, n=16/10 days), PiezoGFP (n=17/5 days, n=18/10 days), PMCARNAi (PMCA-i, n=15/5 days, n=15/10 days), and flies fed Bleo+ containing food (regular food + 10ug/ml Bleomycin, n=15/5 days, n=13/10 days). c. Quantification of Pros+ EE cell number from 10,000 μm2 regions: n=31/5 days, n=30/10 days (control); n=30/5 days, n=32/10 days (StimOE); n=30/5 days, n=30/10 days (SercaRNAi); n=31/5 days, n=32/10 days (PiezoGFP); n=32/5 days, n=31/10 days (PMCARNAi); n=29/5 days, n=28/10 days (Bleo+). Bleomycin treatment or PMCARNAi significantly reduced the number of EEs. This reduction is primarily due to increased turn-over of EEs, since blocking cell mitosis for 5 days had no significant effect on EE cell number (Extended Data Figure 7). The differences between stem cell proliferation and EE differentiation may due to a different level of cytosolic Ca2+ increase and the Ca2+ depletion in the ER store. d. Change of Piezo+ cells and EEs after 5 and 10 days of control (5% sucrose) or Bleomycin (5% sucrose plus 10ug/ml Bleomycin) treatment. Representative images from two independent replicates were shown. e. Quantification of Piezo+ cells and EEs from 10–15 midguts for each condition. Both Piezo+ cells and EEs number increased after 5 days of Bleomycin treatment and significantly decreased after 10 days of treatment. Cell numbers were quantified within 10,000 μm2 area, except for pH3, which is quantified from the whole midgut. All data are expressed as mean + s.e.m. values. P-values are calculated from two-tailed Student t-test with unequal variance. Scale bar, 50 μm.
Extended Data Figure 6. Piezo over-expression increases cytosolic Ca2+ level which further triggers proliferation of ISCs but not EBs.
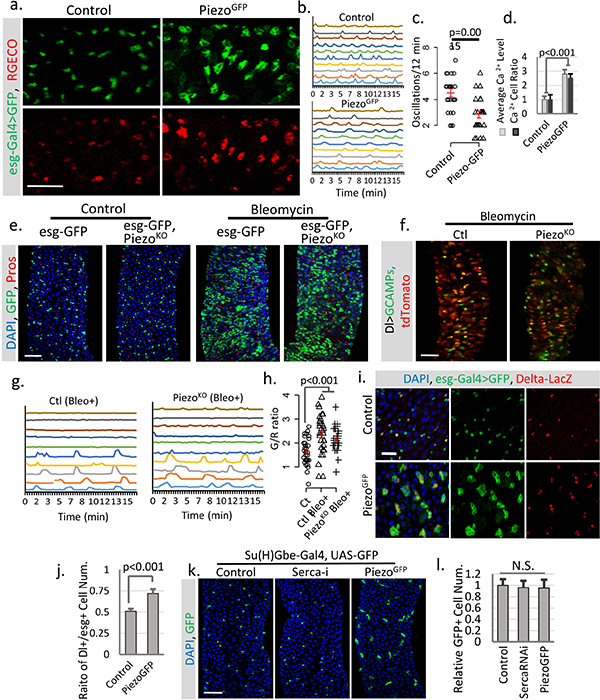
a. Overexpression of PiezoGFP in esg+ cells (esg>Gal4/UAS-PiezoGFP; UAS-RGECO) at 32°C causes an increase in cytosolic Ca2+ (indicated by the calcium reporter RGECO) compared to control (esg>Gal4/UAS-GFP; UAS-RGECO). Representative images from three short time-lapse imaging of cultured fly midguts were shown. Scale bar: 50 μm. b. Typical traces of Ca2+ oscillations in esg+ cells of midgut from either control or PiezoGFP flies from three independent replicates. c. Ca2+ oscillation frequency of esg+ cells from either control or PiezoGFP midguts. Data of 27 cells from three replicates for each condition were shown. d. Statistics for average RGECO signal intensity in all GFP+ cells (blue) and percentage of Ca2+ positive cells (signal higher than 3X s.d. of background) compared to total GFP+ cells (orange). Signal intensities were calculated from 10,000 μm2 regions: n=17 (control), n=22 (PiezoGFP) from three independent experiments. e, Bleomycin (Bleo, 10ug/ml) (5 days treatment) triggers a significant increase of esg+ cell and EE cells in both WT and PiezoKO flies. Represented images from three independent replicates were shown. f, Images of live midguts from WT and PiezoKO flies. Both flies were fed on food containing Bleomycin for 3 days before imaging. g,h. Traces of Ca2+ oscillations in Dl+ stem cells from WT and Piezo mutant flies fed on Bleomycin for 4–5 days. Bleomycin treatment causes some stem cells to maintain constant high Ca2+ levels, while others show reduced oscillation frequency but increased average GCaMP/RFP intensity ratio (G/R ratio). These data show that tissue damage by Bleomycin triggers stem cell proliferation, EE production, and an increase of cytosolic Ca2+, independent of Piezo. 30 cells from n=4 (control), n=4 (Bleo+), and n=5 (PiezoKO + Bleo+) independent guts were plotted. i. Overexpression of PiezoGFP in esg+ cells (32°C) increases the ratio of Dl+ cells (labeled by Dl-lacZ) within the esg+ population. j. Piezo overexpression promotes Dl+ stem cells ratio in esg+ cells. Ratio between Dl+ and esg+ cells within 10,000 μm2 regions: n=21 (control) and n=22 (PiezoGFP) from two independent replicates, are analyzed. k,l. Overexpressing Piezo or knocking down Serca in Su(H)Gbe+ EB cells showed no significant phenotype, suggesting that their effect may be blocked by high Notch activity. Number of midgut areas quantified: n=18 (control), n=20 (Serca-i), n=16 (PiezoGFP). Data are expressed as mean + s.e.m. values. P-values are calculated from two-tailed Student t-test with unequal variance. Scale bar: a,e,f, 50 μm; i, 20 μm; k, 50 μm.
Extended Data Figure 7. Cytosolic Ca2+ triggers ISC proliferation and EP differentiation into EEs.
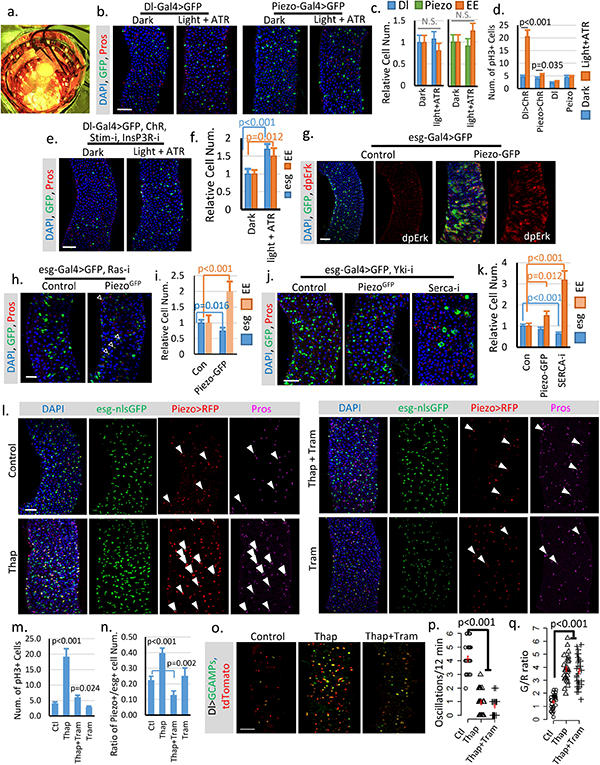
a. Image of chamber used for optogenetic activation of ChR. b,c. Flies expressing GFP only in Dl+ stem cells or Piezo+ EP (EE precursor) cells were treated under either dark or light + ATR condition for two weeks like the flies expressing ChR. No significant phenotype was induced by the treatment alone. Number of midgut areas quantified: n=29 (Dl, Dark), n=33 (Dl, light+ATR), n=31 (Piezo, Dark), n=34 (Piezo, light+ATR). Representative results from two independent replicates are shown. d. Mitosis quantification of midgut from indicated genotype/condition. Activating ChR in Dl+ cells significantly promotes stem cell proliferation. Only a mild increase of mitosis was detected in ChR active Piezo+ EP cells, suggesting that the primary effect of Ca2+ in EP cells is to promote differentiation. Data are collected from 30 guts (Dl>ChR); 30 guts (Piezo>ChR); 29 guts (Dl); guts (Piezo) from two independent replicates. pH3+ cell number is quantified from the whole midgut. e,f. Activation of CsChrimson in Dl+ stem cells with both Stim and InsP3R knocked-down shows reduced increase of stem cells and EEs compared to WT stem cells. Flies were raised at 18°C and shifted to 25°C during the experiment. Cell numbers are quantified within 10,000 μm2 area from 29 regions (dark) and 31 regions (light + ATR) from two independent replicates. g. Overexpression of Piezo in esg+ cells increases MAPK pathway activity. Phosphorylation of extracellular signal-regulated kinase (dpErk) is significantly increased in Piezo-overexpressing cells. Representative images from two independent experiments are shown. h,i. Knocking down Ras significantly reduces stem cell proliferation caused by Piezo overexpression, but does not block Piezo triggered EE differentiation. Flies were kept at 32°C for 4–5 days before analysis. esg+ and EE cell number were quantified from n=29 (control) and n=30 (PiezoGFP) midguts areas from two independent experiments. “Newborn” EEs, that are positive for both esg and Pros, are indicated by arrowheads. j,k. Knocking-down Yorkie using YkiRNAi completely blocks stem cell proliferation but not the increase of EE cells induced by either Piezo overexpression or Serca knock-down. In addition, knocking-down Serca together with Yorkie also significantly reduced stem cell number, suggesting a depletion of stem cells caused by constant EE differentiation. Cell numbers were quantified within 30 midgut areas for each genotype. l. Midguts from flies fed on control (5% sucrose), Thap (5% sucrose + 0.5μM Thapsigargin), Thap+Tram (5% sucrose + 0.5μM Thapsigargin + 10μM Trametinib), and Tram (5% sucrose + 5μM Trametinib) for 4 days. Representative images from 3 independent experiments are shown. The increase of cytosolic Ca2+ by Thap promotes stem cell proliferation, EP (enteroendocrine precursor/Piezo+ cell) production, and EE differentiation. Newborn EEs, which are positive for esg, Piezo and Pros, are indicated by white arrowheads. m. Data are collected from Quantification of mitotic cells from n=15 (control), n=16 (Thap), n=17 (Thap + Tram), and n=16 (Tram) midguts. Thap treatment triggers a significant increase in mitosis, which is largely reduced by the mitogen-activated protein kinase (MAP kinase) inhibitor Tram. n. Percentage of Piezo+ cells within esg+ cell population. Number of areas quantified: n=29 (Ctl), n=31 (Thap), n=32 (Thap+Tram), n=29 (Tram). o. Representative Ca2+ images of live midgut from control, Thap, and Thap+Tram treated flies. Similar results are collected from 4 independent guts for each condition. p,q. Thap treatment caused a reduction of oscillation frequency but an increase of average GCaMP/RFP ratio (G/R ratio). The increase of cytosolic Ca2+ by Thap is not affected by MAPK inhibition. Data are collected from 29 Cells from 3 independent guts for each condition. All data are expressed as mean + s.e.m. values (shown in red). P-values are calculated from two-tailed Student t-test with unequal variance. Scale bar: 50 μm.
Extended Data Figure 8. Over-feeding triggers stem cell proliferation and EE increase.
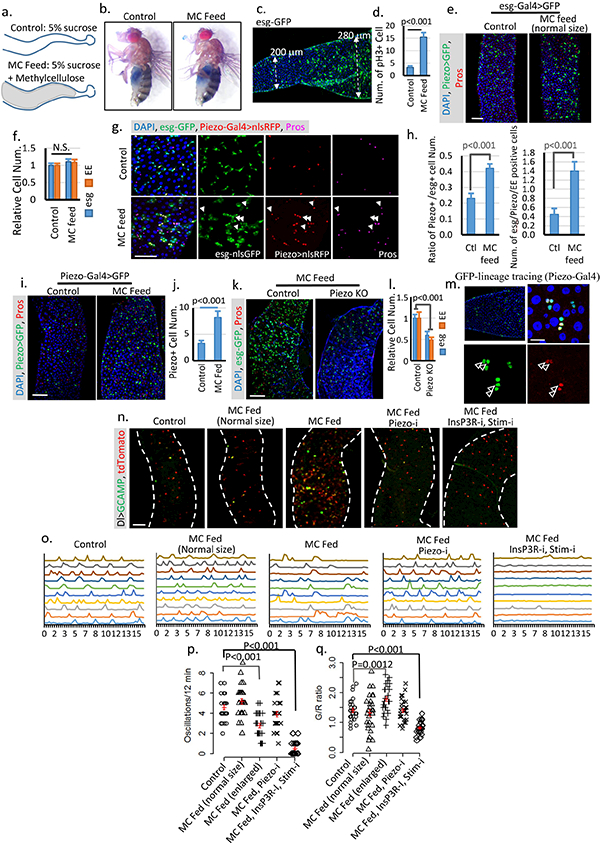
a. Schematic illustration of fly midguts from control (5% sucrose) or MC (5% sucrose + 10% Methylcellulose) fed flies. b. “Smurf” assay of flies fed on both control and MC food shows no damage of gut integrity. Two independent replicates showed similar results. c,d. Image of a midgut feed on MC food. The cell proliferation phenotype is associated with midgut diameter increase but not food content. Data are collected from 23 midgut areas from two independent experiments for each condition. e,f. Midguts from flies fed on MC food with no increase of gut diameter shows no phenotype compared with control. Data are collected from 31 regions (control) and 28 regions (MC feed) from three independent experiments. g,h. Feeding-induced cell proliferation produces more Piezo+ cells, which differentiate into EEs. All newborn EEs are indicated by white arrowheads. Data are collected from 27 areas from 2 independent experiments for each condition. i,j, Feeding-induced midgut enlargement triggers a significant increase in EP/Piezo+ cell number. Data are collected from n=30 (control) and n=32 (MC feed) midgut areas from two independent replicates. k,l. Feeding-trigged stem cell proliferation and EE increase are blocked in Piezo null mutant. Data are collected from n=27 (control) and n=32 (PiezoKO) midgut areas from two independent replicates. P-values for both esg and EE are smaller than 0.001. m. Linage tracing experiment (using Piezo-Gal4) under overfed condition shows a significant increase in cell number (2–3) in the same cluster compared to tracing result under control condition, suggesting that either more Piezo cells were created from ISCs or more Piezo+ cells divide to create more progeny. Cells positive for both GFP and Pros are indicated by arrowheads. n, Images of live midguts from the following conditions/genotypes: control, MC fed without midgut diameter increase (normal size), MC fed with enlarged midgut diameter, MC fed with PiezoRNAi and enlarged midgut diameter, and MC fed with InsP3RRNAi + StimRNAi and enlarged midgut diameter. o. Representative traces of Ca2+ oscillations in Dl+ stem cells of flies from indicated treatment/genotypes. Data are collected from 3 independent experiments for each genotype/condition. p,q. Ca2+ oscillation frequency and GCaMP/RFP intensity ratio of 30 cells from 3 individual guts for each genotype are plotted. Mean ± s.e.m. is displayed in red. Enlarged midgut fed on MC food shows reduced Ca2+ oscillation frequency but increased average cytosolic Ca2+ level. MC food alone does not trigger any significant change of Ca2+ activity. Knocking-down either Piezo or both Stim and InsP3R blocks this feeding-induced increase of cytosolic Ca2+. Knocking-down InsP3R or Stim alone has no significant effect on cytosolic Ca2+ (Data not shown), which is probably due to the reduced expression level of Dl-Gal4 compared with esg-Gal4. The change of Ca2+ activity in MC-fed enlarged midguts is similar to some cells in the Bleomycin damaged midguts (Extended Data Fig. 6 f,g). However, the majority of cells from MC-fed enlarged midguts still oscillate, which is different from stem cells in Bleomycin-treated midguts in which a large portion of cells maintain a constant high level of Ca2+ (Extended Data Fig. 6 f,g). Data are indicated as mean + s.e.m. values. P-values are calculated from two-tailed Student t-test with unequal variance. Scale bar: e,i,k,n, 50 μm; g, 25 μm; m, 10 μm.
Extended Data Figure 9. Direct mechanical activation of the Piezo channel triggers an increase of cytosolic calcium in stem cells.
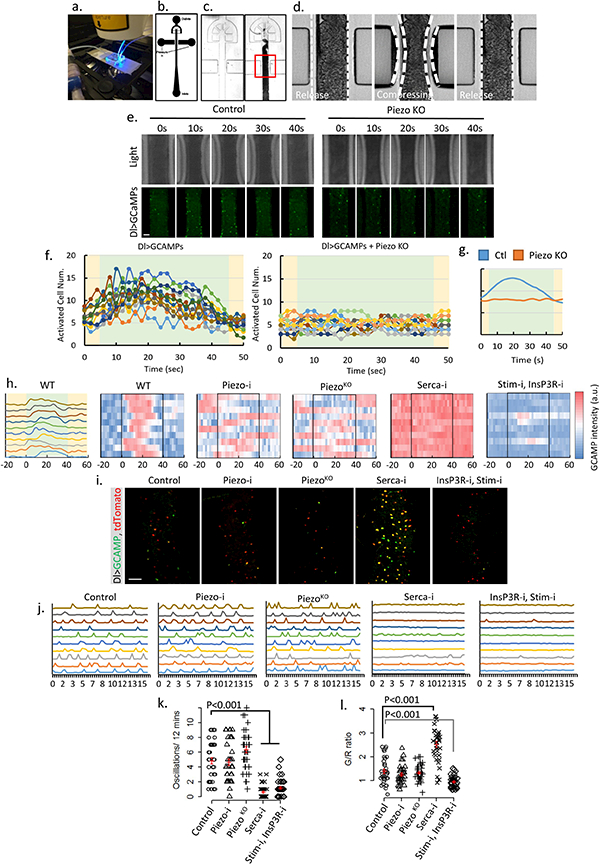
a. Image of the microfluidic chip used for the ex vivo mechanical trigger experiment. b-c. Design of the channels on the microfluidic chip. Compressed air was delivered through left and right channels and controlled by a manual gauge. Dissected fly midguts were loaded into the main channel (center) from an inlet at the bottom. d. During each compression cycle, the midgut was squeezed to achieve ~30–35% reduction in diameter from both sides. The switching time between compression and relaxation is ~1 s. e. Representative samples of ex vivo mechanical trigger experiment. Time 0 s and 40 s were taken immediately before and after compression. The total compression time is 40 s. Transmission light (up panel) and GCaMP6s signal (bottom panel) are shown. Compared to control, loss of Piezo significantly blocked activation of stem cells by mechanical compression. f. Plots of activated cells numbers during one triggering cycle (50 s) for control (n=12) and PiezoKO (n=15) fly midguts. Data were collected from 4–5 individual midguts. All GCaMP positive cells (brighter than the 5 folds of background signal) within the field were counted. Periods of compression and relaxation are indicated by green and yellow colors, respectively. g. Averaged response curves of multiple compression cycles (n=12 for control and n=10 for PiezoKO) from control (blue) and PiezoKO (orange) midguts. h. Typical traces of Ca2+ activities in WT stem cells that respond to the mechanical stimulus. Data is represented in curve plot (first panel) and heatmap plot (second panel), respectively. Compression period is from 0 to 40 seconds (indicated by black box). Typical traces of Ca2+ activities with indicated genotypes. Stem cells with Piezo knockdown or mutant do not respond to the mechanical stimulus. Knocking-down Serca causes a constant high cytosolic Ca2+. Knocking-down both Stim and InsP3R significantly reduces random Ca2+ activities and largely blocks mechanically triggered a Ca2+ increase. Data are collected from 3 independent experiments for each genotype/condition. i. Images of cultured midguts from control, PiezoRNAi, PiezoKO, SercaRNAi, InsP3RRNAi + StimRNAi flies. j. Typical traces of Ca2+ activities in stem cells of indicated genotypes. Data are collected from 3 independent guts for each genotype/condition. k,l. Ca2+ oscillation frequency and GCaMP/RFP intensity ratio (G/R ratio) in cells from 35 cells (control), 35 cells (PiezoRNAi), 34 cells (PiezoKO), 36 cells (SercaRNAi), 33 cells (InsP3RRNAi + StimRNAi) from 3 independent experiment for each condition/genotype. Neither PiezoRNAi nor PiezoKO significantly affect Ca2+ activities. Knocking-down Serca induces a constant increase of cytosolic Ca2+ in most cells. Knocking-down both InsP3R and Stim stem cells significantly reduces their Ca2+ activities. Our data indicate that mechanical stresses generated during food digestion may activate Piezo and promote EE generation in vivo. However, we note that the time-scale between our ex vivo mechanical activation and in vivo cell proliferation and differentiation experiment is very different, especially as the in vivo property of Piezo-mediated Ca2+ activity in EP cells is unknown. According to our observations, only a small percentage (<5%) of Piezo+ cells become EEs every day under normal condition (interpreted from Piezo/Pros double positive cell number). Therefore, it is possible that either Piezo in vivo is difficult to activate through physiological level mechanical stimulus or that long-term cumulative Piezo activation is required to trigger EEs differentiation. Mean ± s.e.m. is displayed in red. P-values are calculated from two-tailed Student t-test with unequal variance. Scale bar: 50 μm.
Extended Data Figure 10. Model.
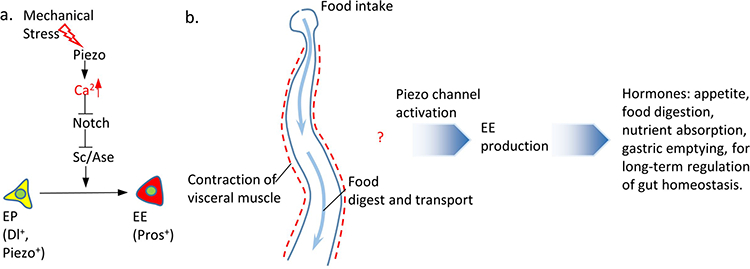
a. Under normal conditions, Piezo+ cells, which we refer to as endocrine precursor (EP) cells, are unipotent stem cells that are mitotically quiescent and have a predetermined EE cell fate. In the presence of mechanical stimulation, the Piezo channel is activated and leads to an increase of cytosolic Ca2+ in Piezo+ EP cells. Ca2+ increase in EP cells triggers strong ell differentiation into EEs, which is probably mediated through inhibition of Notch activity and consequent increase of Sc/Ase transcription activity. b. The presence of food in the intestine triggers an elevated mechanical stress during food transport and visceral muscle contraction. Our results suggest that mechanical signaling activates the mechanosensitive channel Piezo in quiescent EP cells, leads to an increase in cytosolic Ca2+ level, which maintains the basal level EE cell production under-physiological condition and promotes fast EE generation under abnormal fed condition. We hypothesize that, as a key regulator of midgut function, EE cells might secrete hormones to enhance different long-term gastric functions including appetite, digestion, nutrient absorption, or gastric emptying.
Supplementary Material
ACKNOWLEDGMENTS
We thank Richard Binari, Wei Song, and Christians Villalta for technical support, and Chiwei Xu, Stephanie Mohr, and David Doupe for comments on the manuscript, Gaiti Hasan for sharing reagents. This work was supported by the Damon Runyon Cancer Research Foundation (L.H) and a grant from the NIH (R21DA039582). N.P. is an investigator of the Howard Hughes Medical Institute.
Footnotes
CONTRIBUTIONS
J.H. and L.H. performed the initial Gal4 expression screen in fly gut. L. H. and N. P. designed the experiments. L.H. performed the Piezo-related experiments and analyzed the data. G.S. and A. S. designed and fabricated the microfluidic chip and together with L. H. optimized the experimental conditions. L. H. and N. P. wrote the manuscript with input from all of the authors.
COMPETING FINANCIAL INTERESTS
The authors declare no competing financial interests.
REFERENCES.
- 1.Vining KH & Mooney DJ Mechanical forces direct stem cell behaviour in development and regeneration. Nature reviews. Molecular cell biology 18, 728–742, doi: 10.1038/nrm.2017.108 (2017). [DOI] [PMC free article] [PubMed] [Google Scholar]
- 2.Micchelli CA & Perrimon N Evidence that stem cells reside in the adult Drosophila midgut epithelium. Nature 439, 475–479, doi: 10.1038/nature04371 (2006). [DOI] [PubMed] [Google Scholar]
- 3.Ohlstein B & Spradling A The adult Drosophila posterior midgut is maintained by pluripotent stem cells. Nature 439, 470–474, doi: 10.1038/nature04333 (2006). [DOI] [PubMed] [Google Scholar]
- 4.Li H & Jasper H Gastrointestinal stem cells in health and disease: from flies to humans. Disease models & mechanisms 9, 487–499, doi: 10.1242/dmm.024232 (2016). [DOI] [PMC free article] [PubMed] [Google Scholar]
- 5.Lemaitre B & Miguel-Aliaga I The digestive tract of Drosophila melanogaster. Annual review of genetics 47, 377–404, doi: 10.1146/annurev-genet-111212-133343 (2013). [DOI] [PubMed] [Google Scholar]
- 6.Kim SE, Coste B, Chadha A, Cook B & Patapoutian A The role of Drosophila Piezo in mechanical nociception. Nature 483, 209–212, doi: 10.1038/nature10801 (2012). [DOI] [PMC free article] [PubMed] [Google Scholar]
- 7.Coste B et al. Piezo proteins are pore-forming subunits of mechanically activated channels. Nature 483, 176–181, doi: 10.1038/nature10812 (2012). [DOI] [PMC free article] [PubMed] [Google Scholar]
- 8.Coste B et al. Piezo1 and Piezo2 are essential components of distinct mechanically activated cation channels. Science 330, 55–60, doi: 10.1126/science.1193270 (2010). [DOI] [PMC free article] [PubMed] [Google Scholar]
- 9.Volkers L, Mechioukhi Y & Coste B Piezo channels: from structure to function. Pflugers Archiv : European journal of physiology 467, 95–99, doi: 10.1007/s00424-014-1578-z (2015). [DOI] [PubMed] [Google Scholar]
- 10.Suslak TJ et al. Piezo Is Essential for Amiloride-Sensitive Stretch-Activated Mechanotransduction in Larval Drosophila Dorsal Bipolar Dendritic Sensory Neurons. PloS one 10, e0130969, doi: 10.1371/journal.pone.0130969 (2015). [DOI] [PMC free article] [PubMed] [Google Scholar]
- 11.Buchon N et al. Morphological and molecular characterization of adult midgut compartmentalization in Drosophila. Cell reports 3, 1725–1738, doi: 10.1016/j.celrep.2013.04.001 (2013). [DOI] [PubMed] [Google Scholar]
- 12.Evans CJ et al. G-TRACE: rapid Gal4-based cell lineage analysis in Drosophila. Nature methods 6, 603–605, doi: 10.1038/nmeth.1356 (2009). [DOI] [PMC free article] [PubMed] [Google Scholar]
- 13.Amcheslavsky A, Jiang J & Ip YT Tissue damage-induced intestinal stem cell division in Drosophila. Cell stem cell 4, 49–61, doi: 10.1016/j.stem.2008.10.016 (2009). [DOI] [PMC free article] [PubMed] [Google Scholar]
- 14.Ohlstein B & Spradling A Multipotent Drosophila intestinal stem cells specify daughter cell fates by differential notch signaling. Science 315, 988–992, doi: 10.1126/science.1136606 (2007). [DOI] [PubMed] [Google Scholar]
- 15.Choi NH, Kim JG, Yang DJ, Kim YS & Yoo MA Age-related changes in Drosophila midgut are associated with PVF2, a PDGF/VEGF-like growth factor. Aging cell 7, 318–334, doi: 10.1111/j.1474-9726.2008.00380.x (2008). [DOI] [PMC free article] [PubMed] [Google Scholar]
- 16.Cinar E et al. Piezo1 regulates mechanotransductive release of ATP from human RBCs. Proceedings of the National Academy of Sciences of the United States of America 112, 11783–11788, doi: 10.1073/pnas.1507309112 (2015). [DOI] [PMC free article] [PubMed] [Google Scholar]
- 17.Pathak MM et al. Stretch-activated ion channel Piezo1 directs lineage choice in human neural stem cells. Proceedings of the National Academy of Sciences of the United States of America 111, 16148–16153, doi: 10.1073/pnas.1409802111 (2014). [DOI] [PMC free article] [PubMed] [Google Scholar]
- 18.Li J et al. Piezo1 integration of vascular architecture with physiological force. Nature 515, 279–282, doi: 10.1038/nature13701 (2014). [DOI] [PMC free article] [PubMed] [Google Scholar]
- 19.Gudipaty SA et al. Mechanical stretch triggers rapid epithelial cell division through Piezo1. Nature 543, 118–121, doi: 10.1038/nature21407 (2017). [DOI] [PMC free article] [PubMed] [Google Scholar]
- 20.Deng H, Gerencser AA & Jasper H Signal integration by Ca(2+) regulates intestinal stem-cell activity. Nature 528, 212–217, doi: 10.1038/nature16170 (2015). [DOI] [PMC free article] [PubMed] [Google Scholar]
- 21.Guo Z & Ohlstein B Stem cell regulation. Bidirectional Notch signaling regulates Drosophila intestinal stem cell multipotency. Science 350, doi: 10.1126/science.aab0988 (2015). [DOI] [PMC free article] [PubMed] [Google Scholar]
- 22.Salle J et al. Intrinsic regulation of enteroendocrine fate by Numb. The EMBO journal, doi: 10.15252/embj.201695622 (2017). [DOI] [PMC free article] [PubMed] [Google Scholar]
- 23.De Ford C et al. The clerodane diterpene casearin J induces apoptosis of T-ALL cells through SERCA inhibition, oxidative stress, and interference with Notch1 signaling. Cell death & disease 7, e2070, doi: 10.1038/cddis.2015.413 (2016). [DOI] [PMC free article] [PubMed] [Google Scholar]
- 24.Roti G et al. Complementary genomic screens identify SERCA as a therapeutic target in NOTCH1 mutated cancer. Cancer cell 23, 390–405, doi: 10.1016/j.ccr.2013.01.015 (2013). [DOI] [PMC free article] [PubMed] [Google Scholar]
- 25.Amcheslavsky A et al. Enteroendocrine cells support intestinal stem-cell-mediated homeostasis in Drosophila. Cell reports 9, 32–39, doi: 10.1016/j.celrep.2014.08.052 (2014). [DOI] [PMC free article] [PubMed] [Google Scholar]
- 26.Harrison E, Lal S & McLaughlin JT Enteroendocrine cells in gastrointestinal pathophysiology. Current opinion in pharmacology 13, 941–945, doi: 10.1016/j.coph.2013.09.012 (2013). [DOI] [PubMed] [Google Scholar]
- 27.Micchelli CA, Sudmeier L, Perrimon N, Tang S & Beehler-Evans R Identification of adult midgut precursors in Drosophila. Gene expression patterns : GEP 11, 12–21, doi: 10.1016/j.gep.2010.08.005 (2011). [DOI] [PubMed] [Google Scholar]
- 28.Wang C, Guo X, Dou K, Chen H & Xi R Ttk69 acts as a master repressor of enteroendocrine cell specification in Drosophila intestinal stem cell lineages. Development 142, 3321–3331, doi: 10.1242/dev.123208 (2015). [DOI] [PubMed] [Google Scholar]
- 29.Xu C, Luo J, He L, Montell C & Perrimon N Oxidative stress induces stem cell proliferation via TRPA1/RyR-mediated Ca2+ signaling in the Drosophila midgut. eLife 6, doi: 10.7554/eLife.22441 (2017). [DOI] [PMC free article] [PubMed] [Google Scholar]
- 30.Zeng X, Chauhan C & Hou SX Characterization of midgut stem cell- and enteroblast-specific Gal4 lines in drosophila. Genesis 48, 607–611, doi: 10.1002/dvg.20661 (2010). [DOI] [PMC free article] [PubMed] [Google Scholar]
- 31.Lee T & Luo L Mosaic analysis with a repressible cell marker (MARCM) for Drosophila neural development. Trends in neurosciences 24, 251–254 (2001). [DOI] [PubMed] [Google Scholar]
- 32.Karpowicz P, Perez J & Perrimon N The Hippo tumor suppressor pathway regulates intestinal stem cell regeneration. Development 137, 4135–4145, doi: 10.1242/dev.060483 (2010). [DOI] [PMC free article] [PubMed] [Google Scholar]
- 33.Veenstra JA, Agricola HJ & Sellami A Regulatory peptides in fruit fly midgut. Cell and tissue research 334, 499–516, doi: 10.1007/s00441-008-0708-3 (2008). [DOI] [PubMed] [Google Scholar]
- 34.Housden BE et al. Identification of potential drug targets for tuberous sclerosis complex by synthetic screens combining CRISPR-based knockouts with RNAi. Science signaling 8, rs9, doi: 10.1126/scisignal.aab3729 (2015). [DOI] [PMC free article] [PubMed] [Google Scholar]
- 35.Housden BE, Hu Y & Perrimon N Design and Generation of Drosophila Single Guide RNA Expression Constructs. Cold Spring Harbor protocols 2016, pdb prot090779, doi: 10.1101/pdb.prot090779 (2016). [DOI] [PubMed] [Google Scholar]
- 36.Housden BE, Lin S & Perrimon N Cas9-based genome editing in Drosophila. Methods in enzymology 546, 415–439, doi: 10.1016/B978-0-12-801185-0.00019-2 (2014). [DOI] [PubMed] [Google Scholar]
- 37.Ren X et al. Optimized gene editing technology for Drosophila melanogaster using germ line-specific Cas9. Proceedings of the National Academy of Sciences of the United States of America 110, 19012–19017, doi: 10.1073/pnas.1318481110 (2013). [DOI] [PMC free article] [PubMed] [Google Scholar]
- 38.Klapoetke NC et al. Independent optical excitation of distinct neural populations. Nature methods 11, 338–346, doi: 10.1038/nmeth.2836 (2014). [DOI] [PMC free article] [PubMed] [Google Scholar]
- 39.Zhao Y et al. An expanded palette of genetically encoded Ca(2)(+) indicators. Science 333, 1888–1891, doi: 10.1126/science.1208592 (2011). [DOI] [PMC free article] [PubMed] [Google Scholar]
- 40.Dai W & Montell DJ Live Imaging of Border Cell Migration in Drosophila. Methods in molecular biology 1407, 153–168, doi: 10.1007/978-1-4939-3480-5_12 (2016). [DOI] [PMC free article] [PubMed] [Google Scholar]
- 41.Wen Q et al. Proprioceptive coupling within motor neurons drives C. elegans forward locomotion. Neuron 76, 750–761, doi: 10.1016/j.neuron.2012.08.039 (2012). [DOI] [PMC free article] [PubMed] [Google Scholar]
- 42.McDonald JC et al. Fabrication of microfluidic systems in poly(dimethylsiloxane). Electrophoresis 21, 27–40 (2000). [DOI] [PubMed] [Google Scholar]
- 43.Chen TW et al. Ultrasensitive fluorescent proteins for imaging neuronal activity. Nature 499, 295–300, doi: 10.1038/nature12354 (2013). [DOI] [PMC free article] [PubMed] [Google Scholar]
Associated Data
This section collects any data citations, data availability statements, or supplementary materials included in this article.
Supplementary Materials
Data Availability Statement
All relevant data have been included in the paper and the supplementary files. Original quantifications of different cell numbers were listed in the Supplementary Dataset file. Complete genotypes information is provided in Supplementary Table 1. Original data that support the findings of this study are available from the corresponding author upon request.


