


Abstract
CRISPR/Cas9 is a promising tool in prokaryotic genome engineering, but its success is limited by the widely varying on-target activity of single guide RNAs (sgRNAs). Based on the association of CRISPR/Cas9-induced DNA cleavage with cellular lethality, we systematically profiled sgRNA activity by co-expressing a genome-scale library (∼70 000 sgRNAs) with Cas9 or its specificity-improved mutant in Escherichia coli. Based on this large-scale dataset, we constructed a comprehensive and high-density sgRNA activity map, which enables selecting highly active sgRNAs for any locus across the genome in this model organism. We also identified ‘resistant’ genomic loci with respect to CRISPR/Cas9 activity, notwithstanding the highly accessible DNA in bacterial cells. Moreover, we found that previous sgRNA activity prediction models that were trained on mammalian cell datasets were inadequate when coping with our results, highlighting the key limitations and biases of previous models. We hence developed an integrated algorithm to accurately predict highly effective sgRNAs, aiming to facilitate CRISPR/Cas9-based genome engineering, screenings and antimicrobials design in bacteria. We also isolated the important sgRNA features that contribute to DNA cleavage and characterized their key differences among wild type Cas9 and its mutant, shedding light on the biophysical mechanisms of the CRISPR/Cas9 system.
INTRODUCTION
Efficient and reliable genome editing tools play crucial roles in genome engineering of prokaryotic hosts (1–8). The recently reported CRISPR/Cas9 system exhibits several advantages as a novel genome editing tool (9,10). The system consists of a nuclease activity—carrying Cas9 protein and specificity-programming single guide RNA (sgRNA), the latter of which targets the complex to a genomic region flanked by a 3′NGG protospacer adjacent motif (PAM) via Watson–Crick base pairing (11). It works by introducing a double-strand break (DSB) in the chromosome, which is lethal to many prokaryotic hosts. The DSB then serves as a selection pressure to enrich for mutations introduced via homologous recombination with the artificial donor DNA. This method is broadly applicable to many prokaryotic organisms (10,12–15), especially archaea (16). It also enables multiplex genome editing in a marker-free manner (17,18), saving substantial time and labor during genome engineering. Lastly, only ∼20 nucleotides in sgRNA encode the target of CRISPR/Cas system, compatible with massively parallel microarray oligonucleotide synthesis and next generation sequencing (NGS), both of which simplify the procedure for performing large-scale engineering or functional genomics studies (8,19,20).
The success of the CRISPR/Cas9 system for genome engineering of prokaryotic hosts is largely based on the activity of the selected sgRNA, or namely the cellular lethality caused by CRISPR/Cas9 as guided via a particular sgRNA to target the locus of interest. Poor sgRNA activities result in a high rate of false positives during genome editing, which results in the survival of many wild-type cells within the population. Conventional belief holds that DNA in prokaryotic cells is less protected than that in eukaryotic cells because of the lack of complex chromatin structures (21), and thus genome editing systems should typically work well in prokaryotic organisms. Studies, however, have suggested otherwise the existence of inactive sgRNAs during genome editing in bacterial cells (8,13,22,23). This problem is especially prevalent when CRISPR/Cas9 genome editing is used in a multiplex manner, a major proposed advantage of this system, as the percentage of successfully modified cells decreases exponentially when sgRNA activity is not optimized (17). Potential problem derived from poorly active sgRNAs is also of concern when CRISPR/Cas9 recombination based pooled screening is used within microbial functional genomics studies. The variablity of sgRNA activities may lead to different recombination efficiencies across the targeted loci and thus introduce noise in the downstream genotype–phenotype association to identify the mutations responsible for the phenotype under investigation (8). Better understanding of sgRNA on-target activity will facilitate better sgRNA library design in such studies to improve the performance of pooled screenings, as recently shown in similar works performed in mammalian cell lines (24,25). Lastly, comprehensive understanding of sgRNA activity to determine the ability of CRISPR/Cas9 to kill bacterial cells can facilitate better design of new antimicrobials using CRISPR technology (26,27).
Despite our lack of knowledge about the mechanisms responsible for sgRNAs with poor activity and their impact on the successful application of CRISPR/Cas9 genome editing in prokaryotic hosts, to the best of our knowledge, no investigation has yet been performed to systematically address this issue. By contrast, several recent pioneering studies have described the sgRNA sequence-activity relationship and resulted in corresponding prediction algorithms based on experimentally produced large datasets from mammalian cell lines (24,28–32). It is, however, worth noting that key differences exist between eukaryotic and prokaryotic hosts for CRISPR/Cas9-based genome editing. Crucially, mammalian cells have a highly active non-homologous end-joining (NHEJ) pathway (33), which plays fundamental roles in CRISPR/Cas9-induced DSB repair via an error-prone manner (20), rendering the reported dataset of eukaryotic sgRNA activity (24,29,30) a hybrid output that combines the inherent features of the sgRNAs with the known NHEJ preference for different DSB substrates (34). In addition, the complex chromatin structure that is unique to eukaryotic chromosomes, specifically, the blocking effect of nucleosome is paramount to reshape the sgRNA activity landscape (25,29). It is thus reasonable to be skeptical of the general applicability of the established conclusions from studies in eukaryotic cells to prokaryotic organisms, in which the NHEJ molecular machinery is only moderately active or is entirely absent (15,16,23,35) and chromosomal DNA is much more accessible (21,36). Meanwhile, in bacterial cells, sgRNA activity can be directly related to cellular survival via the lethality that results from CRISPR/Cas9-induced DSBs with minimal perturbation from chromatin structure or DNA repair. This advantage makes it possible to prepare a large-scale, unbiased sgRNA activity dataset by designing a sgRNA library targeting every gene in the genome in bacteria, without the need to select a batch of genes with common functions, by which the bias or noise may be introduced, as has been done in mammalian cell line screening (24,28–32). We believe that such advantages will not only facilitate deciphering of the genome-scale sgRNA activity landscape in bacteria, but also provide more general insights into the sgRNA sequence-activity relationship based on larger and better (i.e. unbiased and with an improved signal-to-noise ratio) datasets.
In this paper, we describe a genome-wide sgRNA library consisting of roughly 70,000 members, covering both gene-coding and intergenic regions, which is comparable to ∼10% of all possible sgRNA candidates (N20NGG) in the E. coli genome. With this library, we used a pooled screening strategy to characterize genome-wide sgRNA activity in E. coli by associating CRISPR/Cas9-induced DNA cleavage with cellular lethality. We observed significant sgRNA activity diversity within individual genes and across different genomic loci and thus constructed a comprehensive sgRNA activity map as a guideline for better usage of CRISPR/Cas9 genome editing tool in E. coli. Moreover, we found a very low correlation between our dataset and the current sgRNA activity prediction models trained from eukaryotic datasets. We therefore developed improved algorithms for sgRNA activity prediction, allowing the prediction of highly active sgRNAs in E. coli or, potentially, in other prokaryotic organisms. Importantly, this new model identified determinants in the sgRNA sequence for activity prediction and highlighted several key differences between wild type Cas9 and its off-target-reducing mutant.
MATERIALS AND METHODS
Cell growth conditions and strain construction
In all experiments, bacteria were grown in LB medium or on LB agar plates. Cells were grown at 37°C. Antibiotic concentrations for kanamycin and ampicillin were 50 and 100 mg/L, respectively. Molecular cloning was performed with E. coli DH10B as the host. Escherichia coli K12 MG1655 was obtained from the ATCC (700926). The host strains used in the screening experiments were MCm and MCm ΔrecA. MCm (37) was constructed by integrating a chloramphenicol expression cassette cloned from pKM154 (Addgene plasmid #13036) into the smf locus of wild-type E. coli K12 MG1655. MCm ΔrecA was constructed by deleting the coding region of recA in MCm via CRISPR/Cas9 based recombineering method (17).
Plasmid construction
The knockout of recA blocks DSB repair and hence boosts the lethality of the CRISPR/Cas9 system. Therefore, we chose J23113 (an Anderson promoter with weak activity) for Cas9 expression (pCas9-J23113) in host cells with the ΔrecA genetic background (Table 1). For other cases, the medium-strength promoter J23109 was used to drive the expression of Cas9 or its derivative. To construct these plasmids, pdCas9-J23109 and pdCas9-J23113, previously described by our group (37), were used as PCR templates to prepare a series of vector backbone with different promoters. The plasmid pCas (17) was used as PCR template to amplify the coding region of Cas9. These fragments were subsequently assembled via Gibson assembly to construct the intact plasmid. All sgRNA expression plasmids individually used in this work were constructed by amplifying pTargetF_lac (37) by PCR to alter the N20 sequence, followed by self-ligation via Gibson assembly. All the strains and plasmids used in this work are summarized in Supplementary Table S1 and oligonucleotides are given in Supplementary Table S2. The maps for p(d)Cas9-J23109, pCas9-J23113, peSp(d)Cas9-J23109 and representative sgRNA expression plasmids are accessible with the following hyperlinks. We are working to deposit these plasmids at Addgene.
Table 1.
Host strain and Cas9/dCas9 expression construct for each screening experiment
| Screening experimenta | Host | Cas9/dCas9 expression vector |
|---|---|---|
| Cas9 (selective) | WTb | pCas9-J23109c |
| Cas9 (ΔrecA) (selective) | ΔrecA | pCas9-J23109 |
| dCas9 (control) | WT | pdCas9-J23109 |
| eSpCas9 (selective) | WT | peSpCas9-J23113c |
| eSpdCas9 (control) | WT | peSpdCas9-J23113 |
aScreening experiment dCas9 is the negative control for Cas9 and Cas9 (ΔrecA); eSpdCas9 is the negative control for eSpCas9.
bWT: E. coli strain MCm (E. coli K12 MG1655 smf::cat, see online Methods).
cJ23109 is a moderate-strength promoter, and J23113 is of weak strength.
pCas9-J23109: https://benchling.com/s/seq-ZaTCr0hFE3U857KlIBsu
pdCas9-J23109: https://benchling.com/s/seq-Pk7e92yTr0 × 1mE9yXDeK
pCas9-J23113: https://benchling.com/s/seq-23eYuaRcup6g6Ml9Dcq6
peSpCas9-J23109: https://benchling.com/s/seq-NT6ly7Ilw3TQ2fpStQjY
peSpdCas9-J23109: https://benchling.com/s/seq-sXSqOWW8RTY5lH0yRDek
pTargetF_lac: https://benchling.com/s/seq-JamZWMMBAqBXhkOhuc06
Transformation assay
Cells expressing Cas9 or dCas9 were cultured overnight in LB (with kanamycin) as a seed culture followed by preparation of competent cells. Briefly, the cells were collected after growth to exponential phase (OD600 ≈ 0.6) by centrifugation at 8000 × g for 5 min at 4°C, washed five times in ice-cold sterile water with the same condition and resuspended in 15% (v/v) glycerol (at one-sixteenth the volume of the original culture). All these operations were performed on ice. Plasmids carrying the sgRNA expression cassette (pTargetF_lac) were transformed by electroporation into the prepared competent cells expressing Cas9 or dCas9 (50 ng plasmid/100 μl competent cells). The electroporation was performed via a BTX Harvard apparatus ECM 630 High Throughput Electroporation System using an optimized parameter setting (2.1 kV, 1 kΩ, 25 μF). The transformed cells were incubated in LB medium (four times the volume of the competent cells) for 1 h at 37°C for recovery. We streaked the resulting culture onto the LB agar plates (with kanamycin and ampicillin) automated by EasySpiral Pro (Interscience). The colonies were counted after overnight cultivation. The survival ratio for each sgRNA was calculated by comparing the colony-forming units (CFU) of Cas9-expressing cells with the CFU of dCas9-expressing cells. This ratio was further normalized by determining the colony number after transformation with a negative control sgRNA plasmid to minimize the impact of differences in electroporation efficiency that were due to competent cell preparation (Eq. 1).
 |
(1) |
CRISPR/Cas9 assisted recombination to delete genes
For CRISPR-Cas9 based homologous recombineering, pCas9 (17) was transformed into E. coli K12 MG1655 for expressing Cas9 and λ-Red proteins. Six sgRNAs targeting three genes (ansP-293/1277, artP-306/506 and sdaA-41/51) were chosen for gene knockout and constructed into plasmid backbone pTargetF_lac. Taking genomic DNA of the host strain as template, ∼500 base pair fragments flanking the knockout locus were amplified and followed by overlap PCR to prepare recombination donor. The sgRNA expressing plasmid along with recombination donor were transformed into E. coli K12 MG1655/pCas competent cells as described by (17) via electroporation. The transformed cells were incubated in LB medium (four times the volume of the competent cells) for 1 h at 30°C for recovery. The resulted culture was spread onto LB agar plates (with kanamycin and ampicillin) and incubated at 30°C overnight. Ten colonies of each transformation were picked. Primers flanking the knockout locus were used for PCR amplification and the PCR product was analyzed by gel electrophoresis to evaluate the efficiency of recombination. In our experience, due to (i) the killing efficiency of CRISPR/Cas9 is not 100% as shown in this work with different sgRNAs and (ii) a very thin layer of untransformed cells generally present all over the plate beneath the obtained colonies (due to the degradation of ampicillin by transformed cells), each individual colony is a mixture of wild type and mutant with desired editing. This is reflected by two relevant bands of colony PCR products. We hence used gel-scanning software to quantify the ratio of mutant cells in each individual colony.
Design and preparation of the sgRNA libraries
The sgRNA library used in this work (Data S1) can be divided into two parts. The first part is an sgRNA library covering all protein- and ncRNA-coding genes in E. coli genome (Data S1, CRISPRi entry, 55 671 members), which is recently designed by our group, working together with dCas9 for gene repression, to perform genome-wide functional genomics analysis in a pooled format (37). Another part is firstly reported in this work covering all promoter and RBS regions of the E. coli genome. For the promoter sgRNA library, we downloaded the collection of E. coli promoters (8594) from the RegulonDB database (http://regulondb.ccg.unam.mx/menu/download/datasets/files/PromoterSet.txt). Because this dataset contains many promoters with big overlap driving the expression of common gene(s), entries with overlapping regions (overlap > 1 bp) and that shared the same orientations were combined, giving rise to 3,294 promoters. We then used BLASTN (100% identity and coverage) to remove those that cannot be perfectly mapped to the E. coli genome used here (K12 MG1655, NC000913.3), resulting in 3249 promoters. Finally, we checked the downstream gene (the same orientation) and eliminated those promoters that we cannot identify any coding region beyond the downstream 300 bp, leading to the 3146 promoters (Data S2) reported in this work to design sgRNA library. Every potential sgRNA (N20NGG) targeting the two strands of each promoter was checked accordingly until two sgRNAs were extracted or the 3′ end of the promoter sequence was reached. To design the sgRNA library for RBSs throughout the E. coli genome, 4140 RBS sequences (Data S2) for every protein-coding gene (N30 + start codon + N17, N50 in total) were extracted, and a similar procedure was applied as described above to design sgRNA for these regions. The sequences of promoter and RBS sgRNAs are summarized in Data S1, whereas library metrics and entry sequences for these two libraries are shown in Data S2.
During computational library design, we applied the same quality control threshold as previous work (37) to design the sgRNA library targeting the promoter and RBS regions to minimize off-target effect. Briefly, the protospacer region of potential off-target sites detected by the SeqMap software (38) is divided into three different parts based on the distance to the PAM site (8, 5 and 7 nt, from the 5′ end to the 3′ end as Region III, II and I, respectively). The penalty score for mismatch residing in these three regions (I, II and III) are set to be 8, 4.5, 2.5 for NGG PAM and 10, 7, 3 for NAG PAM, because mismatches are generally poorly tolerated at the PAM-proximal seed region (39). The off-target site was considered significant when Σ(penalty × mismatch) < 21, where relevant sgRNAs were eliminated from further processing. We also designed 2,000 negative control sgRNAs with no significant hit site across the E. coli genome according to the same criteria. After library design, the oligomers containing the protospacer region of sgRNA were synthesized on microarray, PCR amplified and constructed as a plasmid library as described in our previous paper (37).
Besides, a tiling sgRNA library with smaller size previously reported partly by our group (37) (see Data S3 for full list) was also used in this work. We will be sharing these two sgRNA libraries through Addgene as soon as possible.
Screening experiments
For sgRNA activity screening experiments, the single colony–derived overnight seed cultures of host strains (MCm/pCas9-J23109, MCm/peSpCas9-J23109, MCm ΔrecA/pCas9-J23113, MCm/pdCas9-J23109 and MCm/peSpdCas9-J23109) were used to prepare competent cells as described above (transformation assay). We then mixed the library plasmids with the prepared competent cells (50 ng plasmid/100 μl competent cells) and divided the mixture into 100-μl aliquots, which were loaded into 25-well electroporation plates. The electroporation was carried out as described above using a BTX Harvard apparatus ECM 630 High Throughput Electroporation System. We typically obtained about 105 colonies per well with this protocol. Two biological replicates were performed for each host strain by independent transformations. To achieve a proper coverage for the sgRNA library, we transformed 50 wells of cells for each replicate, yielding totally 10 working samples for the five host cell types two replicates each (MCm/pCas9-J23109, MCm/peSpCas9-J23109, MCm ΔrecA/pCas9-J23113, MCm/pdCas9-J23109 and MCm/peSpdCas9-J23109). For each host, a negative control sgRNA plasmid library was also transformed using three wells of cells, which were pooled into a single independent sample, yielding five negative control libraries.
The transformed cells were incubated in LB broth (four times the volume of the competent cells) for 1 h at 37°C for recovery. We then took a 50-μl aliquot from each culture solution, which was diluted and streaked onto LB agar plates (with kanamycin and ampicillin). After overnight incubation at 37°C, we counted the colonies and calculated the transformation efficiency. We confirmed that each biological replicate guaranteed at least 20-fold coverage (Supplementary Table S3). It is noted that the relevant metrics determined in dCas9 control group as well as negative control sgRNA library was used to evaluate the transformation efficiency for Cas9 group transformed with gene-targeting sgRNA library, because the DSB lethality caused by Cas9 made the direct calculation of transformation efficiency impossible. After recovery, we inoculated the rest of each sample (replicate) into 100 ml LB broth (with kanamycin and ampicillin) in a 500-ml flask and cultivated these cells at 37°C until an OD600 of ∼2.0. We then took 10 ml of each resulting culture to extract plasmids using the plasmid mini kit from Omega Bio-Tek for NGS library preparation.
NGS library preparation and sequencing
The purified plasmids were used as templates for PCR to amplify the N20 region of the genome-wide library sgRNAs (50 μl × 4 reactions per library; 50 ng template per reaction; PF/R_pTargetLacNGS_PE150 primers; KAPA HiFi HotStart polymerase (KAPA Biosystems); 95°C 3 min, 20 cycles [98°C, 20 s; 67.5°C, 15 s; 72°C, 30 s], 72°C for 1 min). PCR conditions for tiling library is 50 μl × 4 reactions per library, 50 ng template per reaction, PF/R_pTargetLacNGS_SE50, Q5 polymerase, (NEB), 98°C 30 s, 17 cycles [98°C 10 s, 53°C 30 s, 72°C 10 s], 72°C 1 min. The sequencing library was prepared following the manufacturer's protocol (TruSeq DNA Nano Library Prep Kit for Illumina). Sequencing for the genome-wide sgRNA library was carried out using a 2 × 150 paired-end configuration and ∼30 million reads were collected for each library with targeting sgRNAs and 3 million reads for negative control sgRNA libraries (Supplementary Table S4). Illumina NextSeq 500 by the SE50 technique was applied for tiling sgRNA library sequencing.
NGS data processing
Raw NGS data from each library were first combined with the relevant negative control library, resulting in 10 raw datasets (two replicates for each of the five conditions, Cas9, eSpCas9, Cas9 (ΔrecA), dCas9 and eSpdCas9). After production of clean data by de-multiplexing and removing adaptor regions, pairs of paired-end data were merged by FLASH script (40) and those reads without detected pairs were removed. Python scripts generated in house were then used to search for the ‘GCACN20GTTT’ 28-mer in the sequencing reads (and the reverse complementary sequence), and those carrying mutations within the upstream (GCAC) or downstream (GTTT) flanking regions (4 bp each) were removed. We then mapped the extracted N20 sequences back to the in silico sgRNA library, via which the read count of each sgRNA in each library was determined. The mapping ratio of sequencing reads back to the in silico library (Supplementary Table S5) for the control group was generally higher than those for selective groups, indicating the existence of selection pressure (DSB induced cell lethality) in selective groups to eliminate many sgRNAs with strong activities. For example, Cas9 (ΔrecA) group was finally dominated by sgRNAs with synthetic errors (Supplementary Table S5, ∼25% mapping ratio) hence blocking CRISPR/Cas9 activity in this subpopulation. We suspected that this subpopulation is derived from the inherent error rate (∼1%) in DNA oligomer synthesis, which is amplified by the selection conditions applied here. We subsequently adjusted the read counts using (Eq. 2) (n = number of sequencing libraries) to normalize the different sequencing depths of each library. Finally, sgRNAs with <20 read counts in the plasmid library were removed to increase statistical robustness. Subsequently, the read counts for each sgRNA in the two biological replicates were averaged as the geometric mean.
 |
(2) |
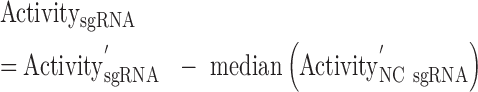
For each condition (Cas9, eSpCas9 and Cas9 (ΔrecA)), the activity of each sgRNA was calculated via Eqs. (3) (raw activity score) and (4) (normalized by negative control sgRNA). Those sgRNAs with <20 reads in the control condition (dCas9 and eSpdCas9) were eliminated from the following analysis.
 |
(3) |
 |
(4) |
To calculate the Z score of each individual sgRNA, we fit the activities of all negative control sgRNAs with a normal distribution, giving rise to a value for the standard deviation (σ). The Z score for each sgRNA was then calculated with (Eq. 5).
 |
(5) |
Subsequently we measured the average activity for each gene and the statistical significance in contrast to the negative control sgRNAs, to identify the genomic loci with resistance to CRISPR/Cas9-induced DSBs. Based on the activities of the sgRNAs belonging to an individual gene (including sgRNAs targeting the relevant RBS), we calculated the average based on the median of sgRNA activities and the statistical significance (false positive rate, FPR) via a quasi gene simulation approach (37). It should be noted that that most of the genes across the genome exhibited notable DNA cleavage activities. Hence the classical Storey-Tibshirani approach (41) for genome-wide research was not suitable here to convert the FPR value into the false discovery rate. We therefore directly used FPR values as signals to identify those resistant regions.
Detection limit of this method
Generally, the read count for one sgRNA was from 100 (∼26.7) to 1000 (∼210) sequencing reads. This sequencing depth determined the detection limit, the lowest activity score (strongest activity) that can be defined in this assay. For example, an sgRNA together with the Cas9 nuclease (selective condition) causing no doubling of the cell led to the absence (<1 read count) of this sgRNA in the sequencing data. Hence, We reasoned that the detection limit of our method for sgRNA dropout screenings is approximately around from –7 to –10, depending on the abundance of relevant sgRNA in the initial plasmid solution for electroporation. This hypothesis was consistent with the data presented (the best sgRNA gave rise to activity ∼–10). We can improve this resolution by increasing the sequencing capacity applied to each NGS library (currently 30 million reads per library). We proposed that the detection limit issue stated here was basically responsible to the poor resolution (high noise) of sgRNA activity data in Cas9 (ΔrecA) group, because the highest selection pressure in this experiment (Supplementary Table S5) resulted in the most significant sgRNA dropout.
Comparison with established models
Using the sgRNA activity datasets obtained in this work, we evaluated the performance of three previously reported activity prediction models trained based on the data from screening experiments in mammalian cell lines (Doench et al. (24); Farasat et al. (31); Xu et al. (32)). The scripts for the three sequence-activity models were downloaded (Doench et al.) or kindly provided by the relevant authors (Farasat et al. and Xu et al.), and the following commands were used to calculate an activity score for each sgRNA.
bin/SSC -l 20 -m matrix/human_mouse_CRISPR_KO_30bp.matrix -i N20NGGN7 -o output
python rs2_score_calculator_v1.2.py –seq N4N20NGGN3
python Cas9_Calculator.py crRNAseq(N20) PAM(GGN) target(N20NGGN) (quickmode = False, cModelName = ‘All_dataModel.mat’)
The predicted activity score for each sgRNA was compared with the experimentally determined activity value, and the Spearman correlation coefficients were calculated for each model. The high-quality sgRNA activity datasets (see below) were used here for model performance comparison rather than the full list of sgRNAs described above.
Machine learning
Dataset preparation
We first carried out a filtering step to create high-quality datasets for the subsequent machine learning. We removed sgRNAs with multiple targets in the E. coli genome (∼200 sgRNAs). Only sgRNAs targeting genes with significant cleavage activities were then kept (FPR ≤ 0.01, number of sgRNAs ≥ 5). It is noted that sgRNAs that targeted a RBS were grouped with their relevant genes, and, based on these criteria, all sgRNAs targeting promoters were removed. This filtering minimized the impact of resistant genomic loci on the quality of the dataset. The activity score for each sgRNA was calculated with (Eq. 6), which enabled sgRNAs with better activities to have higher scores and all scores to be above or equal to zero. We thus prepared three high-quality datasets (Cas9, eSpCas9 and Cas9 (ΔrecA); Data S4, sequence plus score) that were used in the following work.
 |
(6) |
Featurization
We followed a featurization protocol for encoding the sgRNA sequences mainly as described by Doench et al. (24). Briefly, we used binary variables (0 or 1) to encode position-dependent base (pair) features. For example, position 1 of the 20-mer can be four different bases (A/C/T/G), each of which is encoded by four binary variables, one for each possible nucleotide. These are denoted as ‘order_1_Px’ (‘x’ denotes the position, 1–20) features, corresponding to the single base of each position. For ‘order_2_Px’ (‘x’ denotes the position, in this case 1–19) features, we looked at all adjacent dinucleotides as features, such as AA/AT/AC/AG/etc. There are 4 × 4 = 16 such base pairs, hence 16 binary variables can be used to encode one such pair at one particular position in a 20-mer. We also included position-independent features encoded by real number variables. For instance, ‘order_1_IP’ features simply mean how many A’s, etc, were in the sgRNA (20-mer), ignoring their position, as does ‘order_2_IP’. Therefore, for a 20-mer sgRNA, we obtained 80 ‘order_1_Px’, 304 (19 × 16) ‘order_2_Px’ position-specific features, 4 ‘order_1_IP’ and 16 ‘order_2_IP’ position-independent features. The two nucleotides relative to the PAM (NGGN) were also encoded, yielding 16 features, one for each NN possibility. The GC content (0–1, encoded as a real number) was computed as an additional feature. Thermodynamic features were determined via the melting temperatures of the DNA-RNA duplex using the Biopython (version 1.66) Tm_staluc function (DNA duplex version). In addition to the melting temperature of the entire 20-mer target site (‘T20’), we also included three features corresponding to the melting temperatures of three different parts of the sgRNA—the five nucleotides immediately proximal to the PAM (‘T5’), the eight nucleotides adjacent to 5′ of T5 (‘T8’), and then the seven nucleotides at the 5′ end of the 20-mer (‘T7’). We hence extracted 425 features to encode one sgRNA. These features and the sgRNA score described above were used in the subsequent machine learning.
Data processing for activity prediction
We first normalized the score for each sgRNA by a within-gene ranking (24) or based on the three strongest sgRNAs belonging to the gene (25). However, simple linear regression suggested there was no advantage to use these two normalized scores in contrast to the original one (Supplementary Figure S1). This confirmed that our sgRNA activity screening strategy was relatively more unbiased, as compared with previous methods that associated sgRNA activities with loss-of-function phenotypes (24,30), which makes the sgRNA activities across genes not comparable without normalization due to the differences in phenotypic effects of gene inactivation. To minimize the loss of information during data processing, we used the raw activity scores described above (Eq. 6) in the following work.
We used five statistical models in our experiments: (i) linear regression, (ii) L1-regularized linear regression (Lasso), (iii) L2-regularized linear regression (Ridge), (iv) gradient boosting regression tree and (v) multiple-layer perceptron. We used the scikit-learn package (0.19.0) in Python to implement each of these models. The training dataset (80% of all raw data) was used for a parameter search to optimize the performance of the models by five fold cross-validation. To optimize the regularization parameter in (ii) and (iii), we searched 11 points that were evenly spaced in log space, with a minimum of 10−5 and a maximum of 105. For the gradient boosting regression tree method, we optimized the parameters following the given order (min_samples_split, max_depth, min_samples_leaf, max_features, subsample, learning_rate and n_estimators). For multiple-layer perceptron, the regularization parameter (alpha) was first optimized by searching nine points that were evenly spaced in log space, with a minimum of 10−4 and a maximum of 104. Based on the optimized regularization parameter (alpha), the layer topology was further optimized by searching the following combinations ([50], [100], [200], [50, 50], [100, 100], [200, 200], [50, 50, 50], [100, 100, 100], [200, 200, 200]). After model training by 5-fold cross-validation described above using 80% of raw data, the remaining 20% held-out data was used to test the generalization ability of the trained model.
Statistical information, software and figure generation
Genome plots were generated using the Circos software package (42). All statistical analyses and machine learning were carried out using the SciPy (0.19.1), NumPy (1.13.1) and scikit-learn (0.19.0) Python packages. Plots were generated in Python 2.7 using the matplotlib (2.0.2) plotting libraries.
RESULTS
Design of the E. coli genome-wide sgRNA library and screening experiment conditions
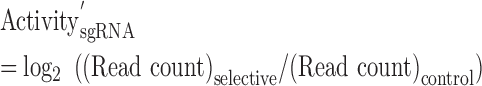
Recently, we reported a CRISPR interference (CRISPRi) approach to perform pooled functional genomics screening in E. coli using a genome-wide sgRNA library consisting of 55 671 members (37). This CRISPRi library covers 98.6% of 4140 protein-coding genes and 79.8% of 178 RNA-coding genes of E. coli genome (at least one sgRNA is designed), and 85.6% of all genes are targeted by at least 10 sgRNAs. In the current study, we repurposed this library for sgRNA activity profiling using wild-type Cas9 with nuclease activity. In addition, because the previous library includes sgRNAs targeting only the coding genome, we also designed a new sgRNA library targeting the promoter of each known operon (3142 processed promoters) and ribosome-binding site (RBS) of every protein-coding gene (4174 RBSs). These two intergenic regions are important for gene expression modulation and have attracted extensive engineering efforts (1,43,44). As the lengths of these intergenic regions are much shorter than the gene-coding regions, we typically designed two sgRNAs for each intergenic entry. Moreover, the sgRNAs were designed to target either of the two DNA strands in this new library, in contrast to the sgRNAs in our previous library, which bind only the nontemplate strand during transcription to maximize the CRISPRi activity. Following these guidelines, the new intergenic sgRNA library contains 10 257 members (5559 in the promoter sub-library and 4698 for RBSs) (Data S1 for in silico intergenic sgRNA library and Data S2 for promoter and RBS entries), covering 95.3% of all promoters (Supplementary Figure S2) and 71.9% of all RBSs (Supplementary Figure S3). Together with our previous CRISPRi library, 65 928 sgRNAs were used in this work to profile their DNA cleavage activities. This synthetic library represents a genome-wide sgRNA collection extensively covering either the gene coding or the intergenic regions of the E. coli genome (∼10% of all sgRNAs across ∼4.6 Mb E. coli genome assuming one sgRNA every 8 bp because of the NGG PAM requirement). Moreover, 2000 sgRNAs without any predicted target across the E. coli genome were designed as an internal control in the screening experiments (Data S5). The sgRNA library was synthesized as oligonucleotides by a DNA microarray, amplified by PCR and cloned into the sgRNA expression plasmid backbone (pTargetF_lac, (37)) via Golden Gate assembly. This plasmid library was used in the following pooled screening experiments to profile sgRNA activity (Figure 1A). A log retention score (effectively the inverse of guide activity) for each member of the library was calculated by quantifying the representation of each sequence with and without Cas9 expression by NGS. A more negative score indicates stronger activity (Figure 1A). As (Eq. 3) in Methods part shows, we define activity of sgRNA as log2((Read count)selective/(Read count)control), which is abbreviated to log2AC (AC, abundance change) and used accordingly across the paper.
Figure 1.

General framework combining experimental and computational approaches to depict a genome-wide sgRNA activity map in this work. (A) Schematic illustration of the workflow for the sgRNA activity screening experiments. The variable regions of a genome-wide sgRNA library are synthesized as oligomers on a microarray. The oligomers are subsequently amplified and cloned into an sgRNA expression vector by Golden Gate assembly. The constructed sgRNA library is transformed into E. coli host cells expressing Cas9 (selective condition) or dCas9 (control condition) protein. After cultivation in LB medium, the extracted sgRNA plasmids are amplified by PCR, and the abundance of each sgRNA is determined by NGS. The sgRNA activity is defined as the log2 change in abundance between the selective (Ai) and control (Ai,NC) conditions. (B) The obtained genome-wide sgRNA activity map can be used directly in sgRNA selection for a genome-editing project in E. coli (the best sgRNA for every gene, promoter and RBS encoded by E. coli genome). (C) A machine learning approach is used to shed light on the sequence–activity relationship (sgRNA activity = f (sgRNA sequence)) of sgRNAs to provide more biophysical insight into CRISPR/Cas9-based genome editing as well as to extend the sgRNA activity prediction capacity to other prokaryotic organisms.
In addition to building a comprehensive map of sgRNA activity in E. coli (Figure 1B), another goal of this work was to gain insight into the fundamental biophysics of the CRISPR/Cas9 system (Figure 1C). The relatively more accessible DNA substrates within bacterial cells with respect to the CRISPR/Cas9 machinery thus provide the opportunity to elucidate the inherent activity of sgRNAs based exclusively on their sequence features as well as target contexts. To this end, we characterized sgRNA activities in three different conditions (Table 1, three selective conditions). Firstly, the most widely adopted Cas9 from Streptococcus pyogenes was used in wild type E. coli strain to profile sgRNA activities. Secondly, we blocked the native DSB repair pathway of E. coli by deleting recA, which encodes a molecular sensor of DSBs and initiator of downstream homologous repair responses (18,23). This pathway is known to play more important roles in DSB repair than NHEJ in bacteria (35). Screenings of sgRNA activities in this condition (Cas9 (ΔrecA)) is thus expected to provide a more stable and unified baseline to dissect the underlying rules of sgRNA activities. A nuclease-dead Cas9 mutant (dCas9), which binds DNA without cleaving it, was used in wild type E. coli as the negative control for the abovementioned two conditions. Moreover, we also included a reengineered Cas9 derivative with improved specificity (K810A, K1003A and R1060A of Cas9) (denoted as eSpCas9) (45) in our screening experiments. For this experiment, the eSpdCas9 (K810A, K1003A and R1060A of the catalytically inactive dCas9) was used as the control condition. Table 1 summarizes the hosts and Cas9 (selective) or dCas9 (control) expression constructs for each screening experiment performed in this work and their roles in subsequent data processing to determine the sgRNA activities.
Quality evaluation of genome-wide sgRNA library activity profiling
To characterize the resolution of our method for differentiating among sgRNAs with diverse activities prior to screening experiments using the genome-wide library, we first applied a synthetic approach to mimic sgRNAs with a gradient of activities by introducing three mismatch point mutations into the N20 region of an sgRNA targeting yneE. According to a previous report (11), mismatches located at the 5′ end of the protospacer region of the DNA target are better tolerated than mismatches at the 3′ end proximal to the PAM (seed region). We accordingly introduced three mutations into different regions of the sgRNA to create a series of sgRNAs with different activities toward the same DNA substrate. In agreement with this previous knowledge, a transformation assay indeed confirmed the loss of activity as more mutations accumulated in the sgRNA N20 region that base-paired with the seed region in DNA protospacer sequence (Figure 2A). More importantly, even one mismatch mutation at the 5′ end of the sgRNA N20 region (yneE-m1) resulted in a 10-fold increase in survival rate with respect to wild type, which can be easily quantified by NGS, indicating that our method enables the discrimination of sgRNAs with only moderate activity differences.
Figure 2.

Reliability validation of screening experiments. (A) Different sgRNA activities are related to the cellular survival rates. Mutations were introduced at different positions in the yneE-WT sgRNA N20 region (yneE-m1, yneE-m2 and yneE-m3). These sgRNA expression plasmids were transformed into the host strains expressing Cas9 and dCas9, and the survival ratios were determined by counting the colony number after overnight cultivation on agar plates. Data represents the mean ± s.d. from n = 2 biological replicates from one experiment. (B) The genome-wide sgRNA activity screenings were consistent between biological replicates. Read count of each sgRNA obtained from NGS was used to compare the agreement between biological replicates (n = 2). (C) The results from sgRNA activity screenings were highly reproducible. One additional sgRNA library (tiling library, 3451 members) was subjected to activity screening using the same protocol. The activity scores of 901 common members between this tiling library and the genome-wide sgRNA library obtained from relevant screening experiments are plotted against each other (R2 = 0.771). (D) The pooled sgRNA activity screening result was confirmed by cloning 15 sgRNAs individually and measuring their activities via transformation assay (colony number counting) (as in (A)). Data represents the mean ± s.d. of biological replicates (n = 2) from one experiment. The validation result was compared with the relative abundance changes of relevant sgRNAs obtained in high-throughput profiling (R2 = 0.840).
In the subsequent screening experiments, we transformed the sgRNA plasmid library into E. coli cells with Cas9 (selective) or dCas9 (control) expression (Table 1). The recovered culture was inoculated into fresh Luria-Bertani (LB) medium and cultivated to the stationary phase (OD600, ∼2.0). All experiments were executed with two biological replicates. Plasmids were extracted for each culture and NGS was applied to profile each library. The consistency between replicates (Figure 2B, R2 > 0.78) and acceptable mapping ratio to the in silico library (Supplementary Table S5) suggested the reliability of these experiments. To further show that the results of screenings can be reproduced in other independent experiments, we turned to a smaller tiling sgRNA library (3451 members targeting 86 genes, Data S3). Using the same protocol as described above, we subjected this tiling library to screening for sgRNA activity with eSpCas9 in wild type E. coli as the selective condition. We extracted 901 sgRNAs in this tiling library, which were also included in our genome-wide sgRNA library. The comparison of activity scores for these sgRNAs between the two experiments carried out independently using different libraries suggested that our method is highly reproducible (Figure 2C, R2 = 0.771). To further validate results from our screenings, we selected an allelic series of sgRNAs based on their activities from the screening experiments and retested each sgRNA individually by transformation assay via colony number counting. The series consisted of 15 sgRNAs, with three sgRNAs targeting each of five genes (ansP-293/647/1277, dppC-43/637/794, mocA-262/294/393, artP-306/506/627, araE-595/714/1205) and with Cas9 as the selective condition in a wild-type E. coli host. The results showed a very good positive correlation between the screening and the validation experiments (Figure 2D, R2 = 0.840). Overall, these results suggested that our pooled screening method to profile sgRNA activity was very reliable and that the high-quality dataset produced accordingly could thus be used for subsequent analyses. The dataset of sgRNA activity scores obtained in this work is summarized in Data S6 (Cas9, eSpCas9 and Cas9 (ΔrecA)). It is worthy noted that we also included sgRNAs targeting essential genes in these datasets and following analysis, because our analysis showed that the activities of these sgRNAs (regarding DNA cleavage) can be still reliably determined by our methods (Supplementary Note 1).
The variability of activities among sgRNAs
We first investigated the distribution of sgRNA activities obtained in the screening experiments (Figure 3A). As expected, we observed remarkable variability of sgRNA activity for each of the three categories of conditions studied here, covering around three orders of magnitude (∼10 in the log2x axis of Figure 3A). This suggests that at least in the condition tested here, Cas9 plus the best sgRNA can render E. coli cell grow around 1000-fold (210–103) slower than the sgRNA with poorest activity. Moreover, compared with the activity of their negative control sgRNA counterparts, the majority of sgRNAs in our library showed statistically significant activities (Supplementary Figure S4, Z-score of sgRNA activity). This is consistent with our previous conclusion (37) that ∼90% of sgRNAs within the library are active for CRISPRi based gene repression.
Figure 3.

Diversity of activity among sgRNAs. (A) The distribution of sgRNA activity in conjunction with Cas9, eSpCas9 and Cas9 in the ΔrecA genetic background (Cas9 (ΔrecA)). The activity distributions of negative control sgRNAs under these three conditions are also presented as references. (B) Distribution of the sgRNA with the strongest activity among all sgRNAs targeting each gene (under the three conditions as in (A)). Only genes with at least three sgRNAs were included (4,020 genes). (C) Activity comparisons between sgRNAs targeting the template or nontemplate strand in the gene-coding regions. A two-tailed MW U-test was used to test for significant differences. Cas9 dataset: 2,180 vs. 2,163 (template versus nontemplate sgRNAs, respectively, here and below), P = 0.794; Cas9 (ΔrecA) dataset: 2180 versus 2163, P = 0.316; eSpCas9 dataset: 2220 versus 2265, P = 10−11.2. (D) Activity comparisons between sgRNAs targeting the leading or lagging strand during replication across the E. coli chromosome. A two-tailed MW U-test was used to test for significant differences. Cas9 dataset: 27 356 versus 25 180 (leading strand versus lagging strand sgRNAs, respectively), P = 0.006; Cas9 (ΔrecA) dataset: 27 356 versus 25 180, P = 0.003; eSpCas9 dataset: 29 168 versus 26 213, P = 0.398.
As described above, a big fraction of sgRNAs in the library exhibit only moderate activities. For example, 34.5% of sgRNAs only repress bacterial growth by 10-fold or less (Cas9). It is noted that such sgRNAs with moderate activities are also potent to result in big false positive ratio during genome editing in bacteria using CRISPR/Cas9 as a negative selection method. We drafted a very simple model to make this point more intuitive (Supplementary Figure S5). Suppose that the upper limit of ssDNA recombination efficiency in E. coli is ∼10% of all transformants (46). In this context, among all transformants, if 10% avoid killing by CRISPR/Cas9 due to suboptimal sgRNA activity (equal to repress cell growth by 10-fold) and thus survive without desired mutations, then ∼50% false positive ratio (10% ÷ (10% + 10%)) is expected. Given this relationship, it is suggested that ∼40% of the sgRNAs in the Cas9 dataset (activity > −4) will lead to a false positive ratio of 50% or higher with the optimistic assumption of 1% recombination efficiency. Hence, we suggest that the proper selection of active sgRNAs is paramount to the success of genome editing, even in bacteria such as E. coli with their much more accessible chromosomal DNA than eukaryotic cells. This goal can be achieved with the help of our sgRNA activity dataset for people working in E. coli. We showed that at least one highly active sgRNA can be extracted for nearly all E. coli genes (Figure 3B, best sgRNA for each gene or intergenic entry (if available), Data S7). Furthermore, described in the subsequent section of this paper, we trained a model to predict sgRNA activities using the data produced here. This in silico tool can facilitate people working in other bacteria to design better sgRNAs in CRISPR/Cas9 assisted genome editing.
We also compared the sgRNA activity profiles of the three datasets (Cas9, eSpCas9 and Cas9 (ΔrecA)), from which the activities of the relevant nucleases can be inferred (Figure 3A). For example, the mutations in eSpCas9 are reported to increase its specificity by decreasing its stabilizing interactions with the non-target strand of the DNA substrate via eliminating the positively charged residues located within the groove between the HNH, RuvC and RNA-guided endonuclease domains (45). Our results indicated that the DNA cleavage activity of eSpCas9 is significantly weaker than that of wild-type Cas9 (Figure 3A). Thus, the positively charged groove of Cas9 contributed to its endonuclease activity, although in the original report (45) the activity of eSpCas9 was not affected based on quantification of the target DNA indel mutation rate after NHEJ repair. Meanwhile, as expected, knockout of recA significantly increased the lethality of DSBs in the bacterial chromosome as induced by the CRISPR/Cas9 system (Figure 3A), consistent with the conclusions of previous reports (18,23). Even though it has been suggested that genome editing can benefit from the blocking of recA expression (18,47), we argue that via the rational selection of sgRNAs (Figure 3B, Data S7) the false positive ratio of genome editing can be reduced without the tradeoff of genome instability derived from blocking the inherent DNA repairing pathways in bacteria. To test this, we chose three genes to delete by CRISPR/Cas9 assisted recombination. For each gene, one active and another poorly active sgRNAs were selected based on our screening results. Purified DNA template was used as recombination donor for the knockout of each gene. By gel analysis of PCR products from 10 randomly picked colonies after transformation for each experiment (sgRNA), we showed that all three experiments using active sgRNAs exhibited enhanced ratio of successful recombinants (Supplementary Figure S6).
Most sgRNAs in our library (the CRISPRi sub-library) bind the non-template strand in the gene-coding regions, which may result in strand bias. To test whether the conclusions derived from our sgRNA library can be extended to the template strand, we used the RBS sgRNA library as a proof-of-concept because of the absence of strand bias in this library and of the location of the RBS (downstream of the transcription start site). No significant difference (Mann–Whitney (MW) U-test) was detected in the activities of sgRNAs that targeted different DNA strands for the Cas9 (P = 0.794) and Cas9 (ΔrecA) (P = 0.316) datasets, although there was a significant difference for the eSpCas9 dataset (P = 10−11.2) (Figure 3C). One possible reason for this is that the weaker interaction of the eSpCas9–sgRNA complex with its DNA substrate (Figure 3A) may result in sensitivity to interference from the bacterial transcription machinery. Consistently, the stronger activity noted here when the nontemplate strand was targeted (Figure 3C, eSpCas9) is consistent with a previous report that the CRISPRi system results in better gene repression when this strand is targeted (48). In spite of the strand bias noted with eSpCas9, this result indicated that there was no strand bias (transcription) in gene-coding regions for the more commonly used Cas9 in bacterial genome editing, rendering our dataset suitable for computational methods such as machine learning to predict sgRNA activities anywhere across the chromosome.
We further sought to investigate possible interactions between the CRISPR/Cas9 complex and the DNA replication machinery to identify any potential strand bias issue in this case. We divided all sgRNAs in our library into two groups based on their target DNA strand—leading strand or lagging strand during DNA replication. No significant (very weak if any) differences were found between the activities of these two groups of sgRNAs for all three datasets (Figure 3D). Besides, the impact of other genome context parameters on guide efficacy, including relative position of the sgRNA relative to open reading frame (Supplementary Figure S7), position of the gene in the operon (Supplementary Figure S8), and gene expression levels (RNA-seq) (Supplementary Figure S9) was also evaluated. The results indicated no significant interaction between genome context described by these parameters and sgRNA activities.
Genomic loci that are resistant to CRISPR/Cas9-induced chromosomal breaks
There are chromosomal factors such as nucleosomes that inhibit CRISPR/Cas9 genome editing in eukaryotic cells (25,29,49). Although it is widely accepted that bacterial DNA is much more accessible (21,36), this issue has not yet been experimentally characterized in prokaryotic cells, in spite of the inactive genomic loci consistently observed in our datasets and the inability to modify particular genes by CRISPR/Cas9 in our previous experience. To this end, we used the median sgRNA activity among all sgRNAs belonging to one gene as an indicator of the average activity score of the relevant genomic region (Figure 4A, a more positive score indicates stronger resistance of this loci to CRISPR/Cas9 derived DNA cleavage). The variability in this indicator was apparent. Of particular significance is a positive skew (long right tail) in the distribution of the Cas9 dataset (Figure 4A), suggesting the existence of genomic loci resistant to CRISPR/Cas9 genome editing. It is worthy noted that even for those genes with resistance to CRISPR/Cas9-induced DSBs, significant activity variability can be still observed for their sgRNAs, in contrast to the experimental noise quantified by the variability of negative control sgRNAs (Figure 4B). This result suggests that the CRISPR/Cas9 complex can still access these regions and carry out nuclease activity. The overall resistance of these regions (median of sgRNA activity) to CRISPR/Cas9 genome editing can thus be probably deduced to chromosomal factors that inhibit the function of the CRISPR/Cas9 complex.
Figure 4.

E. coli genome-wide landscape of resistance to CRISPR/Cas9-induced lethal DNA DSBs. (A) Distribution of median sgRNA activity among all sgRNAs within each gene (for each of the three conditions, Cas9, eSpCas9 and Cas9 (ΔrecA)). The median sgRNA activity of negative control sgRNAs is zero because of the normalization step in the data processing (see Materials and Methods). (B) Genes with significant resistance to CRISPR/Cas9-induced DSBs were extracted ((median sgRNA activity ≥ 0 or (median sgRNA activity ≥ −1 and FPR ≥ 0.01)) and (≥5 sgRNAs)), giving rise to 192, 188 and 70 genes in the Cas9, eSpCas9 and Cas9 (ΔrecA) datasets, respectively. Shown is a distribution of deviations in the activities of sgRNAs targeting individual genes of these three sets. The experimental noise as quantified by negative control sgRNA deviations is shown as dotted lines. (C) Median activity among all sgRNAs belonging to each gene is plotted as a bar plot (zoom in is shown on the upper left) within each circle (Cas9, red; eSpCas9, blue; Cas9 (ΔrecA), yellow). Genes with notable resistance to genome editing (the same threshold as in (B)) in each dataset (Cas9, eSpCas9 and Cas9 (ΔrecA)) are highlighted with gene names. Essential genes in rich medium are tagged with ‘(e)’. The heatmap (black to white) below the relevant bar plot of each circle indicates the standard deviation of the within-gene sgRNA activity for each highlighted gene. The color bar is shown on the right. A high-resolution version of this genome-wide map is accessible (https://figshare.com/s/127cecee6f9ea4e814e2) for downloading.
To illustrate the positioning of resistance to CRISPR/Cas9-induced DSBs across the chromosome, we projected the median sgRNA activity belonging to each gene encoded by the E. coli genome along the chromosome (Figure 4C) and highlighted those genes with poor activities. The profiles of CRISPR/Cas9-induced DSB resistance for the three datasets are consistent, especially for Cas9 and eSpCas9 (Figure 4C, three circles of white-to-black heatmaps). In contrast, some resistant genomic regions in these two datasets became vulnerable to Cas9 attack in the genetic background of ΔrecA, suggesting that endogenous DSB repair activity sustainably mitigates the lethal effect of DSBs in a locus-dependent manner. This observation also indicates that the resistance to CRISPR/Cas9-induced DSBs of such regions in the context of Cas9 and eSpCas9 is not due to the unavailability of DNA targets via mutations such as large deletions, because all the host strains used in this work are derived from the same parental strain. This is further evidenced by the existence of within-gene sgRNA activity variability for these resistant regions (Figure 4B and heatmap of Figure 4C). Together, our results consistently suggest that unknown chromosomal factors have an impact on the activity of CRISPR/Cas9 system, in spite of the common belief that bacterial DNA is unprotected with respect to an attack from cellular factors (21,36). We are currently unable to associate these inactive regions with any known chromosomal factor in E. coli. Potential reasons for this blocking effect include DNA supercoiling state, occupation of nucleoid-associated proteins, torsional constraints of DNA, which are all suggested to impact CRISPR/Cas9 activity (31,50) and also known to present non uniform pattern across bacterial chromosome (51–53). Given that the investigation of bacterial chromosome structure is only beginning to emerge compared with mammalian cells being extensively profiled such as in ENCODE project (54), this still needs further study.
An integrated machine learning approach predicts highly active sgRNAs
As the first large-scale dataset of sgRNA activity in prokaryotes, our results make it possible to test the generalization ability of previous sgRNA activity prediction models trained by eukaryotic datasets. We adopted three widely used models (24,31,32) to predict the activity scores of sgRNAs in our dataset and compared those scores with our experimentally determined ones (see Methods) (Table 2, Supplementary Figure S10). Two of these are machine learning models, whereas the third is based on the biophysical mechanism of CRISPR/Cas9. We found very weak correlation between our dataset and the predictions from the two machine learning models (Doench et al. and Xu et al.). In contrast, a more notable but still weakly negative correlation was observed given the predictions from the biophysical model (Farasat et al.). This result suggests that the models trained from the sgRNA activity data from mammalian cell line screenings only partially capture the patterns of sgRNA sequence-activity relationships, possibly due to the noise in the training datasets introduced via the NHEJ repair specificity (34) and the impact of dense chromatin structures (36,49) in eukaryotic cells. Indeed, even for eukaryotic cells such as yeast, a recent study identified a different optimal window relative to the transcription start site for active sgRNA positioning in a CRISPRi system as compared with that reported for human cell lines (55). Similarly, Cui and Bikard also noted the poor prediction abilities of these models upon the activities of 13 sgRNAs in E. coli (23). In these lines, we sought to train the machine learning models based on our sgRNA activity dataset, aiming to extend the scope of this work to other prokaryotic organisms, as well as to elucidate the basic biophysics of the interactions between the CRISPR/Cas9 complex and DNA targets.
Table 2.
Correlation between sgRNA activity scores from predictions based on previous mammalian-cell-line-based models and our screening experiment
We first filtered our datasets by removing sgRNAs of low quality and with multiple targets (see Materials and Methods) as well as those belonging to genes with resistance to CRISPR/Cas9 genome editing (Figure 4C). We thus established three high-quality datasets (Cas9: 44 163 sgRNAs; eSpCas9: 45 070 sgRNAs; Cas9 (ΔrecA): 48 112 sgRNAs; summarized in Data S4) used in the subsequent work, which are the largest sgRNA on-target activity sets reported so far to the best of our knowledge (56). The absolute value of the Z-score for each sgRNA was used as the activity score (see Materials and Methods). To quantitatively model sgRNA activity, we carried out a featurization process that considers the DNA target sequence of the protospacer, PAM and flanking region to convert the N20NGGN sequence into 425 binary or real number features (Figure 5A). Genomic context parameters are not applied in this process, because the previous results showed that they have very little influence on sgRNA activities (Figure 3C, D; Supplementary Figures S7–S9). To prevent over-fitting, we randomly separated the dataset into two subgroups with 80% of the data used as the training dataset to train the models by 5-fold cross-validation, and the remaining 20% held out used to test the generalization capacity of the trained models (Figure 5A). Simple linear regression, regularized linear regression (L1LR and L2LR), ensemble method (gradient boosting regression tree, GBR) and an artificial neural network method (multiple layer perceptron, MLP) were used as machine learning models. We first evaluated the performance of different models using five fold cross-validation on the training set (Figure 5B). We found that the GBR model was the most predictive, with Spearman correlation coefficients of 0.542, 0.682 and 0.328 for Cas9, eSpCas9 and Cas9 (ΔrecA), respectively (Figure 5b). We reasoned that the relatively poor performance of the Cas9 (ΔrecA) model was derived from the overwhelming selection pressure during the screening experiments (Figure 3A; see discussion in Materials and Methods), leading to the inability to discriminate between sgRNAs with strong but different activities. It is also worth noting that simple linear regression generally works quite well, with a weaker but similar correlation (Spearman correlation coefficient = 0.508, 0.624 and 0.315 for Cas9, eSpCas9 and Cas9 (ΔrecA), respectively) with respect to that of the GBR model, suggesting that the naïve linear combinations of features used here were sufficient for deciphering the sgRNA sequence-activity relationships. Moreover, randomly shuffling before splitting the training set into five subgroups for cross-validation leads to no significant difference at the performance of trained models (data not shown), suggesting no bias is introduced during the training set split step. The trained model (fixed parameters in the final models learned from the data of training set are given in Supplementary Table S6) also showed good generalization ability when predicting the unseen data in the test set, and the performance metrics were well maintained (Figure 5C). Importantly, this high predictive value was consistent across randomly selected training and test sets (data not shown). In addition, we also used the trained eSpCas9 model to carry out a prediction analysis with a dataset obtained from an independent screening experiment using the tiling sgRNA library (see Figure 2C and Materials and Methods). We applied the same filter threshold to the results of this experiment, giving rise to a high-quality set with 2640 sgRNAs. Although 65.9% of them were not contained in the genome-wide sgRNA library, our prediction algorithm still showed good performance with a Spearman correlation coefficient value of 0.633 (Figure 5D). These results collectively confirmed that our models captured the underlying biological signals rather than fitting the data superficially. In addition, the models trained in this study (Cas9 and eSpCas9) outperformed the state-of-the-art ones in terms of Spearman correlation coefficient (25,28,29), possibly because of the better signal-to-noise ratio and less bias in our dataset obtained from screenings in bacteria as noted above. We propose that the algorithms reported here represent a better quantitative model about sgRNA on-target activity compared with the previous ones, at least in bacteria where it is developed.
Figure 5.

Machine learning model reliably predict sgRNA activities. (A) Schematic of machine learning dataset and algorithm. Three machine learning models (Cas9, eSpCas9 and Cas9 (ΔrecA)) were constructed, respectively. 80% sgRNAs of the relevant dataset was used as the training set by five fold cross-validation to train the model. We reserved 20% of the sgRNAs in each set (Cas9, eSpCas9 and Cas9 (ΔrecA)) as the test set to measure the generalization ability of each model to predict unseen data. We extracted 425 features for each sgRNA. Five varieties of machine models are trained for each dataset (Cas9, eSpCas9 and Cas9 (ΔrecA)) and gradient boosting regression tree is found generally to perform best. (B) Comparison of the different models. Using fivefold cross-validation, the models were trained with the training set by 5-fold cross-validation. The bar plot shows the mean ± s.d. for the Spearman correlation coefficient between predicted and measured sgRNA activity scores (n = 5). (C) Comparison of the generalization ability of different varieties of models. Models were trained on the intact training set with fixed parameters optimized during cross-validation. The Spearman correlation coefficient is shown for the predicted and measured sgRNA activity scores in the test set. (D) The generalization ability of the trained model was further validated by predicting activities from a dataset obtained from an independent sgRNA library and experiment. One additional sgRNA activity dataset (the same as that in Figure 2C) was constructed by screening the tiling library (2640 sgRNAs passed quality control, including 901 members that were also present in the genome-wide library) using the same protocol. Predictions of sgRNA activity from this dataset based on the eSpCas9 model trained on all the available data (training plus test set in (A)) are plotted against experimentally obtained scores. Each point on the plots represents a unique sgRNA and color denotes the scatter density. Spearman correlation coefficient: 0.6329, P = 10−294.8.
We next analyzed which features contributed most to sgRNA activity in the GBR model via Gini importance (Figure 6A for Cas9 and 6b for eSpCas9). Overall, the predicted scores were most influenced by the melting temperatures as determined by Watson–Crick base pairing. Other previously known factors that contributed to the sgRNA activity determined by our model (for both Cas9 and eSpCas9) included the extreme GC content (57) and the GG dimers (58) (both are known to have inhibitory effect). It is also interesting to note the differences in the profile of important features between Cas9 and eSpCas9. More well-known activity determinants of CRISPR/Cas9 activity were captured by the Cas9 model relative to the eSpCas9 model, such as the importance of a seed protospacer region proximal to the PAM site (11,59), especially the composition of the last nucleotide (the 20th nucleotide in our case (order1_P20_x)) (28); the critical role of the nucleotide immediately downstream of the NGG PAM site (NGGN_xx) (31). In the case of eSpCas9, in contrast, the seed regions were less important, and more general biophysical factors, such as the position-independent nucleotide composition (order1_IP_x or order2_IP_xx), and very intriguingly the nucleotide dimer at the first position of sgRNA (order2_P1_xx), were the predominant determinants of sgRNA on-target activity.
Figure 6.

Relationship between sgRNA sequence features and activity. (A, B) Relative importances of features (Gini importance) that contribute to the prediction power of the gradient boosting regression tree for the (A) Cas9 and (B) eSpCas9 model. The features of each model are sorted and the most important 20 features are shown. (C, D) Coefficients of features that contribute to the prediction power of the L1 regularized linear regression for the (C) Cas9 and (D) eSpCas9 model. The features for adjacent dimers (order2_Px_xx) are plotted as heatmap according to their relative position (‘Px’) in sgRNA. Positive coefficients suggest positive contributions to sgRNA activity and vice versa. For all plots shown here, results are shown from models trained on all the available data (training plus test set in Figure 5A).
The Gini importance of features in GBR model only reflects the absolute value of feature contribution, causing the information loss of the direction of the effect. Because the linear model has only moderate performance decrease compared with the GBR model (Figure 5B, C), the coefficients of features in simple linear model, such as L1LR can address this issue. It is noted that even in L1LR model, melting temperatures of DNA duplex are still the most important features contributing to sgRNA activity (data not shown), akin to GBR model described above. Comparison of importance of features shows that position-dependent dimers (order2_Px_xx) play much more important roles than position-dependent single nucleotide (Supplementary Figure S11). We hence plotted the coefficients of all position-dependent dimers (order2_Px_xx) from L1LR model for Cas9 (Figure 6C) and eSpCas9 (Figure 6D), respectively. The result is generally consistent with profiles learned from the GBR model (Figure 6A, B), evidenced by the agreement of important features obtained from both models. It is noted to highlight the inhibitory role of GG, CC dimers and the beneficial effect of TA, CT, CG, GC dimers in the seed region, while only GG dimers is known to exhibit negative effect (58). As described for GBR model, although seed regions play important roles in activity determination for both Cas9 and eSpCas9, it is more paramount for Cas9. While in eSpCas9 group, we observed a pattern where the relative contributions of nucleotides far from PAM increase. This is especially striking in the case of the first two nucleotides. AA, TT and CC dimers are strong factors negatively affecting sgRNA activity, while their roles in Cas9 case are only moderate. While these effects can be deduced to the sgRNA expression level or stability, the general pattern of less important seed region in eSpCas9 may suggest that the mutations partially reprogram the recognition or subsequent interaction and cleavage function of the eSpCas9–sgRNA complex with respect to its DNA substrate, possibly because of the destabilized interaction between eSpCas9 and the non-target DNA strand resulting from the neutralization mutations to eliminate the positive charges within the inter-domain groove (45).
Software package
To facilitate experimental biologists to use the sgRNA activity prediction models that resulted from this work, we developed an integrated Python package to convert an sgRNA sequence fasta file directly into activity scores. This package thus likely represents an improved alternative over existing methods optimized on datasets from mammalian cell line screenings for microbiologists and bioengineers working on bacteria. We also envision that this algorithm is useful for computational biologists to further dissect the underlying rules controlling sgRNA activities. The software can be accessed via our GitHub site (https://github.com/zhangchonglab/sgRNA-cleavage-activity-prediction.git).
DISCUSSION
CRISPR/Cas genome editing was elegantly demonstrated in bacteria for the first time in 2013 (10). Subsequently, a number of other groups proved the applicability of this method for a broad spectrum of prokaryotic species (12–15), including archaea (16), in which the development of tools for genetic manipulation is known to be very hard. This approach is hence regarded as a promising methodological innovation for the analysis of basic prokaryotic genetics (60) and engineering research (61,62), such as microbial cell factory optimization or the development of a synthetic immunity arsenal to defend against pathogens. In contrast to its early optimistic expectations, the real application of CRISPR/Cas technology to microbiological or bioengineering research has lagged far behind (22,61,63), especially in high-throughput scenarios such as multiplex gene editing and functional genomic screening, which was previously suggested as a major advantage of CRISPR/Cas. We propose here that the sgRNA on-target activity, which has been analyzed in eukaryotic genome editing by CRISPR/Cas9 but never systematically studied in prokaryotic organisms, is a major contributor that can limit the application of CRISPR/Cas9 in bacterial gene editing. Using a comprehensive sgRNA library and pooled screening strategy, we demonstrated that sgRNA activities vary widely in E. coli (Figure 3A) based on sequence features (Figure 6) and unknown chromosomal factors (Figure 4C), the latter of which was unexpected given the vulnerable nature of bacterial DNA. Our sgRNA activity dataset makes it possible to select optimized sgRNAs for nearly every gene and functionally important intergenic region (promoter and RBS) encoded by the E. coli genome (Figure 3B) and moreover to develop advanced models (Table 2 and Figure 5) to predict highly active sgRNAs not only in E. coli but also, potentially, in other bacteria. We believe these results should contribute to accelerating the broader and better application of promising CRISPR/Cas technology in the study of the basic biology and in the engineering of prokaryotic organisms.
In addition to these advancements in the field of bacterial genome engineering, this work also elucidates the potential bias of previous sgRNA activity prediction models (24,31,32) trained from mammalian cell line screening data. We think such bias may be derived from firstly, the output of data used to train these models is a hybrid of sgRNA activity and DNA repairing preference (NHEJ) (34); secondly the functional consequences of CRISPR/Cas9 derived mutations used to determine the sgRNA activity depends on the target context (targeting site in genes, mutation types, etc) (24); and thirdly the confounding effect of lentiviral transduction and sgRNA expression in the training data (30). This work raises the limitations of these sgRNA activity prediction model to be applied in other CRISPR/Cas9 utilization scenario (e.g. recombination to introduce defined mutations) or to be extended to unexplored host cells, such as bacteria in this case. Hence, we suggest that more unbiased methods for high throughput sgRNA activity profiling need to be developed; or specific models should be developed for specific utilization scenario. Akin to the dataset and model reported here, such efforts should be of great value to dissect the molecular determinants of CRISPR/Cas9 genome editing activity and further advance this transformative technology to realize its potential in many different application fields.
DATA AVAILABILITY
Raw data of CRISPR screening for the tiling library and genome-scale library has been deposited onto the NCBI Short Read Archive with accession number BioProject: PRJNA450978. The software and user manual used to predict sgRNA activity can be found at https://github.com/zhangchonglab/sgRNA-cleavage-activity-prediction.git.
FUNDING
National Key Research and Development Program of China [2016YFF0202303]; National Key Scientific Instrument and Equipment Project of NSFC [21627812]; General Program of NSFC [21676156]; Tsinghua University Initiative Scientific Research Program [20161080108]. Funding for open access charge: National Natural Science Foundation of China [NSFC21627812]; Tsinghua University Initiative Scientific Research Program [20161080108].
Supplementary Material
SUPPLEMENTARY DATA
Supplementary Data are available at NAR Online.
Conflict of interest statement. None declared.
REFERENCES
- 1. Wang H.H., Isaacs F.J., Carr P.A., Sun Z.Z., Xu G., Forest C.R., Church G.M.. Programming cells by multiplex genome engineering and accelerated evolution. Nature. 2009; 460:894–898. [DOI] [PMC free article] [PubMed] [Google Scholar]
- 2. Raman S., Rogers J.K., Taylor N.D., Church G.M.. Evolution-guided optimization of biosynthetic pathways. Proc. Natl. Acad. Sci. U.S.A. 2014; 111:17803–17808. [DOI] [PMC free article] [PubMed] [Google Scholar]
- 3. Mandell D.J., Lajoie M.J., Mee M.T., Takeuchi R., Kuznetsov G., Norville J.E., Gregg C.J., Stoddard B.L., Church G.M.. Biocontainment of genetically modified organisms by synthetic protein design. Nature. 2015; 518:55–60. [DOI] [PMC free article] [PubMed] [Google Scholar]
- 4. Rovner A.J., Haimovich A.D., Katz S.R., Li Z., Grome M.W., Gassaway B.M., Amiram M., Patel J.R., Gallagher R.R., Rinehart J. et al. . Recoded organisms engineered to depend on synthetic amino acids. Nature. 2015; 518:89–93. [DOI] [PMC free article] [PubMed] [Google Scholar]
- 5. Isaacs F.J., Carr P.A., Wang H.H., Lajoie M.J., Sterling B., Kraal L., Tolonen A.C., Gianoulis T.A., Goodman D.B., Reppas N.B. et al. . Precise manipulation of chromosomes in vivo enables genome-wide codon replacement. Science. 2011; 333:348–353. [DOI] [PMC free article] [PubMed] [Google Scholar]
- 6. Warner J.R., Reeder P.J., Karimpour-Fard A., Woodruff L.B., Gill R.T.. Rapid profiling of a microbial genome using mixtures of barcoded oligonucleotides. Nat. Biotechnol. 2010; 28:856–862. [DOI] [PubMed] [Google Scholar]
- 7. Pines G., Freed E.F., Winkler J.D., Gill R.T.. Bacterial recombineering: genome engineering via phage-based homologous recombination. ACS Synth. Biol. 2015; 4:1176–1185. [DOI] [PubMed] [Google Scholar]
- 8. Garst A.D., Bassalo M.C., Pines G., Lynch S.A., Halweg-Edwards A.L., Liu R., Liang L., Wang Z., Zeitoun R., Alexander W.G. et al. . Genome-wide mapping of mutations at single-nucleotide resolution for protein, metabolic and genome engineering. Nat. Biotechnol. 2016; 35:48–55. [DOI] [PubMed] [Google Scholar]
- 9. Cong L., Ran F.A., Cox D., Lin S., Barretto R., Habib N., Hsu P.D., Wu X., Jiang W., Marraffini L.A. et al. . Multiplex genome engineering using CRISPR/Cas systems. Science. 2013; 339:819–823. [DOI] [PMC free article] [PubMed] [Google Scholar]
- 10. Jiang W., Bikard D., Cox D., Zhang F., Marraffini L.A.. RNA-guided editing of bacterial genomes using CRISPR-Cas systems. Nat. Biotechnol. 2013; 31:233–239. [DOI] [PMC free article] [PubMed] [Google Scholar]
- 11. Jinek M., Chylinski K., Fonfara I., Hauer M., Doudna J.A., Charpentier E.. A programmable dual-RNA-guided DNA endonuclease in adaptive bacterial immunity. Science. 2012; 337:816–821. [DOI] [PMC free article] [PubMed] [Google Scholar]
- 12. Oh J.-H., van Pijkeren J.-P.. CRISPR-Cas9-assisted recombineering in Lactobacillus reuteri. Nucleic Acids Res. 2014; 42:e131. [DOI] [PMC free article] [PubMed] [Google Scholar]
- 13. Tong Y., Charusanti P., Zhang L., Weber T., Lee S.Y.. CRISPR-Cas9 based engineering of actinomycetal genomes. ACS Synth. Biol. 2015; 4:1020–1029. [DOI] [PubMed] [Google Scholar]
- 14. Li H., Shen C.R., Huang C.H., Sung L.Y., Wu M.Y., Hu Y.C.. CRISPR-Cas9 for the genome engineering of cyanobacteria and succinate production. Metab. Eng. 2016; 38:293–302. [DOI] [PubMed] [Google Scholar]
- 15. Xu T., Li Y., Shi Z., Hemme C.L., Li Y., Zhu Y., Van Nostrand J.D., He Z., Zhou J.. Efficient genome editing in clostridium cellulolyticum via CRISPR-Cas9 nickase. Appl. Environ. Microbiol. 2015; 81:4423–4431. [DOI] [PMC free article] [PubMed] [Google Scholar]
- 16. Nayak D.D., Metcalf W.W.. Cas9-mediated genome editing in the methanogenic archaeon Methanosarcina acetivorans. Proc. Natl. Acad. Sci. U.S.A. 2017; 114:2976–2981. [DOI] [PMC free article] [PubMed] [Google Scholar]
- 17. Jiang Y., Chen B., Duan C., Sun B., Yang J., Yang S.. Multigene editing in the Escherichia coli genome using the CRISPR-Cas9 system. Appl. Environ. Microbiol. 2015; 81:2506–2514. [DOI] [PMC free article] [PubMed] [Google Scholar]
- 18. Ronda C., Pedersen L.E., Sommer M.O.A., Nielsen A.T.. CRMAGE: CRISPR optimized MAGE recombineering. Sci. Rep. 2016; 6:19452. [DOI] [PMC free article] [PubMed] [Google Scholar]
- 19. Zhou Y., Zhu S., Cai C., Yuan P., Li C., Huang Y., Wei W.. High-throughput screening of a CRISPR/Cas9 library for functional genomics in human cells. Nature. 2014; 509:487–491. [DOI] [PubMed] [Google Scholar]
- 20. Shalem O., Sanjana N.E., Zhang F.. High-throughput functional genomics using CRISPR-Cas9. Nat. Rev. Genet. 2015; 16:299–311. [DOI] [PMC free article] [PubMed] [Google Scholar]
- 21. Struhl K. Fundamentally different logic of gene regulation in eukaryotes and prokaryotes. Cell. 1999; 98:1–4. [DOI] [PubMed] [Google Scholar]
- 22. Zerbini F., Zanella I., Fraccascia D., König E., Irene C., Frattini L.F., Tomasi M., Fantappiè L., Ganfini L., Caproni E. et al. . Large scale validation of an efficient CRISPR/Cas-based multi gene editing protocol in Escherichia coli. Microb. Cell Fact. 2017; 16:68. [DOI] [PMC free article] [PubMed] [Google Scholar]
- 23. Cui L., Bikard D.. Consequences of Cas9 cleavage in the chromosome of Escherichia coli. Nucleic Acids Res. 2016; 44:4243–4251. [DOI] [PMC free article] [PubMed] [Google Scholar]
- 24. Doench J.G., Fusi N., Sullender M., Hegde M., Vaimberg E.W., Donovan K.F., Smith I., Tothova Z., Wilen C., Orchard R. et al. . Optimized sgRNA design to maximize activity and minimize off-target effects of CRISPR-Cas9. Nat. Biotechnol. 2016; 34:184–191. [DOI] [PMC free article] [PubMed] [Google Scholar]
- 25. Horlbeck M.A., Gilbert L.A., Villalta J.E., Adamson B., Pak R.A., Chen Y., Fields A.P., Park C.Y., Corn J.E., Kampmann M. et al. . Compact and highly active next-generation libraries for CRISPR-mediated gene repression and activation. Elife. 2016; 5:339–350. [DOI] [PMC free article] [PubMed] [Google Scholar]
- 26. Bikard D., Euler C.W., Jiang W., Nussenzweig P.M., Goldberg G.W., Duportet X., Fischetti V.A., Marraffini L.A.. Exploiting CRISPR-cas nucleases to produce sequence-specific antimicrobials. Nat. Biotechnol. 2014; 32:1146–1150. [DOI] [PMC free article] [PubMed] [Google Scholar]
- 27. Citorik R.J., Mimee M., Lu T.K.. Sequence-specific antimicrobials using efficiently delivered RNA-guided nucleases. Nat. Biotechnol. 2014; 32:1141–1145. [DOI] [PMC free article] [PubMed] [Google Scholar]
- 28. Doench J.G., Hartenian E., Graham D.B., Tothova Z., Hegde M., Smith I., Sullender M., Ebert B.L., Xavier R.J., Root D.E.. Rational design of highly active sgRNAs for CRISPR-Cas9-mediated gene inactivation. Nat. Biotechnol. 2014; 32:1262–1267. [DOI] [PMC free article] [PubMed] [Google Scholar]
- 29. Chari R., Mali P., Moosburner M., Church G.M.. Unraveling CRISPR-Cas9 genome engineering parameters via a library-on-library approach. Nat. Methods. 2015; 12:823–826. [DOI] [PMC free article] [PubMed] [Google Scholar]
- 30. Moreno-Mateos M.A, Vejnar C.E., Beaudoin J.-D., Fernandez J.P., Mis E.K., Khokha M.K., Giraldez A.J.. CRISPRscan: designing highly efficient sgRNAs for CRISPR-Cas9 targeting in vivo. Nat. Methods. 2015; 12:982–988. [DOI] [PMC free article] [PubMed] [Google Scholar]
- 31. Farasat I., Salis H.M.. A biophysical model of CRISPR/Cas9 activity for rational design of genome editing and gene regulation. PLoS Comput. Biol. 2016; 12:e1004724. [DOI] [PMC free article] [PubMed] [Google Scholar]
- 32. Xu H., Xiao T., Chen C.-H., Li W., Meyer C.A., Wu Q., Wu D., Cong L., Zhang F., Liu J.S. et al. . Sequence determinants of improved CRISPR sgRNA design. Genome Res. 2015; 25:1147–1157. [DOI] [PMC free article] [PubMed] [Google Scholar]
- 33. Lieber M.R. The mechanism of human nonhomologous DNA end joining. J. Biol. Chem. 2008; 283:1–5. [DOI] [PubMed] [Google Scholar]
- 34. Chang H.H.Y., Watanabe G., Gerodimos C.A., Ochi T., Blundell T.L., Jackson S.P., Lieber M.R.. Different DNA end configurations dictate which NHEJ components are most important for joining efficiency. J. Biol. Chem. 2016; 291:24377–24389. [DOI] [PMC free article] [PubMed] [Google Scholar]
- 35. Pitcher R.S., Brissett N.C., Doherty A.J.. Nonhomologous End-Joining in Bacteria: A microbial perspective. Annu. Rev. Microbiol. 2007; 61:259–282. [DOI] [PubMed] [Google Scholar]
- 36. Kuzminov A. The precarious prokaryotic chromosome. J. Bacteriol. 2014; 196:1793–1806. [DOI] [PMC free article] [PubMed] [Google Scholar]
- 37. Wang T.M., Guan C.G., Guo J.H., Liu B., Wu Y.N., Xie Z., Zhang C., Xing X.H.. Pooled CRISPR interference screening enables genome-scale functional genomics study in bacteria with superior performance. Nat. Commun. 2018; DOI:10.1038/s41467-018-04899-x. [DOI] [PMC free article] [PubMed] [Google Scholar]
- 38. Jiang H., Wong W.H.. SeqMap: mapping massive amount of oligonucleotides to the genome. Bioinformatics. 2008; 24:2395–2396. [DOI] [PMC free article] [PubMed] [Google Scholar]
- 39. Sander J.D., Joung J.K.. CRISPR-Cas systems for editing, regulating and targeting genomes. Nat. Biotechnol. 2014; 32:347–355. [DOI] [PMC free article] [PubMed] [Google Scholar]
- 40. Magoč T., Salzberg S.L.. FLASH: fast length adjustment of short reads to improve genome assemblies. Bioinformatics. 2011; 27:2957–2963. [DOI] [PMC free article] [PubMed] [Google Scholar]
- 41. Storey J.D., Tibshirani R.. Statistical significance for genomewide studies. Proc. Natl. Acad. Sci. U.S.A. 2003; 100:9440–9445. [DOI] [PMC free article] [PubMed] [Google Scholar]
- 42. Krzywinski M., Schein J., Birol I., Connors J., Gascoyne R., Horsman D., Jones S.J., Marra M.A.. Circos: An information aesthetic for comparative genomics. Genome Res. 2009; 19:1639–1645. [DOI] [PMC free article] [PubMed] [Google Scholar]
- 43. Bonde M.T., Pedersen M., Klausen M.S., Jensen S.I., Wulff T., Harrison S., Nielsen A.T., Herrgård M.J., Sommer M.O.A.. Predictable tuning of protein expression in bacteria. Nat. Methods. 2016; 13:233–236. [DOI] [PubMed] [Google Scholar]
- 44. Alper H., Fischer C., Nevoigt E., Stephanopoulos G.. Tuning genetic control through promoter engineering. Proc. Natl. Acad. Sci. U.S.A. 2005; 102:12678–12683. [DOI] [PMC free article] [PubMed] [Google Scholar]
- 45. Slaymaker I.M., Gao L., Zetsche B., Scott D.A., Yan W.X., Zhang F.. Rationally engineered Cas9 nucleases with improved specificity. Science. 2015; 351:84–88. [DOI] [PMC free article] [PubMed] [Google Scholar]
- 46. Costantino N., Court D.L.. Enhanced levels of lambda Red-mediated recombinants in mismatch repair mutants. Proc. Natl. Acad. Sci. U.S.A. 2003; 100:15748–15753. [DOI] [PMC free article] [PubMed] [Google Scholar]
- 47. Moreb E.A., Hoover B., Yaseen A., Valyasevi N., Roecker Z., Menacho-Melgar R., Lynch M.D.. Managing the SOS response for enhanced CRISPR-Cas-Based recombineering in E. coli through transient inhibition of host RecA activity. ACS Synth. Biol. 2017; 6:2209–2218. [DOI] [PubMed] [Google Scholar]
- 48. Qi L.S., Larson M.H., Gilbert L.A., Doudna J.A., Weissman J.S., Arkin A.P., Lim W.A.. Repurposing CRISPR as an RNA-guided platform for sequence-specific control of gene expression. Cell. 2013; 152:1173–1183. [DOI] [PMC free article] [PubMed] [Google Scholar]
- 49. Horlbeck M.A., Witkowsky L.B., Guglielmi B., Replogle J.M., Gilbert L.A., Villalta J.E., Torigoe S.E., Tjian R., Weissman J.S.. Nucleosomes impede cas9 access to DNA in vivo and in vitro. Elife. 2016; 5:e12677. [DOI] [PMC free article] [PubMed] [Google Scholar]
- 50. Räz M.H., Hidaka K., Sturla S.J., Sugiyama H., Endo M.. Torsional constraints of DNA substrates impact Cas9 cleavage. J. Am. Chem. Soc. 2016; 138:13842–13845. [DOI] [PubMed] [Google Scholar]
- 51. Badrinarayanan A., Le T.B.K., Laub M.T.. Bacterial chromosome organization and segregation. Annu. Rev. Cell Dev. Biol. 2015; 31:171–199. [DOI] [PMC free article] [PubMed] [Google Scholar]
- 52. Lal A., Dhar A., Trostel A., Kouzine F., Seshasayee A.S., Adhya S.. Genome scale patterns of supercoiling in a bacterial chromosome. Nat. Commun. 2016; 7:11055. [DOI] [PMC free article] [PubMed] [Google Scholar]
- 53. Badrinarayanan A., Reyes-Lamothe R., Uphoff S., Leake M.C., Sherratt D.J., Telling A., Amit I., Lajoie B.R., Sabo P.J., Dorschner M.O. et al. . In vivo architecture and action of bacterial structural maintenance of chromosome proteins. Science. 2012; 338:528–531. [DOI] [PMC free article] [PubMed] [Google Scholar]
- 54. Bernstein B.E., Birney E., Dunham I., Green E.D., Gunter C., Snyder M.. An integrated encyclopedia of DNA elements in the human genome. Nature. 2012; 489:57–74. [DOI] [PMC free article] [PubMed] [Google Scholar]
- 55. Smith J.D., Suresh S., Schlecht U., Wu M., Wagih O., Peltz G., Davis R.W., Steinmetz L.M., Parts L., St Onge R.P.. Quantitative CRISPR interference screens in yeast identify chemical-genetic interactions and new rules for guide RNA design. Genome Biol. 2016; 17:45. [DOI] [PMC free article] [PubMed] [Google Scholar]
- 56. Haeussler M., Schönig K., Eckert H., Eschstruth A., Mianné J., Renaud J.-B., Schneider-Maunoury S., Shkumatava A., Teboul L., Kent J. et al. . Evaluation of off-target and on-target scoring algorithms and integration into the guide RNA selection tool CRISPOR. Genome Biol. 2016; 17:148. [DOI] [PMC free article] [PubMed] [Google Scholar]
- 57. Gilbert L.A., Horlbeck M.A., Adamson B., Villalta J.E., Chen Y., Whitehead E.H., Guimaraes C., Panning B., Ploegh H.L., Bassik M.C. et al. . Genome-Scale CRISPR-Mediated control of gene repression and activation. Cell. 2014; 159:647–661. [DOI] [PMC free article] [PubMed] [Google Scholar]
- 58. Malina A., Cameron C.J.F., Robert F., Blanchette M., Dostie J., Pelletier J.. PAM multiplicity marks genomic target sites as inhibitory to CRISPR-Cas9 editing. Nat. Commun. 2015; 6:10124. [DOI] [PMC free article] [PubMed] [Google Scholar]
- 59. Semenova E., Jore M.M., Datsenko K.A., Semenova A., Westra E.R., Wanner B., van der Oost J., Brouns S.J.J., Severinov K.. Interference by clustered regularly interspaced short palindromic repeat (CRISPR) RNA is governed by a seed sequence. Proc. Natl. Acad. Sci. U.S.A. 2011; 108:10098–10103. [DOI] [PMC free article] [PubMed] [Google Scholar]
- 60. Peters J.M., Colavin A., Shi H., Czarny T.L., Larson M.H., Wong S., Hawkins J.S., Lu C.H.S., Koo B.-M., Marta E. et al. . A comprehensive, CRISPR-based functional analysis of essential genes in bacteria. Cell. 2016; 165:1493–1506. [DOI] [PMC free article] [PubMed] [Google Scholar]
- 61. Luo M.L., Leenay R.T., Beisel C.L.. Current and future prospects for CRISPR-based tools in bacteria. Biotechnol. Bioeng. 2015; 113:930–943. [DOI] [PMC free article] [PubMed] [Google Scholar]
- 62. Jakočiūnas T., Jensen M.K., Keasling J.D.. CRISPR/Cas9 advances engineering of microbial cell factories. Metab. Eng. 2015; 34:44–59. [DOI] [PubMed] [Google Scholar]
- 63. Choi K.R., Lee S.Y.. CRISPR technologies for bacterial systems: Current achievements and future directions. Biotechnol. Adv. 2016; 34:1180–1209. [DOI] [PubMed] [Google Scholar]
Associated Data
This section collects any data citations, data availability statements, or supplementary materials included in this article.
Supplementary Materials
Data Availability Statement
Raw data of CRISPR screening for the tiling library and genome-scale library has been deposited onto the NCBI Short Read Archive with accession number BioProject: PRJNA450978. The software and user manual used to predict sgRNA activity can be found at https://github.com/zhangchonglab/sgRNA-cleavage-activity-prediction.git.