Abstract
Glioblastoma (GBM) is the most aggressive primary brain cancer with an average survival time after diagnosis of only 12–14 months, with few (<5%) long term survivors. A growing body of work suggests that GBMs contain a small population of glioma stem cells (GSCs) that are thought to be major contributors to treatment resistance and disease relapse. Identifying compounds that modulate GSC proliferation would provide highly valuable molecular probes of GSC-directed signaling. However, targeting GSCs pharmacologically has been challenging. Patient-derived GSCs can be cultured as neurospheres and in vivo these cells functionally recapitulate the heterogeneity of the original tumor. Using patient-derived GSC enriched cultures we have developed a 1536-well spheroid-based proliferation assay and completed a pilot screen, testing ~3,300 compounds comprising approved drugs. This phenotypic and automation-friendly assay yielded a S/B of 161.3 ± 7.5 and Z′ of 0.77 ± 0.02 demonstrating its robustness. Importantly, compounds were identified with anti-GSC activity demonstrating the applicability of this assay for large scale HTS.
Keywords: Glioblastoma, 3D culture, Cytotoxicity, Approved Drug Library
Introduction
Glioblastoma, (GBM) is the most aggressive primary brain cancer, characterized with high recurrence rates and exceptionally poor prognosis.1, 2 Even after multimodal therapy such as tumor resection, radiation and chemotherapy (temozolomide) median survival is only 12–14 months with less than 30% of patients achieving two-year survival.3 Improved treatments that target the source of chemotherapy resistance and tumor recurrence are desperately needed.
Our inability to effectively treat GBM is due in part to the propensity of GBM cells to infiltrate and colonize normal brain tissue preventing complete surgical removal of malignant cells.4 Moreover, for GBMs to establish at secondary sites within the brain, these motile cells must be able to self-renew, generate differentiated daughter cells and spawn a heterogeneous tumor. GBMs, like hematopoietic malignancies and other solid tumors, have been shown to comprise a small population of cancer stem cells known as glioma stem cells (GSCs) that have the capacity to reconstitute the heterogeneity of the parental tumor after serial dilution and intracranial implantation into immune compromised mice.5, 6 Moreover, GSCs demonstrate infiltrative properties which have increased resistance to current therapies and are thought to be primary contributors to chemotherapy resistance and tumor recurrence.7–10 Accordingly, selectively targeting GSC proliferation in combination with current therapies is an attractive strategy to improve treatment outcome in GBM.
Increased understanding of the master regulators and epigenetic ancillary factors that control the tumor propagating potential in GBM are beginning to be realized.11 Furthermore, proof-of-principle genetic studies have shown that blocking self-renewal of GSCs leads to prolonged survival in GSC patient derived mouse efficacy studies.12 Nevertheless, the optimal GSC-drug targets for clinical translation remain ill-defined.13 Establishing cancer models for evaluating new chemotherapeutics is of high priority. Cancer cells cultured in conditions to mimic 3D tumor growth reflect tumor cell contact within the in vivo tumor environment, which are not recapitulated in traditional monolayer cell culture context.14 Additionally, 3D cultures will mimic some of the physical barriers that anti-cancer drugs encounter when delivered in vivo that are not present in typical 2D cultures.15
Recent studies have enabled drug screening using adherent patient-derived GSC cultures.16–18 Here we describe development of a patient derived GSC, 3D-spheroid ultra-high throughput proliferation assay. We have optimized and validated the assay in 1536-well format, testing our approved drug collection comprising the NCI oncology drug set of 114 compounds and ~3300 clinically approved drugs. This automation-friendly assay yielded a S/B of 161.3 ± 7.5 and Z′ of 0.77 ± 0.02, demonstrating the applicability of this assay for large scale HTS.
Material and Methods
Cell Lines
GSCs were a gift from Jan N. Sarkaria.19 For this study, GBM6 primary glioblastoma cell line was used. The histopathological and molecular features of the primary GBM tumor were maintained by serial transplantation in flanks of nude mice.20 GSCs were grown for short term (less than ten passages) in StemPro® NSC Serum-Free-Medium (Part A1050901, ThermoFisher Scientific, Waltham, MA) supplemented with GlutaMAX™ (Part 35050061, ThermoFisher Scientific, Waltham, MA) and Penicilin-Streptomycin (Part 15140122, ThermoFisher Scientific, Waltham, MA) in a tissue culture incubator at 37°C and 5% CO2 following a culture method described previously.21 In order to generate GBM6 bulk tumor cells, the cells were grown on DMEM (Part 11965118, ThermoFisher Scientific, Waltham, MA) supplemented with 10% FCS (Part 16140071, ThermoFisher Scientific, Waltham, MA). U87 cell line was grown in DMEM-10% FCS.
3D-Spheroid analysis
For staining nuclei 3D spheres were incubated with 2 μg/ml dilution of Hoechst for 20 minutes. Images were captured every 1 micron using an Olympus FluoView 1000 confocal microscope (Olympus, Shinjuku, Tokyo, Japan). Image analysis and Z-stacking was carried out using ImageJ software.
Compound Library
A collection of 3,291 clinically approved drugs obtained from multiple vendors were assembled at the Scripps Research Institute Molecular Screening Center (SRIMSC) and reformatted into 1536-well source plates for automated robotic screening. These compounds have been approved either by the Food and Drug Administration (FDA), the European Medicines Agency (EMA) or the Japanese Pharmaceuticals and Medical Devices Agency (PMDA). The NCI approved oncology drug set of 114 compounds was obtained directly from the NCI and included in this effort.
Cell Proliferation Assay
A cell proliferation assay was developed in a 1536-well format. GSCs cells were grown in StemPro® NSC Serum-Free-Medium, and trypsinized (Part 25300120, ThermoFisher Scientific, Waltham, MA) for 1 min at 37°C. Trypsin was inactivated using 5 volumes of DMEM-10% FCS and cells were centrifuged at 320×g for 3 min. Dissociated cells were resuspended in StemPro® NSC Serum-Free-Medium and filtered through a cell strainer 70 μm (Part 352350, Corning, Corning, NY). 1000 cells in 5 μL culture media were seeded per well in 1536-well clear-bottom tissue culture treated microtiter plates (Part 789072, Greiner Bio-One, Monroe, NC). After incubation of the GSCs cells for 2 days, to allow the spheroid formation, cells were treated with compounds and vehicle (0.15% DMSO). Cell proliferation was assessed after another 72-hour incubation using CellTiter Glo reagent (Part G7572, Promega, Madison, WI) according to manufacturer’s instruction. CellTiter Glo reagent generates a luminescent signal proportional to the amount of ATP present. The amount of ATP is directly proportional to the number of cells present in culture. The ViewLux microplate reader (Perkin Elmer, Waltham, MA) was used to quantitate luminescence signal. EC50 values of our reference compound, SR-3029, were determined by fitting the concentration response curve data (CRC) with a four-parameter variable slope method in GraphPad Prism (GraphPad software, San Diego, CA).
HTS Campaign and Data Processing
The 1536-well HTS campaign was screened at 2 μM final drug concentration. All data files were uploaded into the Scripps database for individual plate quality control determination and hit identification. Assay plates were determined acceptable only if their Z′ was > 0.5.
The Z′ was calculated using the following expression:
Compound activity was normalized on a per-plate basis using the following equation:
Test Well refers to those wells with cells treated with test compounds. High Control is defined as wells containing medium treated with DMSO (100% inhibition), and Low Control wells contain cells treated with DMSO (0% inhibition).
In addition, the EC50 of our pharmacological control compound, SR-3029, a casein kinase inhibitor, was used for quality control in the HTS campaign which we required to be within 3-fold of historic EC50 on an experimental basis. A hit cut-off was used to define active compounds in this pilot screen, calculated as the average percent inhibition of all dataset values plus three times their standard deviation, of all the tested compounds. Any compound that exhibited % inhibition greater than the hit cutoff was declared active.
Active hits were chosen and prepared as 10-point, 3-fold serial dilutions and tested against GSCs spheroids in triplicate starting from 5 μM nominal concentration. For each test compound, % inhibition (indicated as % Response in the figures) was plotted against compound concentration. A four-parameter equation describing a sigmoidal dose-response curve was then fitted using Assay Explorer software (Symyx Technologies, Santa Clara, CA). The reported IC50 values were generated from fitted curves by solving for the X-intercept value at the 50% inhibition level of the Y-intercept value. In cases where the highest concentration tested (i.e. 5 μM) did not result in greater than 50% cytotoxicity, the IC50 was deemed as greater than 5 μM.
Results and Discussion
Characterization of Glioma Stem Cell Spheroid Formation
Prior to optimization of the assay conditions we confirmed that spheroid cultures derived from patient explants were enriched with GSCs. We first analyzed the spheroid cultures for the GSC markers, Nestin, SOX2 and SOX9, as detected by immunofluorescent microscopy (Supplemental Figure S1 A–C).22–24 Next, the presence of GSCs were confirmed by functional assays including, self-renewal of neurosphere formation and the generation of intracranial heterogeneous tumors in immunocompromised mice (data not shown).20
Development and Optimization of a 1536-well GSC-spheroid proliferation assay
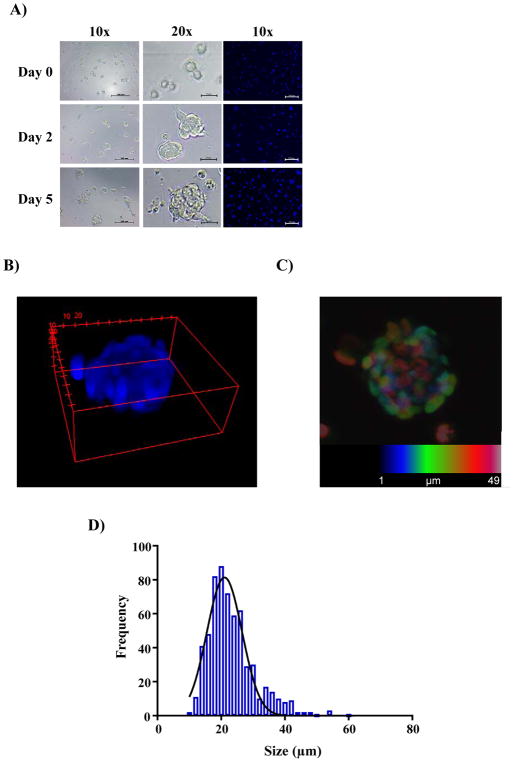
To test uniformity of GSC sphere number and volume per well, GSCs were dissociated to single cells and seeded at increasing cell number (500, 1000, 1500 and 2000 cells/well) in 1536-well clear bottom plates. Formation of spheroids was monitored by bright-field, and also by confocal fluorescence microscopy using Hoechst staining. As anticipated, seeding concentration did not affect spheroid size and the number of spheroids increased proportionally to the original seeding density. Note that GSCs spheroids do not aggregate in these wells as one contiguous aggregate, but instead grow as multiple homogenous spheres (average of ~25 microns). Representative micrographs of GSC-spheroid formation as a function of time are shown in Figure 1A. A 3D depiction of the mean volume and maximum intensity projection of the Z-stack analysis of a representative GSC-spheroid is shown (Figure 1B and C). Replicate wells demonstrated a consistent spheroid size with a Gaussian distribution at 48 hr after seeding (Figure 1D).
Figure 1.
Characterization of GSC spheroids in 1536-well format. (A) Representative images of 1536-wells seeded with 1000 GSCs cells at the indicated time points obtained by bright-field microscopy and confocal microscopy of live spheroids stained with Hoechst. Scale bars shown represent 100 microns for 10x magnification and 25 microns for 20x magnification images. (B) 3D representation generated by ImageJ from the Z-stack of 1 μm slices of a representative GSC-spheroid after growing for 2 days at 37°C and 5 % CO2. (C) Maximum intensity projection of the Z-stack analysis of a typical GSCs spheroid 2 days after seeding. Each slice is labeled with a different color in order to allow visual resolution of each layer when stacked. (D) Distribution of spheroids by size. Several wells (n = 4) were imaged and the size of every spheroid was calculated by ImageJ and the frequency of the different sizes is plotted.
CellTiter-Glo 3D (Promega) has recently been developed to increase the lytic capacity in organoids and large 3D-spheroid cultures with the goal of improving penetration of aggregated cell cultures providing more uniform signal. To test whether CellTiter-Glo 3D was required for uniform lysis of the GBM spheroids we compared the overall signal using standard CellTiter-Glo and CellTiter-Glo 3D. In this case, no significant differences were observed (Supplementary Figure S2), hence CellTiter-Glo was chosen for further use.
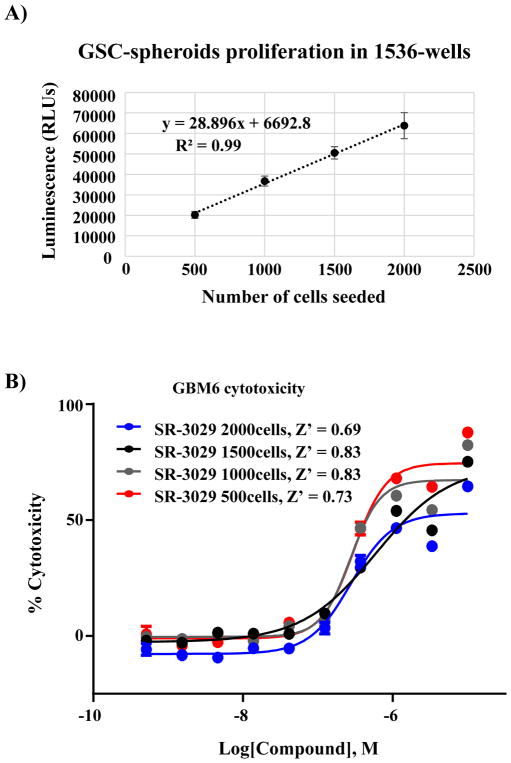
Next, we confirmed the linearity of the luminescence signal as a function of time (37°C) upon seeding GSCs cells at increasing cell densities in clear bottom 1536-well plates. The luminescence signal was linear, consistent with maintenance of a proliferative state under the seeding conditions tested (Figure 2A). We also assessed if cell number or spheroid density altered the EC50 of SR-302925, our pharmacologic control. Using different seeding densities of GSCs cells and a 10-point concentration response curve (CRC) and 1:3-fold serial dilution we determined the EC50 of SR-3029. The calculated EC50 values were similar with acceptable S/B ratio and Z′ values for each cell density tested (Figure 2B). We observed that 1000 or 1500 cells per well consistently produced higher Z′ values over other seeding densities. The final conditions for the assay are described in Table 1.
Figure 2.
Optimization of a GSC-spheroid proliferation assay in ultra-high throughput format. (A) Correlation plot demonstrating linearity of growth and detection based on the number of GSCs cells seeded per well vs. the luminescence readout after 5-day incubation (x and y axes, respectively, n = 192 replicates per data point; error bars in SD) (B) Concentration response curves (CRC) are calculated for reference compound SR-3029 at day 5 as a function of different numbers of GSCs seeded per well. Z′ for each seeding condition is shown (n = 8 replicates per data point; error bars in SEM).
Table 1.
Stepwise Protocol for the 1536-Well Plate 3D GBM Spheroids Cytotoxicity Assay
| Order | Step | Condition | Instrument | Comments |
|---|---|---|---|---|
| 1 | Seed GBM cells | 5 μl per well | FRD (Aurora) | 1000 cells per well |
| 2 | Incubation | 48 hrs | TC incubator (Thermo) | 37°C, 5% CO2 and ~95% humidity |
| 3 | Compound addition | 10 nl per well | Pintool transfer unit (GNF) | Final DMSO concentration 0.15% |
| 4 | Incubation | 72 hrs | TC incubator (Thermo) | 37°C, 5% CO2 and ~95% humidity |
| 5 | Add 5 μl of CellTiter-Glo | 5 μl per well | FRD (Aurora) | |
| 6 | Incubation | 10 min | RT. This allows lysis of cells and the ATP reaction takes place | |
| 7 | Centrifugation | 1000 rpm | Microplate centrifuge | This step ensures elimination of bubbles in the wells |
| 8 | Luminescence Readout | 30s exposure time per plate | ViewLux microplate imager (PerkinElmer) | Top read |
TC, tissue culture.
RT, Room temperature
Pilot screen of the NCI and FDA compound collections
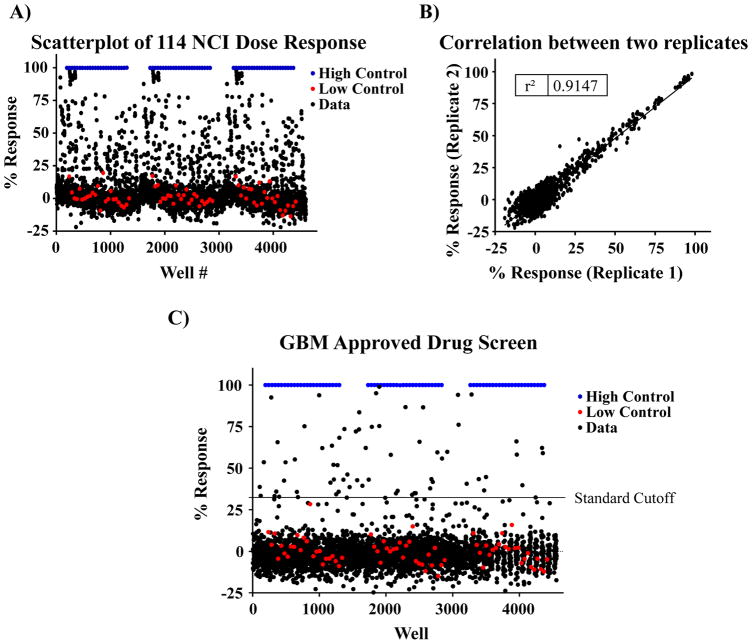
To determine the performance of the optimized assay under automated conditions and to identify interesting drugs that affect this phenotypic assay we screened the NCI (n = 114) and FDA approved drug (n = 3177) compound collections. The NCI collection includes 114 drugs that were assessed as 10-point (1:3 serial dilutions) starting at 5 μM concentration (Figure 3A). This collection was assayed in triplicate and exhibited a Z′ = 0.79±0.04 and S/B ratio =181.3±1.8 confirming assay robustness. In addition, the scatterplot of measurements from replicates yielded a correlation coefficient of r2 = 0.91, indicating high reproducibility between replicates (Figure 3B). We analyzed the CRC for each compound and calculated the EC50. 15 compounds were identified with EC50 values below 1 μM. A detailed table with all hits is included in Supplementary Table S1.
Figure 3.
Pilot screening of the NCI & FDA collection. (A) Scatterplot of the pilot 1536-well cytotoxicity screen of the NCI oncology drug collection on GSCs spheroids. Single point response is plotted. Each plate was tested in triplicate. (B) Representative graph of compound activity values correlating plate replicates. The best-fit line has an r2 = 0.91, indicative of the high fidelity of the GSC-spheroid cytotoxicity assay. (C) Scatterplot of the pilot 1536-well cytotoxicity screen of the FDA approved drug collection on GSCs.
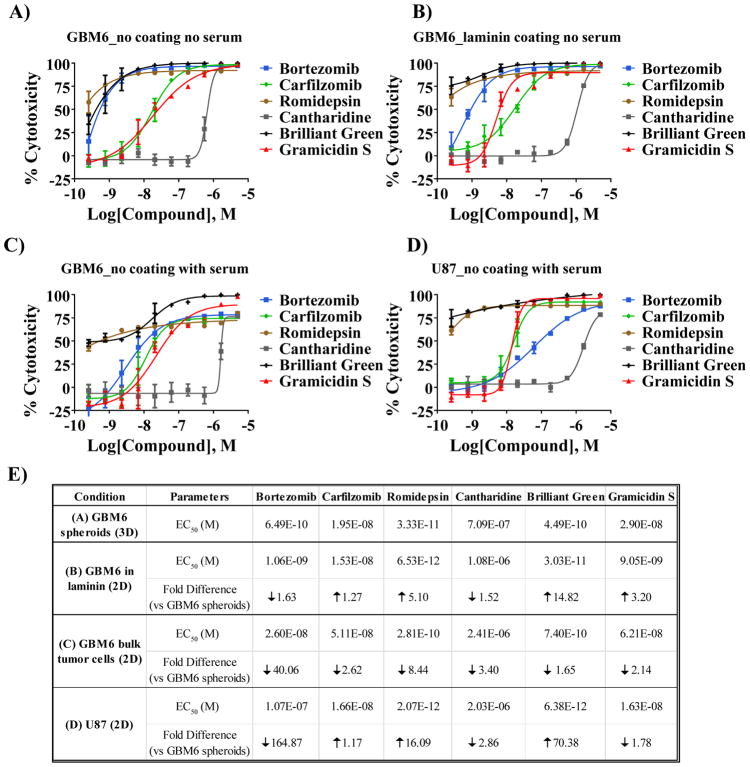
The FDA collection was tested at a single dose (2 μM). The average Z′ of the assay was 0.77±0.02 and the average S/B ratio was 163.5±7.5. The hit cutoff (assay average value +3SD) was calculated as 32.41% response, identifying 66 compounds as hits for the assay (hit rate of the 2%, Figure 3C). Of these, 11 were compounds that overlapped with the NCI collection. Of the 55 remaining compounds, 48 were available commercially. EC50s of the compounds are included in supplementary Table S2. For a select set of compounds we performed CRCs with GBM6 cells or the established glioblastoma cell line U87 grown in different conditions (Figure 4). GBM6 cells were cultured, without coating agent, following the screening protocol (3D, Figure 4A), on laminin (2D, Figure 4B) or in the presence of serum in order to differentiate the GSCs and generate the bulk tumor cells (Figure 4C). A differential response to the compounds was observed depending on the cell type and also on the condition the GBM6 were cultured (Figure 4E). In particular, Bortezomib was observed to be more potent against GBM6 GSCs (GBM6 spheroids or in laminin) than against the differentiated GBM6 (bulk tumor) or the U87 cell line, suggesting Bortezomib may specifically affect the master regulators of the GSCs.
Figure 4.
Analysis of selected compounds from 1536-well pilot screening of the NCI and FDA collections on GBM6 and U87 cells under different culture conditions. Various concentrations of selected compounds (10-point, 1:3 serial dilutions, starting at 5 μM concentration) were used to treat GBM6 spheroids grown on 3D (A), GBM6 grown on laminin-coated plates in order for them to grow on 2D (B), GBM6 differentiated using 10% FCS-containing medium (C) or the established glioblastoma cell line U87 (D). (E) A summary of the LogEC50 of the different conditions for each indicated cell type and condition is presented including the fold difference of the EC50 of each condition vs the condition that was used for the screening (GBM6 spheroids grown on 3D) is included in the table on the right.
In summary, the inability of current therapies to effectively treat GBM emphasizes the need for additional approaches to identify new vulnerabilities in GBM. Inhibiting self-renewal of GSCs is a promising therapeutic strategy although targeting GSCs pharmacologically has proven challenging. We report here the development of a patient derived GSC, 3D-spheroid, ultra-high throughput and automation friendly proliferation assay that is amenable for large scale HTS. We anticipate that a HTS-campaign using this assay combined with downstream selectivity assays, for example a neural progenitor cell proliferation assay would provide an unbiased approach to identify small molecule compounds that selectively inhibit the proliferation of GSCs. Identifying compounds that selectively block GSC proliferation would provide highly valuable tools to facilitate chemical biology approaches to identify and validate targets essential for GSC maintenance.
Supplementary Material
Acknowledgments
We thank Pierre Baillargeon and Lina Deluca at Scripps for their help with compound management.
FUNDING
Research reported in this publication was supported by the National Cancer Institute of the National Institutes of Health under Award Number R33CA206949 and support for VQ was provided by a fellowship from FCBTR/ABC2 Brain Tumor Grants Program.
Footnotes
DECLARATION OF CONFLICTING INTERESTS
The authors declared no potential conflicts of interest with respect to the research, authorship, and/or publication of this article.
References
- 1.Stupp R, Taillibert S, Kanner AA, et al. Maintenance Therapy With Tumor-Treating Fields Plus Temozolomide vs Temozolomide Alone for Glioblastoma: A Randomized Clinical Trial. JAMA. 2015;314(23):2535–43. doi: 10.1001/jama.2015.16669. [DOI] [PubMed] [Google Scholar]
- 2.Lai A, Tran A, Nghiemphu PL, et al. Phase II study of bevacizumab plus temozolomide during and after radiation therapy for patients with newly diagnosed glioblastoma multiforme. J Clin Oncol. 2011;29(2):142–8. doi: 10.1200/JCO.2010.30.2729. [DOI] [PMC free article] [PubMed] [Google Scholar]
- 3.Thakkar JP, Dolecek TA, Horbinski C, et al. Epidemiologic and molecular prognostic review of glioblastoma. Cancer Epidemiol Biomarkers Prev. 2014;23(10):1985–96. doi: 10.1158/1055-9965.EPI-14-0275. [DOI] [PMC free article] [PubMed] [Google Scholar]
- 4.Demuth T, Berens ME. Molecular mechanisms of glioma cell migration and invasion. J Neurooncol. 2004;70(2):217–28. doi: 10.1007/s11060-004-2751-6. [DOI] [PubMed] [Google Scholar]
- 5.Singh SK, Hawkins C, Clarke ID, et al. Identification of human brain tumour initiating cells. Nature. 2004;432(7015):396–401. doi: 10.1038/nature03128. [DOI] [PubMed] [Google Scholar]
- 6.Galli R, Binda E, Orfanelli U, et al. Isolation and characterization of tumorigenic, stem-like neural precursors from human glioblastoma. Cancer Res. 2004;64(19):7011–21. doi: 10.1158/0008-5472.CAN-04-1364. [DOI] [PubMed] [Google Scholar]
- 7.Furnari FB, Fenton T, Bachoo RM, et al. Malignant astrocytic glioma: genetics, biology, and paths to treatment. Genes Dev. 2007;21(21):2683–710. doi: 10.1101/gad.1596707. [DOI] [PubMed] [Google Scholar]
- 8.Lu C, Shervington A. Chemoresistance in gliomas. Mol Cell Biochem. 2008;312(1–2):71–80. doi: 10.1007/s11010-008-9722-8. [DOI] [PubMed] [Google Scholar]
- 9.Lathia JD, Mack SC, Mulkearns-Hubert EE, et al. Cancer stem cells in glioblastoma. Genes Dev. 2015;29(12):1203–17. doi: 10.1101/gad.261982.115. [DOI] [PMC free article] [PubMed] [Google Scholar]
- 10.Bao S, Wu Q, McLendon RE, et al. Glioma stem cells promote radioresistance by preferential activation of the DNA damage response. Nature. 2006;444(7120):756–60. doi: 10.1038/nature05236. [DOI] [PubMed] [Google Scholar]
- 11.Suva ML, Rheinbay E, Gillespie SM, et al. Reconstructing and reprogramming the tumor-propagating potential of glioblastoma stem-like cells. Cell. 2014;157(3):580–94. doi: 10.1016/j.cell.2014.02.030. [DOI] [PMC free article] [PubMed] [Google Scholar]
- 12.Zhu Z, Khan MA, Weiler M, et al. Targeting self-renewal in high-grade brain tumors leads to loss of brain tumor stem cells and prolonged survival. Cell Stem Cell. 2014;15(2):185–98. doi: 10.1016/j.stem.2014.04.007. [DOI] [PubMed] [Google Scholar]
- 13.Spencer DA, Auffinger BM, Murphy JP, et al. Hitting a Moving Target: Glioma Stem Cells Demand New Approaches in Glioblastoma Therapy. Curr Cancer Drug Targets. 2017;17(3):236–254. doi: 10.2174/1568009616666161215161924. [DOI] [PubMed] [Google Scholar]
- 14.Xu X, Farach-Carson MC, Jia X. Three-dimensional in vitro tumor models for cancer research and drug evaluation. Biotechnol Adv. 2014;32(7):1256–68. doi: 10.1016/j.biotechadv.2014.07.009. [DOI] [PMC free article] [PubMed] [Google Scholar]
- 15.Goodman TT, Ng CP, Pun SH. 3-D tissue culture systems for the evaluation and optimization of nanoparticle-based drug carriers. Bioconjug Chem. 2008;19(10):1951–9. doi: 10.1021/bc800233a. [DOI] [PMC free article] [PubMed] [Google Scholar]
- 16.Hothi P, Martins TJ, Chen L, et al. High-throughput chemical screens identify disulfiram as an inhibitor of human glioblastoma stem cells. Oncotarget. 2012;3(10):1124–36. doi: 10.18632/oncotarget.707. [DOI] [PMC free article] [PubMed] [Google Scholar]
- 17.Pollard SM, Yoshikawa K, Clarke ID, et al. Glioma stem cell lines expanded in adherent culture have tumor-specific phenotypes and are suitable for chemical and genetic screens. Cell Stem Cell. 2009;4(6):568–80. doi: 10.1016/j.stem.2009.03.014. [DOI] [PubMed] [Google Scholar]
- 18.Rahman M, Reyner K, Deleyrolle L, et al. Neurosphere and adherent culture conditions are equivalent for malignant glioma stem cell lines. Anat Cell Biol. 2015;48(1):25–35. doi: 10.5115/acb.2015.48.1.25. [DOI] [PMC free article] [PubMed] [Google Scholar]
- 19.Giannini C, Sarkaria JN, Saito A, et al. Patient tumor EGFR and PDGFRA gene amplifications retained in an invasive intracranial xenograft model of glioblastoma multiforme. Neuro Oncol. 2005;7(2):164–76. doi: 10.1215/S1152851704000821. [DOI] [PMC free article] [PubMed] [Google Scholar]
- 20.Carlson BL, Pokorny JL, Schroeder MA, et al. Establishment, maintenance and in vitro and in vivo applications of primary human glioblastoma multiforme (GBM) xenograft models for translational biology studies and drug discovery. Curr Protoc Pharmacol. 2011;Chapter 14(Unit 14):16. doi: 10.1002/0471141755.ph1416s52. [DOI] [PMC free article] [PubMed] [Google Scholar]
- 21.Azari H, Millette S, Ansari S, et al. Isolation and expansion of human glioblastoma multiforme tumor cells using the neurosphere assay. J Vis Exp. 2011;(56):e3633. doi: 10.3791/3633. [DOI] [PMC free article] [PubMed] [Google Scholar]
- 22.Jin X, Jin X, Jung JE, et al. Cell surface Nestin is a biomarker for glioma stem cells. Biochem Biophys Res Commun. 2013;433(4):496–501. doi: 10.1016/j.bbrc.2013.03.021. [DOI] [PubMed] [Google Scholar]
- 23.Gangemi RM, Griffero F, Marubbi D, et al. SOX2 silencing in glioblastoma tumor-initiating cells causes stop of proliferation and loss of tumorigenicity. Stem Cells. 2009;27(1):40–8. doi: 10.1634/stemcells.2008-0493. [DOI] [PubMed] [Google Scholar]
- 24.Garros-Regulez L, Aldaz P, Arrizabalaga O, et al. mTOR inhibition decreases SOX2-SOX9 mediated glioma stem cell activity and temozolomide resistance. Expert Opin Ther Targets. 2016;20(4):393–405. doi: 10.1517/14728222.2016.1151002. [DOI] [PMC free article] [PubMed] [Google Scholar]
- 25.Bibian M, Rahaim RJ, Choi JY, et al. Development of highly selective casein kinase 1delta/1epsilon (CK1delta/epsilon) inhibitors with potent antiproliferative properties. Bioorg Med Chem Lett. 2013;23(15):4374–80. doi: 10.1016/j.bmcl.2013.05.075. [DOI] [PMC free article] [PubMed] [Google Scholar]
Associated Data
This section collects any data citations, data availability statements, or supplementary materials included in this article.


