

Abstract
Micron-scale, coexisting liquid-ordered (Lo) and liquid-disordered (Ld) phases are straightforward to observe in giant unilamellar vesicles (GUVs) composed of ternary lipid mixtures. Experimentally, uniform membranes undergo demixing when temperature is decreased: domains subsequently nucleate, diffuse, collide, and coalesce until only one domain of each phase remains. The sizes of these two domains are limited only by the size of the system. Under different conditions, vesicles exhibit smaller-scale domains of fixed sizes, leading to the question of what sets the length scale. In membranes with excess area, small domains are expected when coarsening is hindered or when a microemulsion or modulated phase arises. Here, we test predictions of how the size, morphology, and fluorescence levels of small domains vary with the membrane’s temperature, tension, and composition. Using GUVs and cell-derived giant plasma membrane vesicles, we find that 1) the characteristic size of domains decreases when temperature is increased or membrane tension is decreased, 2) stripes are favored over circular domains for lipid compositions with low energy per unit interface, 3) fluorescence levels are consistent with domain registration across both monolayer leaflets of the bilayer, and 4) small domains form in GUVs composed of lipids both with and without ester-linked lipids. Our experimental results are consistent with several elements of current theories for microemulsions and modulated phases and inconsistent with others, suggesting a motivation to modify or enhance current theories.
Introduction
Coexisting liquid phases are found within membrane systems that are as simple as three-component lipid vesicles and as complex as protein-rich vacuole membranes within living yeast cells (1, 2, 3, 4). These phases, named liquid ordered (Lo) and liquid disordered (Ld (5)), are enriched in lipids with high and low melting temperatures, respectively (3, 6, 7). When phase separation occurs in a vesicle, liquid domains nucleate, diffuse, collide, and coalesce until only one domain of each phase persists (Fig. 1, A–C; (3, 8, 9)). In this case, the size of the domain is limited only by the size of the vesicle.
Figure 1.

Schematic of ternary GUVs. Above Tmix, all lipids mix uniformly within the membrane (A and E). (B) In a membrane with no significant excess area, a decrease in temperature below Tmix causes domains of Lo and Ld phases to nucleate on the surface of the GUV. (C) Domains diffuse and coarsen until only one domain of each type remains, even after subsequent deflation (D). (F and G) In a membrane with significant excess area, small domains can appear due to either hindered coarsening or a transition to a single phase of a microemulsion or modulated phase. (H) When excess area of the flaccid membrane is removed, domains of Lo and Ld phases may coarsen (8).
However, under some conditions, domains are much smaller than the size of the vesicle. Here, we explore how membrane physical parameters can be tuned to adjust the characteristic length scales of micron-scale domains in lipid membranes. The length scales that define rafts, which are described as submicrometer clusters of distinct lipids and proteins within cell membranes (10), may be determined by some of these same parameters.
Micron-scale domains are typically classified in three ways depending on their spatial autocorrelation, . An excellent recent review of the topic is by Schmid (11). Membranes near a miscibility critical point are characterized by a that behaves as (ξ/r)1/2e−r/ξ, where ξ is the correlation length, as in Fig. 2 B. Mechanisms of adjusting length scales in model and cell-derived membranes near a critical point (e.g., adjusting temperature and pinning sites) are extensively discussed elsewhere (12, 13, 14). Here, our focus is on mechanisms leading to modulated phases and microemulsions.
Figure 2.

Schematic of four types of membrane behavior. (A) Domains in a GUV exhibiting two liquid phases eventually merge into one large domain. (B) GUVs exhibiting critical fluctuations produce a that behaves as (ξ/r)1/2e−r/ξ. (C) A modulated phase yields an oscillating bounded by a slow decay, e.g., a power law. (D) A microemulsion yields an oscillating bounded by a fast decay, e.g., an exponential.
A modulated phase is characterized by an oscillating bounded by a slow decay, for example, a power law decay due to fluctuations (15), as in Fig. 2 C. A microemulsion’s also oscillates, but is bounded by a fast (e.g., exponential) decay as in Fig. 2 D (16, 17, 18). Both a modulated phase and a microemulsion yield a peak at nonzero wavevector in the structure factor obtained by Fourier transform of . The designation of modulated phase versus microemulsion does not determine the mechanism by which the phase forms. Similarly, the designation does not determine if domains are rounded (which we will call dots) or elongated (which we will call stripes). In the experimental literature, the term “modulated phase” has sometimes been used to describe all micron-scale domains in vesicles, even if those domains may arise from a microemulsion.
Here, we observe small domains in membranes of giant unilamellar vesicles (GUVs) and giant plasma membrane vesicles (GPMVs). The GUVs are made from synthetic mixtures of lipids, and we establish a slight excess area and asymmetry in the vesicle membrane by delivering lipids to the outer leaflet of GUVs via cyclodextrin. GPMVs are derived directly from the plasma membranes of live cells and are composed of a rich complement of cellular lipids and proteins. We then evaluate characteristic length scales and fluorescence levels in both systems to test proposed mechanisms of modulated phases and microemulsions. Two characteristic length scales can be assessed: the width of domains and the distance from the center of one domain to the center of the nearest neighbor.
Methods
GUV electroformation
Phosphocholine (PC) lipids (Avanti Polar Lipids, Alabaster, AL), cholesterol (chol; Sigma Aldrich, St. Louis, MO), and Texas Red dihexadecanoyl-PE (DHPE; Life Technologies, Grand Island, NY) were used as purchased without further purification. GUVs 10–100 μm in diameter were electroformed in 200–300 mM sucrose (19). Specifically, 0.25 mg of lipids in stock solutions were spread evenly on slides coated with indium tin oxide. Lipid stock solutions in chloroform typically contained diphytanoylphosphatidylcholine (DiPhyPC; 4 ME 16:0 PC), dipalmitoylphosphatidylcholine (DPPC; 16:0 PC), cholesterol, and 0.8 mol% Texas Red DHPE, a dye that selectively partitions to the Ld phase. One set of experiments used PC lipids in which the typical ester linkages were replaced by ether linkages (4 ME 16:0 diether PC and 16:0 diether PC). In all cases, lipid-coated slides were placed under vacuum for >30 min to evaporate the chloroform. A capacitor was created by sandwiching 0.3 mm Teflon spacers between two lipid-coated slides, filling the gap with sucrose solution, and sealing the edges with vacuum grease. An AC voltage of 10 Hz and 1.5 V was applied across the capacitor for 1 hr at 60°C. The resulting GUVs were diluted 10-fold in 200–300 mM glucose solution and stored at 60°C for ≤2 hr before use. Immediately before imaging using a TE-2000-s inverted epifluorescence microscope (Nikon, Melville, NY), GUV solutions were further diluted twofold in glucose solution in a glass-bottomed chamber on the microscope stage. Images were captured through an air objective using a Photometrics CoolSnapFX camera (Photometrics, Tucson, AZ) at a resolution of 0.17 μm/pixel and manipulated using ImageJ (https://imagej.nih.gov/ij/). To preserve the fidelity of the data, manipulation of images was limited to adjusting overall brightness or implementing linear (γ = 1) contrast enhancements.
DPPC-loaded HPαCD
Vesicles of DPPC lipids were produced by hydration in 200–300 mM glucose. Specifically, a mass of 10.3 mg of DPPC in chloroform was dried evenly on the walls of glass test tubes. The tubes were placed under vacuum for >30 min to evaporate the chloroform. A solution of 1 mL of 200–300 mM glucose was introduced to the tubes at 60°C and allowed to sit for ∼20 min so that DPPC vesicles formed. Solid hydroxypropyl-α-cyclodextrin (HPαCD; Sigma Aldrich) was added to the resulting vesicle solution to a concentration of 70 mM. The solution was stirred at 60°C for 2 hr before use.
GUVs with small length scales
Control images were collected of GUVs that had settled to the bottom of the imaging chamber. The Ld phase is enriched in the dye and appears bright; the Lo phase appears dark. Next, 30 μL of DPPC-loaded HPαCD solution was added to the GUV solution and equilibrated for ∼5 min. The HPαCD presumably inserts its cargo of DPPC into the outer leaflet of the GUVs, establishing a difference in area between the outer and inner leaflets. The resulting change in lipid composition appears to be minimal. We tracked the fraction of membrane area that appears dark in three GUVs of 35/35/30 DiPhyPC/DPPC/cholesterol; this fraction increased by only 4.3 ± 0.9% after treatment with DPPC-loaded HPαCD. To estimate the corresponding maximal change in mole fraction of any one of the lipids, we scaled the percent change in area fraction by the length of the longest possible tie-line for membranes of DiPhyPC/DPPC/cholesterol at 22°C (20), propagating the largest standard deviations in all cases. This process yields an upper bound of 3.9 mol %. Propagation of the smallest standard deviations yields 2.0 mol %. Area fractions were determined as described in the Supporting Materials and Methods.
Within 5 min of introduction of the DPPC-loaded HPαCD, vesicle membranes that had previously exhibited Lo-Ld phase separation acquired features with smaller length scales. These features persisted throughout the duration of experiments (≤1 hr). For example, Fig. 3 illustrates that round domains in a GUV of 35/35/30 DiPhyPC/DPPC/cholesterol evolve into dots and meandering stripes with widths <10 μm. A similar technique was employed previously by researchers who introduced glycolipid micelles to vesicle solutions and observed stripes nucleating from Lo and Ld domains, followed by scission of the stripes into dots (21).
Figure 3.

Insertion of DPPC into the outer leaflet of a GUV with large domains of coexisting Lo and Ld phases induces the formation of dots and meandering stripes with smaller widths. Micrographs are vesicles of 35:35:30 DiPhyPC/DPPC/cholesterol at room temperature (A) before and (B) after addition of 70 mM DPPC-loaded HPαCD. The miscibility transition temperature of this lipid composition is ∼46°C.
GUV temperature
For experiments in which temperature was adjusted, GUV solutions were placed between coverslips, and coverslip edges were sealed with vacuum grease. Heat sink grease (Omega, Stamford, CT) thermally coupled the coverslip assembly to a home-built temperature stage on an upright Y-FL Nikon microscope (Nikon). An Alpha-Omega Instruments Corporation (Cumberland, RI) temperature controller drove a thermoelectric heater/cooler. Temperature was sensed by a thermistor probe (0.2°C accuracy; Sensor Scientific, Fairfield, NJ). Unless otherwise noted, temperature was adjusted stepwise, and thermal equilibrium was reached after each step.
GUV osmotic pressure
For experiments in which osmotic pressure was adjusted, GUVs were formed in 300 mM sucrose solutions and diluted in 300 mM glucose solutions. To increase membrane tension (and decrease excess area), water was added to dilute the outside solution to 250 mM glucose. To decrease membrane tension (and increase excess area), a solution of 1 M glucose was added to increase the concentration of the outside solution to 350 mM glucose. To minimize movement of vesicles, solutions were not stirred. Hence, solution concentrations likely vary through space and time.
Cell culture and GPMV isolation
Madin Darby canine kidney (MDCK) cells were maintained in Dulbecco’s modified Eagle’s medium supplemented with 10% fetal calf serum, 2 mM glutamine, 100 units/mL penicillin, and 100 μg/mL streptomycin at 37°C in humidified CO2. Before isolation, cell membranes were labeled with 5 μg/mL of the fluorescent disordered phase marker FAST DiO (Dilinoleyloxacarbocyanine; Life Technologies) for 10 min on ice. GPMVs were isolated and imaged as previously described (22). Briefly, cells were washed in GPMV buffer (10 mM HEPES, 150 mM NaCl, 2 mM CaCl2 (pH 7.4)) and then incubated with GPMV buffer supplemented with 25 mM paraformaldehyde and 2 mM dithiothreitol for 1 hr at 37°C. A fraction of GPMVs derived from MDCK cells exhibit stripes and dots without any addition of lipids to the outer leaflet, as shown in Fig. 4. A similar diversity of morphologies has been reported in GPMVs derived from zebrafish cells (23).
Figure 4.
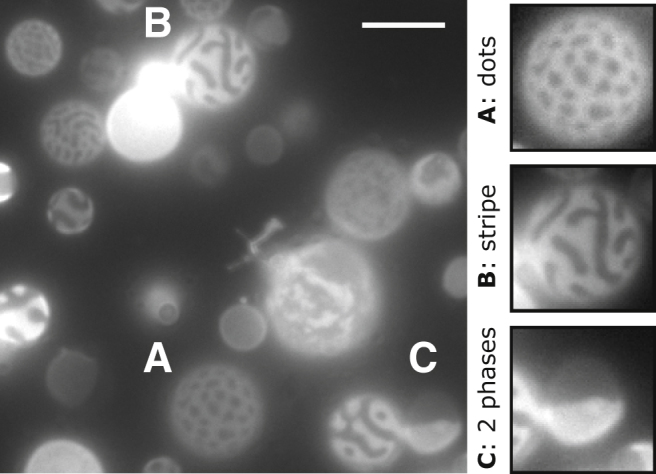
A field of GPMVs derived from MDCK cells in an isotonic buffer solution. This micrograph contains examples of dots (A), stripes (B), and coexisting Lo and Ld phases (C). Scale bars, 10 μm.
GPMV temperature
For experiments in which temperature was adjusted, GPMVs were imaged as previously described in detail (24). Briefly, a small chamber was created using silicon grease between two coverslips. The bottom coverslip was coated with bovine serum albumin, and 5 μL of GPMV solution were placed into this chamber and allowed to deposit onto the bovine serum albumin-coated coverslip. This chamber was then attached to the stage of a Warner (Hamden, CT) temperature regulator and cooled to 8°C for ∼5–10 min until most vesicles had undergone phase separation. Temperature was then raised in increments, and images were collected ∼1 min after the desired temperature was reached (unless otherwise noted) to allow the sample to reach thermal equilibrium.
GPMV osmotic pressure
For experiments in which osmotic pressure was adjusted, a chamber was created by attaching a small, hollow plastic cylinder (specifically, a cloning ring) to a coverslip-bottom cell culture dish (MatTek, Ashland, MA), leaving the top open. 100 μL of GPMV solution was placed into this chamber, and GPMVs were allowed to settle to the surface of the coverslip for 20 min at 8°C, with the temperature controlled as in the previous section. To lower the osmolarity of the exterior solution, cold water was added to the chamber in 5 μL increments. To increase the osmolarity, a solution of 1 M NaCl was added to achieve a final concentration of 300 mM NaCl. GPMVs were imaged after each addition. To minimize movement of GPMVs, solutions were not stirred. Hence, solution concentrations likely vary with space and time.
Image analysis
The method of measuring area fractions, the analysis of one-dimensional autocorrelation functions (1D ), and the fast Fourier transform of to yield the structure function, (including Python scripts used to calculate and ) appear in the Supporting Materials and Methods.
Results
The characteristic length scale is inversely related to temperature
To put our results in context, we will review a few aspects of phase-separated membranes. As temperature increases in a GUV in which Lo and Ld phases coexist, the ratios of the lipids in the two phases become more similar (20). Consequently, the line tension between the Lo and Ld phases decreases. In other words, the energetic cost of forming an interface between the two phases decreases as temperature approaches the miscibility transition.
Now we consider a vesicle with significant excess area, which means that the vesicle has more membrane than is needed to cover a sphere with the same volume. As shown in Figs. 3 and 4, dots and stripes appear in GUVs exposed to DPPC-loaded cyclodextrin (which inserts DPPC lipids into the outer leaflet) and in GPMVs derived from MDCK cells. Figs. 5 and 6 illustrate that as temperature increases in GUV and GPMV membranes with excess area, large domains transform into smaller domains. When these small domains are stripes, their wavelengths decrease with increasing temperature. In other words, the total length of the interface increases. In Fig. 5, the apparent hysteresis of the GUV at 21 and 24°C is a result of rapid temperature cycling. When temperature is held for several minutes, no hysteresis is observed (Fig. S1). For a closed vesicle, an increase in temperature is accompanied by an increase in the surface to volume ratio, decreasing membrane tension (25).
Figure 5.

The characteristic wavelength of stripes decreases as a function of temperature in GUVs composed of 35:35:30 DiPhyPC/DPPC/cholesterol treated with DPPC-loaded HPαCD. (A) The same GUV is shown in all panels. Scale bars, 20 μm. (B) An enlargement of the dashed box at 28°C in (A) is shown. (C) A 1D autocorrelation of the image in (B) is shown, performed in the x-direction perpendicular to the stripes. Five maxima (squares) are fit to an exponential curve (dot-dashed line) and a power law (light line), yielding R2 coefficients of 0.999 and 0.998, respectively. The camera resolution is 0.17 μm/pixel. Images with asterisks were analyzed by 1D Fourier transforms as in Fig. 6 and used in Fig. 7. To see this figure in color, go online.
Figure 6.

The characteristic wavelength of stripes decreases as a function of temperature for GPMVs derived from MDCK cells. (A) Micrographs of a single GPMV from 8 to 16°C are shown. Scale bars, 10 μm. (B) A 1D autocorrelation of the area in the dashed box at 16°C is shown, performed in the y-direction, perpendicular to the stripes. Five maxima (squares) are fitted to an exponential curve and a power law, yielding similar R2 coefficients. (C) Structure function of the in (B). The peak in corresponds to the characteristic wavelength, which is 0.89 ± 0.08 μm at 16°C, at which the uncertainty is half the length of a pixel. The camera resolution is 0.16 μm/pixel. To see this figure in color, go online.
We quantify the characteristic wavelength of stripes by computing and of images. The characteristic wavevector (k) appears as a peak in . For example, the image at 16°C in Fig. 6 A yields the in Fig. 6 C, which has a peak corresponding to a characteristic wavelength of 0.89 ± 0.08 μm. Fig. 7, A and B show that wavelengths decrease with temperature for both GUVs and GPMVs. Each wavelength corresponds to the summed widths of one dark stripe and one white stripe, for which the width of a dark stripe corresponds to wavelength minus the width of the bright stripe. The width of the bright stripe corresponds to the half-width of the first peak in the . The widths of both the dark and bright stripes decrease with temperature for both GUVs and GPMVs (Fig. 7, C and D).
Figure 7.

Characteristic wavelengths and stripe widths decrease with increasing temperature. (A) and (C) correspond to the single GUV in Fig. 5 (using only images marked with asterisks). (B) and (D) correspond to the single GPMV in Fig. 6 (excluding the out-of-focus image at 10°C). Wavelengths and uncertainties were found as described in Fig. 6, and an uncertainty corresponding to half a pixel is shown. The decrease in stripe width is not necessarily expected to be linear with temperature, but if it were, then slopes of −0.08 ± 0.01 μm/°C in (A) and −0.14 ± 0.18 μm/°C in (B) would emerge. and for each point in (A) and (B) are shown in Figs. S3 and S4, respectively.
Figs. 5 C and 6 B illustrate that when micron-scale domains are wrapped on a sphere with diameter ∼10 μm, the distinction between a modulated phase and microemulsion is difficult to assess from a single image. Visually, the small-scale stripes in Figs. 5 A and 6 A are more reminiscent of simulations of a modulated phase (see Fig. 3 of (18)). However, within uncertainty, the autocorrelation functions in Figs. 5 C and 6 B are equally well bounded by a function that decays with a power law, as a modulated phase would, and with an exponential, as a microemulsion would. Although it is beyond the scope of this work, researchers could plausibly differentiate between modulated phases and microemulsions by collecting a series of images over time of a stationary vesicle exhibiting small domains and then could compute the average of the Fourier-transformed images for each wave vector. If the domains were due to a microemulsion, then the averaged Fourier coefficients would approach zero even for those wave vectors at which the structure factor exhibits a peak. If the average of those Fourier coefficients were nonzero, then the domains would be due to a modulated phase (18, 26). Alternatively, researchers who specialize in tethering membranes to flat surfaces may be able to observe small-scale domains if the tethers allow undulations in the membrane. By imaging large areas approaching infinite sheets, stripes could be narrowly defined as uniform lines with a common director, and deviations from this ideal morphology could be characterized by the density of branching points or the persistence length of the director. Independent of whether the vesicles that we investigate exhibit a modulated phase or a microemulsion, we test how the length scales in the system vary with physical parameters to evaluate theoretical predictions associated with mechanisms of the formation of small domains.
The characteristic length scale increases with membrane tension
Small-scale domains appear in vesicle membranes with excess area. Fig. S2 shows that increasing membrane excess area in a population of GPMVs through changes in osmotic pressure increases the fraction of GPMVs displaying features with small domains. Here, we test how changes in membrane tension affect the characteristic length scale of domains. We increase the osmotic pressure of the solution on the exterior of GUVs and GPMVs (which should decrease membrane tension (27)), and we observe a decrease in the size of domains in both GUVs (Fig. 8 A) and GPMVs (Fig. 9 A). Reversing the osmotic pressure difference reverses the effect (Figs. 8 B and 9 B). The same trend has been observed via micropipette aspiration of GUVs (P. Cicuta and L. Parolini, personal communication).
Figure 8.

Widths of domains increase with membrane tension for GUVs of 35:35:30 DiPhyPC/DPPC/cholesterol treated with DPPC-loaded HPαCD. (A) Over time, the osmotic pressure of the exterior glucose solution is increased by 50 mM such that the membrane tension presumably decreases. (B) Over time, the osmotic pressure of the exterior solution is decreased by 50 mM such that the membrane tension presumably increases. Scale bars, 20 μm.
Figure 9.

Widths of domains increase with membrane tension for GPMVs derived from MDCK cells. (A) Over time, the osmotic pressure of the exterior solution is increased by raising the concentration of NaCl by 150 mM such that the membrane tension should decrease. (B) Over time, the osmotic pressure of the exterior solution is decreased by adding water. Scale bars, 10 μm.
Figs. 8 A and 9 A show the evolution of vesicles from Lo and Ld phases to elongated stripes and then from stripes to dots. The same sequence occurs in vesicles in contact with surfaces (28). Separately, the first image in Fig. 8 B shows that stripes can appear on surfaces of vesicles that are ≥100 μm in diameter; other researchers have suggested that modulated phases appear only in vesicles with a diameter smaller than ∼50 μm, albeit in a simulation (29).
Domain morphology varies with GUV lipid composition
The morphology of a modulated phase or microemulsion (e.g., the arrangement of dark and bright areas into stripes or dots) is dependent on the membrane’s curvature and lipid composition (21, 30, 31). Here, we investigate a series of GUVs that initially exhibit coexisting Lo and Ld phases. Their overall lipid compositions lie at the numbered points on the arrow in Fig. 10. To induce the formation of stripes and dots, we introduce additional DPPC molecules to the GUV outer leaflet via cyclodextrin. As described in the methods, treatment of vesicles with DPPC-loaded HPαCD results in a change of area fraction of only 4.3 ± 0.9%, so we expect perturbations in overall lipid composition to be minor.
Figure 10.

The ratio of lipids in vesicles influences the morphology of small-scale membrane domains. (A) A Gibbs phase triangle for DiPhyPC/DPPC/cholesterol vesicles with no excess area is shown. The shaded area corresponds to compositions that exhibit Lo-Ld coexistence at 22°C, reproduced from (20). The black line connecting the circles denotes a tie-line at 22°C. (B) Micrographs of GUVs with initial lipid compositions corresponding to the numbers along the arrow in (A) are shown. The GUVs were treated with DPPC-loaded HPαCD. The resulting morphologies include stripes (at compositions 1, 2, and 3) and dots (compositions 4, 5, and 6).
The arrow in Fig. 10 is roughly perpendicular to the tie-line that passes through 40% DiPhyPC, 40% DPPC, and 30% cholesterol at 22°C (20). The length of a tie-line reflects the difference in compositions of the Lo and Ld phases within a membrane. When a vesicle’s overall lipid composition falls on a short tie-line, differences in the physical properties of the Ld and Lo phases (e.g., the bending rigidities and the thicknesses) are minor, and the line tension between the Lo and Ld phases is small (32, 33, 34). For example, in Fig. 10 A, point 1 lies near a miscibility critical point. Vesicles made from the lipid composition at point 1 demix along a short tie-line into Lo and Ld phases of similar compositions. When DPPC is inserted into the outer leaflet of these vesicles, stripes appear (Fig. 10 B). On the other hand, when a vesicle’s overall lipid composition falls on a long tie-line, differences in the lipid compositions and physical properties of the Lo and Ld phases become significant, and the line tension is large. Examples appear at points 4, 5, and 6 in Fig. 10 A. When DPPC is inserted into the outer leaflet of these vesicles, dots appear (Fig. 10 B). In our experiments, we achieve low line tension between Lo and Ld phases by adjusting the ratio of the three membrane components; other researchers have achieved this effect by gradually replacing one of the three components with a fourth component (30, 35, 36, 37).
If we instead produce a series of initial GUVs with lipid compositions that lie along a single tie-line (rather than perpendicular to it), then we expect the compositions of the Ld and Lo phases to remain constant and the area fraction of the phases to vary, assuming that area fractions are approximately linearly related to mole fractions. For example, as the overall lipid composition changes from points 1 through 4 in Fig. 11 A, the membrane’s area fraction of the dark, Lo phase should linearly increase. When DPPC is inserted into the outer leaflet of this series of vesicles, small dots and stripes appear, and the fraction of the membrane area that appears dark linearly increases (Fig. 11, B and C).
Figure 11.

(A) Gibbs phase triangle for DiPhyPC/DPPC/cholesterol vesicles without excess area. The shaded area highlights lipid ratios that exhibit Lo-Ld coexistence at 22°C (20). The black line connecting the circles denotes a tie-line at 22°C (20). (B) GUVs with Lo and Ld phases were made from the four lipid ratios along the tie-line in (A). After the GUVs were treated with DPPC-loaded HPαCD to have excess area, the GUVs exhibited small dots and stripes, as shown in the micrographs. Scale bars, 20 μm. The area fraction of dark membrane increases monotonically for the four vesicles in the micrographs. (C) Likewise, the area fraction of dark membrane increases monotonically for a population of vesicles (data from Fig. S5). The lipid ratio on the x-axis is the fractional length along a tie-line. The tie-line and its uncertainty are described in (24). (D) If a constant wavelength of membrane fluctuation is assumed within the Schick model (16), then the area fraction of membrane that appears dark would be expected to vary with the sawtooth pattern in (E). To see this figure in color, go online.
Discussion
Our results create an opportunity to evaluate proposed mechanisms of how stable, small (albeit micrometer-scale) domains arise in vesicle membranes. These mechanisms were recently reviewed by Schmid (11). Several mechanisms do not apply to our experiments. For example, our GUV system is not consistently close to a miscibility critical point (12, 20, 32). Similarly, our GUVs lack hybrid lipids that might act as lineactants (38, 39), and small length scales arise equally in vesicles with and without hybrid lipids (36). Because GUVs are synthetic vesicles rather than plasma membranes of living cells, our systems are not subject to membrane recycling (40, 41), cytoskeletal coupling (13, 14, 42, 43), or mismatch between monolayer curvature and the curvature imposed by a rigid cell wall (44). Moreover, because our vesicles initially exhibit large-scale coexisting Lo and Ld phases before we introduce DPPC to the outer leaflet, the small-scale features we observe are not due to trapped coarsening (8, 25, 45, 46, 47), which is depicted in Fig. 1, E–G. They are also not due to the kinetic effect of viscous fingering (3).
Remaining proposed mechanisms include coupling of local lipid composition to either monolayer or bilayer spontaneous curvature (16, 17, 18, 21, 31, 47, 48, 49, 50, 51, 52, 53, 54, 55, 56) and balancing the energetic cost of forming an interface with a repulsion term arising from lipid dipoles (36, 49, 50). These mechanisms are not mutually exclusive, and some predict similar behavior. To our knowledge, all of these mechanisms predict that an increase in temperature results in a decrease in the characteristic size of domains, as we observe in Figs. 5 A and 6 A. A similar qualitative result has been reported for vesicles near their mixing temperature (25). To evaluate the mechanisms, we discuss membrane asymmetry, tension, and lipid dipoles in the three sections below.
Evaluation of membrane asymmetry
One class of theories and simulations posits that small-scale features arise in membranes when the local lipid composition couples to the local monolayer or bilayer curvature (16, 17, 18, 21, 31, 47, 48, 49, 50, 51, 52, 53, 54, 55, 56). An experimental basis for these theories lies in the observation that monolayer spontaneous curvatures of different lipids vary widely (57, 58). A recent theory by Schick and co-workers (16, 17, 18, 52) proposes that lipid composition couples to membrane height fluctuations. This theory predicts that over a range of temperatures and tensions, lipid compositions spatially vary as in a microemulsion. Characteristic sizes of domains are predicted to be ≥100 nm (17), and the largest features are expected when the differences in spontaneous curvatures of all the lipids is small (16), as in our system in which all phospholipids are PC lipids. Schick notes that in membranes that contain a mixture of lipids with a wide range of spontaneous curvatures, such as “membranes with ternary mixtures of cholesterol, PC, and PE one would expect the characteristic wavelengths to be appreciably smaller” (16). Membranes of GPMVs satisfy this criterion because they contain a significant fraction of lipids that produce high monolayer curvatures (e.g., lipids with phosphatidylethanolamine headgroups and/or polyunsaturated tails (22)). However, micron-scale domains are readily observable in both types of membranes that we use: GUVs with PC lipids and GPMVs with a wide complement of lipids.
The Schick theory posits that monolayer regions with different spontaneous curvatures are enriched (or depleted) in lipids with noncylindrical shapes (e.g., PE-lipids or lysolipids) such that monolayer domains antiregister across the bilayer. For example, a lipid for which the cross-sectional area of the head group is smaller than that of the tails will be enriched within the bright monolayer regions in Figs. 11 and 12. As a comparison, in flat bilayers containing domains of Lo and Ld phases, the penalty incurred for domains in one leaflet misaligning with domains in the opposite leaflet is large (0.016 kBT/nm2) (59).
Figure 12.

Fluorescence levels in GUVs with excess area imply that stripe and dot domains are registered across both monolayer leaflets of the bilayer. (A) As DPPC is delivered to the surface of a vesicle composed of 35:35:30 DiPhyPC/DPPC/cholesterol, stripes and dots appear at the boundary of the Lo and Ld phases and evolve through time. Scale bars, 20 μm. (B) A line scan (10 pixels wide) across the boundary yields only two fluorescence levels. To preserve image fidelity, no correction was made for the slight brightness gradient across the image, which likely arises from objects out of the plane of focus. (C) In contrast, antiregistration of domains as in the Schick theory (16) predicts three fluorescence levels, either as in Option 1 or Option 2. To see this figure in color, go online.
Two lines of evidence are inconsistent with antiregistration of domains in vesicles of DiphyPC/DPPC/cholesterol with excess area. The first is in Fig. 12 A, which shows a time series shortly after HPαCD has inserted DPPC into the outer leaflet of a membrane that had previously demixed into Lo and Ld phases. In the time series, small-scale structure arises from fingering and scission at the boundary of the Lo and Ld phases, as previously observed (21, 28). Antiregistration would result in the observation of three fluorescence levels across the boundary (Fig. 12 C): instead, only two fluorescence levels are observed (Fig. 12 B).
The second line of evidence is in Fig. 11. GUVs electroformed with initial compositions at the four numbered points along the tie-line in Fig. 11 A exhibit Lo and Ld phases. In these two-phase vesicles, domains in one monolayer of the membrane are in registration with domains of the same phase in the opposing monolayer. Excess area was introduced to these membranes through the addition of DPPC to the outer leaflet by cyclodextrin, and fluorescence micrographs were collected. Contrast between domains arises from a dye-labeled lipid that preferentially partitions with one domain type. Standard fluorescence microscopy techniques record fluorescence levels of bilayers (the sum of the monolayers) and excel at distinguishing fractions of areas that appear relatively bright and dark rather than absolute fluorescence levels. Because the Schick model posits that domains are antiregistered, we can test a prediction. If a constant wavelength of membrane fluctuation is assumed within the Schick model, then the area fraction of the bilayer that appears dark (relative to the rest of the membrane) should vary in a sawtooth pattern for vesicles of the four compositions (Fig. 11, D and E). The experimental data in Fig. 11, B and C contradict this scenario. Specifically, the area fraction that appears dark increases monotonically rather than in a sawtooth pattern. A related monotonic increase in area fraction of synthetic GUVs is reported by Goh et al. (30).
Two related lines of evidence show that domains are in registration with cell-derived GPMVs with excess area. The first appears in Fig. 13 A. The osmotic pressure of the exterior solution was shifted to vary membrane tension such that GPMV membranes transitioned from coexisting Lo and Ld phases to small-scale domains (or the reverse). The area fractions of dark membrane regions of six GPMVs were evaluated before and after the transition. All pairs of area fractions lie close to a line with a slope of 1. Because monolayer domains are assumed to be in registration across the membranes of GPMVs exhibiting Lo and Ld phases, this result implies that the monolayer domains are also in registration in GPMVs exhibiting small-scale domains. As in Fig. 11 E, if a constant wavelength of membrane fluctuation is assumed within the Schick model (16), which posits that dark regions in one monolayer leaflet are in antiregistration with dark regions in the opposite leaflet, then the area fraction of membrane that appears dark would be expected to vary with a sawtooth pattern.
Figure 13.

To distinguish whether small domains in cell-derived GPMV membranes result from registration or antiregistration of monolayer domains, GPMVs were followed through shifts in the osmotic pressure of the exterior solution, which increased (squares) or decreased (circles) membrane tension. Throughout the transition (A), the fractional area that appeared dark did not change significantly (such that the data lie along a line with slope = 1 as in Fig. 11E), and (B) the ratio of fluorescence intensities of bright and dark domains did not change significantly (normalized by a ratiometric measurement to account for photobleaching). Both results are consistent with registration of domains (and inconsistent with antiregistration of domains). Data points in (A) report single measurements for single vesicles. Data points in (B) report intensities averaged over three different 2 × 2 pixel areas for each bright and dark region. Scale bars, 10 μm.
The second line of evidence for registration of domains in GPMVs appears in Fig. 13 B. Within a single field of view, some GPMVs (which have excess area) exhibit stripes or dots, whereas others (which lack significant excess area) contain coexisting Lo and Ld phases. In Fig. 13 B, these two types of vesicles are named “test” and “control.” After application of osmotic pressure to remove excess area, the test vesicles contain coexisting Lo and Ld phases, in which domains in each lipid monolayer are presumed to always be in registration across the membrane. This system can be used to assess whether stripe or dot domains in the test vesicle are in registration. If the ratio of fluorescence levels in the test vesicle to the control vesicle is unchanged by the application of osmotic pressure, then the stripe or dot domains represent regions in which dark domains are in registration across both monolayer leaflets of the membrane. If the ratio differs by a factor of 2, then stripe or dot domains are in antiregistration. This ratiometric measurement eliminates any artifacts due to photobleaching; the measurement leverages the fact that bleaching occurs at the same rate in all vesicles. In total, all data in Figs. 11, 12, and 13 are consistent with registration and inconsistent with antiregistration.
Evaluation of membrane tension
Figs. 8 and 9 show how the characteristic length scale of domains can be tuned via membrane tension: as membrane tension increases, stripe widths increase (Figs. 8 B and 9 B). The Schick theory considers membrane tension in two regimes. Only one of these regimes is considered in (16), in which “the theory predicts that if one increases the surface tension of the membrane, making it more taut, then characteristic length decreases.” This is the opposite of what we observe. Equation 6 in (17) gives a fuller story. When membrane tension is initially low, increases in tension decrease the characteristic length, as in the Schick statement above. However, it is reasonable to expect that the membrane tension in our GUVs is initially high because the vesicles appear taut and exhibit coexisting Lo and Ld phases before the addition of DPPC to the outer monolayer. When membrane tension is initially high, the Schick theory predicts that increases in tension increase the characteristic length.
An earlier theory, which should be equivalent to the Schick theory in the limit of a flat membrane, yields similar re-entrant behavior (60, 61). Although Eqs. 2.8b and 2.12 in (60) predict that an increase in surface tension should result in a decrease in domain size, Fig. 6 a in (61) shows two trends. Specifically, for a vesicle with two domains, a configuration with three domains can be reached either by increasing the exterior pressure or by decreasing it, depending on the initial conditions.
A separate theory by Harden et al. considers domains in a modulated phase that arises due to a spontaneous bilayer curvature of the membrane within domains (56). This scenario is relevant to our system in the plausible case that when DPPC is added to the outer monolayer, it preferentially partitions to one phase, likely the Lo phase. The theory predicts that the characteristic length of dots and stripes increases with membrane tension when the energetic cost of forming an interface is held constant (56). Our results in Figs. 8 and 9 are consistent with this prediction.
Evaluation of phase diagrams
In Fig. 12, as DPPC is delivered to the outer membrane of a GUV, small domains appear at the boundary of the Lo and Ld phases. This observation is consistent with the Schick theory for modulated phases and microemulsions (18) and the theory of Harden et al. for modulated phases (56). Specifically, the Schick theory allows for a first-order transition from a two-phase region of Lo and Ld coexistence to a region of a modulated phase over a wide range of parameters and, when evaluated in a way that accounts for fluctuations in the system, a first-order transition from a two-phase region to a microemulsion over a narrower range of parameters, as shown in Fig. 2 of (18). Similarly, in the theory of Harden et al., a direct transition is allowed from a two-phase “flat” region to a modulated phase of stripes or dots if membrane tension is decreased, as occurs when we introduce DPPC molecules to GUV membranes. Knowledge that the transition is first order does not distinguish between a modulated phase and a microemulsion (62).
Next, we evaluate whether stripes or dots are favored as we vary membrane tension or line tension in the initial GUVs. A decrease in membrane tension in Figs. 8 A and 9 A results in a sequence from two-phases to stripes and then to dots, as predicted by Harden et al. (56). The topic of line tension is tackled in Fig. 10. When DPPC is delivered to a GUV with a lipid composition that lies near the Lo-Ld miscibility critical point, at which line tension is low, stripes tend to be observed. When the GUV is initially far from the critical point, at which line tension is high, dots are observed. This observation contradicts the prediction of Harden et al., which asserts that as line tension increases, stripes should be favored over dots (56). The prediction holds for a set of GUVs with constant membrane tension and constant area fraction of each phase. Because we apply the same protocol to all GUVs, we assume that membrane tensions are, on average, constant. Similarly, because the path of the arrow in Fig. 10 bisects a series of tie-lines, the area fraction of dark and white regions in all GUVs should be, on average, 50:50, although there is a distribution of values within each population of GUVs.
Evaluation of dipole repulsion contribution
The simplest models that produce a discrete length scale in two-dimensional systems like membranes consider only two energy terms: a local attractive term and a long-range repulsion term (63). The attractive term arises from a cost per unit length of an interface, which favors coalescence of domains and domain budding (64). In monolayers at an air-water interface, the repulsion arises from a difference in dipole density between two lipid phases (48, 65, 66, 67, 68). The magnitude of the dipolar term in lipid bilayers is contentious for two reasons. First, electrostatic interactions are diminished by the aqueous solution surrounding a bilayer; nevertheless, small-scale membrane structures are observed in solutions of high ionic strength (28). Second, the dipoles may largely cancel, depending on their location within the bilayer.
Several models that describe small-scale features in membranes incorporate a dipolar repulsion term in the free energy (29, 36, 50, 69). The predicted length scales depend on the magnitude of the dipolar term, which in turn depends on the location of dipoles within the bilayer. Here, we directly test an assumption by Usery et al. (36) that the dipolar repulsion term arises from carbonyl groups at the ester linkage between lipid headgroups and chains. If this assumption were true, then replacing all ester-linked lipids with ether-linked lipids (which lack carbonyl groups) should result in a lack of small-scale patterns on vesicle surfaces. The data in Fig. 14 contradict the assumption. In this experiment, DPPC and DiPhyPC were replaced with their ether-linked counterparts to produce vesicles analogous to Fig. 3.
Figure 14.
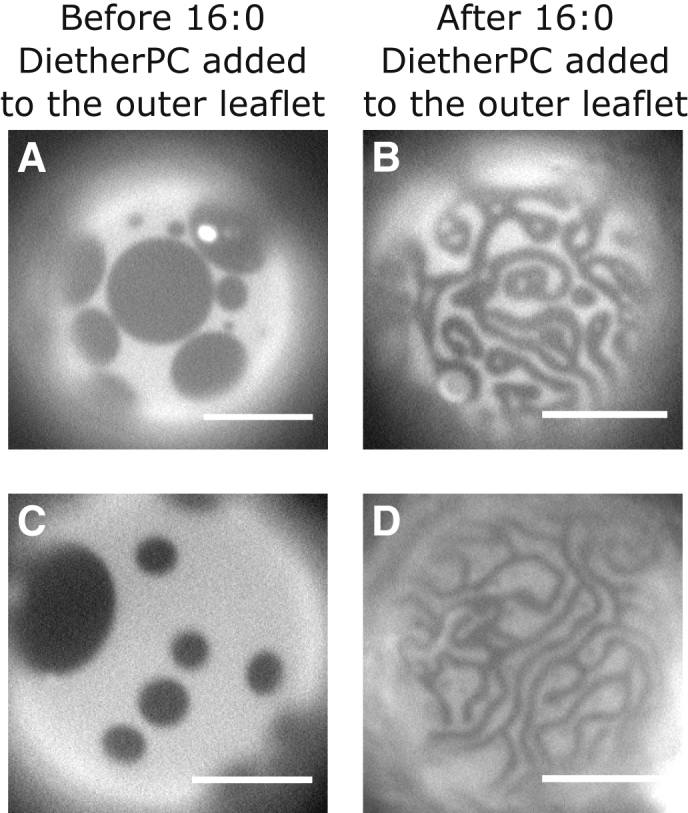
Insertion of 16:0 diether PC into (A and C) the outer leaflet of a GUV with coexisting Lo and Ld phases (B and D) induces the formation of meandering stripes with smaller widths. Micrographs are representative images of four vesicles of 35:35:30 4ME 16:0 diether PC/16:0 diether PC/cholesterol, two at room temperature before the addition of 70 mM 16:0 diether PC-loaded HPαCD and two after the addition. Scale bars, 20 μm.
Conclusions
Here, we have evaluated how the characteristic lengths of small-scale features in membranes of GUVs and GPMVs vary with temperature, tension, and lipid composition. We find that length scales increase as temperature decreases and as tension increases, that area fractions and fluorescence levels imply that domains are registered across both monolayer leaflets, and that stripes are favored for lipid compositions that are expected to have a low energetic cost of forming an interface.
Our results are consistent with most predictions of an early theory on vesicle shape deformations (60, 61) and the Schick theory of microemulsions (16, 17, 18, 52), with the caveat that the initial membrane tension cannot be too low. However, the Schick theory posits that monolayer domains antiregister across the bilayer and Schick strongly argues for the plausibility of antiregistered domains in asymmetric plasma membranes, whereas we find evidence that domains register, both in model GUVs and in cell-derived GPMVs. Ways in which the Schick theory could become more complete would be to include the effect of fluctuations and the energetic cost of thickness variations that would accompany domain registration (M. Schick, personal communication). Similarly, our results are consistent with some predictions of the theory of Harden et al. for modulated phases (56) but do not agree with the prediction that dots should be favored over stripes when the energetic cost of forming an interface is low; we observe the opposite. Our results are consistent with general theories that balance attractive and repulsive interactions, with the caveat that the source of the repulsion does not appear to originate with carbonyl group dipoles of ester-linked lipids, as proposed by Usery et al. (36). This leaves the question of how domain repulsion arises, which is challenging to address in lipid bilayers (as opposed to in monolayers).
In several theories, the mean bilayer spontaneous curvature is integral to the description of a modulated phase (21, 49, 50, 70). In our GUV experiments, we established a mean bilayer spontaneous curvature by introducing excess lipid to the outer leaflet of vesicles that had previously phase separated into Lo and Ld phases. The addition of outer leaflet lipids is not strictly necessary: other researchers have noted that a bilayer spontaneous curvature could arise from slowly decreasing GUV temperature (P. Cicuta and L. Parolini, personal communication). Small-scale features have been previously reported in a wide range of membranes, including vacuoles in living yeast cells (4), zebrafish GPMVs (23), and synthetic GUVs, both with (21) and without (30, 35, 36) explicit addition of lipids to the outer leaflet, illustrating the robustness of the result and its applicability to a broad class of membranes.
Author Contributions
C.E.C. and S.L.K. designed the research, wrote the article, and designed the figures. C.E.C., A.D.S., I.L., K.R.L., and S.L.K. performed experiments and collected data. S.H. wrote code. C.E.C. and S.H. analyzed data.
Acknowledgments
We thank Lutz Maibaum, Peter Olmsted, Michael Schick, and Tristan Ursell for theoretical insights.
Research in the Keller lab is supported by National Science Foundation grant MCB-1402059 to S.L.K. The Levental lab is supported by the Cancer Prevention and Research Institute of Texas (R1215), National Institutes of Health/National Institute of General Medical Sciences (grants RO1GM114282, RO1GM100078, and R01GM124072), and the Volkswagen Foundation (grant 93091). C.E.C. was funded by the National Institutes of General Medical Sciences of the National Institutes of Health under award T32GM008268.
Editor: Joseph Zasadzinski.
Footnotes
Supporting Materials and Methods, five figures, and one table are available at http://www.biophysj.org/biophysj/supplemental/S0006-3495(18)30767-7.
Supporting Material
References
- 1.Dietrich C., Bagatolli L.A., Gratton E. Lipid rafts reconstituted in model membranes. Biophys. J. 2001;80:1417–1428. doi: 10.1016/S0006-3495(01)76114-0. [DOI] [PMC free article] [PubMed] [Google Scholar]
- 2.Veatch S.L., Keller S.L. Organization in lipid membranes containing cholesterol. Phys. Rev. Lett. 2002;89:268101. doi: 10.1103/PhysRevLett.89.268101. [DOI] [PubMed] [Google Scholar]
- 3.Veatch S.L., Keller S.L. Separation of liquid phases in giant vesicles of ternary mixtures of phospholipids and cholesterol. Biophys. J. 2003;85:3074–3083. doi: 10.1016/S0006-3495(03)74726-2. [DOI] [PMC free article] [PubMed] [Google Scholar]
- 4.Rayermann S.P., Rayermann G.E., Keller S.L. Hallmarks of reversible separation of living, unperturbed cell membranes into two liquid phases. Biophys. J. 2017;113:2425–2432. doi: 10.1016/j.bpj.2017.09.029. [DOI] [PMC free article] [PubMed] [Google Scholar]
- 5.Ipsen J.H., Karlström G., Zuckermann M.J. Phase equilibria in the phosphatidylcholine-cholesterol system. Biochim. Biophys. Acta. 1987;905:162–172. doi: 10.1016/0005-2736(87)90020-4. [DOI] [PubMed] [Google Scholar]
- 6.Ionova I.V., Livshits V.A., Marsh D. Phase diagram of ternary cholesterol/palmitoylsphingomyelin/palmitoyloleoyl-phosphatidylcholine mixtures: spin-label EPR study of lipid-raft formation. Biophys. J. 2012;102:1856–1865. doi: 10.1016/j.bpj.2012.03.043. [DOI] [PMC free article] [PubMed] [Google Scholar]
- 7.Veatch S.L., Soubias O., Gawrisch K. Critical fluctuations in domain-forming lipid mixtures. Proc. Natl. Acad. Sci. USA. 2007;104:17650–17655. doi: 10.1073/pnas.0703513104. [DOI] [PMC free article] [PubMed] [Google Scholar]
- 8.Yanagisawa M., Imai M., Ohta T. Growth dynamics of domains in ternary fluid vesicles. Biophys. J. 2007;92:115–125. doi: 10.1529/biophysj.106.087494. [DOI] [PMC free article] [PubMed] [Google Scholar]
- 9.Stanich C.A., Honerkamp-Smith A.R., Keller S.L. Coarsening dynamics of domains in lipid membranes. Biophys. J. 2013;105:444–454. doi: 10.1016/j.bpj.2013.06.013. [DOI] [PMC free article] [PubMed] [Google Scholar]
- 10.Simons K., Ikonen E. Functional rafts in cell membranes. Nature. 1997;387:569–572. doi: 10.1038/42408. [DOI] [PubMed] [Google Scholar]
- 11.Schmid F. Physical mechanisms of micro- and nanodomain formation in multicomponent lipid membranes. Biochim. Biophys. Acta. 2017;1859:509–528. doi: 10.1016/j.bbamem.2016.10.021. [DOI] [PubMed] [Google Scholar]
- 12.Honerkamp-Smith A.R., Machta B.B., Keller S.L. Experimental observations of dynamic critical phenomena in a lipid membrane. Phys. Rev. Lett. 2012;108:265702. doi: 10.1103/PhysRevLett.108.265702. [DOI] [PMC free article] [PubMed] [Google Scholar]
- 13.Machta B.B., Papanikolaou S., Veatch S.L. Minimal model of plasma membrane heterogeneity requires coupling cortical actin to criticality. Biophys. J. 2011;100:1668–1677. doi: 10.1016/j.bpj.2011.02.029. [DOI] [PMC free article] [PubMed] [Google Scholar]
- 14.Ehrig J., Petrov E.P., Schwille P. Near-critical fluctuations and cytoskeleton-assisted phase separation lead to subdiffusion in cell membranes. Biophys. J. 2011;100:80–89. doi: 10.1016/j.bpj.2010.11.002. [DOI] [PMC free article] [PubMed] [Google Scholar]
- 15.Toner J., Nelson D.R. Smectic, cholesteric, and Rayleigh-Benard order in two dimensions. Phys. Rev. B. 1981;23:316–334. [Google Scholar]
- 16.Schick M. Strongly correlated rafts in both leaves of an asymmetric bilayer. J. Phys. Chem. B. 2018;122:3251–3258. doi: 10.1021/acs.jpcb.7b08890. [DOI] [PubMed] [Google Scholar]
- 17.Schick M. Membrane heterogeneity: manifestation of a curvature-induced microemulsion. Phys. Rev. E Stat. Nonlin. Soft Matter Phys. 2012;85:031902. doi: 10.1103/PhysRevE.85.031902. [DOI] [PubMed] [Google Scholar]
- 18.Shlomovitz R., Maibaum L., Schick M. Macroscopic phase separation, modulated phases, and microemulsions: a unified picture of rafts. Biophys. J. 2014;106:1979–1985. doi: 10.1016/j.bpj.2014.03.017. [DOI] [PMC free article] [PubMed] [Google Scholar]
- 19.Angelova M.I., Soleau S., Méléard P. Preparation of giant vesicles by external AC electric fields. Kinetics and applications. Trends Colloid Interface Sci. IV. 1992;89:127–131. [Google Scholar]
- 20.Veatch S.L., Gawrisch K., Keller S.L. Closed-loop miscibility gap and quantitative tie-lines in ternary membranes containing diphytanoyl PC. Biophys. J. 2006;90:4428–4436. doi: 10.1529/biophysj.105.080283. [DOI] [PMC free article] [PubMed] [Google Scholar]
- 21.Shimobayashi S.F., Ichikawa M., Taniguchi T. Direct observations of transition dynamics from macro- to micro-phase separation in asymmetric lipid bilayers induced by externally added glycolipids. Eur. Phys. Lett. 2016;113:56005. [Google Scholar]
- 22.Levental K.R., Lorent J.H., Levental I. Polyunsaturated lipids regulate membrane domain stability by tuning membrane order. Biophys. J. 2016;110:1800–1810. doi: 10.1016/j.bpj.2016.03.012. [DOI] [PMC free article] [PubMed] [Google Scholar]
- 23.Burns M., Wisser K., Veatch S.L. Miscibility transition temperature scales with growth temperature in a Zebrafish cell line. Biophys. J. 2017;113:1212–1222. doi: 10.1016/j.bpj.2017.04.052. [DOI] [PMC free article] [PubMed] [Google Scholar]
- 24.Sezgin E., Kaiser H.J., Levental I. Elucidating membrane structure and protein behavior using giant plasma membrane vesicles. Nat. Protoc. 2012;7:1042–1051. doi: 10.1038/nprot.2012.059. [DOI] [PubMed] [Google Scholar]
- 25.Baumgart T., Hess S.T., Webb W.W. Imaging coexisting fluid domains in biomembrane models coupling curvature and line tension. Nature. 2003;425:821–824. doi: 10.1038/nature02013. [DOI] [PubMed] [Google Scholar]
- 26.He S., Maibaum L. Identifying the onset of phase separation in quaternary lipid bilayer systems from coarse-grained simulations. J. Phys. Chem. B. 2018;122:3961–3973. doi: 10.1021/acs.jpcb.8b00364. [DOI] [PubMed] [Google Scholar]
- 27.Alam Shibly S.U., Ghatak C., Yamazaki M. Experimental estimation of membrane tension induced by osmotic pressure. Biophys. J. 2016;111:2190–2201. doi: 10.1016/j.bpj.2016.09.043. [DOI] [PMC free article] [PubMed] [Google Scholar]
- 28.Rozovsky S., Kaizuka Y., Groves J.T. Formation and spatio-temporal evolution of periodic structures in lipid bilayers. J. Am. Chem. Soc. 2005;127:36–37. doi: 10.1021/ja046300o. [DOI] [PubMed] [Google Scholar]
- 29.Amazon J.J., Feigenson G.W. Lattice simulations of phase morphology on lipid bilayers: renormalization, membrane shape, and electrostatic dipole interactions. Phys. Rev. E Stat. Nonlin. Soft Matter Phys. 2014;89:022702. doi: 10.1103/PhysRevE.89.022702. [DOI] [PMC free article] [PubMed] [Google Scholar]
- 30.Goh S.L., Amazon J.J., Feigenson G.W. Toward a better raft model: modulated phases in the four-component bilayer, DSPC/DOPC/POPC/CHOL. Biophys. J. 2013;104:853–862. doi: 10.1016/j.bpj.2013.01.003. [DOI] [PMC free article] [PubMed] [Google Scholar]
- 31.Amazon J.J., Goh S.L., Feigenson G.W. Competition between line tension and curvature stabilizes modulated phase patterns on the surface of giant unilamellar vesicles: a simulation study. Phys. Rev. E Stat. Nonlin. Soft Matter Phys. 2013;87:022708. doi: 10.1103/PhysRevE.87.022708. [DOI] [PubMed] [Google Scholar]
- 32.Honerkamp-Smith A.R., Cicuta P., Keller S.L. Line tensions, correlation lengths, and critical exponents in lipid membranes near critical points. Biophys. J. 2008;95:236–246. doi: 10.1529/biophysj.107.128421. [DOI] [PMC free article] [PubMed] [Google Scholar]
- 33.Bleecker J.V., Cox P.A., Keller S.L. Thickness mismatch of coexisting liquid phases in noncanonical lipid bilayers. J. Phys. Chem. B. 2016;120:2761–2770. doi: 10.1021/acs.jpcb.5b10165. [DOI] [PMC free article] [PubMed] [Google Scholar]
- 34.Baumgart T., Hammond A.T., Webb W.W. Large-scale fluid/fluid phase separation of proteins and lipids in giant plasma membrane vesicles. Proc. Natl. Acad. Sci. USA. 2007;104:3165–3170. doi: 10.1073/pnas.0611357104. [DOI] [PMC free article] [PubMed] [Google Scholar]
- 35.Konyakhina T.M., Goh S.L., Feigenson G.W. Control of a nanoscopic-to-macroscopic transition: modulated phases in four-component DSPC/DOPC/POPC/Chol giant unilamellar vesicles. Biophys. J. 2011;101:L8–L10. doi: 10.1016/j.bpj.2011.06.019. [DOI] [PMC free article] [PubMed] [Google Scholar]
- 36.Usery R.D., Enoki T.A., Feigenson G.W. Line tension controls liquid-disordered + liquid-ordered domain size transition in lipid bilayers. Biophys. J. 2017;112:1431–1443. doi: 10.1016/j.bpj.2017.02.033. [DOI] [PMC free article] [PubMed] [Google Scholar]
- 37.Shimokawa N., Mukai R., Takagi M. Formation of modulated phases and domain rigidification in fatty acid-containing lipid membranes. Phys. Chem. Chem. Phys. 2017;19:13252–13263. doi: 10.1039/c7cp01201b. [DOI] [PubMed] [Google Scholar]
- 38.Hirose Y., Komura S., Andelman D. Concentration fluctuations and phase transitions in coupled modulated bilayers. Phys. Rev. E Stat. Nonlin. Soft Matter Phys. 2012;86:021916. doi: 10.1103/PhysRevE.86.021916. [DOI] [PubMed] [Google Scholar]
- 39.Palmieri B., Safran S.A. Hybrid lipids increase the probability of fluctuating nanodomains in mixed membranes. Langmuir. 2013;29:5246–5261. doi: 10.1021/la4006168. [DOI] [PubMed] [Google Scholar]
- 40.Turner M.S., Sens P., Socci N.D. Nonequilibrium raftlike membrane domains under continuous recycling. Phys. Rev. Lett. 2005;95:168301. doi: 10.1103/PhysRevLett.95.168301. [DOI] [PubMed] [Google Scholar]
- 41.Fan J., Sammalkorpi M., Haataja M. Formation and regulation of lipid microdomains in cell membranes: theory, modeling, and speculation. FEBS Lett. 2010;584:1678–1684. doi: 10.1016/j.febslet.2009.10.051. [DOI] [PubMed] [Google Scholar]
- 42.Fujiwara T.K., Iwasawa K., Kusumi A. Confined diffusion of transmembrane proteins and lipids induced by the same actin meshwork lining the plasma membrane. Mol. Biol. Cell. 2016;27:1101–1119. doi: 10.1091/mbc.E15-04-0186. [DOI] [PMC free article] [PubMed] [Google Scholar]
- 43.Lillemeier B.F., Pfeiffer J.R., Davis M.M. Plasma membrane-associated proteins are clustered into islands attached to the cytoskeleton. Proc. Natl. Acad. Sci. USA. 2006;103:18992–18997. doi: 10.1073/pnas.0609009103. [DOI] [PMC free article] [PubMed] [Google Scholar]
- 44.Huang K.C., Mukhopadhyay R., Wingreen N.S. A curvature-mediated mechanism for localization of lipids to bacterial poles. PLoS Comput. Biol. 2006;2:e151. doi: 10.1371/journal.pcbi.0020151. [DOI] [PMC free article] [PubMed] [Google Scholar]
- 45.Ursell T.S., Klug W.S., Phillips R. Morphology and interaction between lipid domains. Proc. Natl. Acad. Sci. USA. 2009;106:13301–13306. doi: 10.1073/pnas.0903825106. [DOI] [PMC free article] [PubMed] [Google Scholar]
- 46.Semrau S., Schmidt T. Membrane heterogeneity – from lipid domains to curvature effects. Soft Matter. 2009;5:3174. [Google Scholar]
- 47.Komura S., Shimokawa N., Andelman D. Tension-induced morphological transition in mixed lipid bilayers. Langmuir. 2006;22:6771–6774. doi: 10.1021/la053135x. [DOI] [PubMed] [Google Scholar]
- 48.Leibler S., Andelman D. Ordered and curved meso-structures in membranes and amphiphilic films. J. Phys. France. 1987;48:2013–2018. [Google Scholar]
- 49.Liu J., Qi S., Chakraborty A.K. Phase segregation on different length scales in a model cell membrane system. J. Phys. Chem. B. 2005;109:19960–19969. doi: 10.1021/jp053562j. [DOI] [PubMed] [Google Scholar]
- 50.Liu J., Groves J.T., Chakraborty A.K. Kinetic pathways of phase ordering in lipid raft model systems. J. Phys. Chem. B. 2006;110:8416–8421. doi: 10.1021/jp054855f. [DOI] [PubMed] [Google Scholar]
- 51.Perlmutter J.D., Sachs J.N. Interleaflet interaction and asymmetry in phase separated lipid bilayers: molecular dynamics simulations. J. Am. Chem. Soc. 2011;133:6563–6577. doi: 10.1021/ja106626r. [DOI] [PubMed] [Google Scholar]
- 52.Sapp K., Shlomovitz R., Maibaum L. Seeing the forest in lieu of the trees: continuum simulations of cell membranes at large length scales. Annu. Rep. Comput. Chem. 2014;10:47–76. doi: 10.1016/B978-0-444-63378-1.00003-3. [DOI] [PMC free article] [PubMed] [Google Scholar]
- 53.Funkhouser C.M., Mayer M., Thornton K. Effects of interleaflet coupling on the morphologies of multicomponent lipid bilayer membranes. J. Chem. Phys. 2013;138:024909. doi: 10.1063/1.4773856. [DOI] [PubMed] [Google Scholar]
- 54.Wolff J., Komura S., Andelman D. Budding of domains in mixed bilayer membranes. Phys. Rev. E Stat. Nonlin. Soft Matter Phys. 2015;91:012708. doi: 10.1103/PhysRevE.91.012708. [DOI] [PubMed] [Google Scholar]
- 55.Sadeghi S., Müller M., Vink R.L. Raft formation in lipid bilayers coupled to curvature. Biophys. J. 2014;107:1591–1600. doi: 10.1016/j.bpj.2014.07.072. [DOI] [PMC free article] [PubMed] [Google Scholar]
- 56.Harden J.L., Mackintosh F.C., Olmsted P.D. Budding and domain shape transformations in mixed lipid films and bilayer membranes. Phys. Rev. E Stat. Nonlin. Soft Matter Phys. 2005;72:011903. doi: 10.1103/PhysRevE.72.011903. [DOI] [PubMed] [Google Scholar]
- 57.Kirk G.L., Gruner S.M. Lyotropic effects of alkanes and headgroup composition on the Lα -HII lipid liquid crystal phase transition : hydrocarbon packing versus intrinsic curvature. J. Phys. (Paris) 1985;46:761–769. [Google Scholar]
- 58.Gruner S.M. Intrinsic curvature hypothesis for biomembrane lipid composition: a role for nonbilayer lipids. Proc. Natl. Acad. Sci. USA. 1985;82:3665–3669. doi: 10.1073/pnas.82.11.3665. [DOI] [PMC free article] [PubMed] [Google Scholar]
- 59.Blosser M.C., Honerkamp-Smith A.R., Keller S.L. Transbilayer colocalization of lipid domains explained via measurement of strong coupling parameters. Biophys. J. 2015;109:2317–2327. doi: 10.1016/j.bpj.2015.10.031. [DOI] [PMC free article] [PubMed] [Google Scholar]
- 60.Kawakatsu T., Andelman D., Taniguchi T. Phase transitions and shapes of two component membranes and vesicles I : strong segregation limit. J. Phys. II Fr. 1993;3:971–997. [Google Scholar]
- 61.Taniguchi T., Kawasaki K., Kawakatsu T. Phase transitions and shapes of two component membranes and vesicles II : weak segregation limit. J. Phys. II Fr. 1994;4:1333–1362. [Google Scholar]
- 62.Shlomovitz R., Schick M. Model of a raft in both leaves of an asymmetric lipid bilayer. Biophys. J. 2013;105:1406–1413. doi: 10.1016/j.bpj.2013.06.053. [DOI] [PMC free article] [PubMed] [Google Scholar]
- 63.Andelman D., Rosensweig R.E. Modulated phases: review and recent results. J. Phys. Chem. B. 2009;113:3785–3798. doi: 10.1021/jp807770n. [DOI] [PubMed] [Google Scholar]
- 64.Lipowsky R. Budding of membranes induced by intramembrane domains. J. Phys. (Paris) 1992;2:1825–1840. [Google Scholar]
- 65.Moy V.T., McConnell H.M., Keller D.J. Theory of superstructures in lipid monolayer phase transitions. J. Phys. Chem. 1986;90:2311–2315. [Google Scholar]
- 66.McConnell H.M. Structures and transitions in lipid monolayers at the air-water interface. Annu. Rev. Phys. Chem. 1991;42:171–195. [Google Scholar]
- 67.Keller S.L., McConnell H.M. Stripe phases in lipid monolayers near a miscibility critical point. Phys. Rev. Lett. 1999;82:1602–1605. [Google Scholar]
- 68.Schneider M.F., Andelman D., Tanaka M. Stripes of partially fluorinated alkyl chains: dipolar Langmuir monolayers. J. Chem. Phys. 2005;122:094717. doi: 10.1063/1.1858852. [DOI] [PubMed] [Google Scholar]
- 69.Travesset A. Effect of dipolar moments in domain sizes of lipid bilayers and monolayers. J. Chem. Phys. 2006;125:084905. doi: 10.1063/1.2336779. [DOI] [PubMed] [Google Scholar]
- 70.Rim J.E., Ursell T.S., Klug W.S. Morphological phase diagram for lipid membrane domains with entropic tension. Phys. Rev. Lett. 2011;106:057801. doi: 10.1103/PhysRevLett.106.057801. [DOI] [PMC free article] [PubMed] [Google Scholar]
Associated Data
This section collects any data citations, data availability statements, or supplementary materials included in this article.