Abstract
Single-cell RNA sequencing (scRNA-seq) technology allows researchers to profile the transcriptomes of thousands of cells simultaneously. Protocols that incorporate both designed and random barcodes have greatly increased the throughput of scRNA-seq, but give rise to a more complex data structure. There is a need for new tools that can handle the various barcoding strategies used by different protocols and exploit this information for quality assessment at the sample-level and provide effective visualization of these results in preparation for higher-level analyses. To this end, we developed scPipe, an R/Bioconductor package that integrates barcode demultiplexing, read alignment, UMI-aware gene-level quantification and quality control of raw sequencing data generated by multiple protocols that include CEL-seq, MARS-seq, Chromium 10X, Drop-seq and Smart-seq. scPipe produces a count matrix that is essential for downstream analysis along with an HTML report that summarises data quality. These results can be used as input for downstream analyses including normalization, visualization and statistical testing. scPipe performs this processing in a few simple R commands, promoting reproducible analysis of single-cell data that is compatible with the emerging suite of open-source scRNA-seq analysis tools available in R/Bioconductor and beyond. The scPipe R package is available for download from https://www.bioconductor.org/packages/scPipe.
Author summary
Biotechnologies that allow researchers to measure gene activity in individual cells are growing in popularity. This has resulted in an avalanche of custom analysis methods designed to deal with the complex data that arises from this technology. Although hundreds of analysis methods are available, relatively few deal with raw data processing in a holistic way. Our scPipe software has been developed to fill this gap. scPipe is the first fully integrated R package that deals with the raw sequencing reads from single cell gene expression studies, processing them to the point where biologically interesting downstream analyses can take place. By following community developed standards, scPipe is compatible with many other software packages for single cell analysis available from the open-source Bioconductor project, facilitating a complete beginning to end analysis of single cell gene expression data. This allows various biological questions to be answered, ranging from the identification of novel cell types to the discovery of new marker genes. scPipe promotes reproducibility and makes it easier for researchers to share results and code.
This is a PLOS Computational Biology Software paper.
Introduction
Advances in single-cell transcriptomic profiling technologies allow researchers to measure gene activity in thousands of cells simultaneously, enabling exploration of gene expression variability [1], identification of new cell types [2] and the study of transcriptional programs involved in cell differentiation [3]. The introduction of cellular barcodes, sequences distinct for each cell attached to the dT-primer, has increased the throughput and substantially reduced the cost of single-cell RNA sequencing (scRNA-seq). These barcodes allow for the demultiplexing of reads after cells are pooled together for sequencing. Apart from cellular barcodes, molecular barcodes or unique molecular identifiers (UMIs), are frequently employed to remove PCR duplicates and allow identification of unique mRNA molecules, thereby reducing technical noise. The multiple levels of barcoding used in scRNA-seq experiments create additional challenges in data processing together with new opportunities for quality control (QC). Different protocols use different barcode configurations, which means a flexible approach to data preprocessing is required.
A large number of software tools have already been tailored to scRNA-seq analysis [4], the majority of which are focused on downstream tasks such as clustering and trajectory analysis. Methods for preprocessing tend to focus on specific tasks such as UMI-tools [5], umitools (http://brwnj.github.io/umitools/) and umis [6] which have been developed for handling random UMIs and correcting UMI sequencing errors. Other tools such as CellRanger [7], dropEst [8] and dropseqPipe (https://github.com/Hoohm/dropSeqPipe) on the other hand offer a complete preprocessing solution for data generated by droplet based protocols. Other packages such as scater [9], and scran [10] work further downstream by preprocessing the counts to perform general QC and normalization of scRNA-seq data.
scPipe was developed to address the lack of a comprehensive R-based workflow for processing sequencing data from different protocols that can accommodate both UMIs and sample barcodes, map reads to the genome and summarise these results into gene-level counts. Additionally this pipeline collates useful metrics for QC during preprocessing that can be later used to filter genes and samples. In the remainder of this article we provide an overview of the main features of our scPipe software and demonstrate its use on various in-house generated and publicly available scRNA-seq datasets.
Design and implementation
Single-cell RNA-seq datasets analysed
Mouse hematopoietic lineage dataset
Single cell expression profiling of the main hematopoietic lineages in mouse (erythroid, myeloid, lymphoid, stem/progenitors) was performed using a modified CEL-seq2 [11] protocol. B lymphocytes (B220+ FSC-Alow), erythroblasts (Ter119+ CD44+, FSC-Amid/high), granulocytes (Mac1+ Gr1+) and high-end progenitor/stem (Lin- Kit+ Sca1+) were sorted from the bone marrow of a C57BL/6 10-13 week old female mouse. T cells (CD3+ FSC-Alow) were isolated from the thymus of the same mouse. Bone marrow and thymus were dissociated mechanically, washed and stained with antibodies for 1hr on ice. Single cells were deposited on a 384 well plate using an Aria cell sorter (Beckman). Index data was collected and our adapted CEL-seq2 protocol used to generate a library for sequencing. The reads were sequenced by an Illumina Nextseq 500 and processed by scPipe. This dataset is available under GEO accession number GSE109999.
Human lung adenocarcinoma cell line dataset
The cell lines H2228, NCI-H1975 and HCC827 were retrieved from ATCC (https://www.atcc.org/) and cultured in Roswell Park Memorial Institute (RPMI) 1640 medium with 10% fetal calf serum (FCS) and 1% Penicillin-Streptomycin. The cells were grown independently at 37°C with 5% carbon dioxide until near 100% confluency. Cells were PI stained and 120,000 live cells were sorted for each cell line by FACS to acquire an accurate equal mixture of live cells from the three cell lines. This mixture was then processed by the Chromium 10X single cell platform using the manufacturer’s (10X Genomics) protocol and sequenced with an Illumina Nextseq 500. Filtered gene expression matrices were generated using CellRanger (10X Genomics) and scPipe independently. For CellRanger, we used the default parameters, with --expect-cells = 4000. For scPipe, we processed the 4,000 most enriched cell barcodes. The GRCh38 human genome and ENSEMBL v91 human gene annotation were used for both the scPipe and CellRanger analysis. In scPipe, the number of components used in the outlier detection step was set to comp = 2 for quality control to remove poor quality cells. This dataset is available under GEO accession number GSE111108.
Ischaemic sensitivity of human tissue dataset
A publicly available Chromium 10X dataset from the Human Cell Atlas project (https://preview.data.humancellatlas.org/) was also preprocessed using scPipe and analysed with highly compatible Bioconductor packages. This dataset of roughly 2,000 cells comes from the first spleen harvested in a project seeking to study sensitivity to ischaemia in 3 different tissue types [12]. For this sample, scPipe was run with quality and sequence filters turned off in sc_trim_barcode and cellular barcodes were detected from a sample of the first 5 million reads using sc_detect_bc, which resulted in 2,273 detected barcodes. The sequences were aligned to the GRCh38 human genome using Rsubread and counts were assigned based on ENSEMBL v91 human gene annotations using scPipe and outliers were detected with comp = 2 in the automatic outlier detection step.
scPipe implementation details
scPipe is an R [13] / Bioconductor [14] package that can handle data generated from all popular 3’ end scRNA-seq protocols and their variants, such as CEL-seq, MARS-seq, Chromium 10X and Drop-seq. Data from non-UMI protocols generated by Smart-seq and Smart-seq2 can also be handled. The pipeline begins with FASTQ files and outputs both a gene count matrix and a variety of QC statistics. These are presented in a standalone HTML report generated by rmarkdown [15] that includes various plots of QC metrics and other data summaries. The scPipe package is written in R and C++ and uses the Rcpp package [16, 17] to wrap the C++ code into R functions and the Rhtslib package [18] for BAM input/output. The key aspects are implemented in C++ for efficiency.
Results
The scPipe workflow
FASTQ reformatting
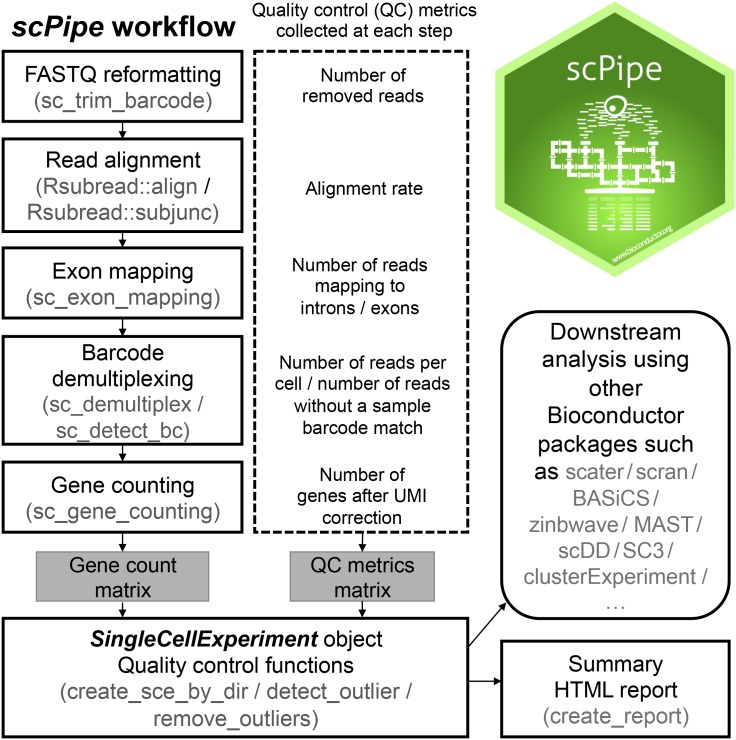
The scPipe workflow (Fig 1) generally begins with paired-end FASTQ data which is passed to the function sc_trim_barcode, which reformats the reads by trimming the barcode and UMI from the reads and moving this information into the read header. There are options to perform some basic filtering in this step, including removing reads with low quality sequence in the barcode and UMI regions and filtering out low complexity reads, most of which are non-informative repetitive sequences such as polyA. The output FASTQ file contains transcript sequences, with barcode information merged into the read names.
Fig 1. The scPipe workflow.
scPipe is an R/Bioconductor package that uses functionality from a number of other packages, including Rsubread to align reads to a reference genome (although in practice any aligner that produces BAM files can be used for read alignment) and SingleCellExperiment to organise the counts and sample annotation information. The major steps in the preprocessing pipeline of scPipe are shown along with the quality control (QC) statistics collected at each stage. The final output of this process is a matrix of counts and QC metrics for use in downstream analysis and an HTML report that summarises the analysis. The resulting SingleCellExperiment object can be used as input to other Bioconductor packages to perform further downstream analysis. scPipe logo created by Roberto Bonelli published under a CC0 1.0 license (https://github.com/Bioconductor/BiocStickers/blob/master/scPipe/README.md).
Read alignment, exon mapping and barcode demultiplexing
The next stage of preprocessing involves sequence alignment. For this task, any popular RNA-seq read aligner that produces BAM formatted output can be used. By default, scPipe uses the fast and convenient R-based Rsubread [19] aligner which is available on Linux and Mac OS operating systems. For publicly available datasets from sources such as GEO, FASTQ files are often available per cell and these need to be aligned first before they can be processed further using scPipe. For all different types of data, aligned reads in the BAM file are then assigned to exons by the sc_exon_mapping function according to a user provided annotation. Using a similar strategy to featureCounts [20], we divide chromosomes into non-overlapping bins and assess the overlap of aligned fragments with exons that fall within the bin to reduce the search complexity. This function records the mapping result, together with the UMI and cell barcodes available from the optional fields of the BAM file with specific BAM tags. By default we use the official BAM tag BC for cell barcode and OX for UMI sequence.
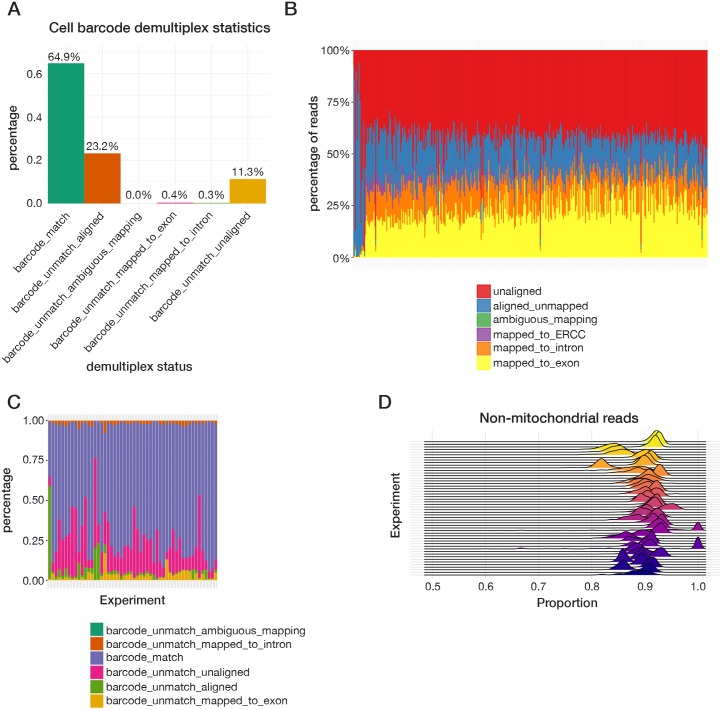
Next, the sc_demultiplex function is used to demultiplex results per cell using the sample barcode information. For CEL-seq and MARS-seq, the demultiplexing is based on the list of designed barcode sequences that the user provides, and allows for mismatches during the cell barcode matching step. For 10X and Drop-seq where the cell barcode sequences need to be identified from the reads, the function sc_detect_bc can be applied to identify enriched barcodes in the data that can then be supplied to sc_demultiplex. This function can accept a list of possible barcodes that may be present in the dataset (if available), such as the white list provided by 10X. Data from non-UMI protocols such as Smart-seq and Smart-seq2 can be handled by setting has_UMI to FALSE when running sc_demultiplex. The sc_detect_bc function summarises the sequences in the cell barcode region, collapsing reads with a small edit distance, which are indicative of sequencing errors. It can report a given number of cell barcodes or keep the cell barcodes based on a read number cutoff. A relaxed threshold is generally recommended when one specifies the number of barcodes to retain, for instance if the estimated number of cells in the library is 1,000-5,000, a threshold of 10,000 would ensure data for all cells is collected. The motivation behind this is that unlike CellRanger, we don’t recommend detecting low quality cells or empty barcodes solely based on the number of reads or UMI counts per cell. Instead, more robust and meaningful results can be produced using multiple QC metrics. Hence the sc_detect_bc function should be run to allow more barcodes than cells. The quality control function in scPipe can be used to remove erroneous cell barcodes at a later stage. The demultiplexed data are output in a csv file for each cell, where each row corresponds to a read that maps to a specific gene, and columns that include gene id, UMI sequence and mapping position. The overall barcode demultiplexing results are recorded and can be plotted as shown in Fig 2A for the mouse blood cells generated by the CEL-seq2 protocol.
Fig 2. Example QC plots that can be created using output from scPipe to assess data quality both within and between experiments.
Within experiment displays include (A) a bar plot illustrating the overall cell barcode matching results to assess sequencing accuracy across all samples and (B) a stacked bar plot showing the mapping rate, separated into reads that map to exon, intron and ERCCs and those that are ambiguously mapped, map elsewhere in the genome and are unaligned for each cell in an experiment (ordered by exon mapping rate). Between experiment displays include (C) a stacked bar plot showing the cell barcode matching results from panel (A) from multiple experiments and (D) a ridgeline plot presenting the distribution of proportions of non-mitochondrial read counts for cells across multiple experiments.
Obtaining a gene count matrix and performing quality assessment
The next stage of preprocessing makes use of the sc_gene_counting function to remove PCR duplicates (also known as UMI deduplication) to generate a gene count matrix. scPipe uses a greedy approach based on hamming distance to do this. The detected UMIs are compared to each other and if two UMI sequences are found to be within a certain hamming distance apart (the default is 1) and one UMI has more than twice the count of the other, then the two different UMIs will be treated as instances of the same UMI. The approach is based on the fact that erroneous UMI sequences due to sequencing error usually just have one or two reads. PCR errors, however, can be more problematic, and other more sophisticated network-based methods such as the approach taken in UMI-tools have been developed to deal with such errors. When PCR error rates are low, the approach used in scPipe should give good results. Our pipeline outputs the raw UMI sequences that map to each gene, which can be used as input for more sophisticated UMI correction methods when the PCR error rate is high. After UMI deduplication we get a gene count matrix that can be used for further analysis. QC information is collected at each step (Fig 1) and includes the total number of mapped reads per cell, UMI deduplication statistics, per cell barcode demultiplexing statistics, UMI correction statistics and External RNA Controls Consortium (ERCC) spike-in control statistics (where present).
scPipe uses the S4 infrastructure provided by the SingleCellExperiment package [21] for data storage. A SingleCellExperiment object can be constructed by the create_sce_by_dir function using the data folder generated during preprocessing, or by manually specifying all the required slots. Alongside the gene count matrix, this object stores QC information obtained during preprocessing, and the type of gene id and organism name, which can both be useful in downstream functional enrichment analysis.
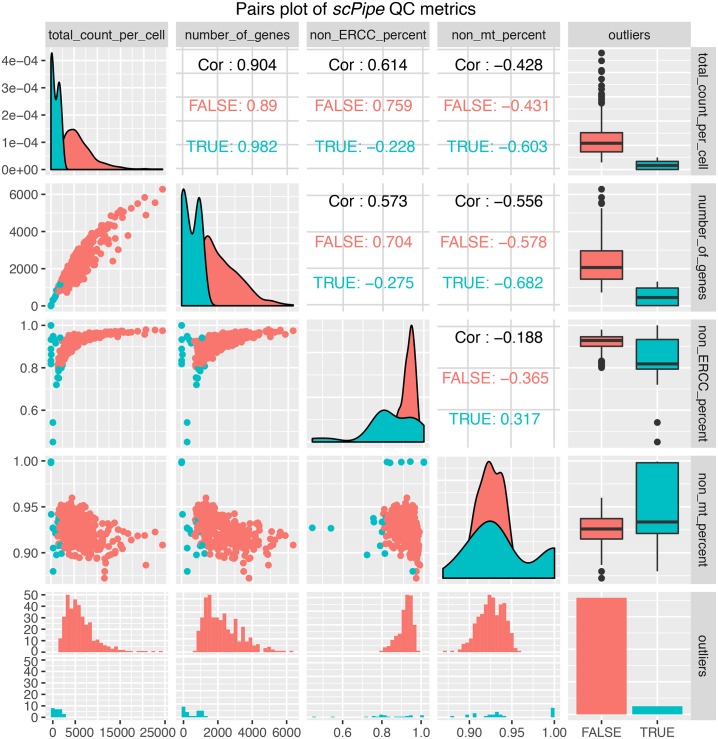
Next, alignment statistics for each cell can be plotted using the plotMapping function (Fig 2B). Data shown here is again from the mouse blood cell dataset described previously. Monitoring these QC statistics across experiments (Fig 2C and 2D) can be particularly useful for labs that routinely process single-cell data, allowing them to assess the impact changes in lab processes and protocols have on data quality. Pairwise scatter plots of QC metrics such as the total molecules per cell and the number of genes detected can be generated with the plotQC_pair function (Fig 3).
Fig 3. A pairwise scatter plot of the quality control metrics collected by scPipe for the mouse blood cell dataset.
Sample-specific metrics include the total read count, the number of genes detected and the proportion of non-ERCC or non-mitocondrial reads. The good quality and outlier samples detected by scPipe’s automatic outlier detection method are indicated in each panel by a different colour.
scPipe implements a multivariate outlier detection method for discovering low quality cells to remove from further analysis. The method uses up to 5 metrics (log-transformed number of molecules detected, the number of genes detected, the percentage of reads mapping to ribosomal, or mitochondrial genes and ERCC recovery (where available)) as input (Fig 3) to a Gaussian mixture model (GMM). There are three stages in the outlier detection process. First the Mahalanobis distances between cells based on the quality control metrics chosen are calculated, with extreme cells removed before fitting the GMM using the mclust package [22]. The QC metrics of the remaining cells are used to capture the overall heterogeneity in the dataset. The mixture component with systematically lower QC metrics, such as lower numbers of genes detected and lower numbers of molecular counts are marked as outliers. In the final stage, the Mahalanobis distance is calculated for cells from the mixture component with the highest QC metric values with outliers automatically detected based on this distance. Outlier detection can then be reconciled with visual inspection of the QC metrics through the afore-mentioned QC plotting options to fine tune the sample-specific filtering thresholds chosen. Depending on the data, the only argument that needs to be specified is the maximum number of components in the GMM. In most cases, this is set to 1 or 2 for good quality data with only a small proportion of poor quality cells. For data generated by droplet-based protocols where larger proportions of poor quality cells may be expected, the number of components can be set to 2 or 3 to model extra components that correspond to the good and poor quality cells. Apart from the number of components, the user can also adjust the confidence interval for choosing outliers (0.99 by default).
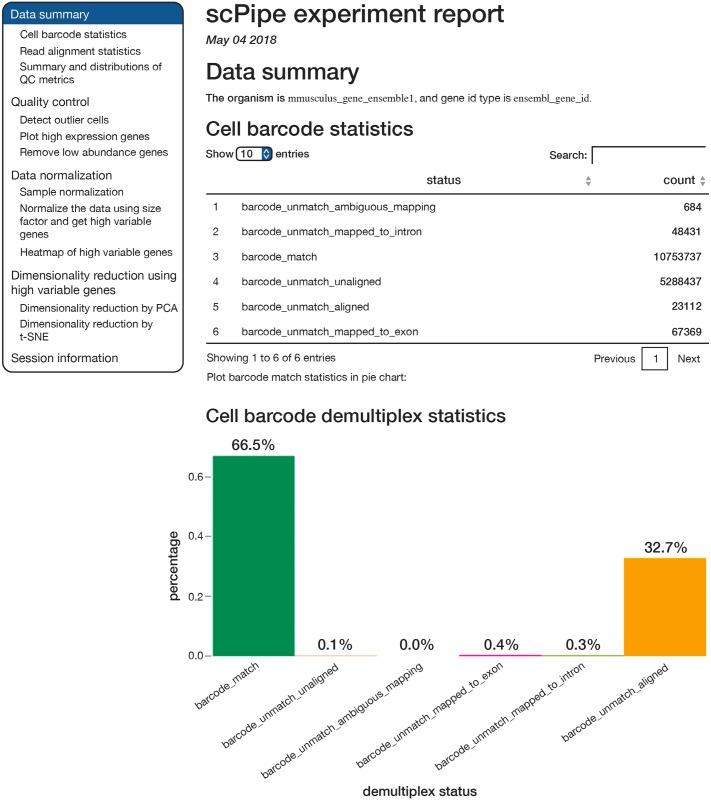
An HTML report generated using rmarkdown [15] that includes all run parameters used, QC statistics and various types of dimension reduction plots of both the gene expression data and QC metrics can be generated using the create_report function (Fig 4). As scPipe generates consistent QC measures across different protocols and experiments, these QC metrics can be easily combined (Fig 2C and 2D) to facilitate comparisons between multiple datasets.
Fig 4. Screenshot of an HTML report created by scPipe for the mouse blood cell dataset.
This report organises the output of scPipe, including run parameters and QC metrics and also generates basic dimension reduction plots of the data. Such reports provide a convenient format for communicating basic QC information to collaborators to help them evaluate the overall quality of an experiment.
After QC, the data can be easily passed to downstream packages. Use of the SingleCellExperiment class ensures the output of scPipe is fully interoperable with a range of other Bioconductor packages. For instance, packages such as scater, scran and BASiCS [23] can be used for normalization, zinbwave [24] for dealing with zero inflation in the data and removing unwanted variation, SC3 [25] and clusterExperiment [26] for clustering and MAST [27] and scDD [28] for differential expression analysis.
Using scPipe
A vignette accompanying the package provides further details on implementation and an example use case on the CEL-seq2 mouse blood dataset.
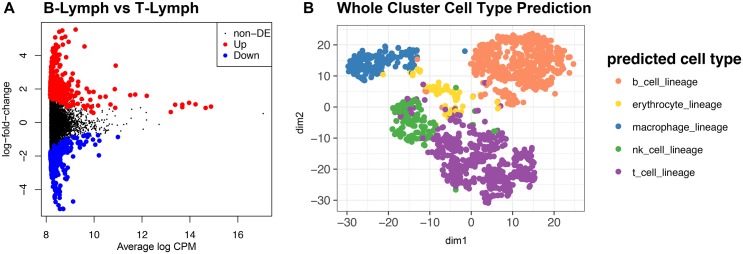
This example dataset contains 100 million reads and takes under 2 hours to process on a standard Linux server. scPipe creates a SingleCellExperiment object from the count matrix and mapping statistics output by the pipeline which can be manipulated using other Bioconductor packages for single cell analysis. scPipe’s outlier detection has been used to remove low quality cells (Fig 3). For the mouse blood dataset, scPipe’s outlier removal retained 359 of 383 cells for further analysis and in the human spleen dataset, 1,397 of the 2,273 detected cells were retained for further analysis. We applied scran to compute size factors for normalization. Differential expression analysis was performed between the a priori defined B-lymphocyte and T-lymphocyte cells (based on FACS sorting information available for the cells in each well) using a generalised linear model from edgeR [29] after performing conversion to a DGEList using scater (Fig 5A). From this analysis 636 differentially expressed genes were discovered based on likelihood-ratio testing (LRT) at a 0.05 false-discovery-rate (FDR) threshold.
Fig 5. Analysis results produced with SingleCellExperiment-compatible packages from Bioconductor.
(A) Differential gene expression results from comparing B-lymphocytes and T-lymphocytes known a priori in the CEL-seq2 mouse blood dataset. Highlighted points are genes determined to be significantly differentially expressed from LRT with 0.05 FDR cutoff. (B) tSNE coloured by cell type predictions obtained for SC3 clusters for the first spleen sample from the Human Cell Atlas ischaemic sensitivity dataset. The 10 clusters from SC3 were assigned to 5 distinct cell types from the reference set of 12 lineages.
A second example uses data from the pilot Human Cell Atlas ischaemic sensitivity dataset, which was again preprocessed by scPipe, with automatic outlier detection leaving 1,397 cells, which were then normalized using scran. Next, we performed cell clustering with SC3, where the number of clusters produced was optimised by SC3’s estimate_k function to give 10 clusters. To annotate these clusters, the mean normalized expression of each cluster was correlated with a microarray dataset of 12 immunological lineages [30]. The lineage with the highest correlation was considered the most likely cell type candidate for each cluster. Using this method, the 10 clusters identified by SC3 were assigned to 5 of the 12 potential candidate lineages (Fig 5B).
A third example of running scPipe on the Chromium 10X cell line data is, which has 400 million reads from around 1,000 cells takes about 10 hours on a standard Linux server. We also provide examples of using scPipe with an alternate aligner (STAR [31]). Code for each of these example analyses is provided as Supplementary Information from http://bioinf.wehi.edu.au/scPipe/.
scPipe is a fully modular pipeline, with each step generating independent results. It is also flexible with its inputs, accepting FASTQ as outlined above, or BAM files produced by CellRanger and Dropseq tools (http://mccarrolllab.com/dropseq/) from which a gene count matrix can be generated. This approach ensures interoperability with tools both inside and outside of Bioconductor to give the data analyst maximum flexibility when configuring their scRNA-seq analysis pipelines.
Comparing scPipe with other pipelines
We reviewed the tools currently available for scRNA-seq data preprocessing identified through the ‘Alignment’ and ‘UMIs’ categories provided by the https://www.scrna-tools.org/ website [4]. The search revealed 9 tools that have overlapping functionality with scPipe, summarised in Table 1. Our software is the only Bioconductor package that spans all major single cell platforms (both plate and droplet-based) and the full range of preprocessing tasks (alignment, UMI handling and QC). The shell program zUMIs [32] is another program that covers the breadth of platforms and preprocessing tasks. Other software tools, such as dropSeqPipe, CellRanger and dropEst [8] only deal with data from droplet-based protocols, Sharq [33] is suitable for plate-based approaches, and the remaining handle the UMI processing step only. CellRanger is the only tool that also offers downstream analysis, with clustering and differential expression testing included in its default output.
Table 1. Summary of the data preprocessing software currently available for scRNA-seq analysis and the particular tasks covered by each package.
| Software | Language | Input | Multiple technologies | Analysis task | |||
|---|---|---|---|---|---|---|---|
| Alignment | UMI handling | QC metrics | Downstream analysis | ||||
| scPipe | R | FASTQ | ✓ | ✓ | ✓ | ✓ | × |
| zUMIs | Shell | FASTQ | ✓ | ✓ | ✓ | ✓ | × |
| dropSeqPipe | Snakemake | FASTQ | × | ✓ | ✓ | ✓ | × |
| Sharq | Python/Perl/R | FASTQ | × | ✓ | ✓ | ✓ | × |
| CellRanger | Python/R | BCL/FASTQ | × | ✓ | ✓ | ✓ | ✓ |
| dropEst | C++/R | FASTQ | × | ✓ | ✓ | ✓ | × |
| UMI-tools | Python | FASTQ | ✓ | × | ✓ | × | × |
| umis | Python | FASTQ | ✓ | × | ✓ | × | × |
| sircel | Python | FASTQ | ✓ | × | ✓ | × | × |
| TRUmiCount | R/Shell | BAM | ✓ | × | ✓ | × | × |
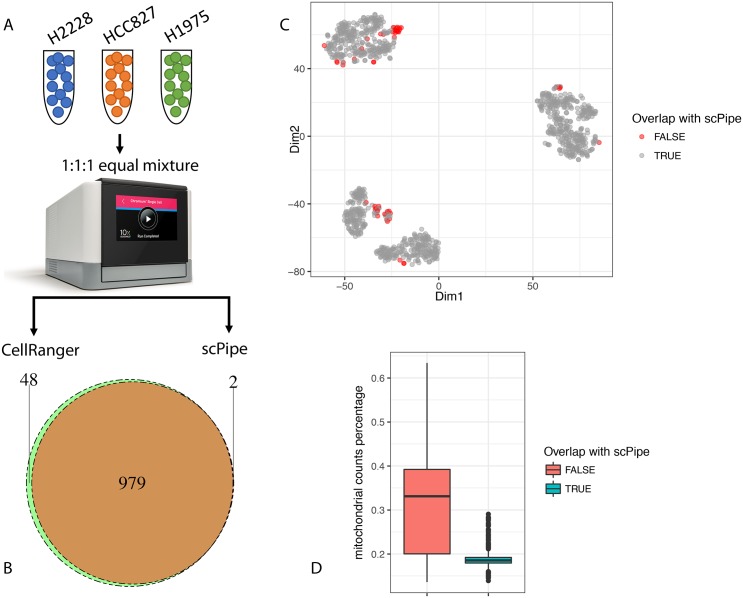
In order to highlight the differences between scPipe and the popular CellRanger pipeline that processes raw data from the Chromium 10X platform, we performed a benchmark experiment that included 3 human lung adenocarcinoma cell lines (see Materials and methods) and processed the raw data using both scPipe and CellRanger (Fig 6A). The dataset contains about 1,000 cells. CellRanger returns 1,027 cells and scPipe 981 cells after QC (Fig 6B). The t-SNE plot [34] generated from the CellRanger output shows that the 48 cells that appear in the CellRanger results but not in scPipe tend to cluster together (Fig 6C). Inspection of their QC metrics (Fig 6D) shows that these cells have higher proportions of mitochondrial gene counts, suggesting they may be dead cells that should be excluded from downstream analysis. Since CellRanger only uses the UMI counts per cell as a QC cutoff, the results generated by CellRanger may contain dead cells and benefit from a further round of QC. The scPipe analysis on the other hand uses multiple QC metrics by default (Fig 3) to achieve a robust measure of cell quality to ensure low quality cells are discarded. This comparison shows the benefit of scPipe’s built-in QC step.
Fig 6. Comparing scPipe and CellRanger.
(A) The workflow for the comparison. An equal mixture of cells from three cell lines are sequenced using the Chromium 10X platform (see Materials and methods). Data were processed by scPipe and CellRanger. (B) The pie chart shows the overlap of cell barcode detected by scPipe and CellRanger. (C) The t-SNE plot generated using CellRanger output. Cell barcodes that only exist in CellRanger are highlighted. (D) Box plots showing the percentage of mitochondrial gene counts in cells that overlap with scPipe or only exist in the CellRanger results.
Availability and future directions
The scPipe package is available from https://www.bioconductor.org/packages/scPipe. Code for each of the example analyses described in the ‘Using scPipe’ section above is available from http://bioinf.wehi.edu.au/scPipe/. Bug reports and questions about using scPipe should be posted on the Bioconductor support site (https://support.bioconductor.org/).
With the growing popularity of scRNA-seq technology, many tools have been developed for normalization, dimensionality reduction and clustering. There are relatively few packages designed to handle the raw data obtained from the various 3’ end sequencing protocols with their associated UMIs and cell-specific barcodes from beginning to end and collect detailed quality control information. The scPipe package bridges this gap between the raw FASTQ files with mixed barcode types and transcript sequences and the gene count matrix that is the entry point for all downstream analyses. scPipe outputs numerous QC metrics obtained at each preprocessing step and displays these results in an HTML report to assist end users in QC evaluations. Future improvements that are planned for scPipe include support for new scRNA-seq protocols as they emerge and parallelization of the various preprocessing steps to enable scalability to larger datasets. We also plan to generate a more comprehensive scRNA-seq benchmark dataset to ensure the default UMI correction and quality control methods used in scPipe are optimal that will also allow for a more detailed comparison of scPipe with other relevant analysis pipelines, such as zUMIs.
Acknowledgments
The authors are grateful to Saskia Freytag, Carolyn de Graaf, Aaron Lun, Rowland Mosbergen, Othmar Korn and Valerie Obenchain for their advice and feedback on the scPipe software, Roberto Bonelli for designing the scPipe logo and Clare Weeden and Marie-Liesse Asselin-Labat for providing the cell lines used in the Chromium 10X experiment.
Data Availability
Datasets are available under GEO accession numbers GSE109999 and GSE111108 or from the Human Cell Atlas Preview Datasets webpage (https://preview.data.humancellatlas.org/).
Funding Statement
This work was supported by the National Health and Medical Research Council (NHMRC) Project Grants (GNT1143163 to MER, GNT1124812 to SHN and MER, GNT1062820 to SHN), Fellowship GNT1104924 to MER, the Chan Zuckerberg Initiative DAF, an advised fund of Silicon Valley Community Foundation (grant number 2018-182819 to MER), a Melbourne Research Scholarship to LT, Genomics Innovation Hub, Victorian State Government Operational Infrastructure Support and Australian Government NHMRC IRIISS. The funders had no role in study design, data collection and analysis, decision to publish, or preparation of the manuscript.
References
- 1. Patel A, Tirosh I, Trombetta J, Shalek A, Gillespie S, Wakimoto H, et al. Single-cell RNA-seq highlights intratumoral heterogeneity in primary glioblastoma. Science. 2014;344(6190):1396–1401. 10.1126/science.1254257 [DOI] [PMC free article] [PubMed] [Google Scholar]
- 2. Macosko E, Basu A, Satija R, Nemesh J, Shekhar K, Goldman M, et al. Highly Parallel Genome-wide Expression Profiling of Individual Cells Using Nanoliter Droplets. Cell. 2015;161(5):1202–1214. 10.1016/j.cell.2015.05.002 [DOI] [PMC free article] [PubMed] [Google Scholar]
- 3. Trapnell C, Cacchiarelli D, Grimsby J, Pokharel P, Li S, Morse M, et al. The dynamics and regulators of cell fate decisions are revealed by pseudotemporal ordering of single cells. Nat Biotechnol. 2014;32(4):381–386. 10.1038/nbt.2859 [DOI] [PMC free article] [PubMed] [Google Scholar]
- 4. Zappia L, Phipson B, Oshlack A. Exploring the single-cell RNA-seq analysis landscape with the scRNA-tools database. PLoS Comput Biol. 2018;14(6):e1006245 10.1371/journal.pcbi.1006245 [DOI] [PMC free article] [PubMed] [Google Scholar]
- 5. Smith T, Heger A, Sudbery I. UMI-tools: modeling sequencing errors in Unique Molecular Identifiers to improve quantification accuracy. Genome Res. 2017;27(3):491–99. 10.1101/gr.209601.116 [DOI] [PMC free article] [PubMed] [Google Scholar]
- 6. Svensson V, et al. Power analysis of single-cell RNA-sequencing experiments. Nat Methods. 2017;14(4):381–87. 10.1038/nmeth.4220 [DOI] [PMC free article] [PubMed] [Google Scholar]
- 7. Zheng GXY, Terry JM, Belgrader P, Ryvkin P, Bent ZW, Wilson R, et al. Massively parallel digital transcriptional profiling of single cells. Nat Commun. 2017;8:14049 10.1038/ncomms14049 [DOI] [PMC free article] [PubMed] [Google Scholar]
- 8. Petukhov V, Guo J, Baryawno N, Severe N, Scadden DT, Samsonova MG, et al. dropEst: pipeline for accurate estimation of molecular counts in droplet-based single-cell RNA-seq experiments. Genome Biol. 2018;19(1):78 10.1186/s13059-018-1449-6 [DOI] [PMC free article] [PubMed] [Google Scholar]
- 9. McCarthy DJ, et al. Scater: pre-processing, quality control, normalisation and visualisation of single-cell RNA-seq data in R. Bioinformatics. 2017;33(8):1179–86. 10.1093/bioinformatics/btw777 [DOI] [PMC free article] [PubMed] [Google Scholar]
- 10. Lun ATL, McCarthy DJ, Marioni JC. A step-by-step workflow for low-level analysis of single-cell RNA-seq data with Bioconductor. F1000Res. 2016;5:2122 10.12688/f1000research.9501.2 [DOI] [PMC free article] [PubMed] [Google Scholar]
- 11. Hashimshony T, Senderovich N, Avital G, Klochendler A, de Leeuw Y, Anavy L, et al. CEL-Seq2: sensitive highly-multiplexed single-cell RNA-Seq. Genome Biol. 2016;17:77 10.1186/s13059-016-0938-8 [DOI] [PMC free article] [PubMed] [Google Scholar]
- 12.Harding P, Wilbrey-Clark A, Polanski K, Loudon K, Ferdinand JR, Mahbubani K, et al. Ischaemic Sensitivity of Human Tissue; 2018. Available from: https://preview.data.humancellatlas.org/.
- 13. R Core Team. R: A Language and Environment for Statistical Computing; 2017. Available from: https://www.R-project.org/. [Google Scholar]
- 14. Huber W, Carey VJ, Gentleman R, Anders S, Carlson M, Carvalho BS, et al. Orchestrating high-throughput genomic analysis with Bioconductor. Nat Methods. 2015;12(2):115–21. 10.1038/nmeth.3252 [DOI] [PMC free article] [PubMed] [Google Scholar]
- 15.Allaire JJ, Xie Y, McPherson J, Luraschi J, Ushey K, Atkins A, et al. rmarkdown: Dynamic Documents for R; 2017. Available from: https://CRAN.R-project.org/package=rmarkdown.
- 16. Eddelbuettel D, François R. Rcpp: Seamless R and C++ Integration. Journal of Statistical Software. 2011;40(8):1–18. 10.18637/jss.v040.i08 [DOI] [Google Scholar]
- 17. Eddelbuettel D. Seamless R and C++ Integration with Rcpp. New York: Springer; 2013. [Google Scholar]
- 18.Hayden N, Morgan M. Rhtslib: HTSlib high-throughput sequencing library as an R package; 2017. Available from: https://bioconductor.org/packages/Rhtslib.
- 19. Liao Y, Smyth GK, Shi W. The Subread aligner: fast, accurate and scalable read mapping by seed-and-vote. Nucleic Acids Res. 2013;41(10):e108 10.1093/nar/gkt214 [DOI] [PMC free article] [PubMed] [Google Scholar]
- 20. Liao Y, Smyth GK, Shi W. featureCounts: an efficient general-purpose program for assigning sequence reads to genomic features. Bioinformatics. 2014;30(7):923–30. 10.1093/bioinformatics/btt656 [DOI] [PubMed] [Google Scholar]
- 21.Lun A, Risso D. SingleCellExperiment: S4 Classes for Single Cell Data; 2017. Available from: https://bioconductor.org/packages/SingleCellExperiment.
- 22. Scrucca L, Fop M, Murphy TB, Raftery AE. mclust 5: clustering, classification and density estimation using Gaussian finite mixture models. The R Journal. 2016;8(1):205–233. [PMC free article] [PubMed] [Google Scholar]
- 23. Vallejos CA, Marioni JC, Richardson S. BASiCS: Bayesian Analysis of Single-Cell Sequencing Data. PLoS Comput Biol. 2015;11(6):e1004333 10.1371/journal.pcbi.1004333 [DOI] [PMC free article] [PubMed] [Google Scholar]
- 24. Risso D, Perraudeau F, Gribkova S, Dudoit S, Vert JP. A general and flexible method for signal extraction from single-cell RNA-seq data. Nat Commun. 2018;9(1):284 10.1038/s41467-017-02554-5 [DOI] [PMC free article] [PubMed] [Google Scholar]
- 25. Kiselev VY, Kirschner K, Schaub MT, Andrews T, Yiu A, Chandra T, et al. SC3: consensus clustering of single-cell RNA-seq data. Nat Methods. 2017;14(5):483–486. 10.1038/nmeth.4236 [DOI] [PMC free article] [PubMed] [Google Scholar]
- 26. Risso D, Purvis L, Fletcher R, Das D, Ngai J, Dudoit S, et al. clusterExperiment and RSEC: A Bioconductor package and framework for clustering of single-cell and other large gene expression datasets. bioRxiv. 2018; [DOI] [PMC free article] [PubMed] [Google Scholar]
- 27. Finak G, McDavid A, Yajima M, Deng J, Gersuk V, Shalek A, et al. MAST: A Flexible Statistical Framework for Assessing Transcriptional Changes and Characterizing Heterogeneity in Single-Cell RNA Sequencing Data. Genome Biol. 2015;16:278 10.1186/s13059-015-0844-5 [DOI] [PMC free article] [PubMed] [Google Scholar]
- 28. Korthauer K, Chu L, Newton M, Yuan L, Thomson J, Stewart R, et al. A statistical approach for identifying differential distributions in single-cell RNA-seq experiments. Genome Biol. 2016;17(1):222 10.1186/s13059-016-1077-y [DOI] [PMC free article] [PubMed] [Google Scholar]
- 29. McCarthy DJ, Chen Y, Smyth GK. Differential expression analysis of multifactor RNA-Seq experiments with respect to biological variation. Nucleic Acids Res. 2012;40(10):4288–4297. 10.1093/nar/gks042 [DOI] [PMC free article] [PubMed] [Google Scholar]
- 30. Novershtern N, Subramanian A, Lawton LN, Mak RH, Haining WN, McConkey ME, et al. Densely interconnected transcriptional circuits control cell states in human hematopoiesis. Cell. 2011;144(2):296–309. 10.1016/j.cell.2011.01.004 [DOI] [PMC free article] [PubMed] [Google Scholar]
- 31. Dobin A, Davis CA, Schlesinger F, Drenkow J, Zaleski C, Jha S, et al. STAR: ultrafast universal RNA-seq aligner. Bioinformatics. 2013;29(1):15–21. 10.1093/bioinformatics/bts635 [DOI] [PMC free article] [PubMed] [Google Scholar]
- 32. Parekh S, Ziegenhain C, Vieth B, Enard W, Hellmann I. zUMIs—A fast and flexible pipeline to process RNA sequencing data with UMIs. Gigascience. 2018;7(6). 10.1093/gigascience/giy059 [DOI] [PMC free article] [PubMed] [Google Scholar]
- 33. Candelli T, Lijnzaad P, Muraro MJ, Kerstens H, Kemmeren P, van Oudenaarden A, et al. Sharq, a versatile preprocessing and QC pipeline for Single Cell RNA-seq. bioRxiv. 2018; [Google Scholar]
- 34. van der Maaten LJP, Hinton GE. Visualizing High-Dimensional Data Using t-SNE. Journal of Machine Learning Research. 2008;9:2579–2605. [Google Scholar]
Associated Data
This section collects any data citations, data availability statements, or supplementary materials included in this article.
Data Availability Statement
Datasets are available under GEO accession numbers GSE109999 and GSE111108 or from the Human Cell Atlas Preview Datasets webpage (https://preview.data.humancellatlas.org/).


