

ABSTRACT
The observed MIC may depend on the number of bacteria initially inoculated into the assay. This phenomenon is termed the inoculum effect (IE) and is often most pronounced for β-lactams in strains expressing β-lactamase enzymes. The Clinical and Laboratory Standards Institute (CLSI)-recommended inoculum is 5 × 10⁵ CFU ml−1 with an acceptable range of 2 × 10⁵ to 8 × 10⁵ CFU ml−1. IE testing is typically performed using an inoculum 100-fold greater than the CLSI-recommended inoculum. Therefore, it remains unknown whether the IE influences MICs during testing performed according to CLSI guidelines. Here, we utilized inkjet printing technology to test the IE on cefepime, meropenem, and ceftazidime-avibactam. First, we determined that the inkjet dispense volume correlated well with the number of bacteria delivered to microwells in 2-fold (R2 = 0.99) or 1.1-fold (R2 = 0.98) serial dilutions. We then quantified the IE by dispensing orthogonal titrations of bacterial cells and antibiotics. For cefepime-resistant and susceptible dose-dependent strains, a 2-fold increase in inoculum resulted in a 1.6 log2-fold increase in MIC. For carbapenemase-producing strains, each 2-fold reduction in inoculum resulted in a 1.26 log2-fold reduction in meropenem MIC. At the lower end of the CLSI-allowable inoculum range, minor error rates of 34.8% were observed for meropenem when testing a resistant-strain set. Ceftazidime-avibactam was not subject to an appreciable IE. Our results suggest that IE is sufficiently pronounced for meropenem and cefepime in multidrug-resistant Gram-negative pathogens to affect categorical interpretations during standard laboratory testing.
KEYWORDS: inoculum effect, inkjet printing, carbapenem-resistant Enterobacteriaceae, antimicrobial susceptibility testing, broth microdilution, MIC, CLSI, extended-spectrum β-lactamase producers, inoculum
INTRODUCTION
The observed MIC of a bacterial isolate may depend on the initial inoculum used in an antimicrobial susceptibility testing (AST) assay, a phenomenon termed the inoculum effect (IE) (1). This effect is most pronounced for bacteria exposed to β-lactam antibiotics, especially strains containing β-lactamases (2, 3). However, it also has been observed for other classes of antimicrobials, including glycopeptides (4), macrolides (5), aminoglycosides (6), fluoroquinolones (7), daptomycin (4), and folate pathway inhibitors (7). Further, IE has been observed for azoles (8), echinocandins (9), amphotericin (10), and 5-fluorocytosine with pathogenic fungi (11).
For reference broth microdilution (BMD) AST, the Clinical and Laboratory Standards Institute (CLSI) requires a standardized inoculum density of 5 × 10⁵ CFU ml−1 with an allowable range of 2 × 10⁵ to 8 × 10⁵ CFU ml−1 (12). Traditionally, an IE has been defined as a ≥8-fold change in MIC when an inoculum 100-fold greater than the CLSI recommendation is used, and most prior experiments evaluated IE at the standard and high inoculum levels only (3, 13–15). A small number of studies also evaluated IE at low inocula, typically 10-fold below the CLSI target inoculum (16), and rarely using finer gradations (17).
The relevance of IE in vivo has been debated. There are some types of infections with high bacterial burdens in which IE may come into play (18, 19). Alternatively, factors such as released β-lactamase, which contribute to IE through antibiotic degradation in vitro, may become diluted in bodily fluids in vivo and therefore may not undermine antibiotic potency to the same degree. Regardless of the impact on antimicrobial efficacy in vivo, it remains largely unexplored whether IEs are detectable at bacterial inoculum densities close to the CLSI-recommended inoculum and could thereby influence reproducibility of AST performed in accordance with recommended guidelines.
We hypothesized that IE would manifest even within the CLSI-allowable inoculum range and serve as a source of error and inconsistency in AST determinations. To enable the exploration of effects of subtle differences in inoculum, we used inkjet printing technology, previously validated in our laboratory (20–24), to prepare orthogonal titrations of bacterial inoculum and antibiotics to investigate IE with a fine granularity to an extent not previously possible.
RESULTS
Extended-range quantification of inoculum effect.
Detailed assessment of IE has been limited by the technical challenge of manual preparation of orthogonal dilution series of antibiotic and organism. We therefore considered the use of HP D300 inkjet printing technology as a way to facilely prepare such combinatorial titrations. We previously validated use of this inkjet printing technology for single-agent MIC testing (20, 21) and multiple-agent synergy testing (22, 23) in a 384-well format with results as accurate as, and more precise than, reference BMD. We also validated use of the same inkjet technology for quantitative addition of bacteria in a 384-well plate format across a narrow (<10-fold) dynamic range (24). Prior to use of inkjet printing for IE testing, we first investigated the utility of this technology for dispensing of bacterial cells across an extended inoculum range and for delivering fine, reproducible gradations of inoculum.
We selected Escherichia coli ATCC 25922, Pseudomonas aeruginosa ATCC 27853, and Klebsiella pneumoniae BIDMC 40 as representative Gram-negative strains for this initial evaluation due to their potentially different behavior within inkjet dispensing channels. For example, P. aeruginosa cells are often longer than E. coli cells, while K. pneumoniae produces abundant capsular polysaccharide, attributes that could potentially affect the accuracy of inkjet dispensing. Across this test set, we were able to dispense viable bacteria over a wide range of final inoculum concentrations in a 384-well format, ranging from 9.2 × 101 to 3.7 × 10⁷ CFU ml−1 (linear dynamic range, 4.0 × 10⁵) (Fig. 1A). Furthermore, there was excellent correlation between inkjet dispense volume and organism number for all species (R2 > 0.99). These results indicated that accurate and precise inocula can be delivered for multiple types of organisms based on dispense volume.
FIG 1.
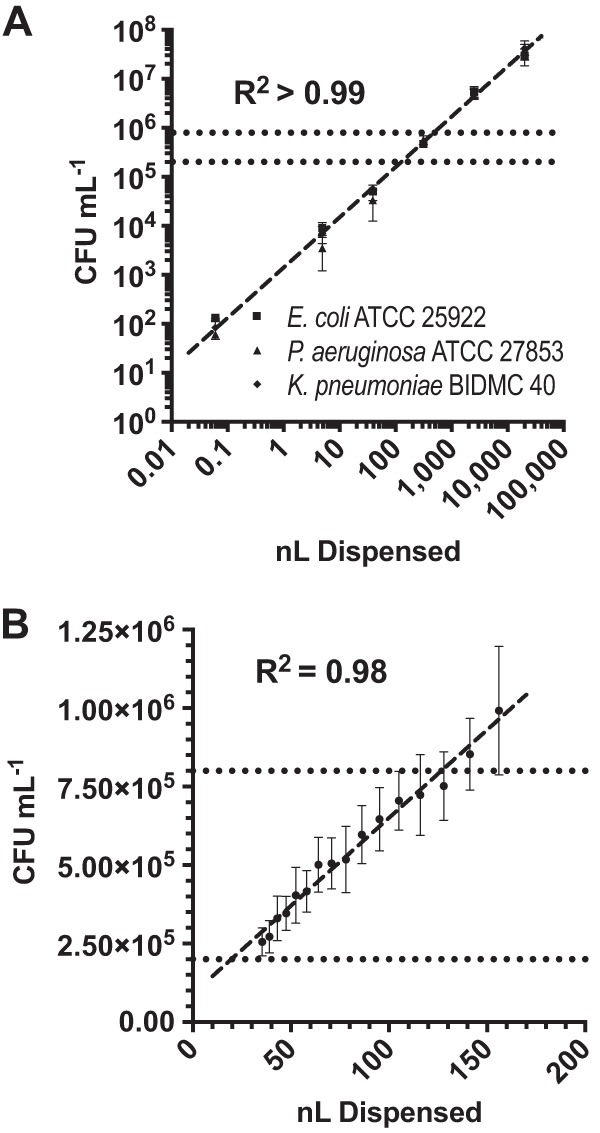
Inkjet dispensing precision. (A) Extended-dynamic-range dispensing. Bacteria were dispensed by inkjet printing in a 2-fold dilution series and enumerated by plate count. Each data point is the mean from three independent experiments performed on separate days, with error bars representing 1 standard deviation. There was a strong linear correlation (dashed line) between volume dispensed and CFU per milliliter (R2 > 0.99). (B) High-resolution dispensing. Bacteria were dispensed using inkjet technology in a (≈1.10-fold) dilution series and enumerated by plate count. Data points represent the averages from 3 independent experiments performed on separate days using 4 Enterobacteriaceae strains each, with error bars corresponding to 1 standard deviation from the mean. There was a strong linear correlation (dashed line) between dispense volume and CFU per milliliter delivered to wells (R2 = 0.98). Dotted lines indicate the CLSI-recommended inoculum range (2 × 10⁵ to 8 × 10⁵ CFU ml−1).
We next combined inkjet dispensing of 2-fold orthogonal titrations of bacteria and antibiotics to perform IE studies with meropenem, cefepime, and ceftazidime-avibactam. For meropenem experiments, we first examined 25 strains of carbapenem-resistant Enterobacteriaceae (CRE) with meropenem MICs ranging from 4 to 1,024 μg ml−1 (median, 32 μg ml−1). As expected, a pronounced IE was observed. The average MIC difference between the lowest and highest inocula of 9.2 × 101 and 3.7 × 10⁷ CFU ml−1 was 8.3 ± 1.8 log2 dilutions (range, 3 to 12) (Fig. 2A), corresponding to an ∼315-fold difference in MIC.
FIG 2.

Extended-range and high-resolution quantification of the inoculum effect. (A to C) Bacteria and antibiotics meropenem (A), cefepime (B), and ceftazidime-avibactam (C) were dispensed in orthogonal 2-fold dilution series. Each data point represents the log2 difference between the MIC at the indicated inoculum and the corresponding MIC at the CLSI target inoculum averaged across all strains within each category indicated. Error bars represent 1 standard deviation from the mean. Dotted lines demarcate the CLSI-recommended inoculum range. Carbapenem-resistant strains showed a pronounced reduction in meropenem MIC at inocula below the CLSI-recommended inoculum. Cefepime-resistant and -susceptible dose-dependent (SDD) strains showed a rapid increase in cefepime MIC at inocula above the CLSI-recommended inoculum. In contrast, a pronounced inoculum effect was not observed for ceftazidime-avibactam. (D) Bacteria and meropenem were dispensed using inkjet technology in (≈1.10-fold) and (≈1.19-fold) orthogonal dilution series, respectively. Each data point represents the log2 difference between the MIC determined at the indicated inoculum and the MIC at the CLSI target inoculum averaged across triplicate experiments performed on separate days using 8 CRE strains. Dotted lines demarcate the CLSI-recommended inoculum range.
Interestingly, the IE was most pronounced for inocula immediately below the CLSI target inoculum of 5 × 10⁵ CFU ml−1. In this range, each 2-fold reduction in inoculum resulted in a corresponding 1.26 log2-fold reduction in MIC. Fascinatingly, despite a very wide range in intrinsic meropenem MICs for the CRE strains examined, the IE remained similar relative to the MIC obtained at the CLSI target inoculum. This inference was suggested by the relatively small error bars in Fig. 2A, where each data point represents the log2 difference between the MICs at the indicated inoculum and the CLSI target inoculum, averaged across the entire CRE strain set. As expected, IE for 5 strains of non-carbapenemase-producing clinical isolates and E. coli ATCC 25922, all with MICs of ≤0.0625 μg ml−1, was essentially nonexistent, with elevated MICs observed only at >10-fold the CLSI-recommended inoculum.
We next evaluated cefepime IE by testing presumptive (based on ceftriaxone nonsusceptibility), extended-spectrum β-lactamase-producing (ESBL) Escherichia coli and Klebsiella spp. (Fig. 2B). For this analysis, we tested 13 cefepime-resistant (MIC ≥ 16 μg ml−1) and susceptible dose-dependent (SDD) strains (MIC = 4 to 8 μg ml−1) with MICs ranging from 4 to 32 μg ml−1 (25). We also tested 11 cefepime-susceptible (MIC ≤ 2 μg ml−1), presumptive ESBL strains with MICs ranging from 0.25 to 2 μg ml−1 (21). The cefepime-resistant and SDD strains showed a pronounced IE, especially with inocula above the CLSI target, for example, between 1 × 10⁶ and 1 × 10⁷ CFU ml−1, where a 2-fold increase in inoculum resulted in a 1.6 log2-fold increase in MIC. Cefepime-susceptible (MIC ≤ 2), presumptive ESBL showed a similar pattern at inocula above 1 × 10⁶, with each 2-fold increase corresponding to a 1.0 log2 increase in MIC. In contrast, a total of 6 cefepime-susceptible, presumptively non-ESBL-producing (based on susceptibility to cefazolin) clinical strains (20) and E. coli ATCC 25922 showed only a minor IE at very high inocula (>107 CFU ml−1).
Interestingly, in contrast to meropenem and cefepime, ceftazidime-avibactam (CZA) was subject to only a modest IE in strains resistant to this antibiotic (Fig. 2C). For CZA analysis, we tested 7 strains of carbapenem and CZA-resistant Enterobacteriaceae with CZA MICs ranging from 16/4 to >2,048/4 μg ml−1 and 6 strains of CZA-resistant Pseudomonas with CZA MICs ranging from 16/4 to >2,048/4 μg ml−1. The two strains expressing NDM-1 carbapenemase (one E. coli strain and one P. aeruginosa strain) exhibited off-scale MICs at all inocula tested (MIC >2,048/4 μg ml−1), and therefore, IE could not be evaluated. For non-NDM-1-producing, CZA-resistant strains, the difference in MIC between the highest and lowest inoculum tested was 2.9 ± 2 log2 dilutions, a 7.5-fold change in MIC. At inocula 2-fold below the CLSI-recommended level, there was only a relatively minor 0.73 ± 0.9 log2 reduction in MICs, which did not change with further reduction in inoculum, while with an inoculum 2-fold above the CLSI-recommended level there was no detectable log2 increase in MIC, and there was no substantial increase in MIC until an inoculum of ≥107 CFU ml−1 was used. We also tested clinical strains of CZA-susceptible Enterobacteriaceae (14 strains; MIC range = 0.5/4 to 8/4 μg ml−1) and Pseudomonas aeruginosa (4 strains; MIC range = 2/4 to 8/4 μg ml−1), all of which were ceftazidime and carbapenem resistant. E. coli ATCC 25922 and P. aeruginosa ATCC 27853 were used as broadly susceptible control strains. We observed a minor IE similar to that seen with the resistant strains.
High-resolution testing of inoculum effect.
Based on our observations that meropenem MICs in CRE strains are highly subject to IE, we reasoned that gradations of IE for CRE would be detectable using subdoubling dilutions of bacterial inoculum and may be observable within the allowable CLSI inoculum range. To test this idea, we validated the ability of inkjet printing technology to accurately deliver bacteria to wells using a (≈1.10-fold) dilution series in which every 7th well in the dilution series contains a 2-fold dilution of bacteria. As with our extended-range, bacterial-doubling-dilution series testing, we found that dispense volume and CFU count were highly correlated (R2 = 0.98) (Fig. 1B). Then, to investigate IE for meropenem at high resolution within the CLSI-allowable inoculum range, we performed orthogonal titrations using a (≈1.10-fold) dilution series of bacteria and a (≈1.19-fold) dilution series of meropenem. In this way, every 7th well in the dilution series contains a 2-fold dilution of bacteria and every 4th well contains a 2-fold dilution of antibiotic.
We found that IE was apparent for CRE strains even within the CLSI-recommended inoculum density range (Fig. 2D). Despite the fact that their meropenem MICs ranged from 8 to 32 μg ml−1, all 8 CRE strains tested showed reproducible changes in MICs using lower or higher inoculum than the CLSI target inoculum, consistent with observations using extended-range doubling dilution testing (Fig. 2A). In this experiment, we used a very fine meropenem dilution series. However, when values lying between log2 dilution series are tested, MICs are reported per CLSI guidelines as the next highest log2 dilution (26). Therefore, for each inoculum we rounded the MIC to the next-highest doubling dilution and tabulated the log2 difference from the MIC at the CLSI target inoculum (Table 1). In the completely resistant strain set of CRE tested (MIC range, 8 to 32 μg ml−1; resistance is defined as MIC of ≥4 μg ml−1), we found that the lowest inoculum tested within the CLSI-allowable inoculum range resulted in a 34.8% minor error rate. These data suggest that even small deviations from the CLSI inoculum may lead to an MIC discrepancy.
TABLE 1.
Quantification of the inoculum effect on meropenem MIC within the CLSI allowable inoculum rangea

All 8 strains tested were resistant to meropenem with MICs ranging from 8 to 32 μg ml−1 at the target CLSI inoculum: 4 strains had an MIC of 8; 3 had an MIC of 16; and 1 had an MIC of 32 μg ml−1. Notably, relative changes in MIC appeared to be independent of the original MIC, as also observed in results shown in Fig. 1. The shaded region represents inocula within the CLSI allowable inoculum range of 2 × 10⁵ to 8 × 10⁵ CFU ml−1.
MICs between 2-fold dilutions were rounded to the next-highest dilution per CLSI guidelines (26). The MIC at 4.9 × 10⁵ CFU ml−1 was defined as the CLSI inoculum. CI, confidence interval.
Minor errors are the percentages of tests resulting in categorical misclassification as intermediate at the indicated inoculum density. All minor errors occurred in strains whose MIC at the target inoculum was 8 μg ml−1.
DISCUSSION
The inoculum effect (IE) has traditionally been examined at very coarse intervals. Here we took advantage of the exceptionally accurate, precise, and quantitative capabilities afforded by inkjet printing technology to facilitate a detailed exploration of the IE for three β-lactam-based agents used to treat multidrug-resistant, Gram-negative pathogens: meropenem, cefepime, and the β-lactam and serine β-lactamase inhibitor combination, ceftazidime-avibactam.
For meropenem and cefepime, a pronounced IE for CRE and ESBL strains, respectively, was observed, with the largest changes in MIC centered on the CLSI-recommended inoculum. We examined meropenem IE within the CLSI-allowable inoculum range in detail and found substantial deviation in MIC results as the inoculum increased from 2 × 10⁵ to 8 × 10⁵ CFU ml−1 such that an 8-fold difference in MIC within this allowable inoculum range would not be uncommon. These results have important implications for the reliability of clinical laboratory data.
More specifically, CLSI advocates reporting categorical interpretation of cephalosporin and carbapenem MIC results based solely on the MIC obtained, regardless of the underlying resistance mechanism (25). In addition, more recently, CLSI introduced a new cefepime, susceptible dose-dependent category with recommendations to treat isolates with higher MIC values with more-intensive dosing regimens. Specifically, the CLSI recommends incremental dosing exposure for isolates with cefepime MICs of 2, 4, or 8 μg ml−1, respectively (25). Underpinning these recommendations is the assumption that routine testing will yield accurate MIC results and categorical interpretation. Yet, here we demonstrate that minor, allowable deviations in inoculum for isolates with ESBL phenotype or carbapenemases, respectively, can change the MIC and thereby potentially affect therapeutic decision points.
We note several limitations in our study. The CRE strain collection used in our high-resolution IE study had a meropenem MIC distribution of 8 to 32 μg ml−1. Therefore, we did not test strains whose MICs fell on the breakpoints for susceptible, intermediate, and resistant categories. As such, we could not evaluate major errors and did not expect to observe very major errors. However, a consistent observation in our studies was that the MIC was driven up or down the same degree by inoculum changes, regardless of the underlying MIC at the target CLSI inoculum. Therefore, we predict that testing of strains whose MIC values fall on categorical breakpoints would be error prone. For meropenem in particular, IE was more pronounced with lower inocula, and as such, very major errors would likely predominate over major errors for borderline resistant strains. Even with the resistant strain set examined, 34% of isolates would have been assigned an intermediate category when the lowest allowable CLSI inoculum tested was used. Such results in themselves might lead to erroneous decisions about the use or suitability of more-intensive or continuous-infusion carbapenem therapy to treat infections by organisms with borderline MIC values (27, 28).
We also do not know a priori how often the boundaries of the inoculum range would be breached or exceeded in a fast-paced clinical laboratory setting. Our prediction is that such deviations in inoculum would occur with some frequency using either manual or automated turbidimetric inoculum preparation with additional variability introduced during dilution to the final inoculum used in reference MIC or commercial susceptibility testing panels (29). Unfortunately, standard laboratory quality control testing (determining the MIC of strains such as E. coli ATCC 25922, not subject to IE) provides no feedback on inoculum consistency. Use of ESBL and CRE quality control organisms with well-defined IE would provide a more informative alternative. Should laboratories not have the appropriate procedures and quality control to ensure highly accurate inocula, we suggest two potential strategies for addressing IE testing issues: (i) conservative categorization of ESBL and CRE pathogens as cefepime and carbapenem resistant, respectively, regardless of their MIC, or (ii) repeat testing to ensure reproducibility of MIC results close to categorical breakpoints.
Our data support additional utility of inkjet technology in clinical microbiology testing beyond our previous description of at-will and accelerated, dilution-based testing (20–24). From a research perspective, it allowed us to examine the IE to an extent not previously possible with minimal labor. Specifically, high-resolution orthogonal bacterial/antibiotic synergy grids can be set up in seconds. In this work, a single individual was able to evaluate 99 bacterial strains at 16 different inocula each containing 16 to 24 concentrations of antimicrobial, an overwhelming task to perform manually.
Translational diagnostic implications are also of interest. Currently, carbapenemase and ESBL producers are identified using a two-step procedure involving identification of an elevated MIC followed by use of a second follow-up test of several different types: e.g., modified Hodge test, modified carbapenem inactivation method (mCIM), double-disk diffusion, or molecular tests to identify the category of resistance mechanism. The requirement for follow-up testing may delay optimal therapeutic intervention. In our studies, a marked IE was present in strains with carbapenemase (meropenem) or ESBL (cefepime) resistance mechanisms. Notably, detection of a 2 log2-fold change in MIC (compared to the CLSI inoculum) at 8-fold above or below the CLSI-recommended inoculum distinguishes between isolates with or without carbapenemases and extended-spectrum β-lactamases, respectively. Deployment of inkjet printing technology (or alternative liquid handling capabilities) would make application of tailored inocula for this one-step discrimination possible.
The relevance of IE itself to infection is not completely clear. Experimental evidence in mice suggests that IE plays a role in bloodstream (30), peritoneal (31), and lung (2) infections. However, in humans, there is currently significant debate about whether piperacillin-tazobactam and cefepime, for example, based on known IE, are appropriate therapeutic options for serious ESBL infections that test susceptible to these agents (32–34). Recent evidence suggests that patients treated with piperacillin-tazobactam or cefepime had lower survival during high-burden infection and bloodstream infection than those treated with meropenem (35). It should be noted that IE profiles of individual strains were not determined in these studies, and differential responses to piperacillin-tazobactam and cefepime could not therefore be directly linked to IE profile. We expect that the combination of the ability to perform IE testing with high granularity and use of tight inoculum control for accurate MIC determination, underscored by our studies, will help support rigorous pharmacokinetics/pharmacodynamics (PK/PD) investigation of IE and further elucidate the importance of IE in diagnosis and treatment.
MATERIALS AND METHODS
Bacterial strains and antibiotics.
We used previously characterized clinical strains of carbapenem-resistant (36), presumptive ESBL-producing (21), and broadly antibiotic-susceptible (20) Enterobacteriaceae collected from the clinical laboratory at our institution under an IRB-approved protocol. Our collection was supplemented by Enterobacteriaceae and Pseudomonas aeruginosa strains obtained from the FDA-CDC Antimicrobial Resistance Isolate Bank (CDC, Atlanta, GA). Escherichia coli ATCC 25922 and Pseudomonas aeruginosa ATCC 27853 were from the American Type Culture Collection (Manassas, VA).
Avibactam was purchased from Medchem Express (Monmouth Junction, NJ). Cefepime and ceftazidime were purchased from Chem-Impex International (Wood Dale, IL). Meropenem was purchased from Ark-Pharm (Arlington Heights, IL). Antibiotic stocks were prepared fresh daily. Avibactam was stored as aliquots for <1 week at −20°C and discarded after a single use.
Extended-range inkjet dispensing of bacteria.
E. coli ATCC 25922, P. aeruginosa ATCC 27853, and K. pneumoniae BIDMC 40 were recovered from stocks frozen at −80°C and grown for 16 to 20 h on tryptic soy agar containing 5% sheep's blood (Remel, Lenexa, KS) at 35°C in ambient air. Colonies were suspended in sterile 0.9% NaCl (Thermo Fisher Scientific, Waltham, MA) containing 0.3% polysorbate-20 (Sigma-Aldrich, St. Louis, MO) as required for liquid handling by the HP D300 Digital Dispenser (HP Inc., Palo Alto, CA). Cell density was adjusted using a Vitek DensiChek Plus handheld colorimeter (bioMérieux, Durham, NC). For each experiment, 0.5 and 2 McFarland standard suspensions were directly loaded into T8+ and D4+ cassettes, respectively (HP Inc.) and bacteria were dispensed into wells of a 384-well plate containing 50 μl of sterile, cation-adjusted Mueller-Hinton broth (CAMHB; BD Diagnostics, Franklin Lakes, NJ) using an HP D300 digital dispenser as previously described (24). Dispense volumes ranged from 5 μl to 1.22 nl in a 2-fold dilution series followed by a final 20-fold dilution (0.06-nl dispense volume).
Immediately after dispensing, bacteria were enumerated by the drop plate method using 10-μl drops (37). For wells containing the smallest dispense volume (0.06 nl), the entire 50-μl well volume was enumerated in a single drop. To ensure rigor and reproducibility, experiments were repeated on three separate days with independent inocula. A standard curve of dispense volume versus CFU per milliliter was constructed using GraphPad Prism 7.
Extended-range quantification of inoculum effect.
Bacterial strains were grown, adjusted to the desired density of 0.5 and 2 McFarland standards, and inoculated into 384-well plates prefilled with 50 μl of CAMHB as described above. Doubling dilutions of antibiotic were dispensed orthogonally to the bacterial dilution series. Meropenem was dissolved in dimethyl sulfoxide (DMSO). Final meropenem concentrations after dispensing ranged from 0.008 to 2,048 μg ml−1 with DMSO at <1%. Cefepime, ceftazidime, and avibactam stock solutions were dissolved in water containing 0.3% polysorbate-20 (Sigma-Aldrich) as required for liquid handling by the HP D300. Final cefepime concentrations after dispensing ranged from 0.008 to 256 μg ml−1. Final ceftazidime-avibactam concentrations after dispensing ranged from 0.008/4 to 2,048/4 μg ml−1.
After dispensing, plates were incubated at 35°C in ambient air for 16 to 20 h (25). Growth was quantified by optical density at 600 nm (OD600) using previously validated cutoffs for determination of growth and inhibition (20) using a Tecan M1000 multimode plate reader (Tecan, Morrisville, NC). We applied CLSI-recommended criteria to reject dilution series with >1 skipped well (26). Using these criteria, 0.93% (16/1,728) were rejected and were excluded from subsequent analysis. For each inoculum density, the MIC was determined, and log2-fold differences from the MIC at the CLSI-recommended inoculum (5 × 10⁵ CFU ml−1) were plotted using GraphPad Prism 7.
High-resolution inkjet dispensing of bacteria.
Four representative clinical isolates (2 E. coli and 2 K. pneumoniae isolates) were selected to validate inkjet dispensing of bacteria using a fine (<2-fold) dilution series. Bacteria were grown and suspended to a density of 2 McFarland standard in sterile 0.9% NaCl containing 0.3% polysorbate-20 as described above. Cells were loaded into D4+ cassettes (HP, Inc.) and dispensed into wells of a 384-well plate containing 50 μl of sterile CAMHB with the HP D300 using a (≈1.10-fold) dilution series with volumes ranging from 35.4 to 156 nl. In this dilution series, every 7th well contains a 2-fold dilution of bacteria. Cell density was quantified by the drop plate method using 5 drops (10 μl) from each dilution series (37). Experiments were performed in triplicate on separate days. We observed that 14.8% (57/384) of trials had at least one skipped well, potentially because the variability in inkjet dispensing drop size was similar to the spacing of dilutions. As such, we allowed up to two skipped wells while reading the highest MIC. In comparison to CLSI, which allows a single skipped well in a 2-fold dilution series (26), our criteria are actually more stringent since two skipped wells in our assay corresponded to less than 1 2-fold dilution difference. Application of our criteria resulted in 1.8% (7/384) of MICs being uninterpretable. A standard curve relating dispense volume to bacterial density was plotted using GraphPad Prism 7.
High-resolution quantification of inoculum effect.
Bacteria were dispensed into wells of a 384-well plate containing 50 μl of CAMHB using a dilution series as described above. An orthogonal titration of meropenem was prepared using a (≈1.19) dilution series such that every 4th well contained a 2-fold dilution of antibiotic. The concentration of meropenem ranged from −2 to +2 log2 dilutions from the expected MIC at the CLSI inoculum (as determined in the “extended-range quantification of the inoculum effect” experiment) of the isolate being tested. After dispensing, cells were incubated and growth was quantified as described above. For each inoculum density, the MIC was determined, with MICs falling between 2-fold dilutions rounded to the nearest doubling dilution per CLSI recommendations (26). Log2-fold differences from the MIC at the CLSI-recommended inoculum were plotted using GraphPad Prism 7. Experiments were performed using eight strains of CRE with meropenem MICs ranging from 8 to 32 μg ml−1 and repeated on three separate days with independent inocula.
ACKNOWLEDGMENTS
This work was conducted with support from Harvard Catalyst ∣ The Harvard Clinical and Translational Science Center (National Center for Research Resources and the National Center for Advancing Translational Sciences, National Institutes of Health Award UL1 TR001102) and financial contributions from Harvard University and its affiliated academic health care centers. K.P.S. was supported by the National Institute of Allergy and Infectious Diseases of the National Institutes of Health under award number F32 AI124590. The content is solely the responsibility of the authors and does not necessarily represent the official views of Harvard Catalyst, Harvard University and its affiliated academic health care centers, or the National Institutes of Health. J.E.K. was provided with an HP D300 for use in his research laboratory and received honoraria and travel support from Tecan, Inc. (Morrisville, NC). Consumables associated with the HP D300 were provided by Tecan and HP Inc. (Palo Alto, CA). Neither Tecan nor HP Inc. had any role in study design, data collection/interpretation, manuscript preparation, or decision to publish.
REFERENCES
- 1.Brook I. 1989. Inoculum effect. Rev Infect Dis 11:361–368. doi: 10.1093/clinids/11.3.361. [DOI] [PubMed] [Google Scholar]
- 2.Harada Y, Morinaga Y, Kaku N, Nakamura S, Uno N, Hasegawa H, Izumikawa K, Kohno S, Yanagihara K. 2014. In vitro and in vivo activities of piperacillin-tazobactam and meropenem at different inoculum sizes of ESBL-producing Klebsiella pneumoniae. Clin Microbiol Infect 20:O831–O839. doi: 10.1111/1469-0691.12677. [DOI] [PubMed] [Google Scholar]
- 3.Bedenic B, Beader N, Zagar Z. 2001. Effect of inoculum size on the antibacterial activity of cefpirome and cefepime against Klebsiella pneumoniae strains producing SHV extended-spectrum beta-lactamases. Clin Microbiol Infect 7:626–635. doi: 10.1046/j.1198-743x.2001.x. [DOI] [PubMed] [Google Scholar]
- 4.Benson CA, Beaudette F, Trenholm G. 1987. Comparative in-vitro activity of LY146032 a new peptolide, with vancomycin and eight other agents against Gram-positive organisms. J Antimicrob Chemother 20:191–196. [DOI] [PubMed] [Google Scholar]
- 5.Carbon C. 1998. Pharmacodynamics of macrolides, azalides, and streptogramins: effect on extracellular pathogens. Clin Infect Dis 27:28–32. doi: 10.1086/514619. [DOI] [PubMed] [Google Scholar]
- 6.Kelly MT, Matsen JM. 1976. In vitro activity, synergism, and testing parameters of amikacin, with comparisons to other aminoglycoside antibiotics. Antimicrob Agents Chemother 9:440–447. doi: 10.1128/AAC.9.3.440. [DOI] [PMC free article] [PubMed] [Google Scholar]
- 7.Fass RJ. 1983. In vitro activity of ciprofloxacin (Bay o 9867). Antimicrob Agents Chemother 24:568–574. doi: 10.1128/AAC.24.4.568. [DOI] [PMC free article] [PubMed] [Google Scholar]
- 8.Galgiani JN, Stevens DA. 1978. Turbidimetric studies of growth inhibition of yeasts with three drugs: inquiry into inoculum-dependent susceptibility testing, time of onset of drug effect, and implications for current and newer methods. Antimicrob Agents Chemother 13:249–254. doi: 10.1128/AAC.13.2.249. [DOI] [PMC free article] [PubMed] [Google Scholar]
- 9.Espinel-Ingroff A. 2003. Evaluation of broth microdilution testing parameters and agar diffusion Etest procedure for testing susceptibilities of Aspergillus spp. to caspofungin acetate (MK-0991). J Clin Microbiol 41:403–409. doi: 10.1128/JCM.41.1.403-409.2003. [DOI] [PMC free article] [PubMed] [Google Scholar]
- 10.Pujol I, Guarro J, Sala J, Riba MD. 1997. Effects of incubation temperature, inoculum size, and time of reading on broth microdilution susceptibility test results for amphotericin B against Fusarium. Antimicrob Agents Chemother 41:808–811. [DOI] [PMC free article] [PubMed] [Google Scholar]
- 11.Gehrt A, Peter J, Pizzo PA, Walsh TJ. 1995. Effect of increasing inoculum sizes of pathogenic filamentous fungi on MICs of antifungal agents by broth microdilution method. J Clin Microbiol 33:1302–1307. [DOI] [PMC free article] [PubMed] [Google Scholar]
- 12.Clinical and Laboratory Standards Institute. 2015. Methods for dilution antimicrobial susceptibility tests for bacteria that grow aerobically; approved standard, 10th ed CLSI document M07-A10. Clinical and Laboratory Standards Institute, Wayne, PA. [Google Scholar]
- 13.Adler A, Ben-Dalak M, Chmelnitsky I, Carmeli Y. 2015. Effect of resistance mechanisms on the inoculum effect of carbapenem in Klebsiella pneumoniae isolates with borderline carbapenem resistance. Antimicrob Agents Chemother 59:5014–5017. doi: 10.1128/AAC.00533-15. [DOI] [PMC free article] [PubMed] [Google Scholar]
- 14.Thomson KS, Moland ES. 2001. Cefepime, piperacillin-tazobactam, and the inoculum effect in tests with extended-spectrum beta-lactamase-producing Enterobacteriaceae. Antimicrob Agents Chemother 45:3548–3554. doi: 10.1128/AAC.45.12.3548-3554.2001. [DOI] [PMC free article] [PubMed] [Google Scholar]
- 15.Lopez-Cerero L, Picon E, Morillo C, Hernandez JR, Docobo F, Pachon J, Rodriguez-Bano J, Pascual A. 2010. Comparative assessment of inoculum effects on the antimicrobial activity of amoxycillin-clavulanate and piperacillin-tazobactam with extended-spectrum beta-lactamase-producing and extended-spectrum beta-lactamase-nonproducing Escherichia coli isolates. Clin Microbiol Infect 16:132–136. doi: 10.1111/j.1469-0691.2009.02893.x. [DOI] [PubMed] [Google Scholar]
- 16.Bratu S, Mooty M, Nichani S, Landman D, Gullans C, Pettinato B, Karumudi U, Tolaney P, Quale J. 2005. Emergence of KPC-possessing Klebsiella pneumoniae in Brooklyn, New York: epidemiology and recommendations for detection. Antimicrob Agents Chemother 49:3018–3020. doi: 10.1128/AAC.49.7.3018-3020.2005. [DOI] [PMC free article] [PubMed] [Google Scholar]
- 17.Artemova T, Gerardin Y, Dudley C, Vega NM, Gore J. 2015. Isolated cell behavior drives the evolution of antibiotic resistance. Mol Syst Biol 11:822. doi: 10.15252/msb.20145888. [DOI] [PMC free article] [PubMed] [Google Scholar]
- 18.Konig C, Simmen HP, Blaser J. 1998. Bacterial concentrations in pus and infected peritoneal fluid–implications for bactericidal activity of antibiotics. J Antimicrob Chemother 42:227–232. doi: 10.1093/jac/42.2.227. [DOI] [PubMed] [Google Scholar]
- 19.Bingen E, Lambert-Zechovsky N, Mariani-Kurkdjian P, Doit C, Aujard Y, Fournerie F, Mathieu H. 1990. Bacterial counts in cerebrospinal fluid of children with meningitis. Eur J Clin Microbiol Infect Dis 9:278–281. doi: 10.1007/BF01968060. [DOI] [PubMed] [Google Scholar]
- 20.Smith KP, Kirby JE. 2016. Verification of an automated, digital dispensing platform for at-will broth microdilution-based antimicrobial susceptibility testing. J Clin Microbiol 54:2288–2293. doi: 10.1128/JCM.00932-16. [DOI] [PMC free article] [PubMed] [Google Scholar]
- 21.Smith KP, Brennan-Krohn T, Weir S, Kirby JE. 2017. Improved accuracy of cefepime susceptibility testing for extended-spectrum-beta-lactamase-producing Enterobacteriaceae with an on-demand digital dispensing method. J Clin Microbiol 55:470–478. doi: 10.1128/JCM.02128-16. [DOI] [PMC free article] [PubMed] [Google Scholar]
- 22.Chiaraviglio L, Kirby JE. 2015. High-throughput intracellular antimicrobial susceptibility testing of Legionella pneumophila. Antimicrob Agents Chemother 59:7517–7529. doi: 10.1128/AAC.01248-15. [DOI] [PMC free article] [PubMed] [Google Scholar]
- 23.Brennan-Krohn T, Truelson KA, Smith KP, Kirby JE. 2017. Screening for synergistic activity of antimicrobial combinations against carbapenem-resistant Enterobacteriaceae using inkjet printer-based technology. J Antimicrob Chemother 72:2775–2781. doi: 10.1093/jac/dkx241. [DOI] [PMC free article] [PubMed] [Google Scholar]
- 24.Smith KP, Richmond DL, Brennan-Krohn T, Elliott HL, Kirby JE. 2017. Development of MAST: a microscopy-based antimicrobial susceptibility testing platform. SLAS Technol 22:585–608. doi: 10.1177/2472630317727721. [DOI] [PMC free article] [PubMed] [Google Scholar]
- 25.Clinical and Laboratory Standards Institute. 2016. Performance standards for antimicrobial susceptibility testing; 28th informational supplement. CLSI document M100-S28. Clinical and Laboratory Standards Institute, Wayne, PA. [Google Scholar]
- 26.Clinical and Laboratory Standards Institute. 2018. Methods for dilution antimicrobial susceptibility tests for bacteria that grow aerobically; approved standard, 11th ed CLSI document M07-A11. Clinical and Laboratory Standards Institute, Wayne, PA. [Google Scholar]
- 27.Morrill HJ, Pogue JM, Kaye KS, LaPlante KL. 2015. Treatment options for carbapenem-resistant Enterobacteriaceae infections. Open Forum Infect Dis 2:ofv050. doi: 10.1093/ofid/ofv050. [DOI] [PMC free article] [PubMed] [Google Scholar]
- 28.Pea F, Viale P, Cojutti P, Furlanut M. 2012. Dosing nomograms for attaining optimum concentrations of meropenem by continuous infusion in critically ill patients with severe gram-negative infections: a pharmacokinetics/pharmacodynamics-based approach. Antimicrob Agents Chemother 56:6343–6348. doi: 10.1128/AAC.01291-12. [DOI] [PMC free article] [PubMed] [Google Scholar]
- 29.Brennan-Krohn T, Smith KP, Kirby JE. 2017. The poisoned well: enhancing the predictive value of antimicrobial susceptibility testing in the era of multidrug resistance. J Clin Microbiol 55:2304–2308. doi: 10.1128/JCM.00511-17. [DOI] [PMC free article] [PubMed] [Google Scholar]
- 30.Docobo-Perez F, Lopez-Cerero L, Lopez-Rojas R, Egea P, Dominguez-Herrera J, Rodriguez-Bano J, Pascual A, Pachon J. 2013. Inoculum effect on the efficacies of amoxicillin-clavulanate, piperacillin-tazobactam, and imipenem against extended-spectrum beta-lactamase (ESBL)-producing and non-ESBL-producing Escherichia coli in an experimental murine sepsis model. Antimicrob Agents Chemother 57:2109–2113. doi: 10.1128/AAC.02190-12. [DOI] [PMC free article] [PubMed] [Google Scholar]
- 31.Mizunaga S, Kamiyama T, Fukuda Y, Takahata M, Mitsuyama J. 2005. Influence of inoculum size of Staphylococcus aureus and Pseudomonas aeruginosa on in vitro activities and in vivo efficacy of fluoroquinolones and carbapenems. J Antimicrob Chemother 56:91–96. doi: 10.1093/jac/dki163. [DOI] [PubMed] [Google Scholar]
- 32.Chopra T, Marchaim D, Veltman J, Johnson P, Zhao JJ, Tansek R, Hatahet D, Chaudhry K, Pogue JM, Rahbar H, Chen TY, Truong T, Rodriguez V, Ellsworth J, Bernabela L, Bhargava A, Yousuf A, Alangaden G, Kaye KS. 2012. Impact of cefepime therapy on mortality among patients with bloodstream infections caused by extended-spectrum-beta-lactamase-producing Klebsiella pneumoniae and Escherichia coli. Antimicrob Agents Chemother 56:3936–3942. doi: 10.1128/AAC.05419-11. [DOI] [PMC free article] [PubMed] [Google Scholar]
- 33.Rhodes NJ, Liu J, McLaughlin MM, Qi C, Scheetz MH. 2015. Evaluation of clinical outcomes in patients with Gram-negative bloodstream infections according to cefepime MIC. Diagn Microbiol Infect Dis 82:165–171. doi: 10.1016/j.diagmicrobio.2015.03.005. [DOI] [PubMed] [Google Scholar]
- 34.Tamma PD, Han JH, Rock C, Harris AD, Lautenbach E, Hsu AJ, Avdic E, Cosgrove SE, Antibacterial Resistance Leadership Group . 2015. Carbapenem therapy is associated with improved survival compared with piperacillin-tazobactam for patients with extended-spectrum beta-lactamase bacteremia. Clin Infect Dis 60:1319–1325. doi: 10.1093/cid/civ003. [DOI] [PMC free article] [PubMed] [Google Scholar]
- 35.Tamma PD, Rodriguez-Bano J. 2017. The use of noncarbapenem beta-lactams for the treatment of extended-spectrum beta-lactamase infections. Clin Infect Dis 64:972–980. doi: 10.1093/cid/cix034. [DOI] [PMC free article] [PubMed] [Google Scholar]
- 36.Cerqueira GC, Earl AM, Ernst CM, Grad YH, Dekker JP, Feldgarden M, Chapman SB, Reis-Cunha JL, Shea TP, Young S, Zeng Q, Delaney ML, Kim D, Peterson EM, O'Brien TF, Ferraro MJ, Hooper DC, Huang SS, Kirby JE, Onderdonk AB, Birren BW, Hung DT, Cosimi LA, Wortman JR, Murphy CI, Hanage WP. 2017. Multi-institute analysis of carbapenem resistance reveals remarkable diversity, unexplained mechanisms, and limited clonal outbreaks. Proc Natl Acad Sci U S A 114:1135–1140. doi: 10.1073/pnas.1616248114. [DOI] [PMC free article] [PubMed] [Google Scholar]
- 37.Herigstad B, Hamilton M, Heersink J. 2001. How to optimize the drop plate method for enumerating bacteria. J Microbiol Methods 44:121–129. doi: 10.1016/S0167-7012(00)00241-4. [DOI] [PubMed] [Google Scholar]