

Abstract
Background/Objectives
Gut microbiome regulates host energy metabolism and adiposity. A recent study identified a genome-wide significant variant in the lactase (LCT) gene that determines gut microbiome abundance. We investigated whether the LCT variant influenced long-term changes in adiposity among overweight and obese individuals.
Subjects/Methods
We included 583 whites with LCT variant rs4988235 (G allele as Bifidobacterium-abundance-increasing allele) who were randomly assigned to 1 of 4 weight-loss diets varying in macronutrient contents. Two-year changes in adiposity measures were assessed according to the LCT genotype and weight-loss diets.
Results
We observed a significant interaction between the LCT genotype and dietary protein intake on changes in whole body total fat mass %, trunk fat %, superficial adipose tissue mass (SAT), visceral adipose tissue mass (VAT), and total adipose tissue mass (TAT) (Pinteraction <0.05 for all). In response to high-protein diet, carrying the G allele of LCT variant rs4988235 was associated with greater reduction of whole body total fat mass % (β [SE] –0.9 [0.43], p=0.04), trunk fat % (–1.06 [0.58], p=0.07), SAT (–0.89 [0.42], p=0.04), VAT (–0.63 [0.27], p=0.03), and TAT (–1.69 [0.76], p=0.03). Conversely, increasing numbers of the G allele tended to be related to less reduction of these outcomes in response to low-protein diet.
Conclusions
Long-term improvement of body fat composition and distribution was significantly influenced by the Bifidobacterium-related LCT genotype and dietary protein intake. Overweight and obese individuals with the G allele of LCT variant rs4988235 may benefit improving adiposity by eating a low-calorie, high-protein diet.
INTRODUCTION
Gut microbiome plays a pivotal role in regulating caloric extraction from ingested food and host energy metabolism,1–3 which determines body adiposity.3–6 Evidence suggests that gut microbiome abundance is partially determined by host genetic factors.7–9 A recent genome-wide study identified a significant variant in lactase (LCT) gene (C/T-13910, rs4988235) which was associated with gut microbiome Bifidobacterium abundance.9 Bifidobacterium is a genus within Actinobacteria, and several strains of Bifidobacterium are used as probiotics.10–12 LCT gene encodes lactase which is involved in the hydrolysis of common disaccharides lactose into galactose and glucose. It has been shown that the LCT gene is under strong positive selection in response to dietary exposures,13–16 and the LCT variant rs4988235 has also been related to lactase persistence in Europeans.14,17
Epidemiological studies have shown significant associations of the LCT rs4988235 genotype with body mass index (BMI),18–22 waist circumference (WC)21,23,24 and body fat mass.18,24 Previous studies also suggest that gut microbiome Bifidobacterium abundance is closely associated with obesity and visceral adiposity.25,26 In the present study, we used the LCT variant as a surrogate genetic marker for the gut microbiome Bifidobacterium abundance, and we investigated whether the LCT variant might influence long-term changes in adiposity in response to weight-loss dietary intervention. We aimed to examine associations of the LCT rs4988235 genotype and 2-year changes in body fat composition and distribution among overweight and obese individuals in the Preventing Overweight Using Novel Dietary Strategies (POUNDS Lost) trial. We also assessed potential interactions between the LCT genotype and diet interventions in the improvement of adiposity.
METHODS
Study participants
The POUNDS Lost is a randomized diet intervention trial in which 811 overweight and obese individuals were assigned to 1 of 4 energy-reduced diets varying in macronutrient composition of fat, protein, and carbohydrate to compare their effects on body weight change over 2 years. Two diets were low-fat (20%), and the other two diets were high-fat (40%), and two diets were average-protein (15%), and the other two diets were high-protein (25%), which constituted a 2-by-2 factorial design. The study was conducted from October 2004 through December 2007 at two sites: Harvard T.H. Chan School of Public Health and Brigham and Women’s Hospital in Boston, MA, and the Pennington Biomedical Research Center of Louisiana State University System, in Baton Rouge, LA. All participants gave written informed consent. The study was approved by the human subjects committee at each institution and by data and safety monitoring board appointed by the National Heart, Lung, and Blood Institute. More details of this trial such as randomization, blinding, and adherence have been described in detail elsewhere.27 The study was powered to detect a 1.67-kg weight loss as an effect of the level of protein or fat in the diet over the 2-year period, assuming a withdrawal rate of 40%. Investigators and staff who measured outcomes were unaware of the diet assignment of the participants.27 For the assessment of body composition, a random sample of ~50% of the total study participants were selected to undergo dual-energy X-ray absorptiometry (DEXA) scans for fat mass and lean mass at baseline and after 6 months and 2 years of randomization.28 Computed tomography (CT) was performed in 50% of a random sample from those participants who had DEXA scans, resulting in a sample of 25% of the total participants.
In the present study, we included 583 white participants who had data on the LCT variant rs4988235 at the baseline examination. White individuals who remained in the trial and with available data on obesity measurements (body weight, WC, body composition and fat distribution) were included in our analysis. Black participants were not included in the present study since the LCT variant rs4988235 has been demonstrated to be responsible for lactase persistence in Europeans.13–15,17 Because of a limited number of black participants with data on changes in body composition and body fat distribution, our database did not have sufficient power for the analysis among black participants.
Measurements and selection of the LCT single nucleotide polymorphism (SNP)
Height was measured at the baseline examination, and body weight and WC were assessed at baseline, and 6, 12, 18, and 24 months during the intervention. Body weight was measured by calibrated hospital scales, and WC was measured using a non-stretchable tape measure, 4 cm above the iliac crest. BMI was calculated as weight in kilograms divided by the square of height in meters (kg/m2). The DEXA scan was performed using a Hologic QDR 4500A (Hologic Inc) after an overnight fast; total fat mass, total lean mass, whole body total fat mass %, and trunk fat % were measured at baseline, and at 6 months and 24 months during the intervention. CT scan was performed and a series of eight single-slice images were obtained every 10 cm from 2 below and 5 above the fourth and fifth lumbar vertebrae interspaces. These contiguous cross-sectional images were analyzed, and then the total volume was calculated from the individual slices. Total adipose tissue mass, visceral adipose tissue mass, deep subcutaneous adipose tissue mass, and superficial adipose tissue mass within the abdomen were assessed by standard methods at baseline, 6 months and 24 months. Dietary intake was assessed in a random sample of 50% of the total participants by a review of 5-day diet records at baseline and by 24-hour recall during a telephone interview on three nonconsecutive days at 6 months and at 2 years to assess the adherence to the dietary intervention program. We calculated average daily intake of milk (cow’s, fluid, whole or reduced fat) among participants with data on the food records at the baseline examination.
DNA was extracted from the buffy coat fraction of centrifuged blood using the QIAmp Blood Kit (Qiagen, Chatsworth, CA). A total of 799 participants were genotyped for 715,481 SNPs using Illumina Infinium OmniExpress-24 Kit. The genotype success rate was 99%. After quality control (sample call rate ≥95%, SNP call rate ≥95%, p >1.0E-6 for Hardy-Weinberg Equilibrium Test, and minor allele frequency ≥0.01), genotyped dataset had 727 samples. Due to the potential population stratification and the limited sample-size of non-European Hispanics (n=24) and Asians (n=11), a total of 692 participants (583 whites and 109 blacks) had available data. We used Michigan Imputation Server (https://imputationserver.sph.umich.edu/index.html) to impute SNPs on chromosomes 1-22 with 1000G Phase 3 v5 as the reference panel. In the present study, we selected SNP rs4988235 in the LCT locus since the LCT variant rs4988235 has been demonstrated to be responsible for lactase persistence in Europeans.13–15,17 It has been reported that the GG genotype of SNP rs4988235 is associated with adult-type lactose intolerance, and that lactase persistent A allele or genotypes (AA and AG) was associated with elevated BMI, WC and body fat mass in previous studies.18–23 A recent study showed that individuals with the GG genotype of LCT rs4988235 had a higher abundance of gut microbiome Bifidobacterium abundance compared to those with the GA and AA genotypes.9 In a previous study, high levels of bifidobacteria were associated with reduced body weight and visceral adiposity.29
Statistical analysis
General linear models for continuous variables and χ2 test for categorical variables were performed for comparison of characteristics at baseline examination across the genotype. Primary outcomes in the present study were changes in body fat composition and body fat distribution during the 2-year intervention. General linear models (PROC GLM) were used to assess the genotype effect on the outcomes, and multivariate-adjusted models were performed including age, sex, BMI, and value for respective outcome trait at the baseline examination (model 1). Considering our observation that levels of body weight, blood pressure, and triglycerides were different according to the genotype, we also performed a multivariate-adjusted model including age, sex, body weight, diastolic blood pressure, log-transformed triglycerides, and value for respective outcome trait at the baseline examination (model 2). Additive genetic models were used in the analysis. To test potential gene–diet interactions, a genotype-by-diet product term was included in the models. We used linear mixed models (PROC MIXED) with the variance components structure including time × genotype interaction terms to test the genotype effect on trajectory of changes in the outcomes. Statistical analyses were performed with SAS version 9.3 (SAS Institute). All P values were nominal and 2-sided, and a P value <0.05 was considered statistically significant.
RESULTS
There was no significant difference in age, BMI, WC, body fat composition, and body fat distribution according to the LCT rs4988235 genotype at the baseline examination (Table 1). The genotype distribution did not differ by sex or diet groups. At the baseline examination, having a higher number of the G allele was significantly correlated with lower values of body weight, systolic and diastolic blood pressure in unadjusted model, and also with triglycerides after adjusted for age, sex, and the diet groups. Increasing number of the G allele was significantly associated with lower intake of milk among participants with data on food records at the baseline examination (P = 0.01). There was no significant difference in milk intake according to low-/high-protein diet groups (mean [SD], 205 [177] g per day, or 187 [129] g per day, respectively) or low-/high-fat diet groups (mean [SD], 197 [132] g per day, or 194 [175] g per day, respectively).
Table 1.
Characteristics of study participants according to the LCT SNP rs4988235 at the baseline examination
| AA | AG | GG | P† | P‡ | |
|---|---|---|---|---|---|
| (n=204) | (n=259) | (n=120) | |||
| Age, y | 51.6 (8.6) | 52.7 (9) | 51.4 (9.5) | 0.99 | - |
| Male sex | 87 (42.6) | 113 (43.6) | 55 (45.8) | 0.85 | - |
| Diet groups | |||||
| High-protein diet | 108 (52.9) | 122 (47.1) | 57 (47.5) | 0.42 | - |
| Low-fat diet | 97 (47.6) | 125 (48.3) | 66 (55.0) | 0.38 | - |
| Body mass index, kg/m2 | 32.6 (4.1) | 32.7 (3.8) | 32.2 (3.7) | 0.4 | 0.4 |
| Body weight, kg | 94.7 (16.3) | 94.1 (16) | 90.7 (15.1) | 0.04 | 0.005 |
| Waist circumference, cm | 104.4 (13.9) | 104.7 (13) | 103 (13.4) | 0.45 | 0.21 |
| Body fat composition* | |||||
| Whole body total fat mass % | 36.8 (6.7) | 36.8 (6.9) | 36.4 (7.3) | 0.76 | 0.99 |
| Trunk fat % | 37.5 (6) | 38.1 (5.8) | 37.5 (6.6) | 0.89 | 0.66 |
| Body fat distribution** | |||||
| Total Adipose Tissue Mass | 16.8 (4.6) | 16.8 (3.9) | 17.0 (4) | 0.86 | 0.89 |
| Visceral Adipose Tissue Mass | 5.5 (2.5) | 5.7 (2.5) | 5.6 (2.7) | 0.84 | 0.57 |
| Deep subcutaneous adipose tissue mass | 6.0 (1.9) | 5.8 (1.7) | 5.6 (1.6) | 0.41 | 0.3 |
| Superficial adipose tissue mass | 11.3 (2.9) | 11 (2.8) | 11.2 (2.5) | 0.81 | 0.72 |
| Systolic blood pressure, mmHg | 120 (13) | 120 (13) | 116 (13) | 0.04 | 0.02 |
| Diastolic blood pressure, mmHg | 76 (9) | 76 (9) | 72 (10) | <0.001 | <0.001 |
| Triglycerides, mmol/L | 1.55 (1.05, 2.17) | 1.45 (1.06, 2.23) | 1.30 (0.99, 1.87) | 0.06 | 0.04 |
| Dietary intake per day*** | |||||
| Energy, kcal | 2019 (512) | 1983 (579) | 1917 (517) | 0.28 | 0.18 |
| Protein, % | 17.6 (3.1) | 18.4 (3.7) | 18.7 (3.2) | 0.05 | 0.05 |
| Fat, % | 37.3 (5.6) | 37.1 (6.2) | 36.7 (6.3) | 0.51 | 0.65 |
| Carbohydrate, % | 44.5 (7.4) | 44.2 (7.8) | 44 (8.1) | 0.67 | 0.53 |
| Milk intake, g per day*** | 219 (192) | 196 (136) | 152 (115) | 0.01 | 0.01 |
Data mean (SD), median (25th, 75th), or n (%).P†, unadjusted; P‡ adjusted for age, sex and diet group.
Data on body composition were available for 321 individuals; n=109, n=152, and n=60 across the 3 groups (AA, AG, and GG group), respectively.
Data on body fat distribution were available for 136 individuals; n=46, n=63 and 27 across the 3 groups (AA, AG, and GG group), respectively.
Data on dietary intake per day were available for 305 individuals; n=100, n=151 and 54 across the 3 groups (AA, AG, and GG group), respectively.
We did not find any significant main effect of the LCT rs4988235 genotype on 2-year changes in body weight, WC, body fat composition, and body fat distribution (P >0.05 for all the outcomes, data not shown). On the other hand, we found significant interactions between the LCT genotype and dietary protein intake on 2-year changes in whole body total fat mass % (Pinteraction=0.03), trunk fat % (Pinteraction=0.03), superficial adipose tissue mass (Pinteraction=0.005), visceral adipose tissue mass (Pinteraction=0.04), and total adipose tissue mass (Pinteraction=0.005) after adjusted for age, sex, BMI at the baseline examination, and variable of interest at the baseline examination (model 1 in Table 2). We found similarly significant interactions on these outcomes after adjusted for age, sex, body weight, diastolic blood pressure, and log-transformed triglycerides, and variable of interest at baseline in model 2. In response to the high-protein diet, individuals carrying the G allele had a greater reduction of whole body total fat mass % (β [SE] –0.9 [0.43], P=0.04), trunk fat % (–1.06 [0.58], P=0.07), superficial adipose tissue mass (–0.89 [0.42], P=0.04), visceral adipose tissue mass (–0.63 [0.27], P=0.03), and total adipose tissue mass (–1.69 [0.76], P=0.03) (Table 2 and Figure 1). Conversely, in response to the low-protein diet intervention, increasing number of the G allele of LCT rs4988235 tended to be associated with less reduction of these outcomes (Figure 1). There were no significant interactions between the genotype and protein intake on changes in body weight and WC. In addition, when we performed a sensitivity analysis among participants with data on dietary intake, we found similar significant interactions between the LCT genotype and protein intake for the outcomes even after adjusted for milk intake (Supplementary Table 1).
Table 2.
Effect of the LCT variant on 2-year changes in body composition and body fat distribution in response to low/high protein diet
| Low-protein diet
|
High-protein diet
|
Pinteraction | |||
|---|---|---|---|---|---|
| β (SE) | P | β (SE) | P | ||
| Model 1 | |||||
| ΔWhole body total fat mass % | 0.79 (0.62) | 0.21 | –0.77 (0.43) | 0.07 | 0.03 |
| ΔTrunk fat % | 1.23 (0.78) | 0.12 | –0.89 (0.56) | 0.12 | 0.03 |
| ΔDeep subcutaneous adipose tissue mass, DSAT | 0.47 (0.3) | 0.13 | –0.19 (0.22) | 0.4 | 0.08 |
| ΔSuperficial adipose tissue mass, SAT | 1.46 (0.49) | 0.006 | –0.62 (0.38) | 0.11 | 0.005 |
| ΔVisceral adipose tissue mass, VAT | 0.32 (0.36) | 0.38 | –0.58 (0.26) | 0.03 | 0.04 |
| ΔTotal adipose tissue mass, TAT | 1.9 (0.74) | 0.02 | –1.17 (0.68) | 0.09 | 0.005 |
|
| |||||
| Model 2 | |||||
| ΔWhole body total fat mass % | 0.73 (0.63) | 0.25 | –0.9 (0.43) | 0.04 | 0.03 |
| ΔTrunk fat % | 1.17 (0.79) | 0.14 | –1.06 (0.58) | 0.07 | 0.02 |
| ΔDSAT | 0.28 (0.3) | 0.37 | –0.16 (0.23) | 0.49 | 0.13 |
| ΔSAT | 1.05 (0.54) | 0.06 | –0.89 (0.42) | 0.04 | 0.004 |
| ΔVAT | 0.15 (0.35) | 0.68 | –0.63 (0.27) | 0.03 | 0.04 |
| ΔTAT | 1.3 (0.84) | 0.14 | –1.69 (0.76) | 0.03 | 0.005 |
β represents changes in outcomes for the increasing number of the G allele of LCT SNP rs4988235.
Model 1: age, sex, body mass index at the baseline examination, and variable of interest at the baseline examination.
Model 2: age, sex, body weight, diastolic blood pressure, and log-transformed triglycerides, and variable of interest at the baseline examination.
Figure 1.
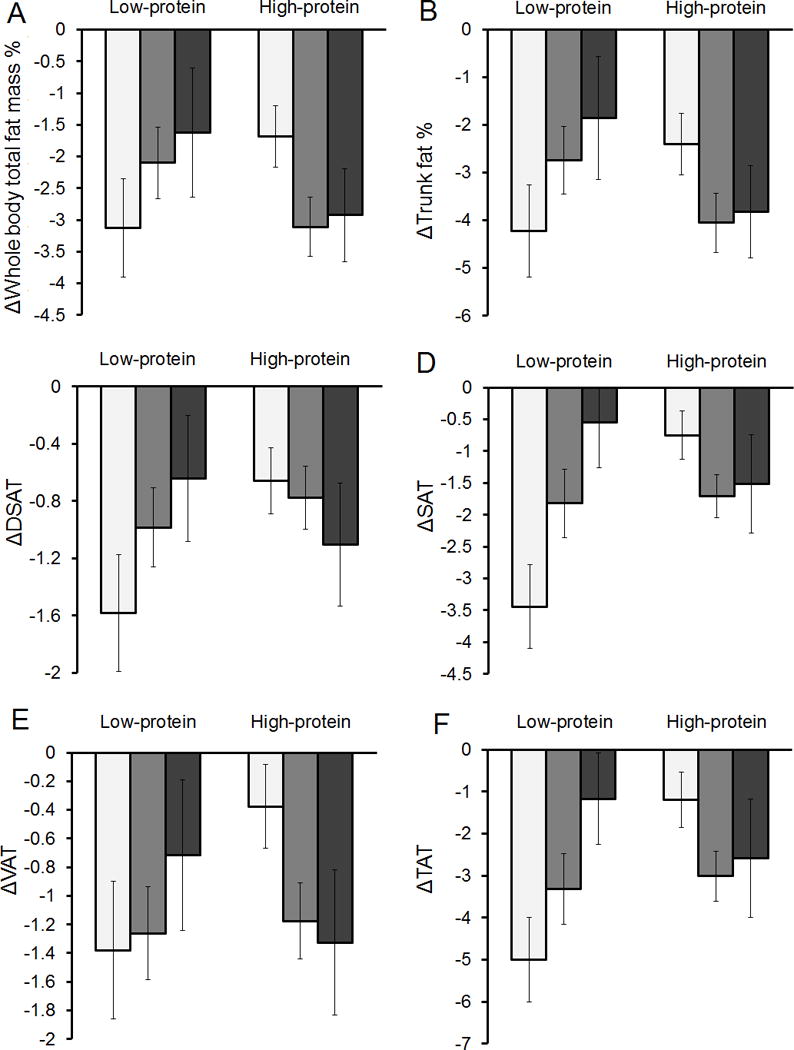
Two-year changes in body composition and body fat distribution according to the LCT rs4988235 genotype and low- or high- protein diet
White bars, AA genotype; gray bars, AG genotype; black bars, GG genotype.
Data are means ± SE values (error bars) after adjustment for age, sex, body mass index and value for the respective outcome traits at the baseline examination.
Abbreviation: DSAT, deep subcutaneous adipose tissue mass; SAT, superficial adipose tissue mass; VAT, visceral adipose tissue mass; TAT, total adipose tissue mass.
Figure 2 shows trajectories of changes in body fat distribution according to the low- or high-protein diet group and the LCT rs4988235 genotype. In results of our analysis using mixed models, we found significant time × genotype interaction on trajectories of changes in superficial adipose tissue mass (Ptime×genotype-interaction=0.008 in low-protein group, panel C; Ptime×genotype-interaction=0.03 in high-protein group, panel D) and total adipose tissue mass (Ptime×genotype-interaction=0.01 in low-protein group, panel G; Ptime×genotype-interaction=0.02 in high-protein group, panel H) showing that the differences of changes in superficial and total adipose tissue mass distribution across the LCT rs4988235 genotype were more evident at 2 years in both diet groups. For example, individuals with the AA genotype in the high-protein diet group showed a larger regain in total adipose tissue mass after 6 months, while those with the AA genotype in the low-protein diet group showed a reduction of total adipose tissue mass over 2 years. There was also significant time × genotype interaction on the trajectory of changes in visceral adipose tissue mass in the high-protein diet group (Ptime×genotype-interaction = 0.01, panel F). For trajectory of visceral adipose tissue mass, individuals with the GG genotype had a larger reduction over 2 years when assigned to the high-protein diet group, whereas there was less reduction when assigned to the low-protein diet group. For trajectory of changes in body fat composition, the genetic effect on changes in whole body total fat mass % (Ptime×genotype-interaction=0.03) and trunk fat % (Ptime×genotype-interaction=0.05) was more evident at 2 years in the high-protein group.
Figure 2.
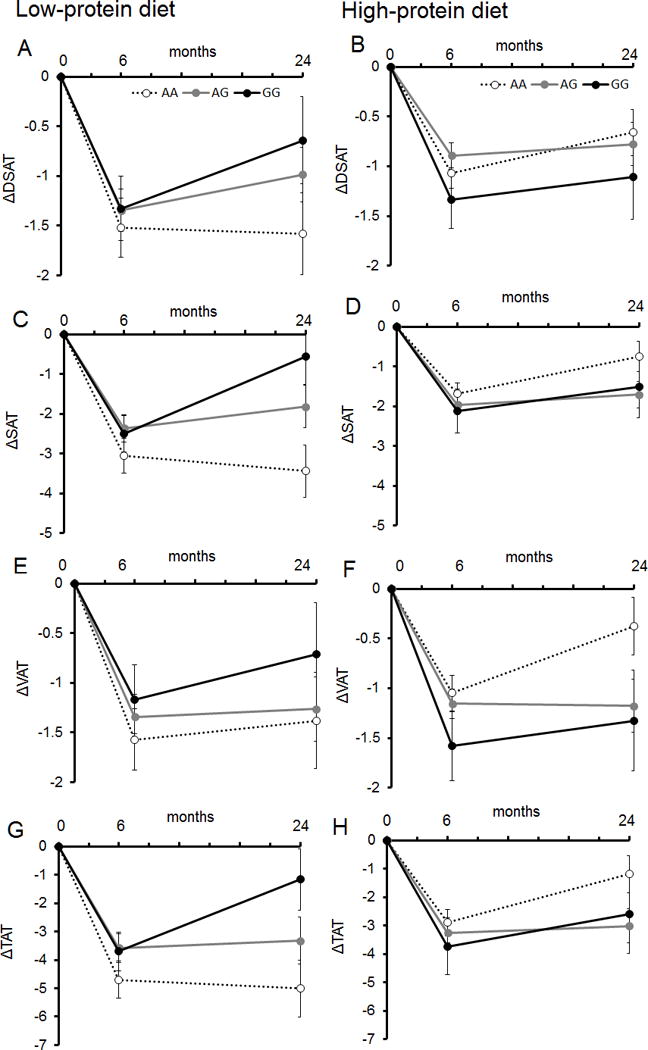
Trajectories of changes in body fat distribution according to LCT rs4988235 genotype in response to low- or high-protein diet over 2 years
Dotted line, AA genotype; gray line, AG genotype; black line, GG genotype.
Data are means ± SE values (error bars) after adjustment for age, sex, body mass index at the baseline examination and value for the respective outcome traits at the baseline examination.
Abbreviation: DSAT, deep subcutaneous adipose tissue mass; SAT, superficial adipose tissue mass; VAT, visceral adipose tissue mass; TAT, total adipose tissue mass.
Ptime×genotype-interaction=0.08 (panel A); Ptime×genotype-interaction=0.39 (panel B); Ptime×genotype-interaction= 0.008 (panel C); Ptime×genotype-interaction= 0.03 (panel D); Ptime×genotype-interaction= 0.32 (panel E); Ptime×genotype-interaction= 0.01 (panel F); Ptime×genotype-interaction= 0.01 (panel G); Ptime×genotype-interaction= 0.02 (panel H).
DISCUSSION
In the POUNDS Lost trial, we found that 2-year changes in body fat composition and fat distribution in response to diet intervention were significantly modified by gut-microbiome related LCT variant among overweight and obese individuals. Participants carrying the G allele of LCT SNP rs4988235 benefited from greater decreases in body fat mass and distribution in response to low-calorie high-protein diet. To the best of our knowledge, this is the first study to show that the gut microbiome related LCT genotype influences the long-term regulation of regional adiposity among overweight and obese individuals with high protein intake during the dietary intervention.
Previous evidence has shown significant associations of the LCT variant with obesity,18–23 and that the LCT variant determines gut microbiome Bifidobacterium abundance,9 which is closely associated with obesity and visceral adiposity.25,26 The association of the LCT variant and Bifidobacteria has also been suggested in an earlier study of a small number of participants.30 Our findings of the significant interactions between the LCT genotype and protein intake on body fat composition and distribution are consistent with previous reports. In a recent GWAS, the LCT genotype was found to be interacted with intake of dairy products, which are rich in protein, on differences in Bifidobacterium abundance.9 The interactions between the LCT genotype and dairy intakes were also observed on obesity.21 We also confirmed that participants with the GG (lactose intolerant) genotype had a lower intake of milk as compared with those with other genotypes at the baseline examination. However, regardless of baseline milk intake, we observed the significant interactions between the LCT genotype and dietary protein on long-term changes in adiposity, suggesting that dietary protein intake may play a major role in modulating the genetic effects of the gut microbiome on the regulation of fatness. Several studies of obese individuals reported that weight-loss with high-protein diets improved gut microbial gene richness,31 colonic health,32 and composition of gut microbiota,33 which also support our observations. Our findings are also in line with biological roles of the gut Bifidobacterium in regulating body adiposity.25,26 Some strains belonging to genera Bifidobacterium are commonly used as probiotics in human nutrition,10–12 and that supplementation of Bifidobacterium ameliorated visceral fat accumulation.34 Our study used a genetic marker as a surrogate for biomarkers and we did not collect data on gut microbiome. We acknowledge that measuring Bifidobacterium abundance would provide additional evidence and strengthen our conclusion. The direct relationship between and Bifidobacterium abundance and the LCT variant remains to be further investigated. Further research would be needed to examine potential interactions between gut-microbiome and protein diet in relation to the improvement of adiposity, as well as to replicate findings of genome-wide analysis whether the LCT variant is associated with the gut microbiome abundance in various populations.
We found that the gene-diet interactions were mainly on changes in total fat %, trunk fat %, superficial, visceral, and total adipose tissue mass, but not on changes in deep subcutaneous fat tissue mass or body weight. There are also supportive evidence on relations between the LCT genotype and body fat mass.18,24 A randomized clinical trial which investigated an effect of probiotic Bifidobacterium animalis ssp. lactis GCL2505 among overweight and obese individual showed that participants who received the probiotic strain had significant decreases in visceral fat area, but not subcutaneous fat area or body weight.35 Taken together, these results suggest that the LCT genotype may particularly affect certain body fat composition such as total fat and trunk fat, and body fat distribution such as total and visceral adipose tissue mass, independent of overall body weight.
In addition, our results using the linear mixed models indicated significant genotype-time interaction for changes in total adipose tissue, superficial, adipose tissue, total fat, and trunk fat in the high-protein diet group, supporting that the genetic effect became stronger in the longer-term intervention on these outcomes. In this trial, most participants regained body weight and waist circumference after 6 months,27 and participants carrying distinct LCT genotypes showed different patterns of regional adiposity changes. Therefore, our results may help to predict maintenance of certain body fatness according to individuals’ genomic makeup.
Our study has several strengths including long-term follow-up with detailed measurements of body composition and body fat distribution at multiple time points. The consistently significant results for different measurements of body composition and fat distribution strengthen our conclusions. Nonetheless, several limitations of this study should also be noted. We did not measure gut-microbiome abundance in this study, which limited our ability to explore potential underlying mechanisms. Further investigations with data on gut-microbiome abundance are warranted. Also, our study participants were only whites since the LCT variant rs4988235 has been demonstrated to be responsible for lactase persistence in Europeans,13–15,17 and our study had a small sample size for black participants to perform analysis among black participants. Whether our findings are generalizable to other ethnicities needs to be further investigated.
In conclusion, our data suggest long-term improvement of body composition and fat distribution was significantly influenced by the gut-microbiome related LCT genotype and dietary protein intake. Overweight and obese individuals with the G allele of the LCT variant rs4988235 may benefit improving adiposity by eating a low-calorie, high-protein diet.
Supplementary Material
Acknowledgments
The authors thank all of the participants in the study for their dedication and contribution to the research.
Funding: The study is supported by NIH grants from the National Heart, Lung, and Blood Institute (HL071981, HL034594, HL126024), the National Institute of Diabetes and Digestive and Kidney Diseases (DK091718, DK100383, DK078616), the Boston Obesity Nutrition Research Center (DK46200), and United States–Israel Binational Science Foundation Grant 2011036. LQ was a recipient of the American Heart Association Scientist Development Award (0730094N). YH was a recipient of a Grant-in-Aid for Scientific Research from the Japan Society for the Promotion of Science (JSPS) and the Overseas Research Fellowship from the JSPS. The sponsors had no role in the design or conduct of the study.
Footnotes
Clinical trial reg. no. NCT00072995, clinicaltrials.gov.
Duality of interest: The authors declare that there is no duality of interest associated with this manuscript.
Author Contributions
YH contributed to the study concept and design, analysis and interpretation of data, drafting and revising the manuscript, statistical analysis, and study supervision. WM, DS, and YZ contributed analysis and interpretation of data, and drafting and revising the manuscript. CC, GB, and FS contributed to acquisition of data, interpretation of data, and drafting and revising the manuscript. LQ contributed to the study concept and design, acquisition of data, analysis and interpretation of data, drafting and revising the manuscript, statistical analysis, and funding and study supervision. All authors were involved in the writing and revising of the manuscript and approved the final version of this article. LQ had full access to all of the data in the study and took responsibility for the integrity of the data and the accuracy of the data analysis.
References
- 1.Turnbaugh PJ, Gordon JI. The core gut microbiome, energy balance and obesity. J Physiol. 2009;587:4153–4158. doi: 10.1113/jphysiol.2009.174136. [DOI] [PMC free article] [PubMed] [Google Scholar]
- 2.Jumpertz R, Le DS, Turnbaugh PJ, Trinidad C, Bogardus C, Gordon JI, et al. Energy-balance studies reveal associations between gut microbes, caloric load, and nutrient absorption in humans. Am J Clin Nutr. 2011;94:58–65. doi: 10.3945/ajcn.110.010132. [DOI] [PMC free article] [PubMed] [Google Scholar]
- 3.Turnbaugh PJ, Ley RE, Mahowald MA, Magrini V, Mardis ER, Gordon JI. An obesity-associated gut microbiome with increased capacity for energy harvest. Nature. 2006;444:1027–1031. doi: 10.1038/nature05414. [DOI] [PubMed] [Google Scholar]
- 4.Turnbaugh PJ, Hamady M, Yatsunenko T, Cantarel BL, Duncan A, Ley RE, et al. A core gut microbiome in obese and lean twins. Nature. 2009;457:480–484. doi: 10.1038/nature07540. [DOI] [PMC free article] [PubMed] [Google Scholar]
- 5.Claesson MJ, Jeffery IB, Conde S, Power SE, O’Connor EM, Cusack S, et al. Gut microbiota composition correlates with diet and health in the elderly. Nature. 2012;488:178–184. doi: 10.1038/nature11319. [DOI] [PubMed] [Google Scholar]
- 6.Le Chatelier E, Nielsen T, Qin J, Prifti E, Hildebrand F, Falony G, et al. Richness of human gut microbiome correlates with metabolic markers. Nature. 2013;500:541–546. doi: 10.1038/nature12506. [DOI] [PubMed] [Google Scholar]
- 7.Wang J, Thingholm LB, Skieceviciene J, Rausch P, Kummen M, Hov JR, et al. Genome-wide association analysis identifies variation in vitamin D receptor and other host factors influencing the gut microbiota. Nat Genet. 2016;48:1396–1406. doi: 10.1038/ng.3695. [DOI] [PMC free article] [PubMed] [Google Scholar]
- 8.Turpin W, Espin-Garcia O, Xu W, Silverberg MS, Kevans D, Smith MI, et al. Association of host genome with intestinal microbial composition in a large healthy cohort. Nat Genet. 2016;48:1413–1417. doi: 10.1038/ng.3693. [DOI] [PubMed] [Google Scholar]
- 9.Bonder MJ, Kurilshikov A, Tigchelaar EF, Mujagic Z, Imhann F, Vila AV, et al. The effect of host genetics on the gut microbiome. Nat Genet. 2016;48:1407–1412. doi: 10.1038/ng.3663. [DOI] [PubMed] [Google Scholar]
- 10.Hur KY, Lee MS. Gut Microbiota and Metabolic Disorders. Diabetes Metab J. 2015;39:198–203. doi: 10.4093/dmj.2015.39.3.198. [DOI] [PMC free article] [PubMed] [Google Scholar]
- 11.Pokusaeva K, Fitzgerald GF, van Sinderen D. Carbohydrate metabolism in Bifidobacteria. Genes Nutr. 2011;6:285–306. doi: 10.1007/s12263-010-0206-6. [DOI] [PMC free article] [PubMed] [Google Scholar]
- 12.Sanchez B, Delgado S, Blanco-Miguez A, Lourenco A, Gueimonde M, Margolles A. Probiotics, gut microbiota, and their influence on host health and disease. Mol Nutr Food Res. 2017;61 doi: 10.1002/mnfr.201600240. [DOI] [PubMed] [Google Scholar]
- 13.Bersaglieri T, Sabeti PC, Patterson N, Vanderploeg T, Schaffner SF, Drake JA, et al. Genetic signatures of strong recent positive selection at the lactase gene. Am J Hum Genet. 2004;74:1111–1120. doi: 10.1086/421051. [DOI] [PMC free article] [PubMed] [Google Scholar]
- 14.Enattah NS, Jensen TG, Nielsen M, Lewinski R, Kuokkanen M, Rasinpera H, et al. Independent introduction of two lactase-persistence alleles into human populations reflects different history of adaptation to milk culture. Am J Hum Genet. 2008;82:57–72. doi: 10.1016/j.ajhg.2007.09.012. [DOI] [PMC free article] [PubMed] [Google Scholar]
- 15.Mathieson I, Lazaridis I, Rohland N, Mallick S, Patterson N, Roodenberg SA, et al. Genome-wide patterns of selection in 230 ancient Eurasians. Nature. 2015;528:499–503. doi: 10.1038/nature16152. [DOI] [PMC free article] [PubMed] [Google Scholar]
- 16.Field Y, Boyle EA, Telis N, Gao Z, Gaulton KJ, Golan D, et al. Detection of human adaptation during the past 2000 years. Science. 2016;354:760–764. doi: 10.1126/science.aag0776. [DOI] [PMC free article] [PubMed] [Google Scholar]
- 17.Enattah NS, Sahi T, Savilahti E, Terwilliger JD, Peltonen L, Jarvela I. Identification of a variant associated with adult-type hypolactasia. Nat Genet. 2002;30:233–237. doi: 10.1038/ng826. [DOI] [PubMed] [Google Scholar]
- 18.Manco L, Dias H, Muc M, Padez C. The lactase -13910C>T polymorphism (rs4988235) is associated with overweight/obesity and obesity-related variables in a population sample of Portuguese young adults. Eur J Clin Nutr. 2017;71:21–24. doi: 10.1038/ejcn.2016.164. [DOI] [PubMed] [Google Scholar]
- 19.Hartwig FP, Horta BL, Smith GD, de Mola CL, Victora CG. Association of lactase persistence genotype with milk consumption, obesity and blood pressure: a Mendelian randomization study in the 1982 Pelotas (Brazil) Birth Cohort, with a systematic review and meta-analysis. Int J Epidemiol. 2016;45:1573–1587. doi: 10.1093/ije/dyw074. [DOI] [PMC free article] [PubMed] [Google Scholar]
- 20.Almon R, Alvarez-Leon EE, Serra-Majem L. Association of the European lactase persistence variant (LCT-13910 C>T polymorphism) with obesity in the Canary Islands. PLoS One. 2012;7:e43978. doi: 10.1371/journal.pone.0043978. [DOI] [PMC free article] [PubMed] [Google Scholar]
- 21.Corella D, Arregui M, Coltell O, Portoles O, Guillem-Saiz P, Carrasco P, et al. Association of the LCT-13910C>T polymorphism with obesity and its modulation by dairy products in a Mediterranean population. Obesity (Silver Spring) 2011;19:1707–1714. doi: 10.1038/oby.2010.320. [DOI] [PMC free article] [PubMed] [Google Scholar]
- 22.Kettunen J, Silander K, Saarela O, Amin N, Muller M, Timpson N, et al. European lactase persistence genotype shows evidence of association with increase in body mass index. Hum Mol Genet. 2010;19:1129–1136. doi: 10.1093/hmg/ddp561. [DOI] [PMC free article] [PubMed] [Google Scholar]
- 23.Albuquerque D, Nobrega C, Manco L. The lactase persistence -13910C>T polymorphism shows indication of association with abdominal obesity among Portuguese children. Acta Paediatr. 2013;102:e153–157. doi: 10.1111/apa.12134. [DOI] [PubMed] [Google Scholar]
- 24.Malek AJ, Klimentidis YC, Kell KP, Fernandez JR. Associations of the lactase persistence allele and lactose intake with body composition among multiethnic children. Genes Nutr. 2013;8:487–494. doi: 10.1007/s12263-013-0335-9. [DOI] [PMC free article] [PubMed] [Google Scholar]
- 25.Cani PD, Neyrinck AM, Fava F, Knauf C, Burcelin RG, Tuohy KM, et al. Selective increases of bifidobacteria in gut microflora improve high-fat-diet-induced diabetes in mice through a mechanism associated with endotoxaemia. Diabetologia. 2007;50:2374–2383. doi: 10.1007/s00125-007-0791-0. [DOI] [PubMed] [Google Scholar]
- 26.Schroeder BO, Backhed F. Signals from the gut microbiota to distant organs in physiology and disease. Nat Med. 2016;22:1079–1089. doi: 10.1038/nm.4185. [DOI] [PubMed] [Google Scholar]
- 27.Sacks FM, Bray GA, Carey VJ, Smith SR, Ryan DH, Anton SD, et al. Comparison of weight-loss diets with different compositions of fat, protein, and carbohydrates. N Engl J Med. 2009;360:859–873. doi: 10.1056/NEJMoa0804748. [DOI] [PMC free article] [PubMed] [Google Scholar]
- 28.de Souza RJ, Bray GA, Carey VJ, Hall KD, LeBoff MS, Loria CM, et al. Effects of 4 weight-loss diets differing in fat, protein, and carbohydrate on fat mass, lean mass, visceral adipose tissue, and hepatic fat: results from the POUNDS LOST trial. Am J Clin Nutr. 2012;95:614–625. doi: 10.3945/ajcn.111.026328. [DOI] [PMC free article] [PubMed] [Google Scholar]
- 29.de Clercq NC, Groen AK, Romijn JA, Nieuwdorp M. Gut Microbiota in Obesity and Undernutrition. Adv Nutr. 2016;7:1080–1089. doi: 10.3945/an.116.012914. [DOI] [PMC free article] [PubMed] [Google Scholar]
- 30.Szilagyi A, Shrier I, Heilpern D, Je J, Park S, Chong G, et al. Differential impact of lactose/lactase phenotype on colonic microflora. Can J Gastroenterol. 2010;24:373–379. doi: 10.1155/2010/649312. [DOI] [PMC free article] [PubMed] [Google Scholar]
- 31.Cotillard A, Kennedy SP, Kong LC, Prifti E, Pons N, Le Chatelier E, et al. Dietary intervention impact on gut microbial gene richness. Nature. 2013;500:585–588. doi: 10.1038/nature12480. [DOI] [PubMed] [Google Scholar]
- 32.Russell WR, Gratz SW, Duncan SH, Holtrop G, Ince J, Scobbie L, et al. High-protein, reduced-carbohydrate weight-loss diets promote metabolite profiles likely to be detrimental to colonic health. Am J Clin Nutr. 2011;93:1062–1072. doi: 10.3945/ajcn.110.002188. [DOI] [PubMed] [Google Scholar]
- 33.Duncan SH, Lobley GE, Holtrop G, Ince J, Johnstone AM, Louis P, et al. Human colonic microbiota associated with diet, obesity and weight loss. Int J Obes (Lond) 2008;32:1720–1724. doi: 10.1038/ijo.2008.155. [DOI] [PubMed] [Google Scholar]
- 34.Chen J, Wang R, Li XF, Wang RL. Bifidobacterium adolescentis supplementation ameliorates visceral fat accumulation and insulin sensitivity in an experimental model of the metabolic syndrome. Br J Nutr. 2012;107:1429–1434. doi: 10.1017/S0007114511004491. [DOI] [PubMed] [Google Scholar]
- 35.Takahashi S, Anzawa D, Takami K, Ishizuka A, Mawatari T, Kamikado K, et al. Effect of Bifidobacterium animalis ssp. lactis GCL2505 on visceral fat accumulation in healthy Japanese adults: a randomized controlled trial. Biosci Microbiota Food Health. 2016;35:163–171. doi: 10.12938/bmfh.2016-002. [DOI] [PMC free article] [PubMed] [Google Scholar]
Associated Data
This section collects any data citations, data availability statements, or supplementary materials included in this article.