

Abstract
Glucose enters the brain extracellular space from arterial blood and its proper delivery is essential for metabolic activity of brain cells. By using enzyme-based biosensors coupled with high-speed amperometry in freely moving rats, we previously showed that glucose levels in the nucleus accumbens (NAc) display high variability, increasing rapidly following exposure to various arousing stimuli. In this study, the same technology was used to assess NAc glucose fluctuations induced by intravenous heroin. Heroin passively injected at a low dose optimal for maintaining self-administration behavior (100 μg/kg) induces a rapid but moderate glucose rise (~150–200 μM or ~15–25% over resting baseline). When the heroin dose was doubled and tripled, the increase became progressively larger in magnitude and longer in duration. Heroin-induced glucose increases also occurred in other brain structures (medial thalamus, lateral striatum, hippocampus), suggesting that brain hyperglycemia is a whole-brain phenomenon but changes were notably distinct in each structure. While local vasodilation appears to be the possible mechanism underlying the rapid rise in extracellular glucose levels, the driving factor for this vasodilation (central vs. peripheral) remains to be clarified. The heroin-induced NAc glucose increases positively correlated with increases in intra-cerebral heat production determined in separate experiments using multi-site temperature recordings (NAc, temporal muscle and skin). However, glucose levels rise very rapidly, preceding much slower increases in brain heat production--a measure of metabolic activation associated with glucose consumption.
Glucose is the main energetic substrate for the metabolic activity of brain cells 1–3 and its proper delivery into the extracellular space is essential for maintaining normal neural functions. Unlike most neurochemicals that are synthetized in brain tissue, glucose enters the brain extracellular space from arterial blood (where its concentration is 5–8-fold higher) via gradient-dependent facilitated diffusion via the GLUT-1 glucose transporter 4. Under physiological conditions, glucose levels in the brain extracellular space could increase due to global rises in blood glucose concentrations 5–7. Such “passive” increases occur after consumption of glucose-containing products 8; these increases are slow and directly dependent on the amount of consumed glucose. Glucose could also rapidly enter the brain due to local neuronal activation that triggers vasodilation and increases local cerebral blood flow 9–11. In the nucleus accumbens (NAc), where neurons are phasically excited by various sensory stimuli 12–14, glucose levels rapidly but transiently increased after auditory stimulation, at the start of social interaction, and during tail-pinch 15.
While the rapid entry of glucose induced by various arousing stimuli provides the energy fueling the metabolic activity of brain cells, psychoactive drugs have multiple receptive substrates in both the brain and periphery and they could directly affect neuronal activity and the tone of blood vessels, resulting in more complex changes of brain glucose. For example, intravenous (iv) cocaine induced a biphasic glucose rise in the NAc, with the first rapid but short phase due to the drug’s action on peripheral neural substrates and the second, more prolonged phase, due to the drug’s central action 16. Another change, a robust and prolonged rise in brain glucose, occurred during general anesthesia (pentobarbital-chloral hydrate); this effect was tightly related to strong decreases in metabolic activity and powerful cerebral vasodilation induced by this treatment 17.
To extend this line of research, in this study we examined how heroin, a potent and widely used drug of abuse, affects brain glucose levels and explored the mechanisms that could mediate this effect. To mimic human conditions, heroin was delivered to resting rats intravenously (iv) at a small dose that is optimal for drug self-administration. Since heroin can be self-injected at higher doses, next we examined whether and how its effects depend on its dose. Although our main recordings were conducted in the NAc, a critical structure of the motivation-reinforcement circuit 18–20, to examine whether the effects of heroin on extracellular glucose are generalized within the brain, similar recording were conducted in several distantly located structures implicated in different neural functions. Finally, to examine the relationships between heroin-induced glucose responses and changes in metabolic activity, electrochemical experiments were supplemented by brain thermorecording conducted in different group of rats using the same treatment protocol. Specifically, by using a three-point thermorecoding procedure (brain, temporal muscle and skin) we were able to assess the effects of heroin on intra-cerebral heat production due to metabolic neural activity and the tone of peripheral blood vessels 21. These data were used to examine the relationships between glucose entry into the brain and global changes in brain metabolism.
RESULTS AND DISCUSSION
Although heroin is usually viewed as a CNS depressant, at low, self-administering doses it increases glucose utilization in limbic structures 22, enhances cerebral blood flow 23, and elevates dopamine levels in the NAc 24— all effects consistent with metabolic brain activation. In contrast, decreased glucose utilization suggesting metabolic inhibition has been found in some brain structures when doses of heroin are increased 22, 25.
When administered during quiet resting conditions, iv heroin (0.1 mg/kg) significantly increased NAc glucose levels (Figure 1). As shown in Figure 1A, oxidation currents detected by glucose sensors robustly increased, while the currents detected by enzyme-free, null sensors showed minimal change. Changes in glucose concentration shown in Figure 1B were calculated by subtraction of null currents from glucose currents. Obtaining the current difference between active and null sensors also allowed us to determine basal levels of glucose in the NAc; these values (852.8±57.2 μM) were consistent with previous microdialysis 10, 26 and electrochemical 15 estimates conducted in freely moving rats. The NAc glucose rise was rapid, peaked at 10–12 min (~160.2±22.3 μM or ~20% over baseline), and slowly disappeared with a slight decrease below the baseline. Stress-free saline injections delivered at equal volumes and speed did not affect NAc glucose concentrations 16.
Figure 1.

Changes in electrochemical currents detected in the NAc by glucose-active and null sensors (A) and resulting relative changes in glucose levels (B) after iv heroin injection at 100 μg/kg dose in freely moving rats. Data were obtained in 5 rats that received three drug injections within one recording session. Filled symbols in B show values significantly different from baseline.
The hyperglycemic effects of heroin were dose-dependent (Figure 2). While at the lowest dose, heroin-induced glucose increase was weakest (192.2±25.2 μM), its magnitude and duration grew substantially when the dose of heroin was doubled and tripled (372.5±85.7 and 471.5±88.9 μM or ~43 and 57% increase over baseline, respectively). With the increase in dose, we also detected a transient glucose decrease immediately after the injection. This effect was almost undetectable at low temporal resolution analysis (Figure 2A), but became clearly evident when the same data were analyzed with high temporal resolution (Figure 2B). This new effect was absent after heroin injection at the lowest dose but was significant and similar in magnitude and duration for the two higher heroin doses. While the causes of this minor effect remain unclear, it could have a pharmacological origin since glucose levels showed no such decrease after saline injections.
Figure 2.

Relative changes in NAc glucose levels induced by iv heroin passively injected at three doses within the self-administering range. A shows data with slow (2-min) time resolution for the entire 2-hr analysis interval and B shows the same data analyzed for the first 12 min post-injection at 20-s time resolution. Filled symbols show values significantly different from baseline.
To assess whether hyperglycemia induced by heroin is a whole-brain phenomenon, we examined glucose responses to heroin in three additional brain structures: dorsal striatum, medio-dorsal thalamus, and hippocampus. In this case, we measured the changes in glucose induced by three consecutive heroin injections at doses of 100, 200 and 300 μg/kg (Figure 3).
Figure 3.

Relative changes in glucose levels in several brain structures induced by iv heroin at different doses. A-C show the results of slow-resolution analysis (2 min) and D-F show the results of rapid-resolution analysis (20 s).
As shown in Figure 3A-C, heroin increased glucose levels in all tested structures and the glucose response increased with higher doses. However, the time-course of the glucose response differed among the brain regions tested. While the glucose increase was similar in the NAc, medial thalamus and striatum, the transient, post-injection decrease in glucose seen with higher heroin doses was strongest in the striatum. Glucose levels also increased in the hippocampus, but this response had the smallest magnitude, which remained similar at all tested heroin doses.
While the rapid glucose increase induced by heroin in the NAc could suggest local vasodilation and increased local CBF, the cause of this vasodilation remains unclear. To clarify this issue, we examined how iv heroin affects NAc, temporal muscle and skin temperatures. As can be seen in Figure 4B, iv heroin significantly increased NAc, temporal muscle and skin temperatures; the increase was different in time-course and amplitude in each recording location. Both brain and muscle temperatures increased rapidly, peaked at ~40 min, and slowly decreased to baseline within the next 80 min. Skin temperature also increased but its rise was weaker and more delayed than that measured in the NAc and temporal muscle. Heroin strongly inhibited locomotor activity (“freezing) for ~20 min post-injection, which recovered slightly above baseline thereafter (Figure 4D).
Figure 4.

Changes in NAc glucose levels (A), NAc, temporal muscle and skin temperatures (B), NAc-Muscle and Skin-Muscle differentials (C), and locomotion (D) induced by iv heroin at 100 μg/kg dose in awake, freely moving rats. Temperature data were obtained in 5 rats that received three drug injections within one recording session. Filled symbols show values significantly different from baseline.
Elevation in brain temperature can result from two basic mechanisms: an increase in intra-cerebral heat production and/or decreased heat loss. Since the temporal muscle and the brain receive a common blood supply from the carotid artery, and thus are equally exposed to blood-delivered heat influences from the body, NAc-Muscle temperature differentials show the source of heat production, providing a measure of drug-induced metabolic brain activation21. In calculating the NAc-Muscle difference, we found a significant but weak increase in this parameter within 12–40 min post-injection, which suggests metabolic activation (Figure 4C). Importantly, this parameter remained unchanged when the rat was fully frozen and glucose levels reached their peaks. More rapid, stronger, and more prolonged changes were seen with the Skin-Muscle temperature differential, which represents the change in skin vascular tone. Skin temperature is determined primarily by the state of peripheral vessels, but it also depends on the temperature of arterial blood inflow. By calculating Skin-Muscle temperature differentials the latter influence could be eliminated, thus revealing the drug’s action on cutaneous vascular tone 21. This parameter decreased within first minutes after heroin injection, reached nadir at ~50 min, and returned to baseline at ~100 min post-injection. We found an exceptionally strong correlation between NAc temperature and Skin-Muscle differential [r=(−)0.963, p<0.0001], suggesting peripheral vasoconstriction as a primary mechanism determining heroin-induced brain temperature rise. Brain temperature also significantly correlates with NAc-Muscle temperature differential, but the strength of correlation is much weaker (r=0.448, p<0.001), suggesting a minor role of intra-cerebral heat production in observed brain temperature increases.
Next, we used correlative and regression analyses to examine the relationships between changes in glucose and temperature parameters. While evident from mean data in Figure 4, changes in NAc glucose were found to be independent of brain, muscle and skin temperatures (r=0.175, 0.058, −0.068, respectively). However, a strong direct correlation was found between changes in NAc glucose and NAc-Muscle differential (r=0.776, p<0.001)—a measure of metabolic brain activation. As shown in Figure 5A, this correlation was absent during the first 16 min post-injection, when glucose levels rapidly increased and reached their peak but the NAc-Muscle differential remained unchanged (filled circles in Figure 5A). However, the correlation became strong and linear at time points greater than 16 min post-injection (r=0.931, p<0.0001; open circles in Figure 5A). Therefore, glucose rapidly enters the brain preceding metabolic activation, thus preventing any possible metabolic deficit.
Figure 5.
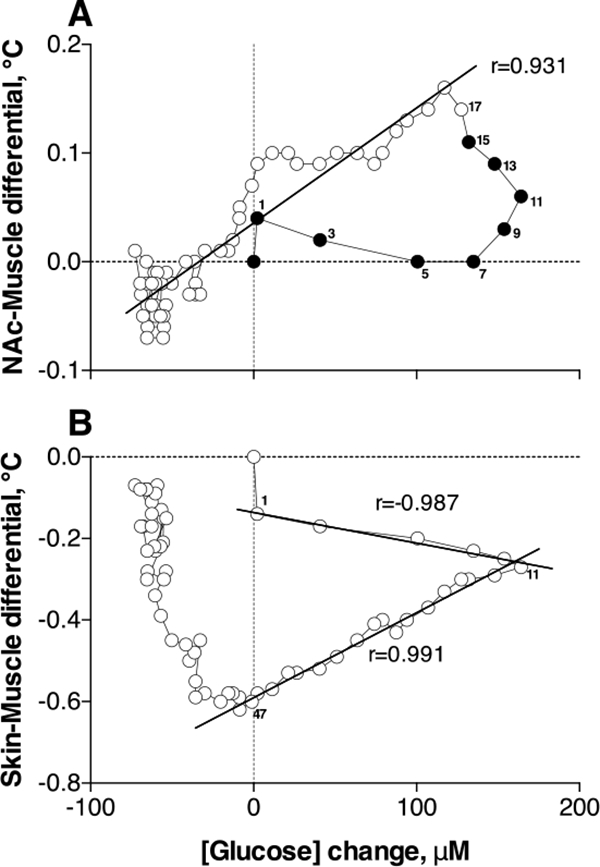
Correlative relationships between heroin-induced changes in NAc glucose and NAc-Muscle (A) and Skin-Muscle (B) temperature differentials. Numbers on both graphs show the time intervals when both parameters were measured. Filled symbols in A show the initial interval, where correlation was absent. For other details see the text.
We also analyzed the relationships between changes in glucose and Skin-Muscle differential (Figure 5B)—two parameters that show very rapid changes after heroin injection. As shown previously, Skin-Muscle differentials rapidly drop after arousing stimuli and iv cocaine injection, reflecting acute skin vasoconstriction as a known centrally-mediated physiological effect following neuronal activation 27, 28. While the correlation between glucose and Skin-Muscle differential calculated for the entire analysis interval was absent [r=(−)0.199], the correlation was exceptionally high [r=(−)0.987] for the initial post-injection time interval (0–12 min) when NAc glucose rapidly increased to its peak and skin vasoconstriction slowly increased. A strong but positive correlation (r=0.991) was also found for the descending curve of the glucose response (12–48 min), which was related to the strengthening of skin vasoconstriction. Based on this finding, we can speculate that heroin-induced skin vasoconstriction results from two contributors: neural activation that is related to the initial rapid effect and a certain slower pharmacological action of the drug that enhances and prolongs vasoconstriction.
A significant but much weaker negative correlation was found between changes in glucose and locomotor activity [r=(−)0.496, p<0.001]. Glucose levels increased and remained elevated while the rats were frozen; return to normal motor activity was associated with restoration of glucose levels to or slightly below baseline.
Conclusions and Questions to be Answered.
The rapid rise in NAc glucose levels induced by iv heroin injection suggests that glucose rapidly enters from arterial blood into the brain extracellular environment. While we believe that this effect results from local vasodilation and increases in local CBF, our current data does not allow us to conclusively determine what drives these effects. Based on our previous data examining physiological fluctuations in NAc glucose 15, 29, we can speculate that iv heroin induces activation of NAc neurons, which triggers peripheral vasoconstriction (accounting for heat accumulation in the brain and body) coupled with central vasodilation (that increases entry of glucose and possibly oxygen to the areas of future metabolic demands). Thus, via rapid, neural activity-regulated vasodilation (neuro-vascular coupling), the brain receives additional glucose inflow before increases in its use during metabolic activation. This mis-match could explain the lack of correlation between rapid increases in glucose and increases in Brain-Muscle differential shown for the first 10 min after heroin injections and appearance of strong positive correlation thereafter. While this logic appears to be adequate to explain our data, direct recordings of neuronal activity could be critical to prove this neuro-vascular hypothesis.
However, glucose levels in the brain could also increase due to increases in glucose levels in arterial blood. Currently, it is unknown whether iv heroin at low self-administering doses affects blood glucose levels and the technologies to directly test this possibility are still in the development stage. Thus, without reliable high-speed monitoring of heroin-induced glucose changes in arterial blood glucose, this “passive” mechanism remains a possibility. However, it seems unlikely due to sharp differences in the time-course and magnitude of brain glucose responses, which are induced by iv heroin and occur after high-dose iv glucose injections 8.
The other important issue not directly addressed by this study is the contribution of central vs. peripheral targets of action and the possible role of peripheral opioid receptors in the direct vascular effects of heroin (i.e., peripheral vasoconstriction) and triggering of ascending neural signals from peripheral neural substrates to the CNS. Opioid receptors are densely expressed both in the brain and periphery, and some effects of heroin could be determined by the action of potent heroin metabolites (morphine and 6-monoacetylmorphine) in sensory fibers densely innervating peripheral blood vessels.
The other important issue partially addressed in this study is to what extent changes in NAc glucose could generalize to other brain structures. Glucose levels assessed in the striatum, thalamus, and hippocampus increased to a different extent after iv heroin in a dose-dependent manner, pointing at a commonality in their vascular response. However, there were also certain differences that warrant further studies to define common and structure-specific components of heroin effects in critical brain areas.
MATERIALS AND METHODS
Animals and Housing.
28 male Long-Evans rats (440 ± 40 g) supplied by Charles River Laboratories (Greensboro, NC) were housed individually in a temperature-, humidity- and light-controlled room (12 h/12 h light/dark cycle, lights on at 07:00) with free access to food and water. Protocols were performed in compliance with the Guide for the Care and Use of Laboratory Animals (NIH, Publication 865–23) and were approved by the NIDA-IRP Animal Care and Use Committee.
Surgical Preparations.
For electrochemical experiments, each rat was surgically prepared as described previously 8, 15, 30. Briefly, under general Pentobarbital-Chloral Hydrate anesthesia, rats were implanted with a BASi cannula (Bioanalytical Systems, Inc.; West Lafayette, IN, USA) for future insertions of a biosensor in the medial sector of the nucleus accumbens (NAc shell). The guide cannula hub was fixed to the skull with a head mount constructed from dental acrylic that was secured using three stainless steel bone screws. During the same surgery, rats were implanted with a chronic jugular catheter, which ran subcutaneously to a head mount, made from dental acrylic and secured to the skull by three stainless steel bone screws. Rats were allowed a minimum of 4 days of post-operative recovery; jugular catheters were flushed daily with 0.2 ml heparinized saline (10 units/ml) to maintain patency. At the onset of each experiment, the injection port of the jugular catheter on the head mount was connected to plastic catheter extensions that allowed stress- and cue-free delivery of tested substances from outside the chamber, thus minimizing possible detection of the injection procedure by the rat.
For thermorecording experiments, rats underwent the three-point thermocouple electrode implantation procedure described in detail elsewhere 31. Under similar general anesthesia, we implanted miniature copper-constantan thermocouple probes (125 μm in diameter) in the NAc shell, deep temporal muscle, and subcutaneously along the nasal ridge with the tip approximately 15 mm anterior to bregma. We secured the probes with dental cement to 3 stainless steel screws threaded into the skull. During the same surgery, rats were implanted with a jugular catheter, similar to the electrochemical experiments. The cages were equipped with 4 infrared motion detectors (Med Associates) to measure locomotor activity. Temperature data were continuously recorded at a 10-s resolution using Thermes-16 (Physitemp Instruments). Rats were habituated for two or three 6-hour sessions before and after surgery and for ~2 hours before the experimental manipulations.
Electrochemical Experiments.
Glucose oxidase-based biosensors (Pinnacle Technology, Inc., Lawrence, KS, USA) coupled with fixed-potential amperometry have been extensively used in our previous studies 8, 15, 16, 29, 32. These reports describe in detail multiple issues regarding the sensitivity/selectivity of these sensors, their in vitro and in vivo performance, and possible physical and chemical contributions that could be evaluated and controlled for providing high reliability and accuracy of electrochemical measurements of extracellular glucose fluctuations.
Briefly, glucose sensors are prepared from Pt-Ir wire of 180 μm diameter, with a sensing cavity of ~ 1 mm length on its tip. The active electrode is incorporated with an integrated Ag/AgCl reference electrode. On the active surface, glucose oxidase converts glucose to glucono-1,5-lactone and hydrogen peroxide, which is detected as an amperometric oxidation current generated by a +0.6 V applied potential 33. The potential contribution of ascorbic acid to the measured current is competitively reduced by co-localizing ascorbic acid oxidase enzymes on the active surface of the sensor. This enzyme converts ascorbic acid to non-electroactive dehydroascorbate and water. In addition, a negatively charged Nafion polymer layer under the enzyme layer serves to exclude endogenous anionic compounds 33.
Glucose sensors were calibrated immediately before and after each in vivo experiment. In vitro calibrations were conducted in PBS (pH 7.3) at room temperature (23°C) by incrementally increasing the concentration of glucose from 0 to 0.5, 1.0, and 1.5 mM followed by a single addition of ascorbate (250 μM). Within the physiological range of glucose levels 34, 35, glucose sensors produced incremental linear current increases, with a mean sensitivity of 4.49±0.33 nA/0.5 mM. Glucose sensors showed negligible sensitivity to ascorbate (<0.1 nA/250 μM). As shown previously 29, glucose sensors remained equally sensitive to glucose and selective against ascorbate during post-recording in vitro calibrations. Since the sensitivity of electrochemical sensors is greatly affected by temperature, our calibration data were adjusted to 37°C based on a temperature coefficient (x1.956) previously determined in analytical in vitro tests. Although our previous data suggest that both physical and chemical contributions to glucose electrochemical currents are minimal, we also conducted the same tests using enzyme-free or null sensors. Data obtained with these sensors were used for more precise determination of basal levels of glucose and its fluctuations in terms of concentration.
At the beginning of each experimental session, rats were minimally anesthetized (<2 min) with isoflurane and a calibrated glucose or null sensor was inserted into the brain through the guide cannula. The sensor was connected to the potentiostat (Model 3104, Pinnacle Technology) via an electrically shielded flexible cable and a multi-channel electrical swivel. Additionally, the injection port of the jugular catheter on the head mount was connected to a plastic catheter extension that allowed stress- and cue-free drug delivery from outside the chamber. In the first electrochemical experiment (7 rats), we tested the effects of three repeated heroin injections (100 μg/kg in 0.4 ml saline over 40 s injection duration; inter-injection interval >2 hrs) on electrochemical currents detected by glucose and null sensors. The difference is these currents was used to determine glucose response in terms of concentration as well as basal levels of glucose in the NAc. In the second experiment (9 rats), we tested the effects of heroin at higher doses (200 and 300 μg/kg in 0.4 and 0.6 ml over 40 and 60 s injection duration). Only two injections were conducted to these rats and inter-injection intervals were 2.5 hrs. The data obtained in the first and second experiments were used to examine dose-response relationships. Finally, in a third experiment (6 rats) we examined glucose responses in four additional structures: medial thalamus, lateral striatum, amydgala and hippocampus. Locations were calculated using the rat stereotaxic atlas 36 and verified by histological examination of sensor implants in the brains. In this experiment, rats were exposed to three repeated injections with increasing heroin doses (100, 200 and 300 μg/kg).
Electrochemical data were sampled at 1 Hz (i.e. mean current over 1 s) using the PAL software (Version 1.5.0, Pinnacle Technology) and analyzed using different time resolutions. Since the baseline currents slightly varied in amplitude between individual glucose electrodes, absolute current changes were transformed into relative changes by adjusting recording values to a basal value before each event to 0 nA. These current changes were then transformed into glucose concentration (μM) based on the sensor sensitivity determined during pre-recording and post-recording in vitro calibrations and adjusted by the temperature coefficient (95.6%) determined in previous analytical tests 32.
Statistical analyses of electrochemical data included the use of one-way repeated measure (RM) ANOVAs to find time periods where there was a significant post-injection main effect. Fisher post-hoc tests were used for pair-wise comparisons, and the latency of the glucose response was determined based on the first data point being significantly different from baseline (p<0.05).
Thermorecording Experiments.
While the brain temperature recorded in the NAc was the primary parameter in these experiments, two other bodily locations were important to determine the physiological mechanisms underlying brain temperature responses. Since the temporal muscle and the brain receive a common blood supply from the carotid artery, and thus are equally exposed to blood-delivered heat influences from the body, NAc-Muscle temperature differentials show the source of heat production and provide a measure of drug-induced metabolic brain activation 21. Skin temperature is determined primarily by the state of peripheral vessels but it also depends on the temperature of arterial blood inflow. Therefore, changes in Skin-Muscle temperature differentials reveal the drug’s action on cutaneous vascular tone, another important determinant of brain temperature changes 21.
Similar to the first electrochemical experiment, rats in this experiment were exposed to three repeated heroin injections at the same dose (100 μg/kg in 0.4 ml over 40 s; inter-injection interval >2 hrs). We analyzed temperature changes three ways: as absolute changes in each recording location, as relative changes, and as NAc-Muscle and Skin-Muscle temperature differentials (a difference between relative temperature changes in the corresponding locations). We analyzed the temperature and locomotor effects, using one-way RM ANOVA; we followed up on significant ANOVA results with Fisher’s PLSD post-hoc tests. We also used correlative and regression analyses to evaluate the relationships between changes in glucose and individual temperature parameters.
Acknowledgments
Funding:
This research was supported by the Intramural Research Program of the NIH, NIDA (Project 1ZIADA000445–13
REFERENCES
- [1].Mergenthaler P, Lindauer U, Dienel GA, and Meisel A (2013) Sugar for the brain: the role of glucose in physiological and pathological brain function, Trends Neurosci 36, 587–597. [DOI] [PMC free article] [PubMed] [Google Scholar]
- [2].Siesjö BK (1978) Brain energy metabolism, Wiley, Chichester; New York. [Google Scholar]
- [3].Sokoloff L (1999) Energetics of functional activation in neural tissues, Neurochem Res 24, 321–329. [DOI] [PubMed] [Google Scholar]
- [4].Duelli R, and Kuschinsky W (2001) Brain glucose transporters: relationship to local energy demand, News Physiol Sci 16, 71–76. [DOI] [PubMed] [Google Scholar]
- [5].Dash MB, Bellesi M, Tononi G, and Cirelli C (2013) Sleep/wake dependent changes in cortical glucose concentrations, J Neurochem 124, 79–89. [DOI] [PMC free article] [PubMed] [Google Scholar]
- [6].de Vries MG, Arseneau LM, Lawson ME, and Beverly JL (2003) Extracellular glucose in rat ventromedial hypothalamus during acute and recurrent hypoglycemia, Diabetes 52, 2767–2773. [DOI] [PubMed] [Google Scholar]
- [7].Dunn-Meynell AA, Sanders NM, Compton D, Becker TC, Eiki J, Zhang BB, and Levin BE (2009) Relationship among brain and blood glucose levels and spontaneous and glucoprivic feeding, J Neurosci 29, 7015–7022. [DOI] [PMC free article] [PubMed] [Google Scholar]
- [8].Wakabayashi KT, and Kiyatkin EA (2015) Behavior-associated and post-consumption glucose entry into the nucleus accumbens extracellular space during glucose free-drinking in trained rats, Front Behav Neurosci 9, 173. [DOI] [PMC free article] [PubMed] [Google Scholar]
- [9].Attwell D, Buchan AM, Charpak S, Lauritzen M, Macvicar BA, and Newman EA (2010) Glial and neuronal control of brain blood flow, Nature 468, 232–243. [DOI] [PMC free article] [PubMed] [Google Scholar]
- [10].Fellows LK, Boutelle MG, and Fillenz M (1992) Extracellular brain glucose levels reflect local neuronal activity: a microdialysis study in awake, freely moving rats, J Neurochem 59, 2141–2147. [DOI] [PubMed] [Google Scholar]
- [11].Silver IA, and Erecinska M (1994) Extracellular glucose concentration in mammalian brain: continuous monitoring of changes during increased neuronal activity and upon limitation in oxygen supply in normo-, hypo-, and hyperglycemic animals, J Neurosci 14, 5068–5076. [DOI] [PMC free article] [PubMed] [Google Scholar]
- [12].Carelli RM, and West MO (1991) Representation of the body by single neurons in the dorsolateral striatum of the awake, unrestrained rat, J Comp Neurol 309, 231–249. [DOI] [PubMed] [Google Scholar]
- [13].Kiyatkin EA, and Rebec GV (1996) Dopaminergic modulation of glutamate-induced excitations of neurons in the neostriatum and nucleus accumbens of awake, unrestrained rats, J Neurophysiol 75, 142–153. [DOI] [PubMed] [Google Scholar]
- [14].Rebec GV (1998) Dopamine, glutamate, and behavioral correlates of striatal neuronal activity, Adv Pharmacol 42, 737–740. [DOI] [PubMed] [Google Scholar]
- [15].Kiyatkin EA, and Lenoir M (2012) Rapid fluctuations in extracellular brain glucose levels induced by natural arousing stimuli and intravenous cocaine: fueling the brain during neural activation, J Neurophysiol 108, 1669–1684. [DOI] [PMC free article] [PubMed] [Google Scholar]
- [16].Wakabayashi KT, and Kiyatkin EA (2015) Central and peripheral contributions to dynamic changes in nucleus accumbens glucose induced by intravenous cocaine, Front Neurosci 9, 42. [DOI] [PMC free article] [PubMed] [Google Scholar]
- [17].Bola RA, and Kiyatkin EA (2016) Robust Brain Hyperglycemia during General Anesthesia: Relationships with Metabolic Brain Inhibition and Vasodilation, Front Physiol 7, 39. [DOI] [PMC free article] [PubMed] [Google Scholar]
- [18].Mogenson GJ, Jones DL, and Yim CY (1980) From motivation to action: functional interface between the limbic system and the motor system, Prog Neurobiol 14, 69–97. [DOI] [PubMed] [Google Scholar]
- [19].Wise RA, and Bozarth MA (1987) A psychomotor stimulant theory of addiction, Psychol Rev 94, 469–492. [PubMed] [Google Scholar]
- [20].Di Chiara G (2002) Nucleus accumbens shell and core dopamine: differential role in behavior and addiction, Behav Brain Res 137, 75–114. [DOI] [PubMed] [Google Scholar]
- [21].Kiyatkin EA (2010) Brain temperature homeostasis: physiological fluctuations and pathological shifts, Front Biosci 15, 73–92. [DOI] [PMC free article] [PubMed] [Google Scholar]
- [22].Martin TJ, Miller M Jr., Dworkin SI, Smith JE, and Porrino LJ (1997) Alteration of local cerebral glucose utilization following intravenous administration of heroin in Fischer 344 rats, Brain Res 755, 313–318. [DOI] [PubMed] [Google Scholar]
- [23].Fuller SA, and Stein EA (1991) Effects of heroin and naloxone on cerebral blood flow in the conscious rat, Pharmacol Biochem Behav 40, 339–344. [DOI] [PubMed] [Google Scholar]
- [24].Hemby SE, Martin TJ, Co C, Dworkin SI, and Smith JE (1995) The effects of intravenous heroin administration on extracellular nucleus accumbens dopamine concentrations as determined by in vivo microdialysis, J Pharmacol Exp Ther 273, 591–598. [PubMed] [Google Scholar]
- [25].Pontieri FE, Calo L, Di Grezia R, Orzi F, and Passarelli F (1997) Functional correlates of heroin sensitization in the rat brain, Eur J Pharmacol 335, 133–137. [DOI] [PubMed] [Google Scholar]
- [26].McNay EC, and Gold PE (1999) Extracellular glucose concentrations in the rat hippocampus measured by zero-net-flux: effects of microdialysis flow rate, strain, and age, J Neurochem 72, 785–790. [DOI] [PubMed] [Google Scholar]
- [27].Altschule MD (1951) Emotion and the circulation, Circulation 3, 444–454. [DOI] [PubMed] [Google Scholar]
- [28].Baker MA, Cronin MJ, and Mountjoy DG (1976) Variability of skin temperature in the waking monkey, Am J Physiol 230, 449–455. [DOI] [PubMed] [Google Scholar]
- [29].Kiyatkin EA, and Wakabayashi KT (2015) Parsing glucose entry into the brain: novel findings obtained with enzyme-based glucose biosensors, ACS Chem Neurosci 6, 108–116. [DOI] [PMC free article] [PubMed] [Google Scholar]
- [30].Wakabayashi KT, and Kiyatkin EA (2014) Critical role of peripheral drug actions in experience-dependent changes in nucleus accumbens glutamate release induced by intravenous cocaine, J Neurochem 128, 672–685. [DOI] [PMC free article] [PubMed] [Google Scholar]
- [31].Kiyatkin EA, Kim AH, Wakabayashi KT, Baumann MH, and Shaham Y (2014) Critical role of peripheral vasoconstriction in fatal brain hyperthermia induced by MDMA (Ecstasy) under conditions that mimic human drug use, J Neurosci 34, 7754–7762. [DOI] [PMC free article] [PubMed] [Google Scholar]
- [32].Kiyatkin EA, Wakabayashi KT, and Lenoir M (2013) Physiological fluctuations in brain temperature as a factor affecting electrochemical evaluations of extracellular glutamate and glucose in behavioral experiments, ACS Chem Neurosci 4, 652–665. [DOI] [PMC free article] [PubMed] [Google Scholar]
- [33].Hu Y, and Wilson GS (1997) Rapid changes in local extracellular rat brain glucose observed with an in vivo glucose sensor, J Neurochem 68, 1745–1752. [DOI] [PubMed] [Google Scholar]
- [34].Fellows LK, and Boutelle MG (1993) Rapid changes in extracellular glucose levels and blood flow in the striatum of the freely moving rat, Brain Res 604, 225–231. [DOI] [PubMed] [Google Scholar]
- [35].McNay EC, McCarty RC, and Gold PE (2001) Fluctuations in brain glucose concentration during behavioral testing: dissociations between brain areas and between brain and blood, Neurobiol Learn Mem 75, 325–337. [DOI] [PubMed] [Google Scholar]
- [36].Paxinos G, and Watson C (1998) The rat brain in stereotaxic coordinates, 4th ed., Academic Press, San Diego. [Google Scholar]