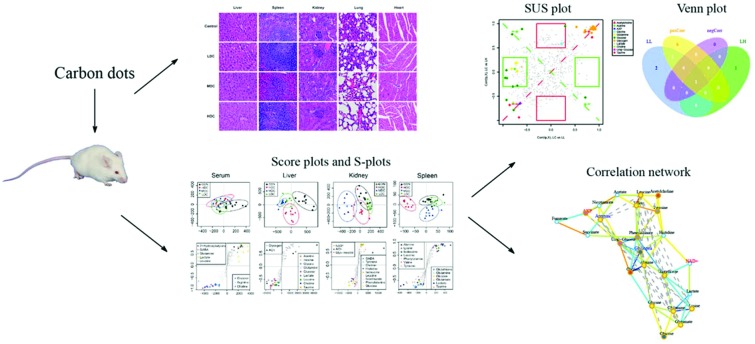
 An NMR-based metabolomics approach combined with histopathology and correlation network analysis was adopted to explore the toxicity of C-dots in vivo.
Abstract
Owing to the promising applications of C-dots in biomedical engineering, concerns about their safety have drawn increasing attention recently. In this study, mice were intraperitoneally injected at different C-dot concentrations (0, 6.0, 12.0 and 24.0 mg kg–1) once every 2 days for 30 days. A 1H NMR-based metabolic approach supplemented with biochemical analysis and histopathology was used for the first time to explore the toxicity of C-dots in vivo. Histopathological inspection revealed that C-dots did not induce any obvious impairment in tissues. Biochemical assays showed no significant alterations of most measured biochemical parameters in tissues and serum, except for a slight reduction of the albumin level in serum as well as AChE activity in the liver and kidneys. Orthogonal signal correction-partial least squares-discriminant analysis (OSC-PLS-DA) of NMR profiles supplemented with correlation network analysis and SUS-plots disclosed that C-dots not only triggered the immune system but also disturbed the function of cell membranes as well as the normal liver clearance, indicating that the 1H NMR based metabolomics approach provided deep insights into the toxicity of C-dots in vivo and gained an advantage over traditional toxicological means, and should be helpful for the understanding of its toxic mechanism.
1. Introduction
Carbon dots (C-dots), a new emerging member of the carbon nanomaterials family, have recently drawn increasing attention in the nanotechnology field owing to their unique properties, such as excellent chemical inertness, excitation wavelength-dependent photoluminescence and optical stability.1,2 With a diameter less than 10 nm and abundant hydrophilic functional groups on their surface,3 C-dots can easily cross cellular membranes4,5 and, therefore, are considerably attractive for bio-imaging and theranostics applications. More importantly, compared with the traditional metal quantum dot material, C-dots containing no heavy metals6 are thought to be more environmentally friendly and should be safer for biological use. Despite this, C-dots should still be scrutinized for their safety before their wide application. In recent years, lots of investigations on the toxicity and biocompatibility of C-dots have been made in vitro, but few in vivo. Most of these studies confirmed that no noticeable signs of toxicity of C-dots were observed on in vitro cells2,7–9 and on in vivo animal models.10,11 Considering the fact that most of these studies used only a few limited indexes, such as pathological inspection and biochemical parameters, a comprehensive and holistic assessment of the biological effects of these C-dots on the body is still an urgent need.
Metabolomics, a crucial component of systems biology,12,13 provides a unique approach to find the integrated function of a complex bio-system by quantitatively measuring the fluctuation of small-molecule metabolites responding to external stimuli (including drug treatments and physiological stimulation). First, as a phenotype tool of functional genomics,14 the usage of metabolomics has been extended to a wide scope of fields such as toxicology,15 drug safety assessment,16 disease diagnosis17,18 and many other fields. Compared with liquid chromatography-mass spectrometry (LC-MS) and gas chromatography-mass spectrometry (GC-MS), nuclear magnetic resonance (NMR) is the most widely used analytical technique in metabolomics for its associated advantages: high speed, non-destructive, unbiased and rich structural information.19
In this study, a 1H NMR-based metabolic approach supplemented with biochemical analysis and histopathological inspection was used for the first time to explore the potential effects of C-dots in vivo. Tissues (liver, kidneys, spleen, lungs and heart) and blood were collected from experimental mice after C-dots treatment (0, 6.0, 12.0 and 24.0 mg kg–1) via intraperitoneal injection every two days for 30 days. A previous pilot study showed that C-dots were not obviously toxic to treated mice even at a dose of 20 mg kg–1 within 90 days 7 without death or a significant body weight drop. Hence, to reveal any potential toxic effects of C-dots on the treated mice, the doses of 6.0, 12.0 and 24.0 mg kg–1 were chosen. Toxicity assessments based on traditional histopathological examination and biochemical assays did not find obvious toxic effects of C-dots on mice, which was consistent with previous studies.20–22 However, multivariate analysis of NMR metabolomic profiles disclosed that C-dots not only disturbed the function of cell membranes but also have an influence on the immune system and normal liver clearance.
2. Materials and methods
2.1. Carbon dots preparation
The C-dots with a diameter of 8 ± 2 nm which exhibit a homogeneously bright blue color under ultraviolet radiation (λ = 365 nm) were adopted in this study, and such a nanomaterial was synthesized and provided by professor Shan and her co-workers (Sino-French Laboratory of Biomaterials and Bioanalytical Chemistry, School of Environmental and Biological Engineering, Nanjing University of Science and Technology). Detailed information about the synthesis process as well as the properties of C-dots can be found in their published manuscript.23
2.2. Animal experiments and sample collection
A total of 40 male ICR mice (30.4 ± 1.5 g) were purchased from the Experimental Animal Center of Yangzhou University (Yangzhou, China) and housed in a climate-controlled room at a temperature of 25 ± 3 °C and a relative humidity of 50 ± 10%, with a 12 h light/12 h dark cycle. Food and tap water were provided ad libitum. After acclimatization for one week, the mice were randomly divided into four groups (10 animals per group) and intraperitoneally injected with 0 (control group, CON), 6.0 (low dose of C-dots group, LDC), 12.0 (medium dose of C-dots group, MDC) and 24.0 (high dose of C-dots group, HDC) mg per kg body weight C-dots once every 2 days for 30 days. C-dots were dissolved in 0.9% sodium chloride injection solution. The body weights of mice were recorded daily. The mice used in this study were treated according to the Chinese Council on Animal Care guidelines, and experimental protocols were authorized by the Institutional Animal Care and Use Committee at Nanjing University of Science and Technology.
24 hours after the last administration, all mice were sacrificed and tissues (livers, kidneys, lungs, hearts and spleens) and serum were collected. From each group, the mice were randomly selected and allocated for histopathological examination, 1H NMR test and biochemical assays. Serum samples were obtained by centrifugation (3000 rpm, 10 min, 4 °C) and stored at –80 °C before biochemical testing.
2.3. Histology
For histological examination, the tissues (livers, kidneys, lungs, hearts and spleens) were quickly removed, rinsed with cold phosphate buffered saline (PBS), and then immediately fixed in 10% neutral-buffered formaldehyde for 24 h. After fixation, tissues were embedded in paraffin and sliced serially into 5 μm of sections, which were then stained with hematoxylin and eosin (H&E) for microscopic observation.
2.4. Biochemical parameters
Tissue levels of total protein, catalase (CAT), lactic dehydrogenase (LDH), and acetyl cholinesterase (AChE) and serum levels of blood urea nitrogen (BUN), creatinine (CRE), aspartate aminotransferase (AST), alanine aminotransferase (ALT) and superoxide dismutase (SOD) were measured using commercially available kits (purchased from Nanjing Jianchen Biotech Inc., Nanjing, China) according to the manufacturer's instructions.
2.5. NMR sample preparation
Intact frozen tissue samples were weighed, homogenized immediately in ice-cold solvent (50% acetonitrile/50% H2O, v/v, 5 ml g–1 tissue), vortexed and then centrifuged at 12 000g for 10 min at 4 °C. The supernatant was collected, frozen at –80 °C overnight, and then lyophilized to dryness and stored at –80 °C until the NMR test. The NMR samples were prepared by dissolving dried extracts in 600 μl 99.8% D2O phosphate buffer saline (PBS), pH 7.0, with 99.8% D20 and 0.05% (w/v) sodium 3-(trimethylsilyl)propionate-2,2,3,3-d4 (TSP) for referencing purposes. After vortexing and centrifugation at 12 000g for 10 min, the transparent supernatant solution was pipetted into a 5 mm NMR tube for NMR analysis.
Serum samples were thawed and 300 mL of each was mixed with equal volumes of phosphate buffer (0.2 mol L–1 Na2HPO4 and 0.2 mol L–1 NaH2PO4, pH 7.4) to minimize the chemical shift variation due to the pH discrepancy in the samples. The samples were vortexed, and allowed to stand for 20 min prior to centrifugation at 12 000 rpm for 10 min at 4 °C to remove any precipitates. The supernatant was then pipetted into a 5 mm NMR tube with the addition of 80 μL of D2O containing 0.05% TSP.
1H NMR spectra were recorded on a Bruker-AVANCEIII 500 MHz spectrometer with a 5 mm BBFO Plus broadband probe at 298 K. The Call–Purcell–Meiboom–Gill (CPMG) sequence (90[τ–180–τ]n-acquisition) with a total spin-echo delay (2nτ) of 10 ms was used to suppress the signals of proteins. The 1H 90° pulse length was adjusted to 4.2–5.7 μs, and 128 scans were collected using 32 K data points over a spectral width of 10 000 Hz for all 1H NMR spectra. A line broadening of 0.5 Hz was applied to all spectra prior to Fourier transformation.
2.6. Data pre-processing and analysis
1H NMR spectra were manually phased and baseline corrected using Bruker Topspin 3.0 software (Bruker GmbH, Karlsruhe, Germany) and referenced to TSP at 0.0 ppm. They were subsequently converted to ASCII format files using MestReNova (Version 8.0.1, Mestrelab Research SL). The ASCII format files were then imported into “R” (; http://cran.r-project.org/) for multivariate data analysis with an in-house developed R-script. The 1H NMR spectra were adaptively segmented into integrated spectral regions (buckets) with an average bin width of 0.015 ppm between 0.2 and 10 ppm for subsequent statistical analysis. The chemical shift region of 4.5–5.45 ppm containing residual water was excluded firstly. All remaining regions of each spectrum were then normalized using probability quotient normalization (PQN)24 to account for sample dilution effects, thus facilitating the comparability of samples. Data were subsequently mean-centered and Pareto-scaled to provide a reasonable balance of contributions from high and low amplitude signals.
The processed NMR data were analyzed by a supervised orthogonal signal correction partial least-squares discriminant analysis (OSC-PLSDA).25 OSC-PLSDA is a supervised pattern recognition technique that could filter out effects unrelated to an interested response to the metabolic differences between the classes. To assess the quality of the established OSC-PLSDA model, repeated 2-fold cross-validation was carried out. The validity of the models against over fitting was assessed by the parameters R2Y, and the predictive ability was described by Q2Y. High Q2Y values indicated that the differences between the groups were significant. A permutation test (2000 times) was also performed to further validate the supervised model.26 A color-coded loadings plot and S-plot were constructed to reveal variables that contributed to the group separation. The fold-change values of metabolites and their associated P-values corrected by the Benjamini & Hochberg-adjustment method27 were calculated and visualized in colored tables.
2.7. Correlation network
Pearson correlations among metabolites were calculated by R software and the igraph library package was used for generating correlation networks. Metabolites with coefficients of Pearson correlations above a threshold were connected by solid lines color coded according to the values of the coefficients (a warm color represented a positive correlation and a cool color a negative one), with the line width scaled based on their absolute values. Dotted lines between metabolites represented their structural similarities. These improved correlation networks could present both the Pearson correlation coefficients among the levels of metabolites and their structural similarity. The common Pearson correlation networks only visualized the correlations of metabolites in a different status. However, such correlations were not causation relationships. The addition of the structural similarity information enriched the networks since the substrates and products in nearly all the biochemical reactions should be similar. In this context, the high correlation between metabolites with great structural resemblance might reflect a theoretically possible biochemical reaction between them and thus a causative effect.
2.8. SUS plots
To compare the dosage influence of C-dots on the metabolome of injected mice, SUS (shared-and-unique structure)-plots for the models comparing the CON group with C-dot injected groups were generated. The correlations from the predictive component, Corr(tp,X), of each model were plotted against each other. Colored metabolites were those located around the diagonal lines or four framed squares with VIP greater than 1 in at least one model. Metabolites that appear close to the diagonal were shared between classes and metabolites outside the diagonal (especially in the colored frame) were unique for the specified class. The Venn plot helped to visualize metabolites with positive and negative correlations between classes as well as those belonging uniquely to the specified class.
3. Results
3.1. Animal characteristics
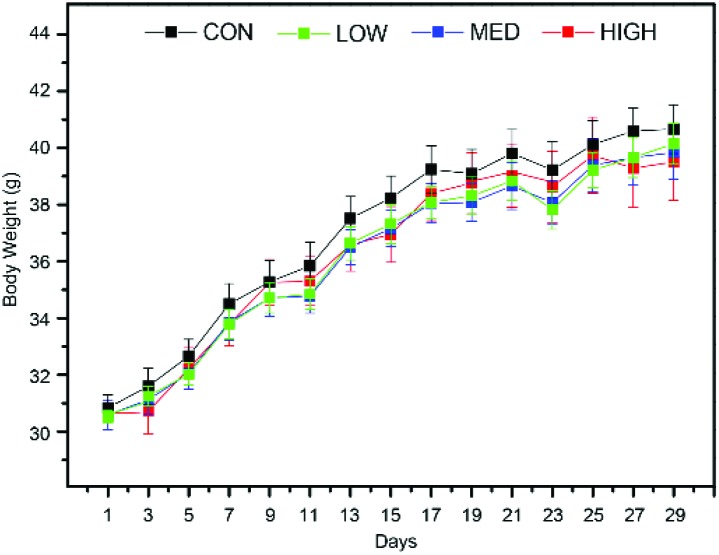
Throughout the whole experiment, no abnormal feeding behavior changes were found for mice in the C-dot treated groups. Body weights of mice were recorded daily and the result is shown in Fig. 1, which showed that the C-dot injection retarded the weight gain in a dose-dependent manner.
Fig. 1. Body weight of mice in the C-dot injected groups and control groups across the whole experiments. Values are expressed as mean ± SEM (n = 10). Factors days (P < 0.001) and group (P < 0.05) were found to be significant for the body weights of mice using two-way ANOVA.
3.2. Biochemical parameters
The biochemical parameters of serum and target tissues (the liver, kidneys, and spleen) were assessed to quantify the potential effects of C-dots. Serum biochemical parameters including AST, ALT, BUN, CRE, SOD and ALB are shown in Fig. 2a–f. The activities of serum AST and ALT (Fig. 2a and d) (markers of liver injury) as well as the levels of CRE and BUN (Fig. 2b and e) (markers of kidney injury) did not show obvious alterations after C-dot injection, nor did the activity of SOD (Fig. 2c) (oxidative stress index). The serum ALB level (Fig. 2f) exhibited a slight increase after treatment with C-dots.
Fig. 2. Box plots for the biochemical parameters of mice serum (a–f) and tissues (g–o) after C-dots injection. Serum AST (a), CRE (b), SOD (c), ALT (d), BUN (e) and albumin (f). Liver total protein (g), CAT (h), LDH (i) and AChE (l); kidney total protein (j) and AChE (k); spleen total protein (m), CAT (n) and LDH (o). The bottom of each box, the line drawn in the box and the top of the box represent the 1st, 2nd and 3rd quartiles, respectively. The whiskers extend to ±1.5 times the interquartile range (from the 1st to 3rd quartile). Outliers are shown as open circles. All values are mean ± SD (n = 10). The parameters after logarithmic transformation were subjected to Tukey's multiple comparisons tests corrected by Bonferroni's method: *P < 0.05, **P < 0.01 and ***P < 0.001 as compared with the control group.
The biochemical parameters of tissues are shown in Fig. 2g–o. The total protein levels of livers, kidneys and spleens (Fig. 2g, j and m) and the activity of the CAT in livers and spleens (Fig. 2h and n) did not show significant changes after the C-dot injection. The activities of LDH did not show obvious changes between groups in the liver (Fig. 2i), but was significantly decreased in the spleen of mice injected with a high dose of C-dots (Fig. 2o). Significant decreases of the activities of AChE were observed in both livers (Fig. 2k) and kidneys (Fig. 2l) after the C-dot injection.
3.3. Histopathology
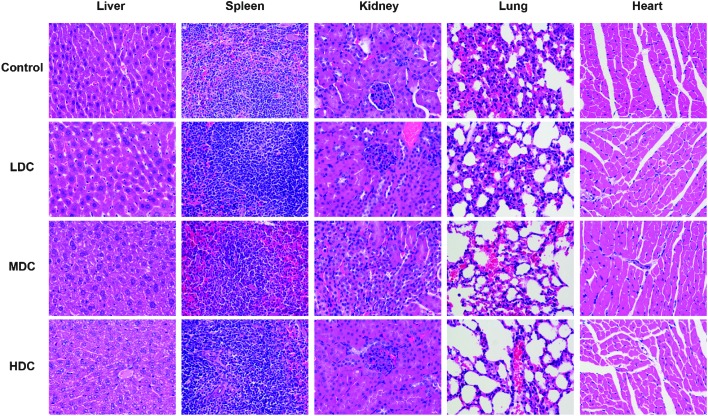
The histological assessment of tissues (liver, spleen, kidneys, lungs, and heart) was conducted to investigate the effect of C-dots on mice tissues by a pathologist independent to the experiments. Overall, there were no apparent histopathological tissue damage, abnormalities, inflammation, or lesions of mice after injection of the C-dots. The representative histology results are shown in Fig. 3.
Fig. 3. Haematoxylin and eosin (H&E) staining photomicrographs of mice liver, spleen, kidney, lung and heart (A and E, ×200) tissues from the control group and C-dots treated groups. No noticeable abnormality or lesion was observed.
3.4. Metabolite assignments with NMR spectra
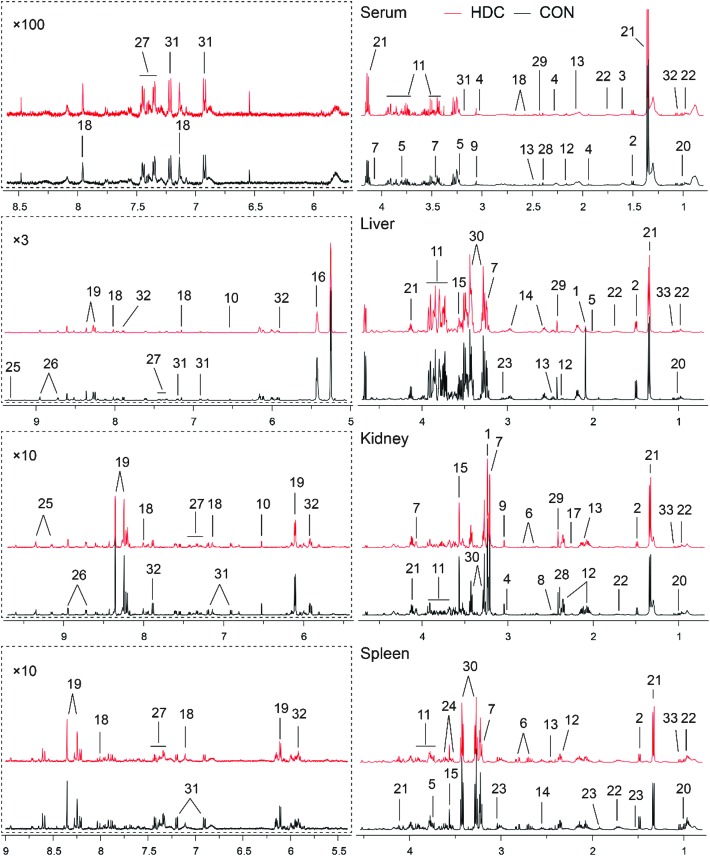
The representative 500 MHz 1H NMR spectra of serum and tissues obtained from the control and C-dot treated groups are shown in Fig. 4. The NMR resonances were assigned according to the chemical shifts reported in the literature and by querying with publicly accessible metabolomics databases such as the Human Metabolome Database and the Madison-Qingdao Metabolomics Consortium Database. The primary peaks in the spectra were assigned to individual metabolites (Tables 1–3). Finally, the identification of metabolites was further confirmed with a series of 2D NMR experiments as listed in ESI Fig. S1–4.†
Fig. 4. Representative 500 MHz CPMG 1H NMR spectra of mice serum, and liver, kidney and spleen aqueous extracts. Keys: 1, acetylcholine; 2, alanine; 3, 2-hydroxybutyrate; 4, 4-aminobutyrate; 5, arginine; 6, aspartate; 7, choline; 8, citrate; 9, creatine; 10, fumarate; 11, glucose; 12, glutamate; 13, glutamine; 14, glutathione; 15, glycine; 16, glycogen; 17, glycylproline; 18, histidine; 19, inosine; 20, isoleucine; 21, lactate; 22, leucine; 23, lysine; 24, myo-inositol; 25, NAD+; 26, nicotinurate; 27, phenylalanine; 28, pyruvate; 29, succinate; 30, taurine; 31, tyrosine; 32, uridine; 33, valine.
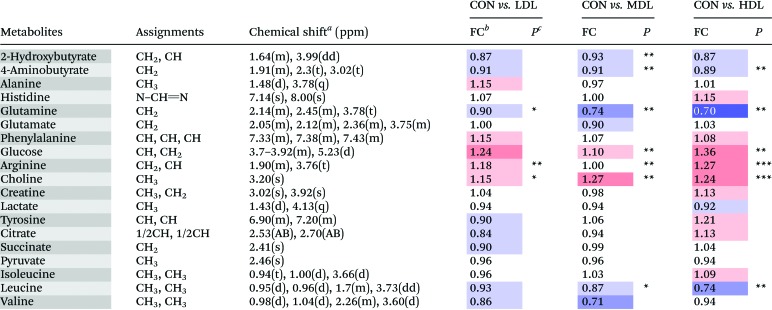
Table 1. Metabolites identified from the serum samples, and their fold change values versus the control group.
|
aMultiplicity: s, singlet; d, double; t, triplet; q, quartets; m, multiplet.
bFC, fold change = C-dots injected samples/control samples; color coded according to the log2(FC) using color bar  , red denotes the increase and blue the decrease in C-dot injected groups.
c P values corrected by the BH (Benjamini–Hochberg) methods were calculated based on a parametric Student's t-test or a nonparametric Mann–Whitney test. *P < 0.05, **P < 0.01, ***P < 0.001.
Table 2. Metabolites identified from the aqueous liver extracts, and their fold change values versus the control group.
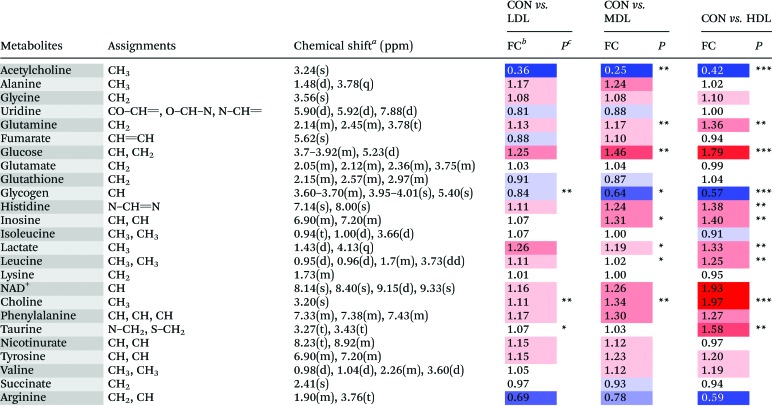
|
aMultiplicity: s, singlet; d, double; t, triplet; q, quartets; m, multiplet.
bFC, fold change = C-dot injected samples/control samples; color coded according to the log2(FC) using color bar  , red denotes the increase and blue the decrease in C-dots injected groups.
c P values corrected by the BH (Benjamini–Hochberg) methods were calculated based on a parametric Student's t-test or a nonparametric Mann–Whitney test. *P < 0.05, **P < 0.01, ***P < 0.001.
Table 3. Metabolites identified from the aqueous kidney extracts, and their fold change values versus control group.
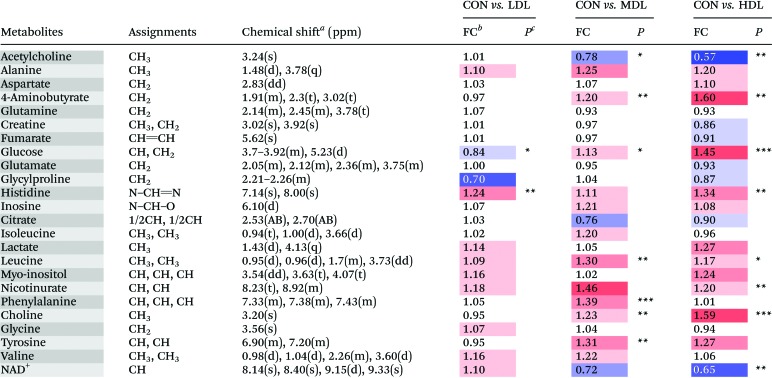
|
aMultiplicity: s, singlet; d, double; t, triplet; q, quartets; m, multiplet.
bFC, fold change = C-dots injected samples/control samples; color coded according to the log2(FC) using color bar  , red denotes the increase and blue the decrease in the C-dots injected groups.
c P values corrected by the BH (Benjamini–Hochberg) methods were calculated based on a parametric Student's t-test or a nonparametric Mann–Whitney test. *P < 0.05, **P < 0.01, ***P < 0.001.
3.5. C-dot-induced metabonomic changes
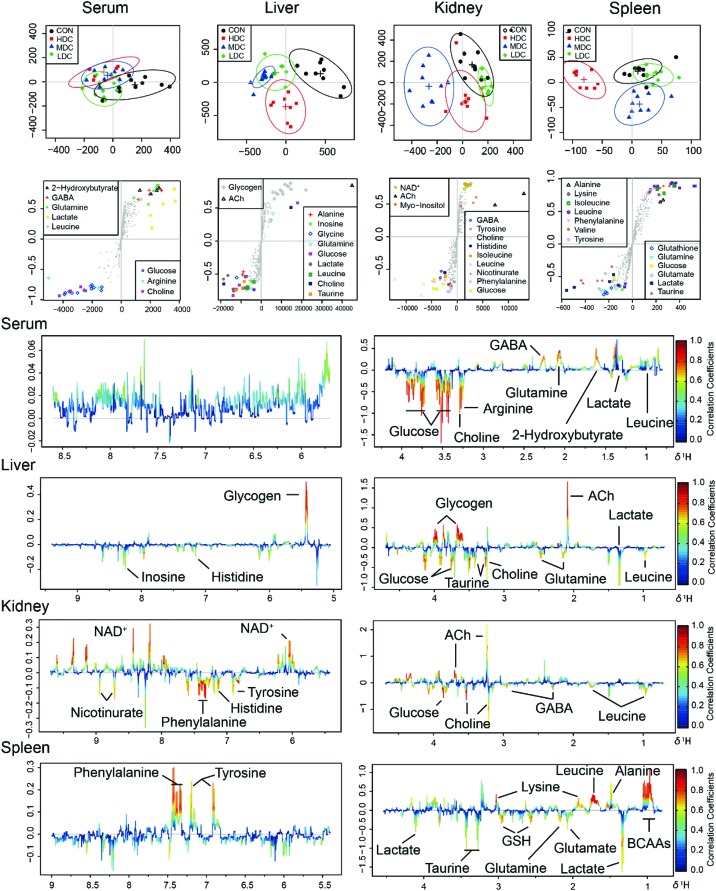
In the OSC-PLS-DA scores plot of serum samples, the CON group was overlapped with the LDC and MDC groups and separated from the HDC group (Fig. 5). Compared with the control mice, decreased levels of GABA, 2-hydroxybutyrate, glutamine and leucine, and increased levels of arginine, choline and glucose were found in the C-dot treated mice.
Fig. 5. OSC-PLS-DA analysis of the NMR data from serum and tissue extracts of the control and C-dot treated groups. (A) Scores plot with two components explained 38%, 55%, 42% and 37% of total variances in the serum, liver, kidney and spleen samples, respectively. (B) S-Plot with colored symbols denoting differential metabolites among groups. (C) Loadings plot color-coded according to the absolute values of the coefficients of the model.
In the OSC-PLS-DA scores plot of the livers, the C-dot treated groups were clearly separated from the control groups. The fold change values of the detected metabolites and their associated P-values are summarized in Table 2. In the liver of mice, C-dots treatment significantly elevated the levels of choline, glucose, glutamine, histidine, inosine, lactate and leucine and significantly decreased the levels of glycogen and acetylcholine.
In the OSC-PLS-DA scores plot of kidney tissues, a clear separation was observed among the C-dots treated groups, with partial overlapping between the low dosed group and control group. C-dots treatment significantly elevated the levels of GABA, choline, glucose, histidine, leucine, myo-inositol, nicotinurate, phenylalanine and tyrosine but significantly decreased the levels of acetylcholine and NAD+. The fold change values of the detected metabolites and their associated P-values are summarized in Table 3.
In the OSC-PLS-DA scores plot of spleens, the HDC group was clearly separated from the CON groups with the MDC group and the LDC group overlapping with the CON group. C-dot treatment significantly decreased the levels of leucine, lysine, isoleucine, phenylalanine, valine, alanine and tyrosine, and significantly elevated the levels of glucose, lactate, glutamate, glutamine, glutathione and taurine. The fold change values of the detected metabolites as well as their associated P-values are summarized in Table 4.
Table 4. Metabolites identified from the aqueous spleen extracts, and their fold change values versus the control group.
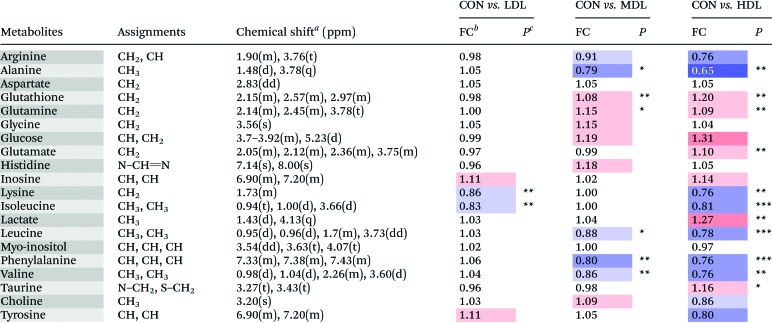
|
aMultiplicity: s, singlet; d, double; t, triplet; q, quartets; m, multiplet.
bFC, fold change = C-dots injected samples/control samples; color coded according to the log2(FC) using color bar  , red denotes the increase and blue the decrease in C-dots injected groups.
c P values corrected by the BH (Benjamini–Hochberg) methods were calculated based on a parametric Student's t-test or a nonparametric Mann–Whitney test. *P < 0.05, **P < 0.01, ***P < 0.001.
4. Discussion
In this study, the potential effects of C-dots in vivo were explored using a 1H NMR based metabolomics approach combined with histopathological examination and biochemical assay. Toxicity assessments based on traditional histopathological examination and biochemical assays did not find obvious toxic effects of C-dots on mice; however, the multivariate analysis of NMR metabolomic profiles disclosed that C-dots not only disturbed the function of cell membranes but also have an influence on the immune system and normal liver clearance.
4.1. Metabolomics analysis
Significantly increased levels of choline were detected in the liver and kidneys of mice treated with C-dots. Obtained from food or synthesized in vivo, choline is important for the structural integrity of cell membranes, playing a crucial role in signaling and acetylcholine (ACh) synthesis.28 Generally, the increase of choline in vivo is either associated with the stimulation of AChE, one enzyme which breaks ACh into choline and acetyl-CoA,29 or the breakdown of the cell membrane which leads to the accumulation of choline and glycerol.30 While according to the result of the biochemical assay above, the activity of AChE was not up-regulated but exhibited a slight decrease in both liver and kidney tissues of the C-dot treated mice, which precluded the first possibility. Cell membranes of the liver and kidneys in mice injected with C-dots did not show obvious damage or breakdown according to the histopathological inspection, which also excluded the second possibility. There should be other mechanisms concerning the accumulation of choline in the liver and kidneys of the C-dot treated mice.
We noticed that one product of choline and acetyl-CoA, namely Ach, exhibited a significant decrease both in the liver and kidneys of the C-dot treated mice. In the cytoplasm, choline could be conjugated with acetyl-CoA to synthesize Ach, which could be packed into vesicles and subsequently extruded to the surrounding medium via exocytosis, after which the extracellular Ach will be broken down into choline and acetyl-CoA immediately catalyzed by AChE. The generated choline will be transferred back into the cytoplasm via the choline transporter to resynthesize ACh.31,32 Therefore, in consideration of the significantly decreased levels of Ach in the liver and kidneys as well as the decreased activity of AChE, we think it is reasonable to believe that the accumulation of choline in the liver and kidneys could be attributed to the disturbed function of the choline transporter under C-dots stress. When the ability of the choline transporter was influenced, choline could not be transferred back into the cytoplasm effectively, and the reaction from choline to Ach was also inhibited, thus resulting in a decrease of Ach and the accumulation of choline, which would subsequently inhibit the activity of AChE. This conclusion was in accordance with previous studies: C-dots could label the cell membrane,33,34 and even damage the membranes of cells to death.35
The level of glucose was significantly increased in the serum of C-dot injected mice. As a key source of energy, blood glucose could be transported into cells as energy materials. Unconsumed glucose could be converted to glycogen in hepatocytes by a series of enzymes under the regularization of insulin.36 The effect of insulin mainly focuses on the influx of glucose and glycogen synthesis.37 Normally, when the blood glucose level is promoted and exceeds a certain level, insulin will be stimulated and released to allow blood glucose to enter the cell by binding to insulin receptors and controlling special transporter proteins in the cell membrane, thus inhibiting glycogen breakdown in hepatocytes simultaneously. Hence logically speaking, the significantly increased level of blood glucose in this study should be an initial signal for stimulating the production of insulin, thereby enhancing glycogen synthesis. However, the glycogen concentration of the liver was found to be decreased, indicating a disturbed glycogen synthesis process and might be regarded as a symbol of the absence of insulin. Therefore, it is plausible to believe that C-dot injection may block the binding of insulin to its receptors by affecting the insulin receptor proteins in the cell membranes, leading to the decreased influx of glucose through cell membranes and eventually causing the breakdown of glycogen.
Besides, the levels of inosine in the liver, kidney and spleen in mice injected with C-dots were increased which could also be attributed to the absence of intracellular insulin. When the normal function of intracellular insulin was disturbed, coinstantaneous reduction of the glycolytic flux happened, which then resulted in an increase of hexose monophosphate flux and the enhancement of the activity of 6-phosphoglucose dehydrogenase,38 afterwards facilitating more precursor metabolites (such as 5-phosphoribose and 5-phosphoribose pyrophosphate) for the synthesis of inosine, thereby increasing inosine production consequently.
A significant increase of lactate in both the liver and spleen in the mice of the C-dot injected groups was observed. As lactate is a product under anaerobic conditions, the increase in lactate is generally assumed to be due to tissue hypoxia39 which will definitely lead to a disturbance in the citric acid cycle, the major energy-yielding process in vivo. However, neither observable abnormality and functional impairment of the liver through histopathology nor the biochemical parameters such as the serum ALT, AST and LDH levels were determined to confirm such deduction. Furthermore, fumarate and succinate, two important intermediates in the citric acid cycle, were not significantly altered in liver tissues, indicating that there was no obvious abnormality in citric acid cycle. All the evidence proved that the elevated lactate content was not caused by tissue hypoxia. As we know, the liver is the major site whose clearance of lactate accounts for approximately 50% of lactate metabolism;40 to protect against acidosis, accumulated lactate in muscles must be transported into the liver and then converted to glucose via gluconeogenesis. When this process is blocked, lactate will be accumulated in the liver which was consistent with our results. Hence, we suspect that C-dots had no severe damaging effects on the liver but affected its clearance ability, and the increased level of lactate in the liver was related to the disturbance of liver clearance, in which the rate of lactate production exceeded the rate of lactate removal.
The levels of isoleucine, leucine, valine, phenylalanine and lysine were significantly decreased in the spleen of the C-dot injected mice, all of which are essential amino acids that cannot be synthesized in vivo and have to be achieved by food intake. In vivo essential amino acids were obtained via the digestion of various proteins and absorbed in the small intestine; afterwards they would be transported through the blood circulation.41 Since the levels of these amino acids were not significantly changed in the serum, we could suggest that the production and absorption of essential amino acids were not disturbed in the C-dot injected mice, and the decrease of which in the spleen may be related to the spleen itself. The spleen is a highly organized secondary lymphoid organ which is responsible for the primary defense against all types of antigens that appear in the circulation; besides, it is also a major site of antibody production.42,43 Antibodies, including serum IgG, IgM, and IgA, were synthesized in the spleen on the basis of various amino acids and were then secreted into the blood. Therefore, it was well-founded to believe that the decrease in leucine, valine, isoleucine, phenylalanine and lysine in the spleen was due to their high utilization in the process of antibody synthesis to defend the stress induced by C-dots. This conclusion was rightly consistent with the result of a previous study: after the injection of PEGylated liposomes, the spleen enhanced its secretion of antibodies to the blood.44
A significant decrease of glutamine in the serum was discovered; in contrast, the levels of glutamine were significantly increased both in the liver and spleen. In the blood, glutamine is the most abundant amino acid which serves as a nontoxic transporter to send ammonia to various sites for utilization, including the liver, kidneys and immune system.45,46 The liver absorbs glutamine from the blood and splits it to NH3 and glutamate. NH3 is the precursor for urinary ammonia production in the urea cycle, and glutamate could be further metabolized to produce other amino acids by transamination. Besides, glutamine could also be utilized directly by the liver to produce glutathione, one crucial antioxidant in vivo. Glutamine is also utilized at high rates by the cells of the immune system, especially when the immune system is challenged, for instance when the immune system is activated, the spleen promotes the usage of glutamine to produce glutathione.47 Hence, it seems that the significantly decreased level of glutamine in serum could be ascribed to the demand for glutamine by the liver and the immune system exceeding the supply.
4.2. Correlation network analysis
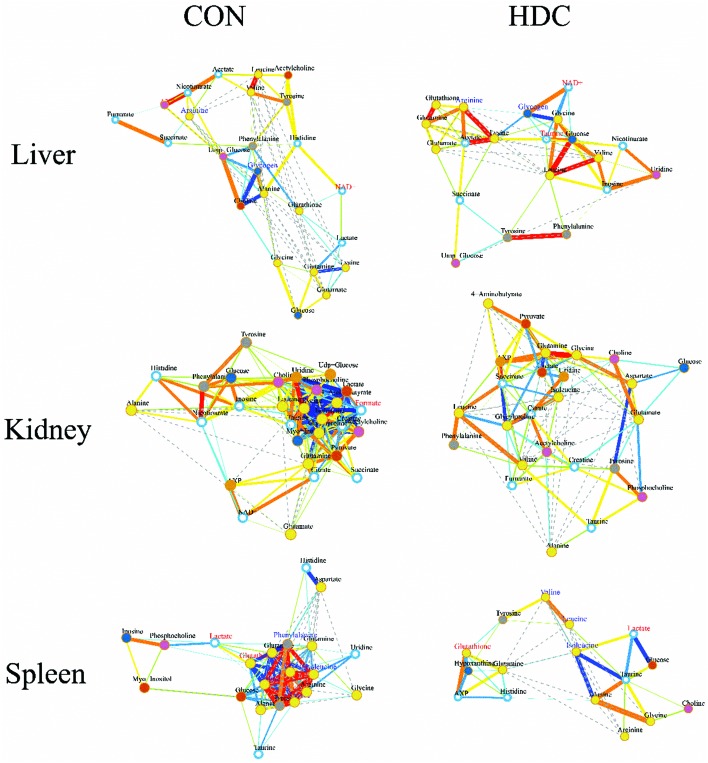
To further investigate the potential changes of the metabolic profile in the liver, kidneys and spleen of the mice injected with C-dots, correlation network analysis was performed (Fig. 6). In the correlation network plots, a slight positive correlation between glutamine and glutathione in the liver of control mice was found to be highly correlated after injecting with C-dots; a similar phenomenon was also observed in the spleen tissue. As glutamine is the more readily available precursor for glutathione synthesis,48 the enhanced correlation between glutamine and glutathione appeared both in the liver and spleen thus confirming the conclusion we stated above: glutamine was largely utilized from serum to the liver and spleen to counteract against the stress induced by C-dots. Beyond that, strong active correlations between several crucial amino acids (phenylalanine, valine, leucine, isoleucine, tyrosine, lysine and arginine) disappeared after the injection of C-dots. In the spleen of the control mice, correlations between these amino acids were enclosed and striking in the whole correlation network which indicated their mutual close linking under well-balanced amino acid metabolism; thus missing such correlations might be a sign of amino acid metabolism disorder in the spleen, and such disturbances should be explained by the speculation that these amino acids were largely utilized for the synthesis of antibodies.
Fig. 6. Metabolic correlation networks for liver, kidney and spleen tissues. Metabolites with coefficients of Pearson correlations above a threshold were connected by solid lines color coded according to the values of the coefficients (warm color represented a positive correlation and cool color a negative one), with the line width scaled based on their absolute values. Names of the metabolites in red and blue colors denoted their significant increases and decreases in HDC group mice versus the control mice, respectively. Dotted lines between metabolites represented their structural similarities.
4.3. SUS analysis
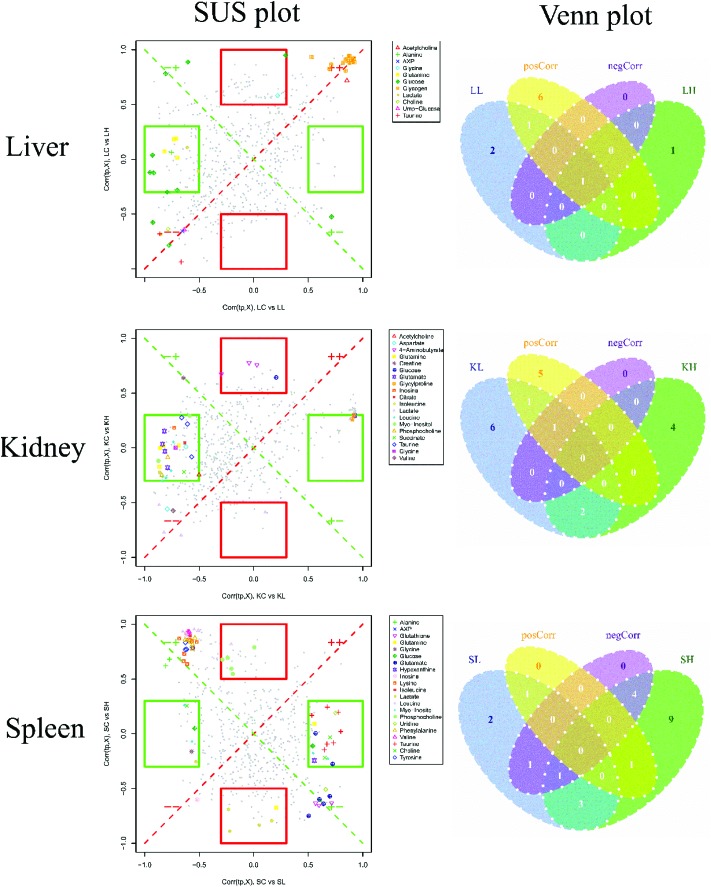
To compare the injection influence of C-dots on mice, a SUS (shared-and-unique structure)-plot (Fig. 7) for the models comparing the CON group with the C-dot treated groups was generated. In the SUS-plot of the spleen, six specific metabolites were found for the LDC group, and four specific metabolites were discovered for the HDC group, reflecting equal metabolic changes in the kidney suffering high dose and low dose injection of C-dots. The same circumstance was also found in the liver, in which one specific metabolite in the HDC group and two specific metabolites in the LDC group were detected. While when it came to the spleen tissue, the case was quite different. In the SUS-plot of the spleen, nine specific metabolites were found in the HDC group while only two were specific in the LDC group, indicating more fierce metabolic changes in the spleen after injecting with a high dosage of C-dots. In addition, no metabolite with negative correlations was found in the liver, kidneys and spleen; this result suggested that the effects of C-dots treatment were in general the same in these tissues but exhibited a dose-dependent tendency in the spleen. These metabolites with positive correlations in the two models were common features of the C-dot injection, which could be regarded as potential biomarkers for the effects of C-dots in vivo.
Fig. 7. SUS-plots and Venn plots for liver, kidneys and spleen tissues. In the SUS-plot between the HDC group and the LDC group, metabolites close to the red diagonal line were equally affected in both groups, while metabolites in the rectangular frame were uniquely affected in one group. The Venn plot helped to visualize metabolites that shared between classes in a positive and negative correlation as well as those belonged uniquely to a specified class.
5. Conclusions
As no obvious toxic effects of C-dots on organs and biochemical parameters were found by classical biochemical approaches, the 1H NMR based metabolomics approach was firstly used in this study to investigate the in vivo potential effects of C-dots. NMR metabolomics combined with the multivariate analysis of NMR profiles disclosed that C-dots induced disorders of metabolism in vivo, which may suggest that C-dots in vivo could damage the function of cell membranes via inducing some toxic effects on cell membrane transport proteins and trigger the immune system. Our findings are highly encouraging, providing substantial evidence of the 1H NMR metabolomics approach as a powerful tool to evaluate the toxicity of C-dots in vivo, and should be helpful for other nanomaterials in their toxicity research and biomedical applications, indicating that the 1H NMR based metabolomics approach provided deep insights into the toxicity of C-dots in vivo, gained an advantage over traditional toxicological means, and helped in understanding its toxicity mechanism. Such analysis pattern could be applied to other nanomaterials concerning their toxicity and biodistribution research.
Conflicts of interest
The authors have no conflicts of interest to declare.
Supplementary Material
Acknowledgments
This research work was funded by the National Natural Science Foundation of China (81773857). We are grateful to Prof. Lan Yi for 1H NMR technical assistance.
Footnotes
†Electronic supplementary information (ESI) available. See DOI: 10.1039/c8tx00049b
References
- Xu X., Ray R., Gu Y., Ploehn H. J., Gearheart L., Raker K., Scrivens W. A. J. Am. Chem. Soc. 2015;126(40):12736–12737. doi: 10.1021/ja040082h. [DOI] [PubMed] [Google Scholar]
- Yang S. T., Wang X., Wang H., Lu F., Luo P. G., Cao L., Meziani M. J., Liu J. H., Liu Y., Chen M. J. Phys. Chem. C. 2009;113(42):18110. doi: 10.1021/jp9085969. [DOI] [PMC free article] [PubMed] [Google Scholar]
- Sheila D., Baker N., Gary D., Baker A. Angew. Chem., Int. Ed. 2010;49(38):6726–6744. doi: 10.1002/anie.200906623. [DOI] [PubMed] [Google Scholar]
- Nandi S., Malishev R., Parambath K. K., Mirsky Y., Kolusheva S., Jelinek R. Chem. Commun. 2014;50(71):10299–10302. doi: 10.1039/c4cc03504f. [DOI] [PubMed] [Google Scholar]
- Jiang K., Sun S., Zhang L., Lu Y., Wu A., Cai C., Lin H. Angew. Chem. 2015;127(18):5450–5453. doi: 10.1002/anie.201501193. [DOI] [PubMed] [Google Scholar]
- Wang Z., Xu C., Lu Y., Chen X., Yuan H., Wei G., Ye G., Chen J. Sens. Actuators, B. 2017;241:1324–1330. [Google Scholar]
- Ray S. C., Saha A., Jana N. R., Sarkar R. J. Phys. Chem. C. 2009;113(43):18546–18551. [Google Scholar]
- Zhao Q. L., Zhang Z. L., Huang B. H., Peng J., Zhang M., Pang D. W. Chem. Commun. 2008;41(41):5116. doi: 10.1039/b812420e. [DOI] [PubMed] [Google Scholar]
- Liu J.-H., Anilkumar P., Cao L., Wang X., Yang S.-T., Luo P. G., Wang H., Lu F., Meziani M. J., Liu Y., Korch K., Sun Y.-P. Nano LIFE. 2010;01(01&02):153–161. [Google Scholar]
- Tao H., Yang K., Ma Z., Wan J., Zhang Y., Kang Z., Liu Z. Small. 2012;8(2):281–290. doi: 10.1002/smll.201101706. [DOI] [PubMed] [Google Scholar]
- Hauck T. S., Anderson R. E., Fischer H. C., Newbigging S., Chan W. C. Small. 2010;6(1):138–144. doi: 10.1002/smll.200900626. [DOI] [PubMed] [Google Scholar]
- Keun H. C., Ebbels T. M., Antti H., Bollard M. E., Beckonert O., Schlotterbeck G., Senn H., Niederhauser U., Holmes E., Lindon J. C. Chem. Res. Toxicol. 2002;15(11):1380. doi: 10.1021/tx0255774. [DOI] [PubMed] [Google Scholar]
- Liu X., Zhang L., You L., Cong M., Zhao J., Wu H., Li C., Liu D., Yu J. Environ. Toxicol. Pharmacol. 2011;31(2):323–332. doi: 10.1016/j.etap.2010.12.003. [DOI] [PubMed] [Google Scholar]
- Shulaev V. Briefings Bioinf. 2006;7(2):128–139. doi: 10.1093/bib/bbl012. [DOI] [PubMed] [Google Scholar]
- West P. R., Weir A. M., Smith A. M., Donley E. L., Cezar G. G. Toxicol. Appl. Pharmacol. 2010;247(1):18–27. doi: 10.1016/j.taap.2010.05.007. [DOI] [PubMed] [Google Scholar]
- Wishart D. S. Trends Food Sci. Technol. 2008;19(9):482–493. [Google Scholar]
- Mcclay J. L., Adkins D. E., Isern N. G., O'Connell T. M., Wooten J. B., Zedler B. K., Dasika M. S., Webb B. T., Webb-Robertson B. J., Pounds J. G. J. Proteome Res. 2010;9(6):3083. doi: 10.1021/pr1000048. [DOI] [PubMed] [Google Scholar]
- Madsen R., Lundstedt T., Trygg J. Anal. Chim. Acta. 2010;659(1):23–33. doi: 10.1016/j.aca.2009.11.042. [DOI] [PubMed] [Google Scholar]
- Lutz N. W. C. R. Chim. 2006;9(3–4):445–451. [Google Scholar]
- Huang X., Zhang F., Zhu L., Choi K. Y., Guo N., Guo J., Tackett K., Anilkumar P., Liu G., Quan Q. ACS Nano. 2013;7(7):5684–5693. doi: 10.1021/nn401911k. [DOI] [PMC free article] [PubMed] [Google Scholar]
- Tao F., Ai X., An G., Yang P., Zhao Y. ACS Nano. 2016;10(4):4410. doi: 10.1021/acsnano.6b00043. [DOI] [PubMed] [Google Scholar]
- Havrdova M., Hola K., Skopalik J., Tomankova K., Petr M., Cepe K., Polakova K., Tucek J., Bourlinos A. B., Zboril R. Carbon. 2016;99:238–248. [Google Scholar]
- Niu W., Zhu R. H., Cosnier S., Zhang X., Shan D. Anal. Chem. 2015;87(21):11150–11156. doi: 10.1021/acs.analchem.5b03358. [DOI] [PubMed] [Google Scholar]
- Dieterle F., Ross A., Götz Schlotterbeck A., Senn H. Anal. Chem. 2006;78(13):4281–4290. doi: 10.1021/ac051632c. [DOI] [PubMed] [Google Scholar]
- Gu H., Pan Z., Xi B., Asiago V., Musselman B., Raftery D. Anal. Chim. Acta. 2011;686(1–2):57. doi: 10.1016/j.aca.2010.11.040. [DOI] [PMC free article] [PubMed] [Google Scholar]
- Xia J., Psychogios N., Young N., Wishart D. S. Nucleic Acids Res. 2009;37(Web Server issue):652–660. doi: 10.1093/nar/gkp356. [DOI] [PMC free article] [PubMed] [Google Scholar]
- Benjamini Y., Hochberg Y. J. R. Stat. Soc. Series B: Stat. Methodol. 1995;57(1):289–300. [Google Scholar]
- O'Malley C. A., Hautamaki R. D., Kelley M., Meyer E. M. Brain Res. 1987;403(2):389–392. doi: 10.1016/0006-8993(87)90082-5. [DOI] [PubMed] [Google Scholar]
- Rath S., Misra B. N. Toxicology. 1981;19(3):239. doi: 10.1016/0300-483x(81)90133-5. [DOI] [PubMed] [Google Scholar]
- Klein J. J. Neural Transm. 2000;107(8–9):1027–1063. doi: 10.1007/s007020070051. [DOI] [PubMed] [Google Scholar]
- Israël M., Dunant Y. Prog. Brain Res. 1993;98(1):219. doi: 10.1016/s0079-6123(08)62403-6. [DOI] [PubMed] [Google Scholar]
- Kaplan C. P., Porter R. K., Brand M. D. FEBS Lett. 1993;321(1):24–26. doi: 10.1016/0014-5793(93)80613-y. [DOI] [PubMed] [Google Scholar]
- Cao L., Wang X., Meziani M. J., Lu F., Wang H., Luo P. G., Lin Y., Harruff B. A., Veca L. M., Murray D. J. Am. Chem. Soc. 2007;129(37):11318–11319. doi: 10.1021/ja073527l. [DOI] [PMC free article] [PubMed] [Google Scholar]
- Sun Y. P., Zhou B., Lin Y., Wang W., Fernando K. A. S., Pathak P., Meziani M. J., Harruff B. A., Wang X., Wang H. J. Am. Chem. Soc. 2006;128(24):7756–7757. doi: 10.1021/ja062677d. [DOI] [PubMed] [Google Scholar]
- Lovrić J., Cho S. J., Winnik F. M., Maysinger D. Chem. Biol. 2005;12(11):1227. doi: 10.1016/j.chembiol.2005.09.008. [DOI] [PubMed] [Google Scholar]
- Klover P. J., Mooney R. A. Int. J. Biochem. Cell Biol. 2004;36(5):753–758. doi: 10.1016/j.biocel.2003.10.002. [DOI] [PubMed] [Google Scholar]
- Saltiel A. R., Kahn C. R. Nature. 2001;414(6865):799–806. doi: 10.1038/414799a. [DOI] [PubMed] [Google Scholar]
- Chen S., Chu J., Zhuang Y., Zhang S. Biotechnol. Lett. 2005;27(10):689–692. doi: 10.1007/s10529-005-4686-1. [DOI] [PubMed] [Google Scholar]
- James J. H., Luchette F. A., Mccarter F. D., Fischer J. E. Lancet. 1999;354(9177):505–508. doi: 10.1016/S0140-6736(98)91132-1. [DOI] [PubMed] [Google Scholar]
- Vail D. M., Ogilvie G. K., Fettman M. J., Wheeler S. L. J. Vet. Intern. Med. 1990;4(5):228–232. doi: 10.1111/j.1939-1676.1990.tb03113.x. [DOI] [PubMed] [Google Scholar]
- Brosnan J. T. J. Nutr. 2003;133(6 Suppl 1):2068S. doi: 10.1093/jn/133.6.2068S. [DOI] [PubMed] [Google Scholar]
- Bohnsack J., Brown E. Annu. Rev. Med. 1986;37(1):49–59. doi: 10.1146/annurev.me.37.020186.000405. [DOI] [PubMed] [Google Scholar]
- Koch G., Lok B. D., Van O. A., Benner R. J. Immunol. 1982;128(4):1497–1501. [PubMed] [Google Scholar]
- Ishida T., Ichihara M., Wang X. Y., Kiwada H. J. Controlled Release. 2006;115(3):243–250. doi: 10.1016/j.jconrel.2006.08.001. [DOI] [PubMed] [Google Scholar]
- Newsholme P., Procopio J., Lima M. M. R., Pithon-Curi T. C., Rui C. Cell Biochem. Funct. 2003;21(1):1–9. doi: 10.1002/cbf.1003. [DOI] [PubMed] [Google Scholar]
- Lacey J. M., Wilmore D. W. Nutr. Rev. 1990;48(8):297–309. doi: 10.1111/j.1753-4887.1990.tb02967.x. [DOI] [PubMed] [Google Scholar]
- Deutz N. E., Reijven P. L., Athanasas G., Soeters P. B. Clin. Sci. 1992;83(5):607–614. doi: 10.1042/cs0830607. [DOI] [PubMed] [Google Scholar]
- Bak L. K., Schousboe A., Waagepetersen H. S. J. Neurochem. 2006;98(3):641–653. doi: 10.1111/j.1471-4159.2006.03913.x. [DOI] [PubMed] [Google Scholar]
Associated Data
This section collects any data citations, data availability statements, or supplementary materials included in this article.


